Embed Size (px)
Citation preview
HAL Id: hal-01007245https://hal.archives-ouvertes.fr/hal-01007245
Submitted on 22 Jan 2017
HAL is a multi-disciplinary open accessarchive for the deposit and dissemination of sci-entific research documents, whether they are pub-lished or not. The documents may come fromteaching and research institutions in France orabroad, or from public or private research centers.
L’archive ouverte pluridisciplinaire HAL, estdestinée au dépôt et à la diffusion de documentsscientifiques de niveau recherche, publiés ou non,émanant des établissements d’enseignement et derecherche français ou étrangers, des laboratoirespublics ou privés.
Distributed under a Creative Commons Attribution| 4.0 International License
Reliability-based analysis and design of strip foundationsagainst bearing capacity failure
Dalia Youssef Abdel Massih, Abdul-Hamid Soubra, Bak Kong Low
To cite this version:Dalia Youssef Abdel Massih, Abdul-Hamid Soubra, Bak Kong Low. Reliability-based analysisand design of strip foundations against bearing capacity failure. Journal of Geotechnical andGeoenvironmental Engineering, American Society of Civil Engineers, 2008, 134 (7), pp.917-928.�10.1061/(ASCE)1090-0241(2008)134:7(917)�. �hal-01007245�

CES
Reliability-Based Analysis and Design of Strip Footingsagainst Bearing Capacity Failure
Dalia S. Youssef Abdel Massih; Abdul-Hamid Soubra; and Bak Kong Low
Abstract: This paper presents a reliability-based approach for the analysis and design of a shallow strip footing subjected to a verticalload with or without pseudostatic seismic loading. Only the punching failure mode of the ultimate limit state is studied. The deterministicmodels are based on the upper-bound method of the limit analysis theory. The random variables used are the soil shear strength parametersand the horizontal seismic coefficient. The Hasofer-Lind reliability index and the failure probability are determined. A sensitivity analysisis also performed. The influence of the applied footing load on the reliability index and the corresponding design point is presented anddiscussed. It was shown that the negative correlation between the soil shear strength parameters highly increases the reliability of thefoundation and that the failure probability is highly influenced by the coefficient of variation of the angle of internal friction of the soil
and the horizontal seismic coefficient. For design, an iterative procedure is performed to determine the breadth of the footing for a target failure probability.E Database subject headings: Bearing capacity; arthquake loads; Limit analysis; Probability; Reliability; hallow foundations; Punching; Failure loads.
Introduction
In the analysis and design of geotechnical structures, all the inputdata have some degree of uncertainty and, thus, may be consid-ered as random variables or stochastic processes. Geotechnicalengineers have always recognized the presence of uncertainty intheir analysis and design. However, traditional deterministic mod-els simplify the problem by considering the uncertain parametersto be deterministic and by accounting for the uncertaintiesthrough the use of a global safety factor, which is essentially a“factor of ignorance.” This factor is derived based on past expe-rience and does not reflect the inherent uncertainty of each pa-rameter. A reliability-based analysis or design is more rational,since it takes into account the inherent uncertainty of each inputvariable. Nowadays, this is possible because of the improvementof our knowledge on the statistical properties of the soil �Phoonand Kulhawy 1999�.
In the last decade, the reliability-based analysis has been ex-tensively applied to the slope stability problem �see, for instance,Christian et al. �1994�; Low and Tang �1997b,c�; Low et al.�1998�; Hassan and Wolff �1999�; El-Ramly et al. �2002�, �2003�;
1
among others�. However, very few authors have investigated thereliability-based analysis and design of foundations. Some �Grif-fiths and Fenton 2001; Fenton and Griffiths 2002, 2003, 2005;Griffiths et al. 2002; Przewlocki 2005; Popescu et al. 2005� mod-eled the uncertain parameters as random processes and examinedthe effect of the spatial variability of these parameters on thesettlement or on the bearing capacity of foundations. Most ofthese studies considered the uncertainty of one single parameter�such as the soil elastic modulus, the cohesion, or the angle ofinternal friction of the soil�. Others modeled the uncertainties ofthe different parameters as random variables and conductedreliability-based analysis using formulas of the bearing capacityfactors �Cherubini 2000; Low and Phoon 2002�. These ap-proaches have the merit of simplicity, but also some shortcomingsbecause they are based on approximate theoretical formulations.
In this study, a reliability-based analysis and design of a stripfoundation resting on a c−� soil is presented. Two performancefunctions may characterize the footing behavior: The serviceabil-ity limit state and the ultimate limit state. Only the punchingfailure mode of the ultimate limit state is analyzed herein. Twoloading cases are considered. The first examines the case of a stripfooting subjected to a vertical load only; the second considers thecase of a vertically loaded strip footing situated in a seismic areaand subjected to a pseudostatic seismic loading. Two rigorousdeterministic limit analysis models are used. The uncertainties ofthe soil shear strength parameters and the seismic coefficient aremodeled as random variables. The basic concepts of the theory ofreliability are described next, followed by the two deterministicmodels, and discussions of the probabilistic numerical results
based on these models.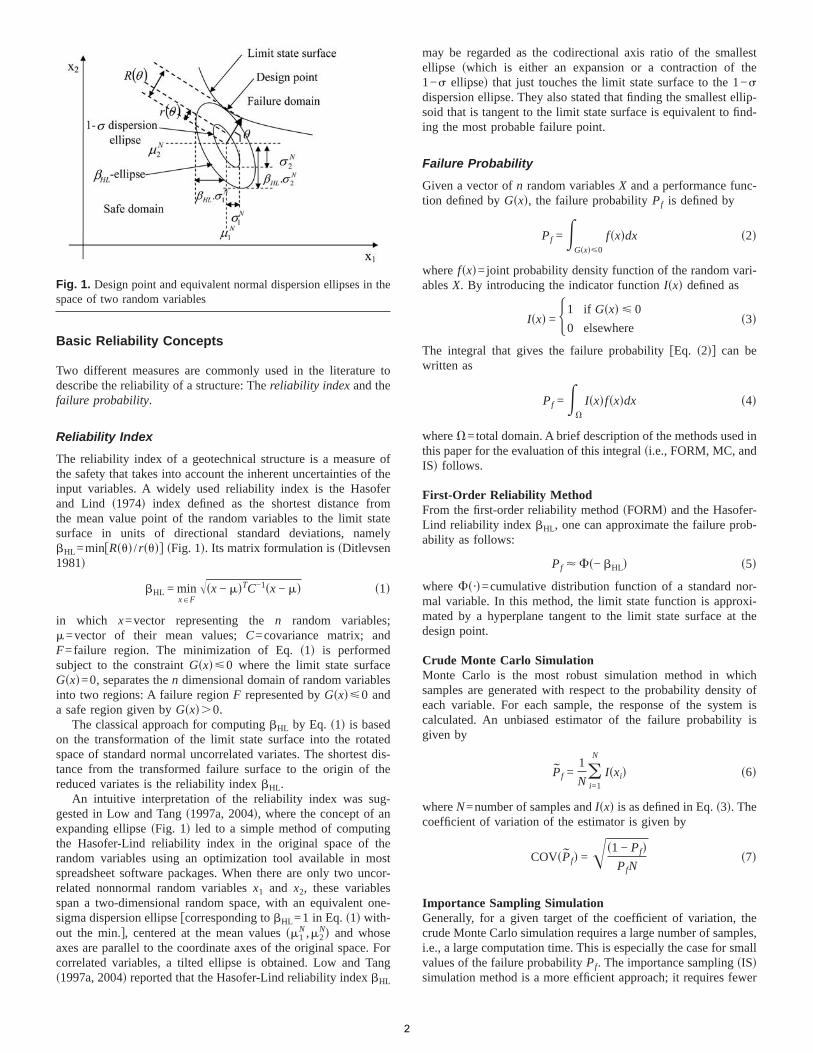
Basic Reliability Concepts
Two different measures are commonly used in the literature todescribe the reliability of a structure: The reliability index and thefailure probability.
Reliability Index
The reliability index of a geotechnical structure is a measure ofthe safety that takes into account the inherent uncertainties of theinput variables. A widely used reliability index is the Hasoferand Lind �1974� index defined as the shortest distance fromthe mean value point of the random variables to the limit statesurface in units of directional standard deviations, namely�HL=min�R��� /r���� �Fig. 1�. Its matrix formulation is �Ditlevsen1981�
�HL = minx�F
��x − ��TC−1�x − �� �1�
in which x=vector representing the n random variables;�=vector of their mean values; C=covariance matrix; andF=failure region. The minimization of Eq. �1� is performedsubject to the constraint G�x��0 where the limit state surfaceG�x�=0, separates the n dimensional domain of random variablesinto two regions: A failure region F represented by G�x��0 anda safe region given by G�x��0.
The classical approach for computing �HL by Eq. �1� is basedon the transformation of the limit state surface into the rotatedspace of standard normal uncorrelated variates. The shortest dis-tance from the transformed failure surface to the origin of thereduced variates is the reliability index �HL.
An intuitive interpretation of the reliability index was sug-gested in Low and Tang �1997a, 2004�, where the concept of anexpanding ellipse �Fig. 1� led to a simple method of computingthe Hasofer-Lind reliability index in the original space of therandom variables using an optimization tool available in mostspreadsheet software packages. When there are only two uncor-related nonnormal random variables x1 and x2, these variablesspan a two-dimensional random space, with an equivalent one-sigma dispersion ellipse �corresponding to �HL=1 in Eq. �1� with-out the min.�, centered at the mean values ��1
N ,�2N� and whose
axes are parallel to the coordinate axes of the original space. Forcorrelated variables, a tilted ellipse is obtained. Low and Tang
Fig. 1. Design point and equivalent normal dispersion ellipses in thespace of two random variables
�1997a, 2004� reported that the Hasofer-Lind reliability index �HL
2
may be regarded as the codirectional axis ratio of the smallestellipse �which is either an expansion or a contraction of the1−� ellipse� that just touches the limit state surface to the 1−�dispersion ellipse. They also stated that finding the smallest ellip-soid that is tangent to the limit state surface is equivalent to find-ing the most probable failure point.
Failure Probability
Given a vector of n random variables X and a performance func-tion defined by G�x�, the failure probability Pf is defined by
Pf =�G�x��0
f�x�dx �2�
where f�x�=joint probability density function of the random vari-ables X. By introducing the indicator function I�x� defined as
I�x� = �1 if G�x� � 0
0 elsewhere� �3�
The integral that gives the failure probability �Eq. �2�� can bewritten as
Pf =��
I�x�f�x�dx �4�
where �=total domain. A brief description of the methods used inthis paper for the evaluation of this integral �i.e., FORM, MC, andIS� follows.
First-Order Reliability MethodFrom the first-order reliability method �FORM� and the Hasofer-Lind reliability index �HL, one can approximate the failure prob-ability as follows:
Pf �− �HL� �5�
where �·�=cumulative distribution function of a standard nor-mal variable. In this method, the limit state function is approxi-mated by a hyperplane tangent to the limit state surface at thedesign point.
Crude Monte Carlo SimulationMonte Carlo is the most robust simulation method in whichsamples are generated with respect to the probability density ofeach variable. For each sample, the response of the system iscalculated. An unbiased estimator of the failure probability isgiven by
P̃f =1
Ni=1
N
I�xi� �6�
where N=number of samples and I�x� is as defined in Eq. �3�. Thecoefficient of variation of the estimator is given by
COV�P̃f� =��1 − Pf�PfN
�7�
Importance Sampling SimulationGenerally, for a given target of the coefficient of variation, thecrude Monte Carlo simulation requires a large number of samples,i.e., a large computation time. This is especially the case for smallvalues of the failure probability Pf. The importance sampling �IS�
simulation method is a more efficient approach; it requires fewer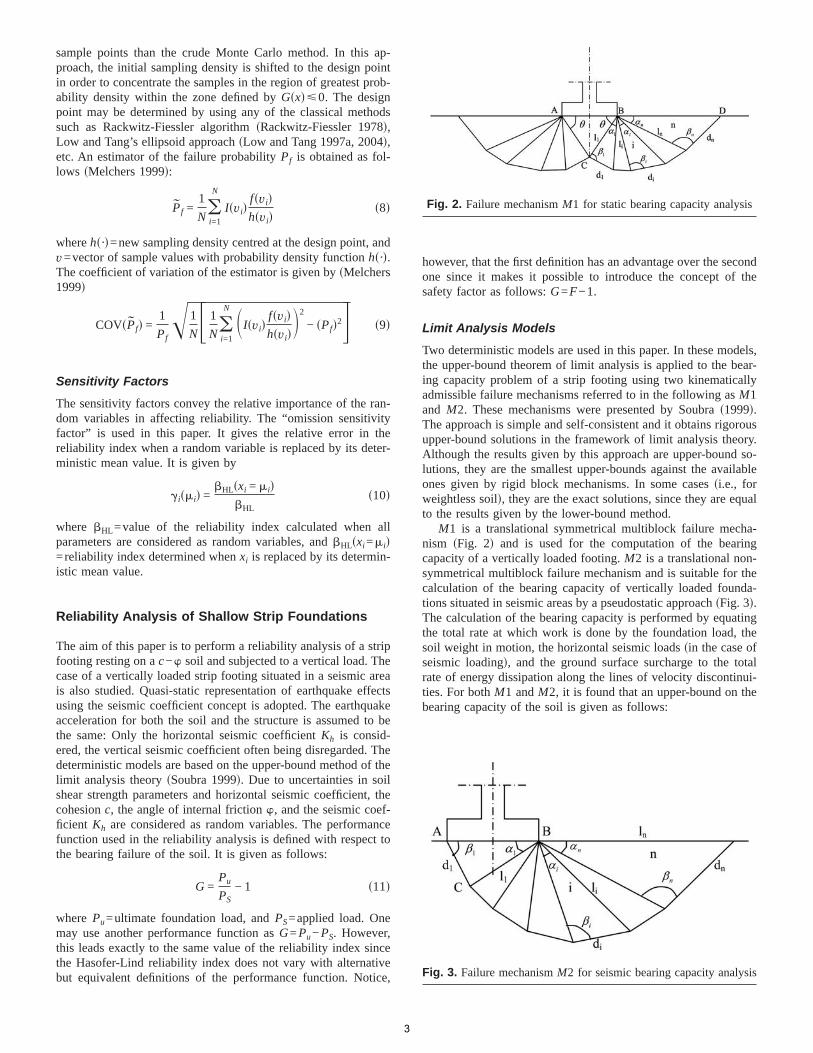
sample points than the crude Monte Carlo method. In this ap-proach, the initial sampling density is shifted to the design pointin order to concentrate the samples in the region of greatest prob-ability density within the zone defined by G�x��0. The designpoint may be determined by using any of the classical methodssuch as Rackwitz-Fiessler algorithm �Rackwitz-Fiessler 1978�,Low and Tang’s ellipsoid approach �Low and Tang 1997a, 2004�,etc. An estimator of the failure probability Pf is obtained as fol-lows �Melchers 1999�:
P̃f =1
Ni=1
N
I�vi�f�vi�h�vi�
�8�
where h�·�=new sampling density centred at the design point, andv=vector of sample values with probability density function h�·�.The coefficient of variation of the estimator is given by �Melchers1999�
COV�P̃f� =1
Pf� 1
N� 1
Ni=1
N �I�vi�f�vi�h�vi�
2
− �Pf�2� �9�
Sensitivity Factors
The sensitivity factors convey the relative importance of the ran-dom variables in affecting reliability. The “omission sensitivityfactor” is used in this paper. It gives the relative error in thereliability index when a random variable is replaced by its deter-ministic mean value. It is given by
i��i� =�HL�xi = �i�
�HL�10�
where �HL=value of the reliability index calculated when allparameters are considered as random variables, and �HL�xi=�i�=reliability index determined when xi is replaced by its determin-istic mean value.
Reliability Analysis of Shallow Strip Foundations
The aim of this paper is to perform a reliability analysis of a stripfooting resting on a c−� soil and subjected to a vertical load. Thecase of a vertically loaded strip footing situated in a seismic areais also studied. Quasi-static representation of earthquake effectsusing the seismic coefficient concept is adopted. The earthquakeacceleration for both the soil and the structure is assumed to bethe same: Only the horizontal seismic coefficient Kh is consid-ered, the vertical seismic coefficient often being disregarded. Thedeterministic models are based on the upper-bound method of thelimit analysis theory �Soubra 1999�. Due to uncertainties in soilshear strength parameters and horizontal seismic coefficient, thecohesion c, the angle of internal friction �, and the seismic coef-ficient Kh are considered as random variables. The performancefunction used in the reliability analysis is defined with respect tothe bearing failure of the soil. It is given as follows:
G =Pu
PS− 1 �11�
where Pu=ultimate foundation load, and PS=applied load. Onemay use another performance function as G= Pu− PS. However,this leads exactly to the same value of the reliability index sincethe Hasofer-Lind reliability index does not vary with alternative
but equivalent definitions of the performance function. Notice,3
however, that the first definition has an advantage over the secondone since it makes it possible to introduce the concept of thesafety factor as follows: G=F−1.
Limit Analysis Models
Two deterministic models are used in this paper. In these models,the upper-bound theorem of limit analysis is applied to the bear-ing capacity problem of a strip footing using two kinematicallyadmissible failure mechanisms referred to in the following as M1and M2. These mechanisms were presented by Soubra �1999�.The approach is simple and self-consistent and it obtains rigorousupper-bound solutions in the framework of limit analysis theory.Although the results given by this approach are upper-bound so-lutions, they are the smallest upper-bounds against the availableones given by rigid block mechanisms. In some cases �i.e., forweightless soil�, they are the exact solutions, since they are equalto the results given by the lower-bound method.
M1 is a translational symmetrical multiblock failure mecha-nism �Fig. 2� and is used for the computation of the bearingcapacity of a vertically loaded footing. M2 is a translational non-symmetrical multiblock failure mechanism and is suitable for thecalculation of the bearing capacity of vertically loaded founda-tions situated in seismic areas by a pseudostatic approach �Fig. 3�.The calculation of the bearing capacity is performed by equatingthe total rate at which work is done by the foundation load, thesoil weight in motion, the horizontal seismic loads �in the case ofseismic loading�, and the ground surface surcharge to the totalrate of energy dissipation along the lines of velocity discontinui-ties. For both M1 and M2, it is found that an upper-bound on thebearing capacity of the soil is given as follows:
Fig. 2. Failure mechanism M1 for static bearing capacity analysis
Fig. 3. Failure mechanism M2 for seismic bearing capacity analysis

Pu =1
2B2N + qBNq + cBNc �12�
in which the bearing capacity factors N, Nq, and Nc can be ex-pressed in terms of the geometrical parameters of each mecha-nism. For the M1 mechanism, these factors are given as follows:
N = − �f1 + f2� �13�
Nq = − f3 �14�
Nc = 2�f4 + f5 + f6� �15�
where the expressions of f i�i=1, . . . ,6� are given in Appendix I.For the M2 mechanism, the bearing capacity factors are given by
N = −1
sin��1 − �� + Kh cos��1 − ���g1 + Khg2� �16�
Nq = −1
sin��1 − �� + Kh cos��1 − ���g3 + Khg4� �17�
Nc =1
sin��1 − �� + Kh cos��1 − ���g5 + g6� �18�
where the expressions of gi�i=1, . . . ,6� are given in Appendix II.The ultimate load of the foundation is obtained by minimizationof Eq. �12� with regard to the mechanism’s geometrical param-eters. For further details on the failure mechanisms, the reader canrefer to Soubra �1999�.
Ellipsoid Approach via Spreadsheet
Low and Tang �1997a, 2004� showed that the minimization of theHasofer-Lind reliability index can be efficiently carried out in theExcel spreadsheet environment. The spreadsheet approach issimple and easy to understand because it works in the originalspace of random variables and does not require the additional stepof transforming x to u where u is a transformed vector of therandom variables in the uncorrelated Gaussian space. However,the optimization in original space is not preferred from a compu-tational perspective �STRUREL 1991�. This is because optimiza-tion in standardized space is mathematically more desirable innonlinear optimization. For example, when minimizing the qua-dratic form of Eq. �1� in the original space, in some cases thecorrect solution is obtained only when the solver option “useautomatic scaling” is activated. As an alternative, Cholesky fac-torization of the convariance matrix can be used. The robustnessof the latter approach is investigated in Phoon �2004�.
When the random variables are nonnormal, the Rackwitz-Fiessler equivalent normal transformation was used to computethe equivalent normal mean �x
N and the equivalent normal stan-dard deviation �x
N. The iterative computations of �xN and �x
N foreach trial design point are automatic during the constrained opti-mization search.
In the present paper, by the Low and Tang method, one liter-ally sets up a tilted ellipsoid in the Excel spreadsheet and mini-mizes the dispersion ellipsoid subject to the constraint that it betangent to the limit state surface using the Excel Solver with theautomatic scaling option. Eq. �1� may be rewritten as �Low and
Tang 1997c, 2004�4
�HL = minx�F
�� x − �xN
�xN �T
�R�−1� x − �xN
�xN � �19�
in which �R�−1=inverse of the correlation matrix. This equationwill be used �instead of Eq. �1�� since the correlation matrix �R�displays the correlation structure more explicitly than the covari-ance matrix �C�.
Additional information on Solver’s options and algorithmscan be found in the Microsoft Excel Solver’s help file and atwww.solver.com. The FORM implementation procedure in thespreadsheet is described in Low �2005� and Low and Tang�1997a,b,c, 2004�. Some Excel files are available at http://alum.mit.edu/www/bklow.
Probabilistic Numerical Results
For both M1 and M2 failure mechanisms, the numerical resultspresented in this paper consider the case of a shallow strip foun-dation with breadth B=2m. The soil has a unit weight of18 kN /m3. No surcharge loading �q=0� is considered in theanalysis. Different values of the coefficients of variation of theangle of internal friction and cohesion are presented in the litera-ture. For most soils, the mean value of the effective angle ofinternal friction is typically between 20 and 40°. Within thisrange, the corresponding coefficient of variation as proposed byPhoon and Kulhawy �1999� is essentially between 5 and 15%. Forthe effective cohesion, the coefficient of variation varies between10 and 70% �Cherubini 2000�. For the coefficient of correlation,Harr �1987� has shown that a correlation exists between the ef-fective cohesion c and the effective angle of internal friction �.The results of Wolff �1985� ��c,�=−0.47�, Yuceman et al. �1973��−0.49��c,��−0.24�, Lumb �1970� �−0.7��c,��−0.37�, andCherubini �2000� ��c,�=−0.61� are among the ones cited in theliterature. In this paper, the illustrative values used for the statis-tical moments of the shear strength parameters and their coeffi-cient of correlation �c,� are as follows: �c=20 kPa, ��=30°,COVc=20%, COV�=10%, and �c,�=−0.5. These values arewithin the range of the values cited above.
Mechanism M1
For the configuration presented above, the ultimate footing loaddetermined for the mean values of the soil shear strength param-eters is Pu=2,136.72 kN /m. For the probability distribution ofthe random variables, two cases are studied. In the first case,referred to as normal variables, c and � are considered as normalvariables. In the second case, referred to as nonnormal variables,c is assumed to be lognormally distributed while � is assumed tobe bounded and a beta distribution is used �Fenton and Griffiths2003�. The parameters of the beta distribution are determinedfrom the mean value and standard deviation of � �Haldar andMahadevan 2000�. For both cases, correlated or uncorrelated vari-ables are considered.
Probabilistic Failure SurfaceThe conventional deterministic approach for the calculation of asafety factor or an ultimate load on a soil mass is based on theminimization of these functions over a range of trial failure sur-faces. The surface of minimum factor of safety or ultimate load isreferred to as the critical deterministic surface. A common ap-
proach to determine the reliability of a stressed soil mass is based
on the calculation of the reliability index �HL corresponding tothis surface �Christian et al. 1994�. In this paper, a more rigorousapproach is used. It consists of the determination of the reliabilityindex by minimizing the quadratic form of Eq. �19� not only withrespect to the random variables, but also with respect to the geo-metrical parameters of the failure mechanism �� ,�i ,�i�. Twelverigid blocks �i.e., n=12 in Fig. 2� are considered for each side ofthe footing. Therefore, the minimization is performed with respectto 27 parameters �� ,�i ,�i ,c ,��. The surface obtained corre-sponding to the minimum reliability index is referred to here asthe critical probabilistic surface. The reliability index calculatedwith respect to the critical probabilistic surface is smaller �i.e.,more critical� than the one calculated by using the critical deter-ministic surface. Had one considered the deterministic criticalsurface, a slightly higher reliability index value of 3.49 wouldhave been obtained instead of 3.27 for the case with normal un-correlated soil shear strength parameters. In all subsequent re-sults, for both the M1 and M2 mechanisms, the reliability index iscalculated using the probabilistic failure surface.
Reliability Index and Sensitivity FactorsTable 1 presents the Hasofer-Lind reliability index and the corre-sponding design point for different values of the vertical appliedload PS varying from small values up to the deterministic ultimateload. This ultimate load is the one for which the design point isequal to the mean point for normal variables and equivalent nor-mal mean point for nonnormal variables. The table also gives theomission sensitivity factors of the angle of internal friction andthe cohesion. All these results are presented for normal and non-normal, correlated and uncorrelated shear strength parameters.For all cases, the reliability index decreases with the increase ofthe applied load PS �i.e., with the decrease of the safety factorF= Pu / PS� until it vanishes for an applied load equal to the deter-ministic ultimate load. This case corresponds to a deterministicstate of failure for which F=1 using the mean values of the ran-dom variables and the failure probability is equal to 50%.
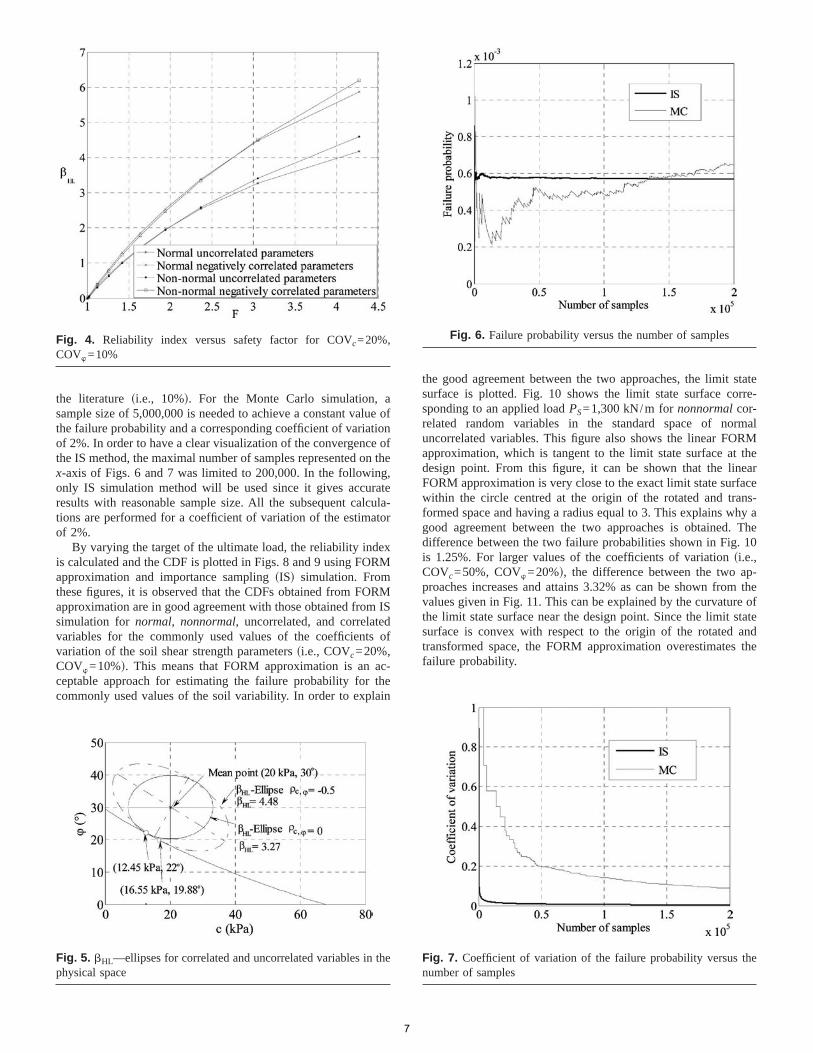
The comparison of the results of correlated variables withthose of uncorrelated variables �Fig. 4� shows that the reliabilityindices corresponding to uncorrelated variables are smaller thanthose of negatively correlated variables for both normal and non-normal variables. One can conclude that assuming uncorrelatedshear strength parameters is conservative in comparison to assum-ing negatively correlated shear strength parameters. For instance,when the safety factor is equal to 4.27 �i.e., PS=500 kN /m�, thereliability index increases by 40% if the variables c and � areconsidered to be negatively correlated. Fig. 4 also shows that forsmall values of the safety factor, the results of normal and non-normal variables are nearly identical. A difference appears forlarge values of the safety factor.
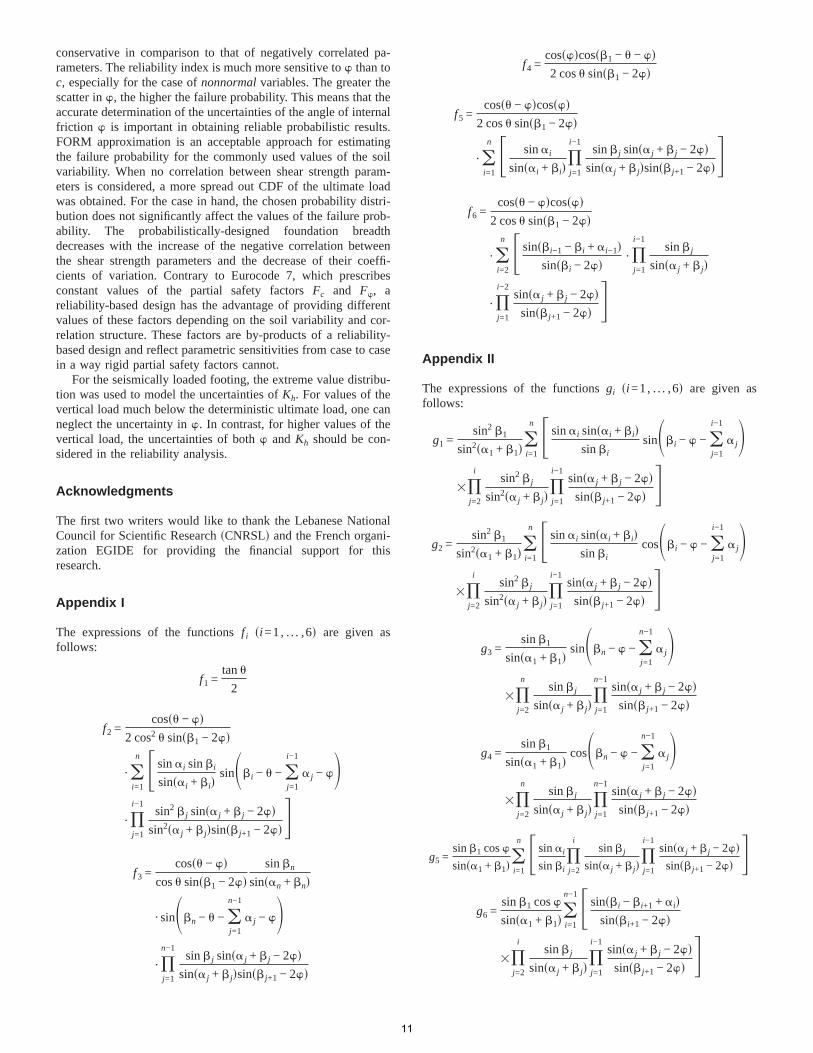
From Table 1, when PS=700 kN /m, the most probable failurepoint for uncorrelated and correlated normal variables is found tobe at �c*=12.45 kPa, �*=22°� and �c*=16.55 kPa, �*=19.88°�,respectively. These are the points of tangency of the �HL−� el-lipses with the limit state surface. Notice that the limit state sur-face divides the combinations of �c ,�� that would lead to failurefrom the combinations that would not. The �c ,�� values definingthe limit state surface are obtained by searching c �or �� for aprescribed � �or c� that achieve both the conditions �i� a minimumultimate load Pu and �ii� a safety factor F= Pu / PS=1. For thispurpose, a numerical procedure was coded in Microsoft ExcelVisual Basic. It calls the Excel Solver iteratively in order to si-multaneously satisfy the two conditions above. Fig. 5 provides
graphical representation of the reliability analysis for both corre-5
lated and uncorrelated shear strength parameters in the physicalspace of the random variables. One can easily see that negativecorrelation between shear strength parameters rotates the majoraxis of the ellipse from the horizontal direction.
The values �c* and �*� of the design points corresponding todifferent values of the vertical applied load can give an idea aboutthe partial safety factors of each of the strength parameters c andtan � as follows:
Fc =�c
c*�20�
F� =tan����tan �*
�21�
For uncorrelated shear strength parameters, the values of c* and�* at the design point are smaller than their respective meanvalues and increase with the increase of the applied load. Fornegatively correlated shear strength parameters, c* slightly ex-ceeds the mean for some values of the applied load.
The values of the omission sensitivity factors have shown thatthe effect of the randomness of the angle of internal friction onthe reliability index is much more pronounced than that of thecohesion, especially for the case of nonnormal random variables.
Failure ProbabilityFigs. 6 and 7 present, respectively, the failure probability and thecorresponding coefficient of variation as a function of the numberof samples for both MC and IS simulations when the soil shearstrength parameters are normal and uncorrelated and the footingapplied load is equal to 700 kN /m. In this paper, MC and ISsimulations were performed in the standardized space of uncorre-lated variables. Hence, only uncorrelated normal random vari-ables have been generated. For nonnormal and correlatedvariables, the limit state surface, which is determined point bypoint as explained in the previous section, is transformed to thestandardized space of uncorrelated normal variables using theequivalent normal transformation �i.e., the Rackwitz-Fiesslerequations� for each couple of �c ,��. The two equations used forthe transformation of each �c ,�� of the limit state surface fromthe physical space to the standarized normal uncorrelated space�u1 ,u2� are �Lemaire 2005�
u1 = � c − �cN
�cN �22�
u2 =1
�1 − �2��� − ��N
��N − �� c − �c
N
�cN � �23�
where �=coefficient of correlation of c and �; and �cN, ��
N, �cN,
and ��N=respectively, the equivalent normal means and standard
deviations of the random variables c and �. They are determinedfrom the translation approach using the following equations:
c − �cN
�cN = −1�Fc�c�� �24�
� − ��N
��N = −1�F����� �25�
where Fc and F�=non-Gaussian cumulative distribution functionsof c and �; and −1�·�=inverse of the standard normal cumulativedistribution. If desired, the original correlation matrix ��ij� of the
nonnormals can be modified to �ij� in line with the equivalent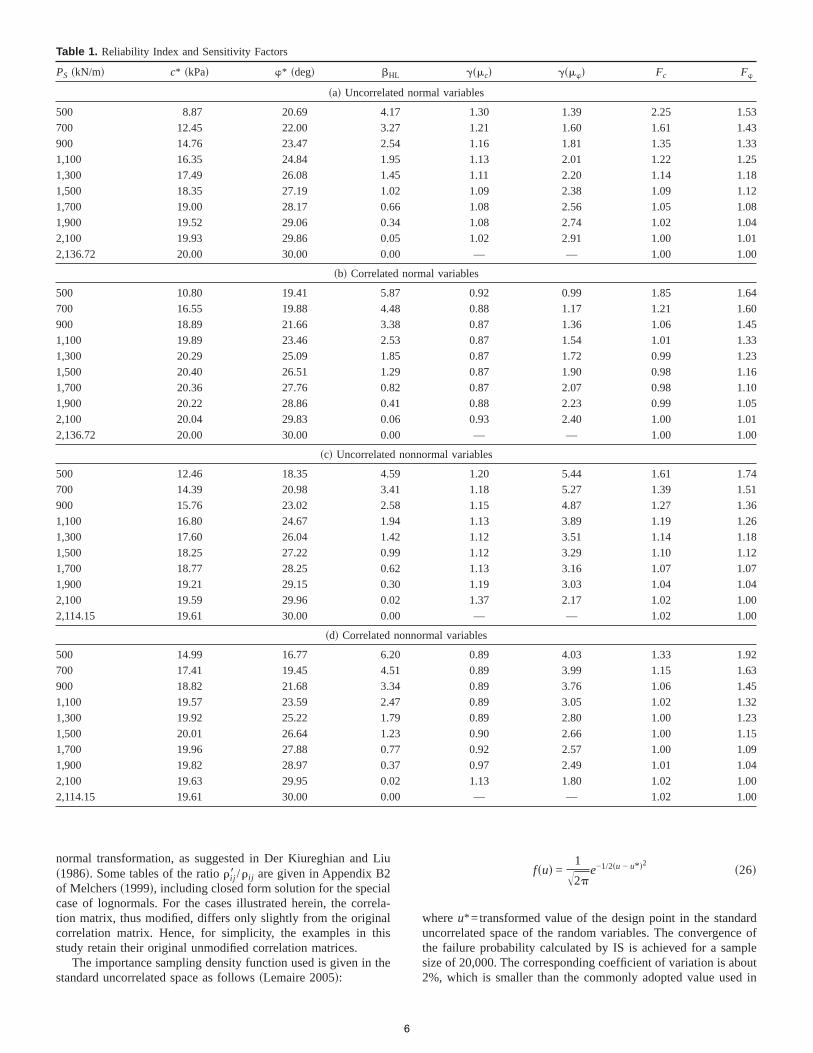
normal transformation, as suggested in Der Kiureghian and Liu�1986�. Some tables of the ratio �ij� /�ij are given in Appendix B2of Melchers �1999�, including closed form solution for the specialcase of lognormals. For the cases illustrated herein, the correla-tion matrix, thus modified, differs only slightly from the originalcorrelation matrix. Hence, for simplicity, the examples in thisstudy retain their original unmodified correlation matrices.
The importance sampling density function used is given in the
Table 1. Reliability Index and Sensitivity Factors
PS �kN/m� c* �kPa� �* �deg� �H
�a� Uncorrelat
500 8.87 20.69 4.1
700 12.45 22.00 3.2
900 14.76 23.47 2.5
1,100 16.35 24.84 1.9
1,300 17.49 26.08 1.4
1,500 18.35 27.19 1.0
1,700 19.00 28.17 0.6
1,900 19.52 29.06 0.3
2,100 19.93 29.86 0.0
2,136.72 20.00 30.00 0.0
�b� Correlate
500 10.80 19.41 5.8
700 16.55 19.88 4.4
900 18.89 21.66 3.3
1,100 19.89 23.46 2.5
1,300 20.29 25.09 1.8
1,500 20.40 26.51 1.2
1,700 20.36 27.76 0.8
1,900 20.22 28.86 0.4
2,100 20.04 29.83 0.0
2,136.72 20.00 30.00 0.0
�c� Uncorrelated
500 12.46 18.35 4.5
700 14.39 20.98 3.4
900 15.76 23.02 2.5
1,100 16.80 24.67 1.9
1,300 17.60 26.04 1.4
1,500 18.25 27.22 0.9
1,700 18.77 28.25 0.6
1,900 19.21 29.15 0.3
2,100 19.59 29.96 0.0
2,114.15 19.61 30.00 0.0
�d� Correlated
500 14.99 16.77 6.2
700 17.41 19.45 4.5
900 18.82 21.68 3.3
1,100 19.57 23.59 2.4
1,300 19.92 25.22 1.7
1,500 20.01 26.64 1.2
1,700 19.96 27.88 0.7
1,900 19.82 28.97 0.3
2,100 19.63 29.95 0.0
2,114.15 19.61 30.00 0.0
standard uncorrelated space as follows �Lemaire 2005�:
6
f�u� =1
�2 e−1/2�u − u*�2 �26�
where u*=transformed value of the design point in the standarduncorrelated space of the random variables. The convergence ofthe failure probability calculated by IS is achieved for a samplesize of 20,000. The corresponding coefficient of variation is about
��c� ���� Fc F�
mal variables
1.30 1.39 2.25 1.53
1.21 1.60 1.61 1.43
1.16 1.81 1.35 1.33
1.13 2.01 1.22 1.25
1.11 2.20 1.14 1.18
1.09 2.38 1.09 1.12
1.08 2.56 1.05 1.08
1.08 2.74 1.02 1.04
1.02 2.91 1.00 1.01
— — 1.00 1.00
al variables
0.92 0.99 1.85 1.64
0.88 1.17 1.21 1.60
0.87 1.36 1.06 1.45
0.87 1.54 1.01 1.33
0.87 1.72 0.99 1.23
0.87 1.90 0.98 1.16
0.87 2.07 0.98 1.10
0.88 2.23 0.99 1.05
0.93 2.40 1.00 1.01
— — 1.00 1.00
ormal variables
1.20 5.44 1.61 1.74
1.18 5.27 1.39 1.51
1.15 4.87 1.27 1.36
1.13 3.89 1.19 1.26
1.12 3.51 1.14 1.18
1.12 3.29 1.10 1.12
1.13 3.16 1.07 1.07
1.19 3.03 1.04 1.04
1.37 2.17 1.02 1.00
— — 1.02 1.00
rmal variables
0.89 4.03 1.33 1.92
0.89 3.99 1.15 1.63
0.89 3.76 1.06 1.45
0.89 3.05 1.02 1.32
0.89 2.80 1.00 1.23
0.90 2.66 1.00 1.15
0.92 2.57 1.00 1.09
0.97 2.49 1.01 1.04
1.13 1.80 1.02 1.00
— — 1.02 1.00
L
ed nor
7
7
4
5
5
2
6
4
5
0
d norm
7
8
8
3
5
9
2
1
6
0
nonn
9
1
8
4
2
9
2
0
2
0
nonno
0
1
4
7
9
3
7
7
2
0
2%, which is smaller than the commonly adopted value used in
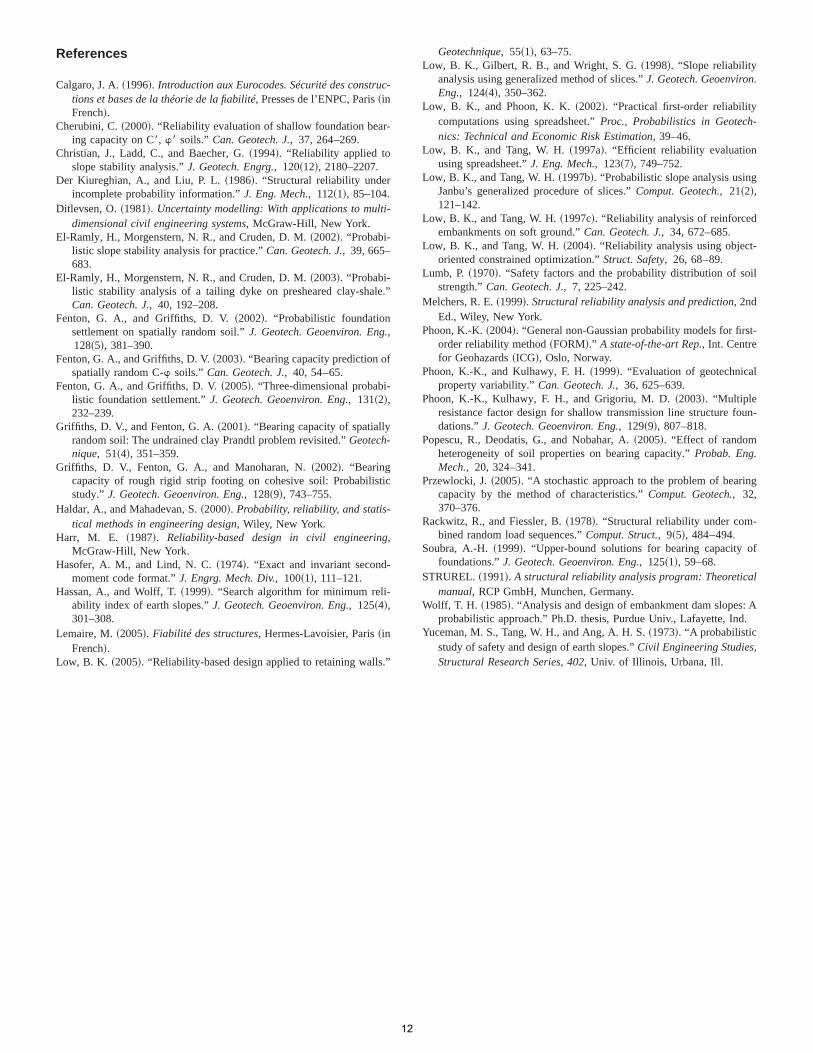
the literature �i.e., 10%�. For the Monte Carlo simulation, asample size of 5,000,000 is needed to achieve a constant value ofthe failure probability and a corresponding coefficient of variationof 2%. In order to have a clear visualization of the convergence ofthe IS method, the maximal number of samples represented on thex-axis of Figs. 6 and 7 was limited to 200,000. In the following,only IS simulation method will be used since it gives accurateresults with reasonable sample size. All the subsequent calcula-tions are performed for a coefficient of variation of the estimatorof 2%.
By varying the target of the ultimate load, the reliability indexis calculated and the CDF is plotted in Figs. 8 and 9 using FORMapproximation and importance sampling �IS� simulation. Fromthese figures, it is observed that the CDFs obtained from FORMapproximation are in good agreement with those obtained from ISsimulation for normal, nonnormal, uncorrelated, and correlatedvariables for the commonly used values of the coefficients ofvariation of the soil shear strength parameters �i.e., COVc=20%,COV�=10%�. This means that FORM approximation is an ac-ceptable approach for estimating the failure probability for thecommonly used values of the soil variability. In order to explain
Fig. 4. Reliability index versus safety factor for COVc=20%,COV�=10%
Fig. 5. �HL—ellipses for correlated and uncorrelated variables in thephysical space
7
the good agreement between the two approaches, the limit statesurface is plotted. Fig. 10 shows the limit state surface corre-sponding to an applied load PS=1,300 kN /m for nonnormal cor-related random variables in the standard space of normaluncorrelated variables. This figure also shows the linear FORMapproximation, which is tangent to the limit state surface at thedesign point. From this figure, it can be shown that the linearFORM approximation is very close to the exact limit state surfacewithin the circle centred at the origin of the rotated and trans-formed space and having a radius equal to 3. This explains why agood agreement between the two approaches is obtained. Thedifference between the two failure probabilities shown in Fig. 10is 1.25%. For larger values of the coefficients of variation �i.e.,COVc=50%, COV�=20%�, the difference between the two ap-proaches increases and attains 3.32% as can be shown from thevalues given in Fig. 11. This can be explained by the curvature ofthe limit state surface near the design point. Since the limit statesurface is convex with respect to the origin of the rotated andtransformed space, the FORM approximation overestimates thefailure probability.
Fig. 6. Failure probability versus the number of samples
Fig. 7. Coefficient of variation of the failure probability versus thenumber of samples
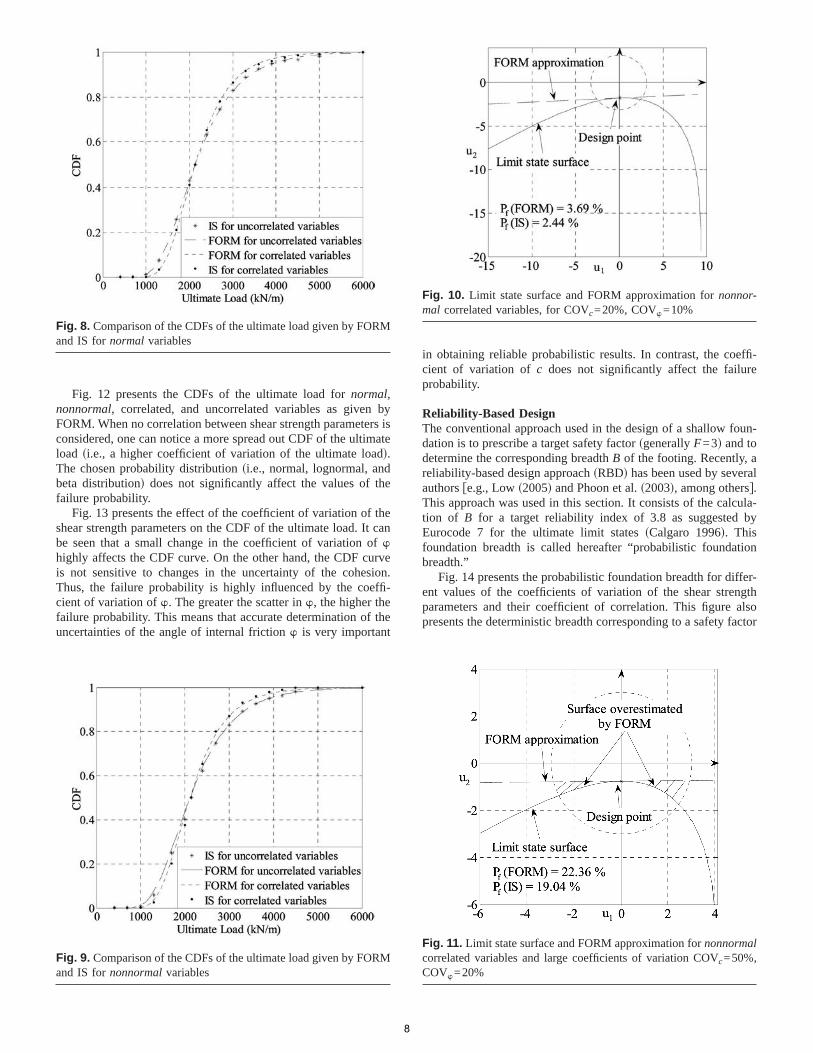
Fig. 12 presents the CDFs of the ultimate load for normal,nonnormal, correlated, and uncorrelated variables as given byFORM. When no correlation between shear strength parameters isconsidered, one can notice a more spread out CDF of the ultimateload �i.e., a higher coefficient of variation of the ultimate load�.The chosen probability distribution �i.e., normal, lognormal, andbeta distribution� does not significantly affect the values of thefailure probability.
Fig. 13 presents the effect of the coefficient of variation of theshear strength parameters on the CDF of the ultimate load. It canbe seen that a small change in the coefficient of variation of �highly affects the CDF curve. On the other hand, the CDF curveis not sensitive to changes in the uncertainty of the cohesion.Thus, the failure probability is highly influenced by the coeffi-cient of variation of �. The greater the scatter in �, the higher thefailure probability. This means that accurate determination of theuncertainties of the angle of internal friction � is very important
Fig. 8. Comparison of the CDFs of the ultimate load given by FORMand IS for normal variables
Fig. 9. Comparison of the CDFs of the ultimate load given by FORMand IS for nonnormal variables
8
in obtaining reliable probabilistic results. In contrast, the coeffi-cient of variation of c does not significantly affect the failureprobability.
Reliability-Based DesignThe conventional approach used in the design of a shallow foun-dation is to prescribe a target safety factor �generally F=3� and todetermine the corresponding breadth B of the footing. Recently, areliability-based design approach �RBD� has been used by severalauthors �e.g., Low �2005� and Phoon et al. �2003�, among others�.This approach was used in this section. It consists of the calcula-tion of B for a target reliability index of 3.8 as suggested byEurocode 7 for the ultimate limit states �Calgaro 1996�. Thisfoundation breadth is called hereafter “probabilistic foundationbreadth.”
Fig. 14 presents the probabilistic foundation breadth for differ-ent values of the coefficients of variation of the shear strengthparameters and their coefficient of correlation. This figure alsopresents the deterministic breadth corresponding to a safety factor
Fig. 10. Limit state surface and FORM approximation for nonnor-mal correlated variables, for COVc=20%, COV�=10%
Fig. 11. Limit state surface and FORM approximation for nonnormalcorrelated variables and large coefficients of variation COVc=50%,COV�=20%

of 3. The probabilistic foundation breadth decreases with the in-crease of the negative correlation between the shear strength pa-rameters and the decrease of their coefficients of variation. It canbecome smaller than the deterministic breadth for the commonvalues of the soil variability �i.e., COV�=10%, COVc=20%,−0.7��c,��−0.3�. For high values of the coefficients of varia-tion and small correlation coefficient, the design breadth for nor-mal variables is higher than that of nonnormal variables. Thismeans that, for the case in hand, assuming normal distributionsfor the random variables is more conservative than assuming non-normal distributions. As a conclusion, the deterministic footingbreadth may be higher or lower than the reliability-based footingwidth, depending on the uncertainties.
Contrary to Eurocode 7, which prescribes constant values ofthe partial safety factors Fc and F�, the present RBD has theadvantage of providing different values of these factors dependingon the soil variability. These factors are the optimal ones and aredetermined rigorously by a maximization of the failure probabil-ity for a given soil variability. Hence, a reliability-based designhas the merit of explicitly reflecting the correlation structure, the
Fig. 12. Comparison of the CDFs of the ultimate load for normal,nonnormal, correlated, and uncorrelated variables
Fig. 13. Comparison of CDFs of the ultimate load for different valuesof the coefficients of variation
9
standard deviations, and the probability distributions of theunderlying random variables, and of automatically seeking thedesign point without relying on prescribed values of partial safetyfactors.
Mechanism M2
The number of rigid blocks used in the M2 mechanism �Fig. 3� isequal to 12 since further increase in the number of blocks im-proves the optimal solution by less than 0.5%. For the seismiccoefficient, an exponential distribution �Exp D� and an extremevalue type II distribution �EVD� are used �Haldar and Mahadevan2000�. The mean value of the horizontal seismic coefficient isassumed to be 0.15. The angle of internal friction is considered tofollow the beta distribution.
It was shown for the M1 mechanism �Fig. 13� that the failureprobability of a vertically loaded footing is more sensitive to avariation of the angle of internal friction than the cohesion. Forthe seismically loaded footing in hand, Fig. 15 presents the effectof the randomness of the soil cohesion on the reliability index forboth exponential and extreme value distributions of the seismiccoefficient. In this figure, the cohesion c is assumed to be either alognormally distributed random variable with the commonly used
Fig. 14. Comparison between probabilistic and deterministic design
Fig. 15. Effect of the variability of c on the reliability index

coefficient of variation �20%� or as a deterministic parameter withvalue equal to the mean value �i.e., 20 kPa�. One may note thatwhether c is random or deterministic has only a minor effect onthe value of the reliability index.
Reliability Index, Failure Probability, and Sensitivity FactorsTables 2 and 3 present the reliability results �i.e., Hasofer-Lindreliability index, the corresponding design point, the omissionsensitivity factors, and the failure probability� for different valuesof the applied load PS varying from small values up to the deter-ministic ultimate load defined earlier for both exponential andextreme value distributions on Kh. The reliability index decreaseswith the increase of the vertical applied load PS. The exponentialdistribution on Kh gives more conservative results than the ex-treme value distribution on Kh. The values of the omission sensi-tivity factors suggest that, when the applied load is relativelysmall compared to the deterministic ultimate load, whether � israndom or deterministic has only a minor effect on the reliabilityindex since ����1 for both types of the probability distribu-tions on Kh. On the other hand, the randomness of the seismiccoefficient has a significant effect on the reliability index. Hence,for small values of the applied load, one can neglect the uncer-tainty in �. In contrast, for higher values of the applied load, theuncertainties of both the angle of internal friction and the seismiccoefficient should be considered in the reliability analysis.
Probability Distribution of the Punching Safety FactorFig. 16 shows the CDF of the punching safety factor obtainedfrom FORM approximation for the exponential distribution andfor different values of the coefficient of variation of the extremevalue distribution. It can be seen that the choice of the probabilitydistribution on Kh significantly affects the probability distributionof the safety factor. The dispersion of F is significantly largerwhen an exponential distribution is assumed for the seismiccoefficient.
Table 2. Probabilistic Results When Kh Follows the ExponentialDistribution
PS
kN/m�*
�deg� Kh* �HL ���� ��Kh
� Pf�%�
200 28.58 0.70 2.44 1.02 2.03 3.87
450 28.77 0.45 1.71 1.03 2.62 6.52
700 28.84 0.32 1.25 1.06 1.95 11.45
1,000 29.01 0.22 0.80 1.09 1.34 21.41
1,300 29.40 0.15 0.37 1.20 0.47 35.33
1,600 30.01 0.10 0.00 — — 50.00
Table 3. Probabilistic Results When Kh Follows the Extreme ValueDistribution and COVKh=40%
PS
kN/m�*
�deg� Kh* �HL ���� ��Kh
� Pf�%�
200 28.86 0.71 3.22 1.02 1.54 0.06
450 28.08 0.44 2.65 1.02 1.69 0.41
700 26.90 0.27 2.05 1.10 1.18 2.00
1,000 27.08 0.16 1.11 1.45 0.97 13.25
1,300 29.15 0.14 0.31 2.18 0.54 37.96
1,450 30.00 0.13 0.00 — — 50.00
10
Probabilistic DesignFor the design of a vertically loaded footing situated in seismicarea, a reasonable target failure probability of 1% is used. Fig. 17presents the probabilistic foundation breadth for the extremevalue distribution on Kh and for different values of the coefficientof variation of Kh. The deterministic breadth corresponding to asafety factor of 3 is also shown. The applied load is 700 kN /m.The probabilistic foundation breadth increases with the increaseof the coefficient of variation of Kh. It can be greater thanthe deterministic breadth for large values of the coefficient ofvariation.
Conclusion
A reliability-based analysis and design of a shallow strip founda-tion subjected to a vertical and a pseudostatic horizontal seismicloading was performed. Only the punching failure mode of theultimate limit state was studied. Two rigorous deterministic mod-els based on limit analysis failure mechanisms were used.
For the vertically loaded footing, the reliability index calcu-lated based on the critical probabilistic surface is more criticalthan that determined using the critical deterministic surface. Thereliability index decreases with the increase of the applied loadPS. The assumption of uncorrelated shear strength parameters is
Fig. 16. CDF of the punching safety factor for PS=450 kN /m
Fig. 17. Comparison between deterministic and probabilistic design
conservative in comparison to that of negatively correlated pa-rameters. The reliability index is much more sensitive to � than toc, especially for the case of nonnormal variables. The greater thescatter in �, the higher the failure probability. This means that theaccurate determination of the uncertainties of the angle of internalfriction � is important in obtaining reliable probabilistic results.FORM approximation is an acceptable approach for estimatingthe failure probability for the commonly used values of the soilvariability. When no correlation between shear strength param-eters is considered, a more spread out CDF of the ultimate loadwas obtained. For the case in hand, the chosen probability distri-bution does not significantly affect the values of the failure prob-ability. The probabilistically-designed foundation breadthdecreases with the increase of the negative correlation betweenthe shear strength parameters and the decrease of their coeffi-cients of variation. Contrary to Eurocode 7, which prescribesconstant values of the partial safety factors Fc and F�, areliability-based design has the advantage of providing differentvalues of these factors depending on the soil variability and cor-relation structure. These factors are by-products of a reliability-based design and reflect parametric sensitivities from case to casein a way rigid partial safety factors cannot.
For the seismically loaded footing, the extreme value distribu-tion was used to model the uncertainties of Kh. For values of thevertical load much below the deterministic ultimate load, one canneglect the uncertainty in �. In contrast, for higher values of thevertical load, the uncertainties of both � and Kh should be con-sidered in the reliability analysis.
Acknowledgments
The first two writers would like to thank the Lebanese NationalCouncil for Scientific Research �CNRSL� and the French organi-zation EGIDE for providing the financial support for thisresearch.
Appendix I
The expressions of the functions f i �i=1, . . . ,6� are given asfollows:
f1 =tan �
2
f2 =cos�� − ��
2 cos2 � sin��1 − 2��
· i=1
n � sin �i sin �i
sin��i + �i�sin��i − � −
j=1
i−1
� j − � · �
j=1
i−1sin2 � j sin�� j + � j − 2��
sin2�� j + � j�sin�� j+1 − 2���f3 =
cos�� − ��cos � sin��1 − 2��
sin �n
sin��n + �n�
· sin��n − � − j=1
n−1
� j − � · �
n−1sin � j sin�� j + � j − 2��
sin�� j + � j�sin�� j+1 − 2��
j=111
f4 =cos���cos��1 − � − ��2 cos � sin��1 − 2��
f5 =cos�� − ��cos���
2 cos � sin��1 − 2��
· i=1
n � sin �i
sin��i + �i��j=1
i−1sin � j sin�� j + � j − 2��
sin�� j + � j�sin�� j+1 − 2���f6 =
cos�� − ��cos���2 cos � sin��1 − 2��
· i=2
n � sin��i−1 − �i + �i−1�sin��i − 2��
· �j=1
i−1sin � j
sin�� j + � j�
· �j=1
i−2sin�� j + � j − 2��sin�� j+1 − 2�� �
Appendix II
The expressions of the functions gi �i=1, . . . ,6� are given asfollows:
g1 =sin2 �1
sin2��1 + �1�i=1
n � sin �i sin��i + �i�sin �i
sin��i − � − j=1
i−1
� j ��
j=2
isin2 � j
sin2�� j + � j��j=1
i−1sin�� j + � j − 2��sin�� j+1 − 2�� �
g2 =sin2 �1
sin2��1 + �1�i=1
n � sin �i sin��i + �i�sin �i
cos��i − � − j=1
i−1
� j ��
j=2
isin2 � j
sin2�� j + � j��j=1
i−1sin�� j + � j − 2��sin�� j+1 − 2�� �
g3 =sin �1
sin��1 + �1�sin��n − � −
j=1
n−1
� j ��
j=2
nsin � j
sin�� j + � j��j=1
n−1sin�� j + � j − 2��sin�� j+1 − 2��
g4 =sin �1
sin��1 + �1�cos��n − � −
j=1
n−1
� j ��
j=2
nsin � j
sin�� j + � j��j=1
n−1sin�� j + � j − 2��sin�� j+1 − 2��
g5 =sin �1 cos �
sin��1 + �1�i=1
n � sin �i
sin �i�j=2
isin � j
sin�� j + � j��j=1
i−1sin�� j + � j − 2��sin�� j+1 − 2�� �
g6 =sin �1 cos �
sin��1 + �1�i=1
n−1 � sin��i − �i+1 + �i�sin��i+1 − 2��
��j=2
isin � j
sin�� j + � j��j=1
i−1sin�� j + � j − 2��sin�� j+1 − 2�� �
References
Calgaro, J. A. �1996�. Introduction aux Eurocodes. Sécurité des construc-tions et bases de la théorie de la fiabilité, Presses de l’ENPC, Paris �inFrench�.
Cherubini, C. �2000�. “Reliability evaluation of shallow foundation bear-ing capacity on C�, �� soils.” Can. Geotech. J., 37, 264–269.
Christian, J., Ladd, C., and Baecher, G. �1994�. “Reliability applied toslope stability analysis.” J. Geotech. Engrg., 120�12�, 2180–2207.
Der Kiureghian, A., and Liu, P. L. �1986�. “Structural reliability underincomplete probability information.” J. Eng. Mech., 112�1�, 85–104.
Ditlevsen, O. �1981�. Uncertainty modelling: With applications to multi-dimensional civil engineering systems, McGraw-Hill, New York.
El-Ramly, H., Morgenstern, N. R., and Cruden, D. M. �2002�. “Probabi-listic slope stability analysis for practice.” Can. Geotech. J., 39, 665–683.
El-Ramly, H., Morgenstern, N. R., and Cruden, D. M. �2003�. “Probabi-listic stability analysis of a tailing dyke on presheared clay-shale.”Can. Geotech. J., 40, 192–208.
Fenton, G. A., and Griffiths, D. V. �2002�. “Probabilistic foundationsettlement on spatially random soil.” J. Geotech. Geoenviron. Eng.,128�5�, 381–390.
Fenton, G. A., and Griffiths, D. V. �2003�. “Bearing capacity prediction ofspatially random C-� soils.” Can. Geotech. J., 40, 54–65.
Fenton, G. A., and Griffiths, D. V. �2005�. “Three-dimensional probabi-listic foundation settlement.” J. Geotech. Geoenviron. Eng., 131�2�,232–239.
Griffiths, D. V., and Fenton, G. A. �2001�. “Bearing capacity of spatiallyrandom soil: The undrained clay Prandtl problem revisited.” Geotech-nique, 51�4�, 351–359.
Griffiths, D. V., Fenton, G. A., and Manoharan, N. �2002�. “Bearingcapacity of rough rigid strip footing on cohesive soil: Probabilisticstudy.” J. Geotech. Geoenviron. Eng., 128�9�, 743–755.
Haldar, A., and Mahadevan, S. �2000�. Probability, reliability, and statis-tical methods in engineering design, Wiley, New York.
Harr, M. E. �1987�. Reliability-based design in civil engineering,McGraw-Hill, New York.
Hasofer, A. M., and Lind, N. C. �1974�. “Exact and invariant second-moment code format.” J. Engrg. Mech. Div., 100�1�, 111–121.
Hassan, A., and Wolff, T. �1999�. “Search algorithm for minimum reli-ability index of earth slopes.” J. Geotech. Geoenviron. Eng., 125�4�,301–308.
Lemaire, M. �2005�. Fiabilité des structures, Hermes-Lavoisier, Paris �inFrench�.
Low, B. K. �2005�. “Reliability-based design applied to retaining walls.”
12
Geotechnique, 55�1�, 63–75.Low, B. K., Gilbert, R. B., and Wright, S. G. �1998�. “Slope reliability
analysis using generalized method of slices.” J. Geotech. Geoenviron.Eng., 124�4�, 350–362.
Low, B. K., and Phoon, K. K. �2002�. “Practical first-order reliabilitycomputations using spreadsheet.” Proc., Probabilistics in Geotech-nics: Technical and Economic Risk Estimation, 39–46.
Low, B. K., and Tang, W. H. �1997a�. “Efficient reliability evaluationusing spreadsheet.” J. Eng. Mech., 123�7�, 749–752.
Low, B. K., and Tang, W. H. �1997b�. “Probabilistic slope analysis usingJanbu’s generalized procedure of slices.” Comput. Geotech., 21�2�,121–142.
Low, B. K., and Tang, W. H. �1997c�. “Reliability analysis of reinforcedembankments on soft ground.” Can. Geotech. J., 34, 672–685.
Low, B. K., and Tang, W. H. �2004�. “Reliability analysis using object-oriented constrained optimization.” Struct. Safety, 26, 68–89.
Lumb, P. �1970�. “Safety factors and the probability distribution of soilstrength.” Can. Geotech. J., 7, 225–242.
Melchers, R. E. �1999�. Structural reliability analysis and prediction, 2ndEd., Wiley, New York.
Phoon, K.-K. �2004�. “General non-Gaussian probability models for first-order reliability method �FORM�.” A state-of-the-art Rep., Int. Centrefor Geohazards �ICG�, Oslo, Norway.
Phoon, K.-K., and Kulhawy, F. H. �1999�. “Evaluation of geotechnicalproperty variability.” Can. Geotech. J., 36, 625–639.
Phoon, K.-K., Kulhawy, F. H., and Grigoriu, M. D. �2003�. “Multipleresistance factor design for shallow transmission line structure foun-dations.” J. Geotech. Geoenviron. Eng., 129�9�, 807–818.
Popescu, R., Deodatis, G., and Nobahar, A. �2005�. “Effect of randomheterogeneity of soil properties on bearing capacity.” Probab. Eng.Mech., 20, 324–341.
Przewlocki, J. �2005�. “A stochastic approach to the problem of bearingcapacity by the method of characteristics.” Comput. Geotech., 32,370–376.
Rackwitz, R., and Fiessler, B. �1978�. “Structural reliability under com-bined random load sequences.” Comput. Struct., 9�5�, 484–494.
Soubra, A.-H. �1999�. “Upper-bound solutions for bearing capacity offoundations.” J. Geotech. Geoenviron. Eng., 125�1�, 59–68.
STRUREL. �1991�. A structural reliability analysis program: Theoreticalmanual, RCP GmbH, Munchen, Germany.
Wolff, T. H. �1985�. “Analysis and design of embankment dam slopes: Aprobabilistic approach.” Ph.D. thesis, Purdue Univ., Lafayette, Ind.
Yuceman, M. S., Tang, W. H., and Ang, A. H. S. �1973�. “A probabilisticstudy of safety and design of earth slopes.” Civil Engineering Studies,Structural Research Series, 402, Univ. of Illinois, Urbana, Ill.