Embed Size (px)
Citation preview

Loughborough UniversityInstitutional Repository
Reliability assessment ofmechanical systems
This item was submitted to Loughborough University's Institutional Repositoryby the/an author.
Citation: MOSS, T.R. and ANDREWS J.D., 1996. Reliability assessmentof mechanical systems. Proceedings of the Institution of Mechanical Engi-neers, Part E: Journal of Process Mechanical Engineering, 210 (3), pp. 205-216[DOI:10.1243/PIME_PROC_1996_210_315_02]
Additional Information:
• This article was published in the journal, Proceedings of the Institution ofMechanical Engineers, Part E: Journal of Process Mechanical Engineering[ c© IMechE / Professional Engineering Publishing] and is also availableat: http://archive.pepublishing.com/content/120026/
Metadata Record: https://dspace.lboro.ac.uk/2134/3947
Publisher: c© IMechE / Professional Engineering Publishing
Please cite the published version.

This item was submitted to Loughborough’s Institutional Repository (https://dspace.lboro.ac.uk/) by the author and is made available under the
following Creative Commons Licence conditions.
For the full text of this licence, please go to: http://creativecommons.org/licenses/by-nc-nd/2.5/
205
Review Note
Reliability assessment of mechanical systems T R MOSS, MPhil, CEng, FIMechE, FIQA, FSaRS Consultant, Abingdon, Oxfordshire J D Andrews, BSc, PhD, CEng, MIMechE, AFIMA, MSaRS, FSS Department of Mathematical Sciences, Loughborough University of Technology, Loughborough, Leicestershire
The assessment of mechanical systems is not an exact science and predictions can be subject to considerable uncertainty. In this paper the particular problems of mechanical system reliability assessment are discussed and a general methodology presented based on experience from availability studies carried out on offshore and onshore process plant.
Key words: reliability assessment, mechanical system, safety, availability
1 INTRODUCTION
Reliability and risk assessment techniques are the methods advocated by many regulatory bodies to assess the safety of modern, complex process plant and their protective systems. However, reliability assessment can also be applied to determine the likely availability char- acteristics of equipment. The trend in manufacturing systems towards large, single-stream plant means that outages due to equipment failures and their subsequent repair can have a significant effect on profitability. Reli- ability assessment, particularly during the design phase, can be applied to identify the systems, equipment and components that are likely to have a major impact on product availability-this can, of course, include acci- dents that destroy equipment or part of the plant.
Attention to these reliability-critical areas by the introduction of redundancy and attention to maintain- ability during the design phase of new plant can lead to dramatic improvements in profitability during the plant lifetime. The methods can also be applied to existing plant, although generally with less dramatic effect since the basic plant design is less easily modified.
Predicting the reliability of mechanical systems does pose special problems. Here these problems are dis- cussed and a basic procedure for carrying our reli- ability, availability and maintainability assessments is described based on experience from offshore and onshore process plant studies.
2 MECHANICAL RELIABILITY
Models currently employed to predict failure in mecha- nical process plant are quite elementary. They are largely based on techniques developed many years ago for electronic systems and components. These models can be employed effectively for the evaluation of mecha- nical systems, but they must be used with caution since they assume that extrinsic factors such as the frequency of random shocks to the system (for example power surges) determine the probability of failure-hence their assumption of Poisson processes and constant hazard rates.
These assumptions are frequently not valid for mechanical equipment. Carter (1) shows that intrinsic
The M S was received on 22 April 1995 and was accepted for publication on 28 February 1996.
E01395 @ IMechE 1996
degradation mechanisms such as fatigue, creep and stress corrosion can have a strong influence on system lifetime and the probability of failure. In highly stressed equipment cumulative damage to specific components will be the most likely cause of failure. Hence a review of the factors that influence degradation mechanisms such as maintenance practice and operating environ- ments becomes a vital element in the evaluation of likely reliability performance. To predict the probability of a high-speed rotating machine failure it will be neces- sary to identify the various degradation mechanisms and to assess the impact of different maintenance and operating strategies on the expected lifetimes and main- tainability of the different components in the system.
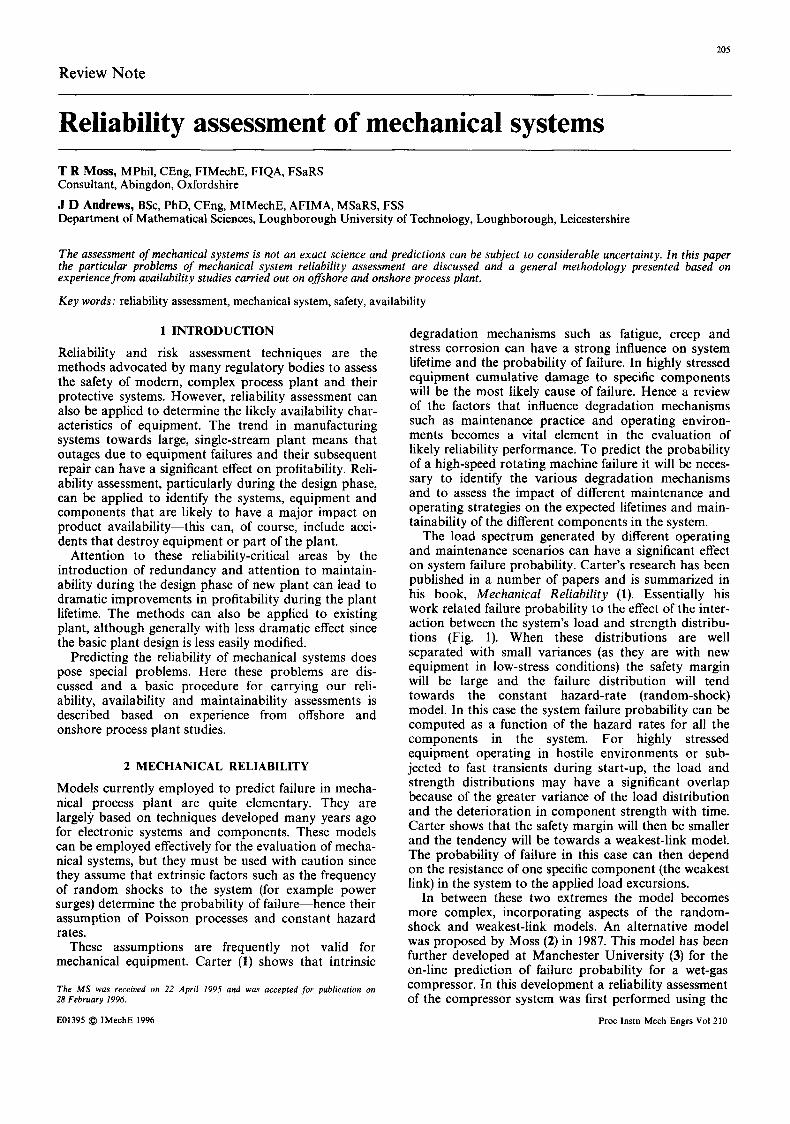
The load spectrum generated by different operating and maintenance scenarios can have a significant effect on system failure probability. Carter’s research has been published in a number of papers and is summarized in his book, Mechanical Reliability (1). Essentially his work related failure probability to the effect of the inter- action between the system’s load and strength distribu- tions (Fig. 1). When these distributions are well separated with small variances (as they are with new equipment in low-stress conditions) the safety margin will be large and the failure distribution will tend towards the constant hazard-rate (random-shock) model. In this case the system failure probability can be computed as a function of the hazard rates for all the components in the system. For highly stressed equipment operating in hostile environments or sub- jected to fast transients during start-up, the load and strength distributions may have a significant overlap because of the greater variance of the load distribution and the deterioration in component strength with time. Carter shows that the safety margin will then be smaller and the tendency will be towards a weakest-link model. The probability of failure in this case can then depend on the resistance of one specific component (the weakest link) in the system to the applied load excursions.
In between these two extremes the model becomes more complex, incorporating aspects of the random- shock and weakest-link models. An alternative model was proposed by Moss (2) in 1987. This model has been further developed at Manchester University (3) for the on-line prediction of failure probability for a wet-gas compressor. In this development a reliability assessment of the compressor system was first performed using the
Proc lnstn Mech Engrs Vol 210
T R MOSS AND J D ANDREWS 206
-
I I Probability I
I I Stress Mean Mean Load c Strength 5
I PD I I Low stress conditions - I
fn constant hazard rate model
I I - L Stress L S
' High stress conditions -
I Stress I - L S
s - L Safety Margin = 4 q + 0;)
Fig. 1 Interaction of load and strength distributions
constant hazard-rate model and the system failure prob- ability predicted using generic reliability data. Changes in the monitored load-parameter distributions (which are assumed to reflect component strength changes) were then input to the model to continuously update the prediction of the system residual lifetime.
Catuneanu and Milhalache (4) have also considered mechanical system reliability and have proposed a Markov chain model for systems subject to age- dependent failures which may recover to the initial state or to a degraded state. They propose the use of fault tree analysis to identify the minimum cut sets leading to failure and simulation to determine the lifetime distribu- tion as a function of age. The component reliabilities are related to the real stresses by an approach similar to that of Carter. These models of mechanical reliability are interesting from a theoretical point of view but no detailed examples or actual applications are given in the text.
Bloch and Geitner (5) describe more practical methods for assessing machine reliability based on the age of the equipment, the environment and the duty cycle. The procedures are well defined and examples, with comprehensive check-lists to be applied in associ- ation with failure mode and effect analysis, are given for a wide range of equipment. In the United Kingdom similar methods have been applied with some success Part E: Journal of Process Mechanical Engineering
for the prediction of safety-critical failures in large reciprocating pumps by Lewis and Carrick (6). Martin (7) and Hughes (8) have both proposed methods for modelling dependent failures, the former adapting Carter's approach to predict potential failures for a gearbox and the latter considering the effect of different environments (including the maintenance environment) on the probability of simultaneous failure in redundancy systems.
In all of the foregoing studies, however, the lack of comprehensive data on equipment failures and load dis- tributions can be identified as the main limitation of these models for mechanical system reliability assess- ment. Thus for large mechanical plant an approach based on the assumption of constant hazard and repair rates in conjunction with sensitivity analysis appears to be the best currently available to identify the reliability- critical items. Subsequently, checks on the effect of oper- ating and maintenance policy can then be carried out during the design review stage to evaluate their likely impact on degradation processes, failure frequencies and repair/replacement times.
3 RELIABILITY PREDICTION
3.1 General With mechanical systems and particularly those con- taining rotating machinery, the prediction of reliability performance is not straightforward. There can be con- siderable variance in the failure frequencies and average repair times of components which are not revealed by conventional methods of reliability analysis. Although the basic reliability analysis techniques such as failure mode and effect analysis and fault trees can be applied in mechanical system assessments, there is a need to consider and limit the effects of component degradation. Operational, environmental and maintenance condi- tions which may affect the validity of the generic reliability/maintainability data used in assessing equipment and system availability also need to be studied. A subjective evaluation of the factors which can lead to uncertainties in the basic data is necessary to ensure that predictions based on the assumption of con- stant hazard rates are sound. Design decisions can then be taken with a reasonable degree of confidence.
Reliability is generally defined as the probability that a system, equipment or component will operate suc- cessfully for a stated period of time under stated oper- ating and environmental conditions. In this definition reliability is employed as a generic term covering unre- pairable and repairable systems. For plant where the systems are repairable, the repair process as well as the failure process needs consideration. It is usual (because of the relative limitations of the failure/repair data available) to consider steady state operation when the plant is assumed to have settled down and thus failure time and repair time are random variables. For this steady state model the availability, A, the probability to function on demand, is also a random variable and is defined as the ratio of the uptime to the total time. Hence
A = MTTF
MTTF + MTTR @ IMechE 1996
RELIABILITY ASSESSMENT OF MECHANICAL SYSTEMS 207
where
MTTF = mean time to failure
MTTR = mean time to repair
With this simple expression it is possible to calculate global estimates of the availabilities of equipments and to combine these logically to determine the expected availability of a system.
This expression is satisfactory when the plant can only operate in two states: up (working) or down (not working). Where the plant can operate at different levels of output the availabilities in the different operational states must be determined. The output availability of the plant is then the sum of each operating state avail- ability multiplied by the product output level for that state. For a plant with n up (output) states and one down state the product availability would be:
Product " availability i=
= 1 (availability i x level i output)
For example, if an offshore production platform can exist in either one of two output states producing 100000 or 50000 barrels of oil per day with avail- abilities of 78 and 18 per cent respectively (and down- time unavailability of 4 per cent), then the average output availability of the platform is
0.78 x 100000 + 0.18 x 50000 100 000
= 87% A(0utput) =
(that is an average production rate of 87000 barrels of oil per day).
4 PROCEDURE FOR ASSESSMENT
For the reliability assessment of complex systems a con- sistent, logical approach is essential. The plant specifi- cation, engineering drawings, process diagrams and other documentation alone can make a paper mountain several feet high, so that isolating the basic information needed to carry out the assessment can present quite a problem. For most process plant an effective approach can usually be made by concentrating on the piping and instrumentation diagrams (PIDs). Using these drawings with the plant specification and process flow diagrams as the initial information base the assessment can proceed along the following lines:
1. Review the information available and write down a brief description of the process.
2. Define: (a) assessment objectives, (b) plant and system boundaries, (c) inputs and outputs across boundaries, (d) plant operational states, (e) failure criteria, (f) assumption made in the availability model.
3. Develop a simplified functional block diagram for the installation and logic diagrams such as fault trees for each output state down to a system/ subsystem level (the indenture level) at which rele- vant failure and repair data can be obtained.
4. From the fault trees and output-state information, develop an availability model for the installation
Q IMechE 1996
and check generic sources of failure, repair and pro- duction data for input to the model.
5. Assemble a set of PIDs for the systems, draw in subsystem boundaries and evaluate subsystem availabilities. Where relevant data are not available use failure mode and effect analysis or parts count techniques.
6. Review these data against the operating states and failure criteria, adjust for the plant operational/ environmental conditions and insert into the avail- ability model equations. Estimate the availabilities of the systems and plant and compute the average output availability of the installation.
7. Rank the systems and subsystems by their avail- ability scores.
8. Carry out a sensitivity analysis for the low- availability items to determine the effect of changes in the input data on the predictions. Where the changes are significant review the data sources and recalculate the availabilities with the modified data.
9. Consider the effects of degradation mechanisms induced by design, operation and maintenance procedures/environments on component lifetimes, system failure frequencies and repair times at the design review stage. Recommend QA (quality assurance) procedures (including condition monitoring) or design modifications to control their effects.
10. Write a report highlighting the reliability-critical areas with recommendations on design, main- tenance and operation relevant to availability per- formance.
The methods are described in more detail elsewhere, for example by Andrews and Moss (9,lO) and Davidson and Hunsley (11). Here the application of the two main techniques-failure mode and effect analysis (FMEA) and fault tree analysis (FTA)--employed in mechanical system reliability studies are discussed with examples from actual assessments.
5 ASSESSMENT TECHNIQUES
5.1 FMEA Failure mode and effect analysis is a powerful reliability assessment technique developed by the American defence industry in the 1960s to address the problems experienced with complex electronic, weapon-control systems. Subsequently it was extended for use with other electronic, electrical and mechanical equipment. It is a step-by-step procedure for the systematic evaluation of the failure effects and criticality of potential failure modes in an equipment design. FMEA can be applied at different indenture levels, for example to determine the availability characteristics of a gas compressor oper- ating on an offshore oil production platform or the failure-on-demand probability of its fire protection system, down to an evaluation of the failure mecha- nisms associated with a pressure switch. By the analysis of individual component failure modes, the effect of each failure on system operation can be determined.
FMEAs can be performed in a variety of different ways depending on the objective of the assessment, the stage of equipment development and the information
Proc Instn Mech Engrs Vol 210
N
P
400 KW CHILLER UNIT
INDENTURE LEVEL -2 Sheet no. 6 of 20 Mission Phase 1 - OPERATING
Study by: Prepared by: Approved hy. Date:
S Y S ~ Re CDescnption-
Function
1.4.0 Lubrication
Provide cooled lube oil at pressure to bearings and gearing. Auxilliary oil pump from starting, Jet
ump and low and Righ s y d centri ugal pumps whilst running. Duplicate fdlers and single lube oil cooler.
system
- 22 7
1401
1402
1403
1404
140s
1406
-
FAILURE
Mode
Leakage
Oil too hot
Oil pressure low
Oil contaminated
Oil level in sump low
Oil level in sump high
POSSIBLE C A U S E
Loose connectors. Auxiliary oil pump fault.
Restriction of oil flow. Rest tictioii of water cnoling. Fouling of heat exchanger.
Riockage. Wear. Jet pump faults.
Filter not cleaning oil. Water in oil.
System leak. Oil transfer to refrigerant circuit.
Refrigerant in oil.
SYMPTOM DETECTED
BY
Obsewation - gas in air monitors. Fall of sump level.
High oil temperature warning.
Low o i l pressrre warning.
Daily observation of oil condition.
Observed in sight glass.
Observed in sight glass. Foaming.
Local
Slow leaks have no effect.
Inadequate lubrication due to law oil Viscosity and loss of bearing cooling.
Inadequate lubrication due to reduction of oil flow.
Dismlouration and/or emulsification of oil.
Only sudden severe leak would have ellect.
Reduced lubrication due to gas separating out from oil.
On next level
Eventual shutdown if unconected by loss of oil pressure. Performance loss if air ingress.
Eventual shutdown
Eventual shutdown.
Eventual damage if not corrected.
Sudden, severe leak would lead to shutdown on low lube oil pressure.
Eventually no out UI Shutdown or low kbe oil pressure.
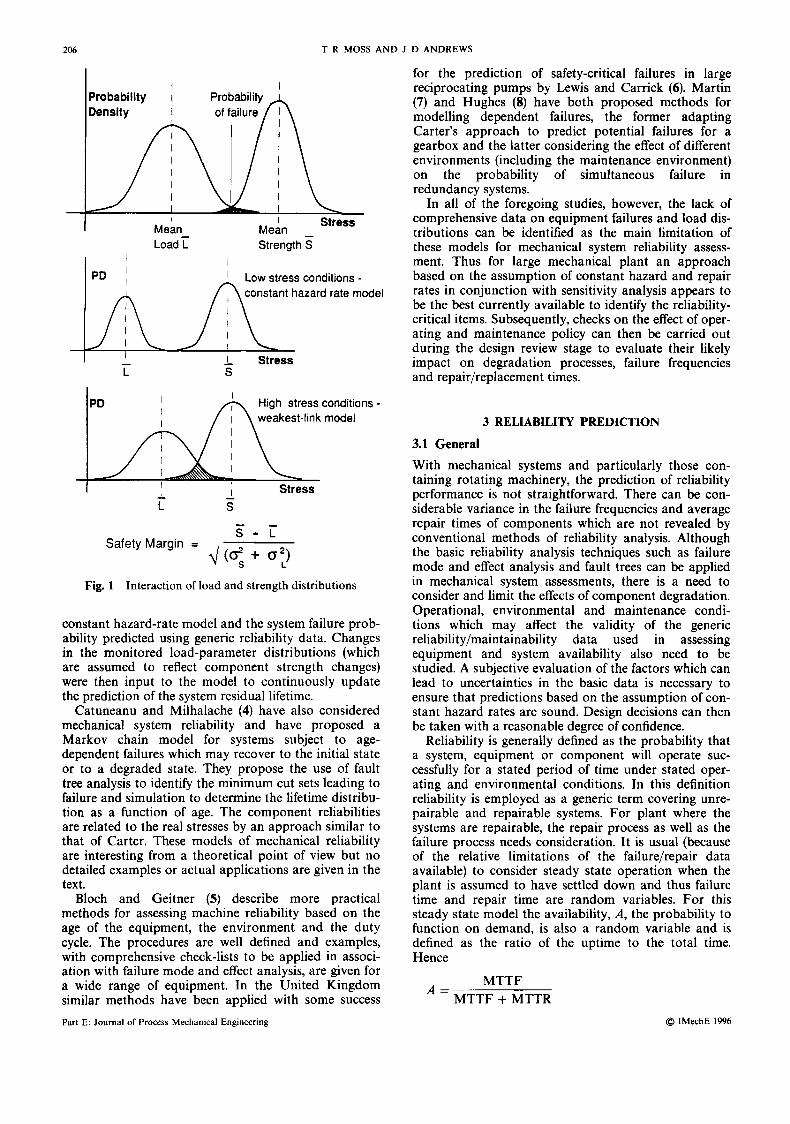
Fig. 2 Functional FMEA worksheet
Compensating provision against
failure
2-ho~rly inspedions. Automatic shutdown on low oil pressure.
Unit shutdown due to high lube oil temperature.
Unit shutdown due to low lube oil pressure.
Pilimdition is ud ed daily. Oil
IS c anged
daily checks. Sudden severe leak gives shutdown or law oil pressure.
daily daily checks. P n s t a r t requirement to keep oil hot for 12 hours.
annually.
REMARKS
Sump contains M litres. so I loss of sa 2S% acceptable to unit, s h o d be readily observed.
Slow rise of oil temperature would be found by study of readings.
Oil pressure is one of the most important parameten monitored. Will be watched to decide on state of oil Wter.
Condition of 'replaced" dl filters is examined for evidence of an abnormal state.
Oil can be topped up, a standard routine. When sufliaent oil h u migrated to refrigerant it can be returned slowly.
Gas separating out from oil would give low lubricating oil pressure shutdown.
RELIABILITY ASSESSMENT OF MECHANICAL SYSTEMS 209
available on its components at the time of the analysis. The objective of the FMEA must be clear-whether to identify, say, weak areas in the design, the safety-critical components or perhaps maintainability-critical items. The FMEA focus may dictate a different worksheet format in each case; nevertheless, there are two basic approaches:
1. The functional FMEA, which recognizes that each item is designed to perform a number of functions which can be classified as outputs. These outputs are identified.and loss of essential inputs to the item or internal failures are then evaluated with respect to their effects on system operation.
2. The hardware FMEA, which sequentially lists indi- vidual equipment items and analyses the effect of each item failure mode on the operation of the system.
In many cases a combination of these two approaches is employed. For example, a functional analysis at plant and major system levels, followed by more detailed analysis of the hardware shown to be sensitive to the range of uncertainties in the failure data is employed in the initial functional, ‘broad-brush’ analysis.
The FMEA worksheet is tabular in format to foster a systematic approach to the analysis. A standard work- sheet layout is shown in Fig. 2. The column headings generally employed are :
Item identity/description : a unique identification code and description of each item
Function: a brief description of the function per- formed by the item
Failure mode: each item failure mode is listed separately-there may be several for an item
Possible causes : the likely causes of each postulated failure mode
Failure detection method: features of the design through which the failure is recognized
Failure effect-local level: the effect of the failure on the item’s function
Failure effect-system level: the effect of the item failure mode on system operation
Compensating provisions : any internal compensating provisions which could mitigate the effect of the failure
Remarks: comments on the failure mode/effect including any recommendation for action
If the analysis is extended to quantify the severity and probability of failure (or failure rate) of the system (defined as a failure mode and effect criticality analysis-FMECA) further columns may be added to the worksheet, such as:
Severity: the level of severity of the effect ascribed to each failure mode classified as : Level 1-minor, no effect on item functional per-
formance Level 2-major, degradation of item functional
performance Level 3-critica1, severe reduction of item func-
tional performance resulting in a change in the system operational state
Level katastrophic , complete loss of system function
0 IMechE 1996
Loss frequency : the expected frequency of loss resulting from each failure mode, either as a failure rate or failure probability. The latter is usually esti- mated for the operating time interval as a propor- tion of the overall system failure rate or failure probability (F) . The levels generally employed for process plant are:
(a) Very low probability <0.01F
(c) Medium probability 0.1-0.2F (d) High probability > 0.2F
(b) Low probability 0.01-0.1F
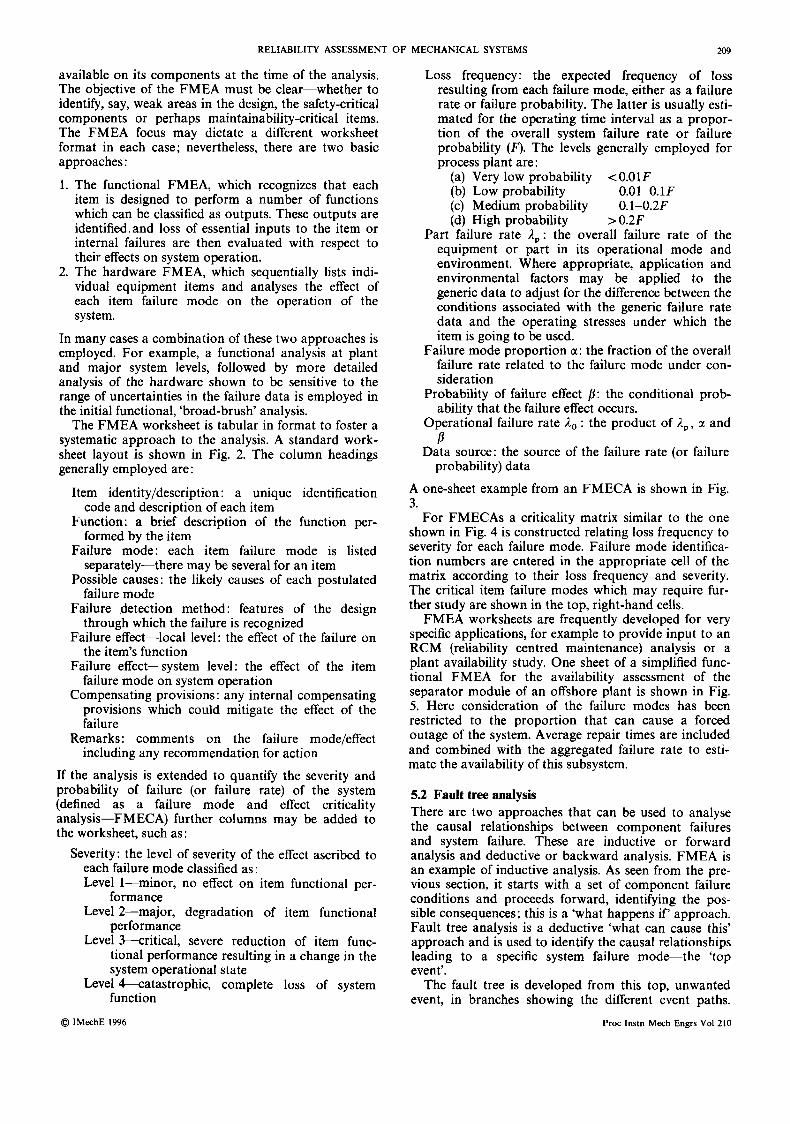
Part failure rate I , : the overall failure rate of the equipment or part in its operational mode and environment. Where appropriate, application and environmental factors may be applied to the generic data to adjust for the difference between the conditions associated with the generic failure rate data and the operating stresses under which the item is going to be used.
Failure mode proportion a: the fraction of the overall failure rate related to the failure mode under con- sideration
Probability of failure effect p: the conditional prob- ability that the failure effect occurs.
Operational failure rate ,lo : the product of A,, a and
Data source: the source of the failure rate (or failure
A one-sheet example from an FMECA is shown in Fig. 3.
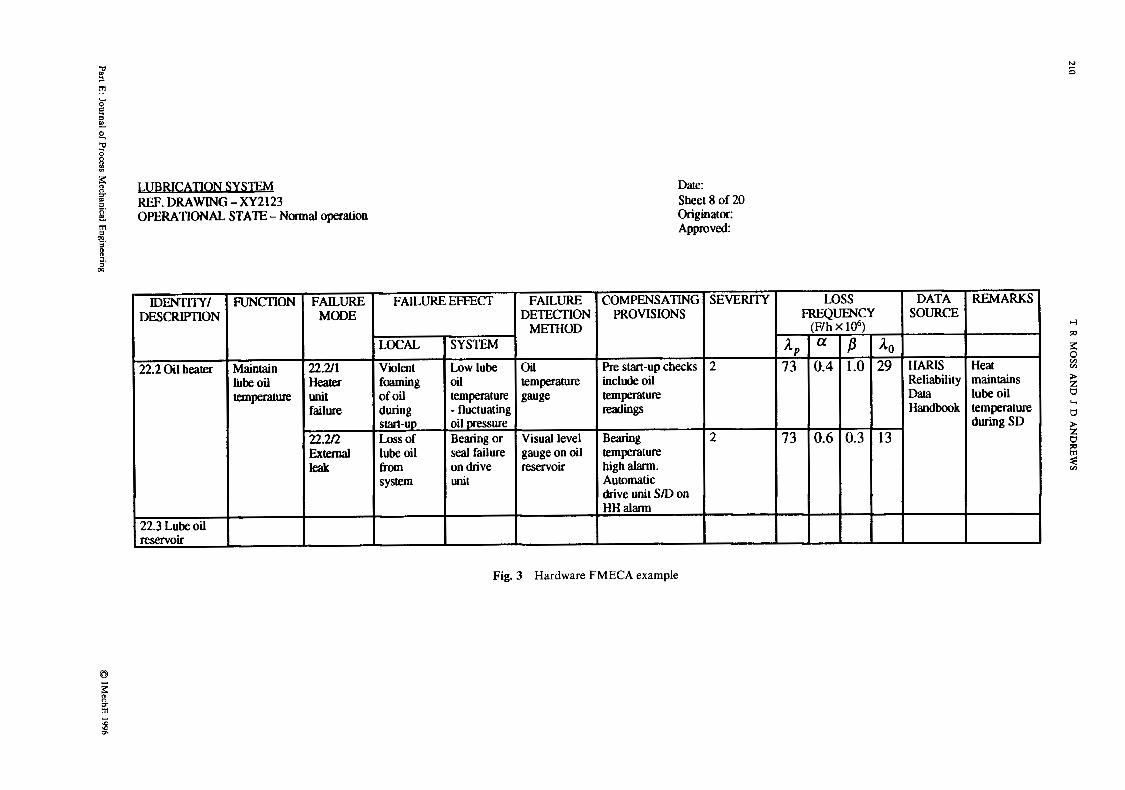
For FMECAs a criticality matrix similar to the one shown in Fig. 4 is constructed relating loss frequency to severity for each failure mode. Failure mode identifica- tion numbers are entered in the appropriate cell of the matrix according to their loss frequency and severity. The critical item failure modes which may require fur- ther study are shown in the top, right-hand cells.
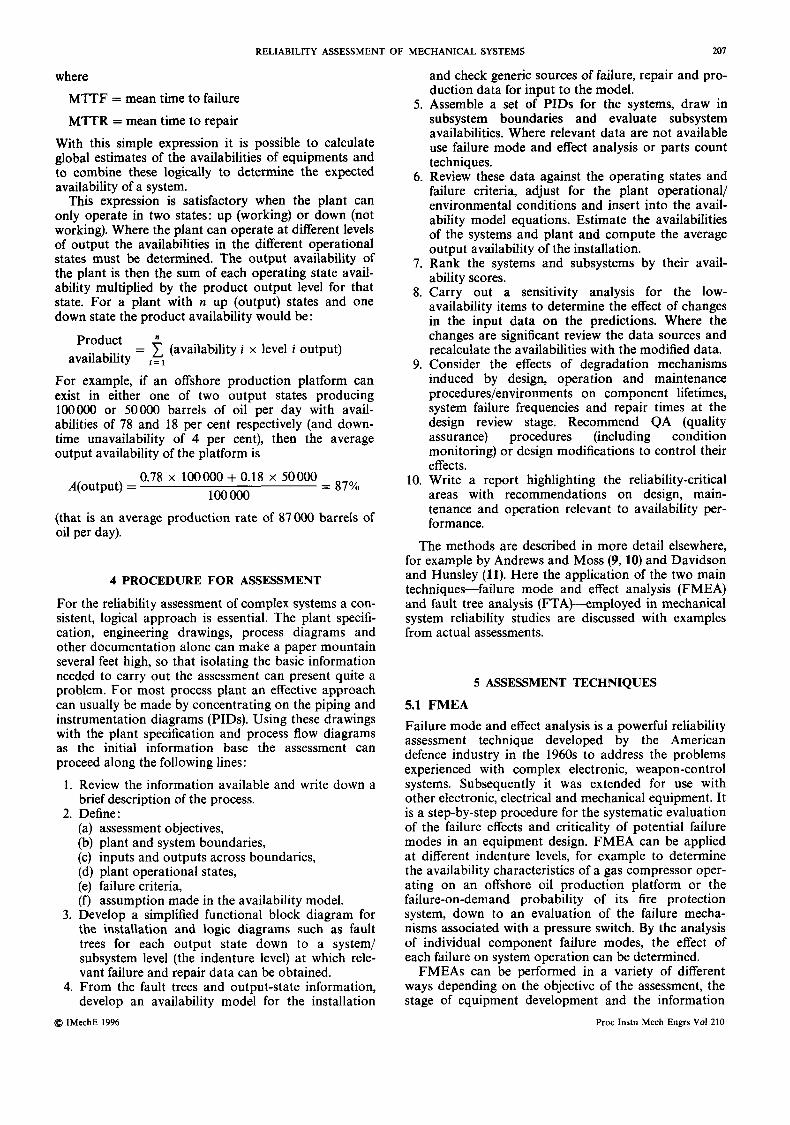
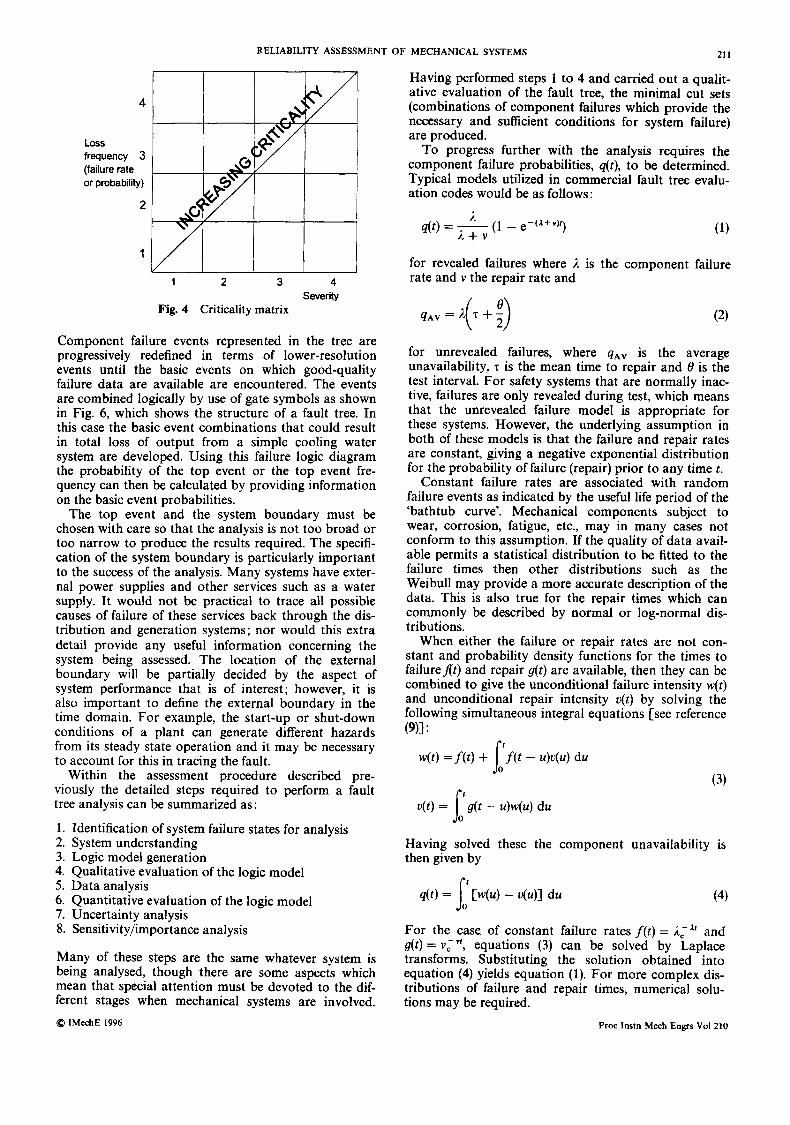
FMEA worksheets are frequently developed for very specific applications, for example to provide input to an RCM (reliability centred maintenance) analysis or a plant availability study. One sheet of a simplified func- tional FMEA for the availability assessment of the separator module of an offshore plant is shown in Fig. 5. Here consideration of the failure modes has been restricted to the proportion that can cause a forced outage of the system. Average repair times are included and combined with the aggregated failure rate to esti- mate the availability of this subsystem.
B probability) data
5.2 Fault tree analysis There are two approaches that can be used to analyse the causal relationships between component failures and system failure. These are inductive or forward analysis and deductive or backward analysis. FMEA is an example of inductive analysis. As seen from the pre- vious section, it starts with a set of component failure conditions and proceeds forward, identifying the pos- sible consequences; this is a ‘what happens if‘ approach. Fault tree analysis is a deductive ‘what can cause this’ approach and is used to identify the causal relationships leading to a specific system failure mode-the ‘top event’.
The fault tree is developed from this top, unwanted event, in branches showing the different event paths.
Proc Instn Mech Engrs Vol210
210 T
R MO
SS AN
D J D
AN
DR
EW
S
U
Part E: Journal of Process M
echanical Engineering
N
@ IM
echE 1996
21 1 RELIABILITY ASSESSMENT OF MECHANICAL SYSTEMS
I I I
4
Loss frequency 3 (failure rate or probability)
2
1 2 3 4 Severity
Fig. 4 Criticality matrix
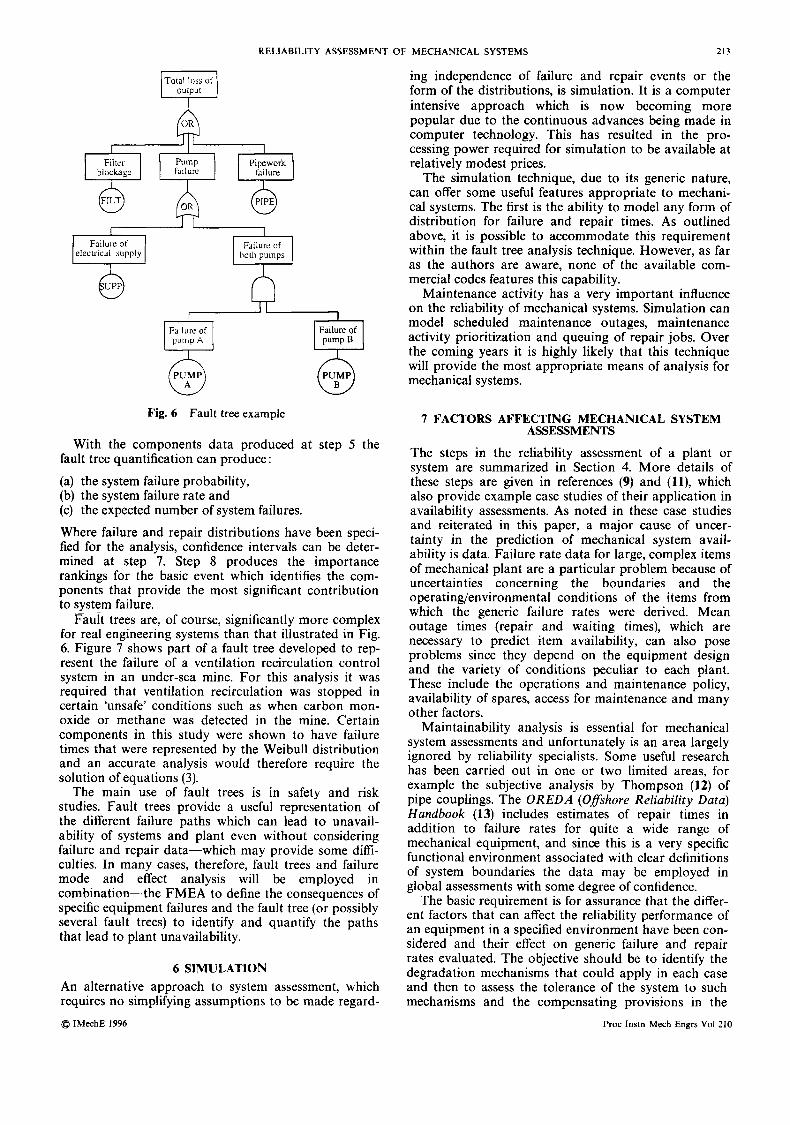
Component failure events represented in the tree are progressively redefined in terms of lower-resolution events until the basic events on which good-quality failure data are available are encountered. The events are combined logically by use of gate symbols as shown in Fig. 6, which shows the structure of a fault tree. In this case the basic event combinations that could result in total loss of output from a simple cooling water system are developed. Using this failure logic diagram the probability of the top event or the top event fre- quency can then be calculated by providing information on the basic event probabilities.
The top event and the system boundary must be chosen with care so that the analysis is not too broad or too narrow to produce the results required. The specifi- cation of the system boundary is particularly important to the success of the analysis. Many systems have exter- nal power supplies and other services such as a water supply. It would not be practical to trace all possible causes of failure of these services back through the dis- tribution and generation systems; nor would this extra detail provide any useful information concerning the system being assessed. The location of the external boundary will be partially decided by the aspect of system performance that is of interest; however, it is also important to define the external boundary in the time domain. For example, the start-up or shut-down conditions of a plant can generate different hazards from its steady state operation and it may be necessary to account for this in tracing the fault.
Within the assessment procedure described pre- viously the detailed steps required to perform a fault tree analysis can be summarized as :
1. Identification of system failure states for analysis 2. System understanding 3. Logic model generation 4. Qualitative evaluation of the logic model 5. Data analysis 6. Quantitative evaluation of the logic model 7. Uncertainty analysis 8. Sensitivity/importance analysis
Many of these steps are the same whatever system is being analysed, though there are some aspects which mean that special attention must be devoted to the dif- ferent stages when mechanical systems are involved. @ IMechE 1996
Having performed steps 1 to 4 and carried out a qualit- ative evaluation of the fault tree, the minimal cut sets (combinations of component failures which provide the necessary and sufficient conditions for system failure) are produced.
To progress further with the analysis requires the component failure probabilities, q(t), to be determined. Typical models utilized in commercial fault tree evalu- ation codes would be as follows :
I (1 - e-'"+''t) 4(t) = - I + V
for revealed failures where I is the component failure rate and v the repair rate and
for unrevealed failures, where qAV is the average unavailability, z is the mean time to repair and 8 is the test interval. For safety systems that are normally inac- tive, failures are only revealed during test, which means that the unrevealed failure model is appropriate for these systems. However, the underlying assumption in both of these models is that the failure and repair rates are constant, giving a negative exponential distribution for the probability of failure (repair) prior to any time t.
Constant failure rates are associated with random failure events as indicated by the useful life period of the 'bathtub curve'. Mechanical components subject to wear, corrosion, fatigue, etc., may in many cases not conform to this assumption. If the quality of data avail- able permits a statistical distribution to be fitted to the failure times then other distributions such as the Weibull may provide a more accurate description of the data. This is also true for the repair times which can commonly be described by normal or log-normal dis- tributions.
When either the failure or repair rates are not con- stant and probability density functions for the times to failure At) and repair g(t) are available, then they can be combined to give the unconditional failure intensity w( t ) and unconditional repair intensity u(t) by solving the following simultaneous integral equations [see reference ( 9 ~ :
w(t ) =f(t) + [ ' f ( t - u)u(u) du JO
(3) PI
~ ( t ) = g(t - U)W(U) du Jo Having solved these the component unavailability is then given by
(4)
For the case, of constant failure rates f ( t ) = & A t and g(t) = v,"', equations (3) can be solved by Laplace transforms. Substituting the solution obtained into equation (4) yields equation (1). For more complex dis- tributions of failure and repair times, numerical solu- tions may be required.
Proc Instn Mech Engrs Vol 210
I?
N
N e
' PLATFORM - GEORDIEALPHA 9 0 SUB-SYSTEM - 1ST STAGE SEPARATOR f
IDENTITY
V210A
xEA2
LEA4
FCV3
DESCRIITION
Separator vessel
ESD valve (12" ball valve, pneumatic actuator)
Pressure transmitter
Oil Oow control valve (6" globe valve, pneumatic actuator)
FAILURE MODE
~~ ~ ~~~
Internal mechanical failure
a) Valve stuck open
b) Valve stuck shut
c) Actuator failure
Fails to 'Alarm' state
a) Valve stuck open
SYSTEM - OILPROCESS DRAWING(S) - P & ID 005 Sheet 1 of 4
FAlLURE EFFECTS
Liquid level out of control, level alarms initiate ESD, inlet valve XEA2 closes. Process shutdown.
a) No eITed while running. Alarm on shutdown. Restart inhibited.
b) Start up inhibited (25%)
c) Valve closes (fail- safe). Process shutdown (50%).
ESD valve XEA2 closes Process shutdown.
a) No efiect, but LEA11 will initiate process shutdown if no action taken.
FORCEDOUTAGE FAIL RATE (FIYR)
0.12
0.26
0.35
0.26
REST0 RATION TIME (HRS)
24
8
2
8
2.88
1.56
0.7
2.08
Fig. 5 First-stage separator FMEA lor availability estimating
RELIABILITY ASSESSMENT OF MECHANICAL SYSTEMS 213
outpur 1
Filler Pump blockage f 'ulun. kilure
II Fdl!llle Of Failure of gTJTg
Fig. 6 Fault tree example
With the components data produced at step 5 the fault tree quantification can produce:
(a) the system failure probability, (b) the system failure rate and (c) the expected number of system failures.
Where failure and repair distributions have been speci- fied for the analysis, confidence intervals can be deter- mined at step 7. Step 8 produces the importance rankings for the basic event which identifies the com- ponents that provide the most significant contribution to system failure.
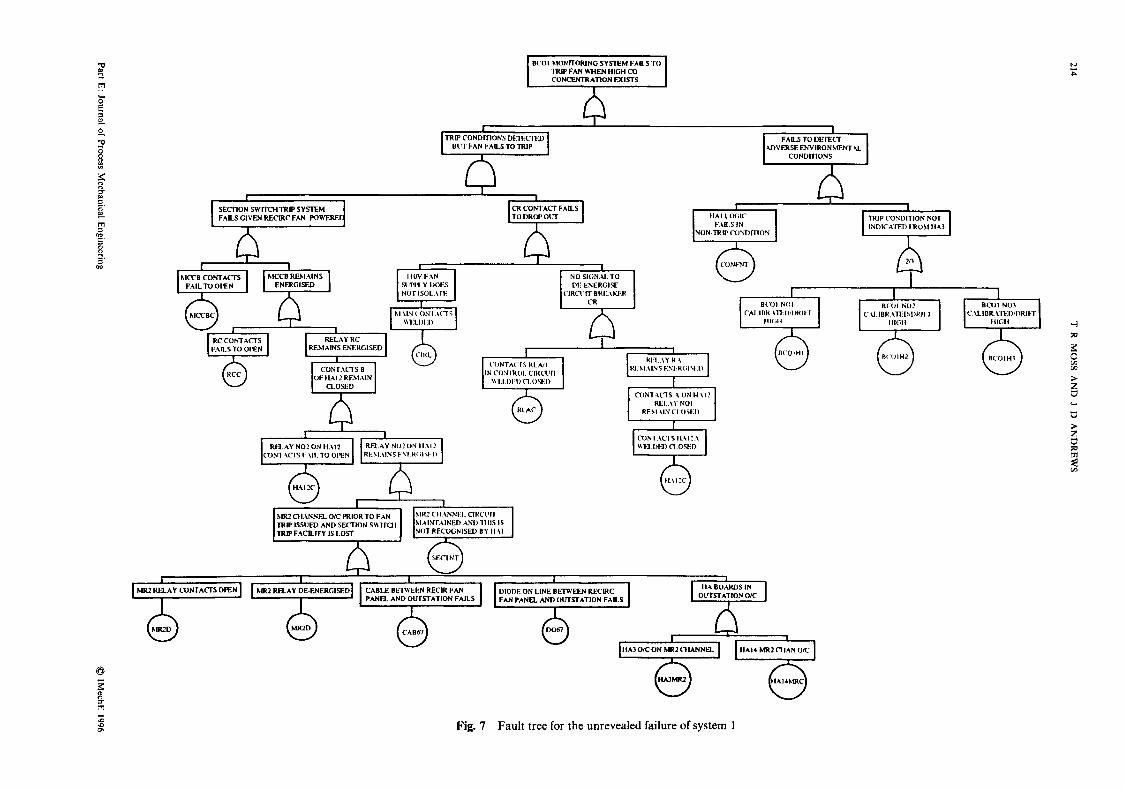
Fault trees are, of course, significantly more complex for real engineering systems than that illustrated in Fig. 6. Figure 7 shows part of a fault tree developed to rep- resent the failure of a ventilation recirculation control system in an under-sea mine. For this analysis it was required that ventilation recirculation was stopped in certain 'unsafe' conditions such as when carbon mon- oxide or methane was detected in the mine. Certain components in this study were shown to have failure times that were represented by the Weibull distribution and an accurate analysis would therefore require the solution of equations (3).
The main use of fault trees is in safety and risk studies. Fault trees provide a useful representation of the different failure paths which can lead to unavail- ability of systems and plant even without considering failure and repair data-which may provide some ditli- culties. In many cases, therefore, fault trees and failure mode and effect analysis will be employed in combination-the FMEA to define the consequences of specific equipment failures and the fault tree (or possibly several fault trees) to identify and quantify the paths that lead to plant unavailability.
6 SIMULATION An alternative approach to system assessment, which requires no simplifying assumptions to be made regard- @ IMechE 1996
ing independence of failure and repair events or the form of the distributions, is simulation. It is a computer intensive approach which is now becoming more popular due to the continuous advances being made in computer technology. This has resulted in the pro- cessing power required for simulation to be available at relatively modest prices.
The simulation technique, due to its generic nature, can offer some useful features appropriate to mechani- cal systems. The first is the ability to model any form of distribution for failure and repair times. As outlined above, it is possible to accommodate this requirement within the fault tree analysis technique. However, as far as the authors are aware, none of the available com- mercial codes features this capability.
Maintenance activity has a very important influence on the reliability of mechanical systems. Simulation can model scheduled maintenance outages, maintenance activity prioritization and queuing of repair jobs. Over the coming years it is highly likely that this technique will provide the most appropriate means of analysis for mechanical systems.
7 FACTORS AFFECTING MECHANICAL SYSTEM ASSESSMENTS
The steps in the reliability assessment of a plant or system are summarized in Section 4. More details of these steps are given in references (9) and (II), which also provide example case studies of their application in availability assessments. As noted in these case studies and reiterated in this paper, a major cause of uncer- tainty in the prediction of mechanical system avail- ability is data. Failure rate data for large, complex items of mechanical plant are a particular problem because of uncertainties concerning the boundaries and the operating/environmental conditions of the items from which the generic failure rates were derived. Mean outage times (repair and waiting times), which are necessary to predict item availability, can also pose problems since they depend on the equipment design and the variety of conditions peculiar to each plant. These include the operations and maintenance policy, availability of spares, access for maintenance and many other factors.
Maintainability analysis is essential for mechanical system assessments and unfortunately is an area largely ignored by reliability specialists. Some useful research has been carried out in one or two limited areas, for example the subjective analysis by Thompson (12) of pipe couplings. The OREDA (Ofshore Reliability Data) Handbook (13) includes estimates of repair times in addition to failure rates for quite a wide range of mechanical equipment, and since this is a very specific functional environment associated with clear definitions of system boundaries the data may be employed in global assessments with some degree of confidence.
The basic requirement is for assurance that the differ- ent factors that can affect the reliability performance of an equipment in a specified environment have been con- sidered and their effect on generic failure and repair rates evaluated. The objective should be to identify the degradation mechanisms that could apply in each case and then to assess the tolerance of the system to such mechanisms and the compensating provisions in the
Proc Instn Mech Engrs Vol 210
214 T
R MO
SS AN
D J D
AN
DR
EW
S
a
CI
Part E
: Journal of Process Mechanical E
ngineering @
IMechE
1996

PRV
1.2
0.6
4.0
12.0
4.8
0.2
1 .o
M R V Pneumatic
4.2
5.1
12.0
19.9
12.6
2.8
32.2
Hand
1 .a
3.3
0.6
2.1
11.5
1.8
1.7
7.7
AMMONIA PLANT DISTRIBUTION OF EQUIPMENT DOWN TIMES (HOURSPEAR) -
Est'd
Ez - 7.3
5.7
4.8
4.9
4.9
3.7
3.0
3.1
2.2
1.9 - - 41Jd
UNIT Rotating Machinery Valves Heat Exchanger
S
Boiler Units
Est'd Hours LDsl Turbines
~ ~~
Compressor S
Other
03
13
08
12
15
09
14
02
01
10
Steam Boilers
mpressor
Raw-Syngas
N, Compressor
Refrigeration
Rectisol
NH, Synthesis
Air Conipresors
Air Separation
CO Conveaion
Compressors
175.2 175.2
137.1
115.0
118.5
118.6
87.7
72.9
73.5
51.9
45.7
155%
12.1%
10.2%
10.4%
10.4%
7.9%
6.5%
6.6%
4.7%
4.1%
84
42
42
42
21
43
60
38
38
22.5
2.9
3.6
2.9
12.5
40.0
58.3
1.5
2.1
36.0
0.4
2.0
8.0
3.6
4.0
29
3.5
23
2.7
2.0 3.6 I y 2.6% 1.7%
Estimated Hours LDst 23 1 58.2 175.2 820.9h 159.8
6.7
201.5
8.4
17.9%
Estimated Days Lost 9.6 2.4 7.3 ~ ~
5.1% ~
14.3% % of Total Esiimated LDst Days
20.4% 15.5% 88.4% 7.9% 3.0%
14.3% ~~
15.5% 43.4% 15.2%
88.4%
Fig. 8 Analysis of predicted plant outages
2 16 T R MOSS AND J D ANDREWS
design that could mitigate their effects. For example, the principal degradation mechanisms likely to influence reliability performance of a large, continuously operated gas turbine driving a high-speed centrifugal hydrocar-
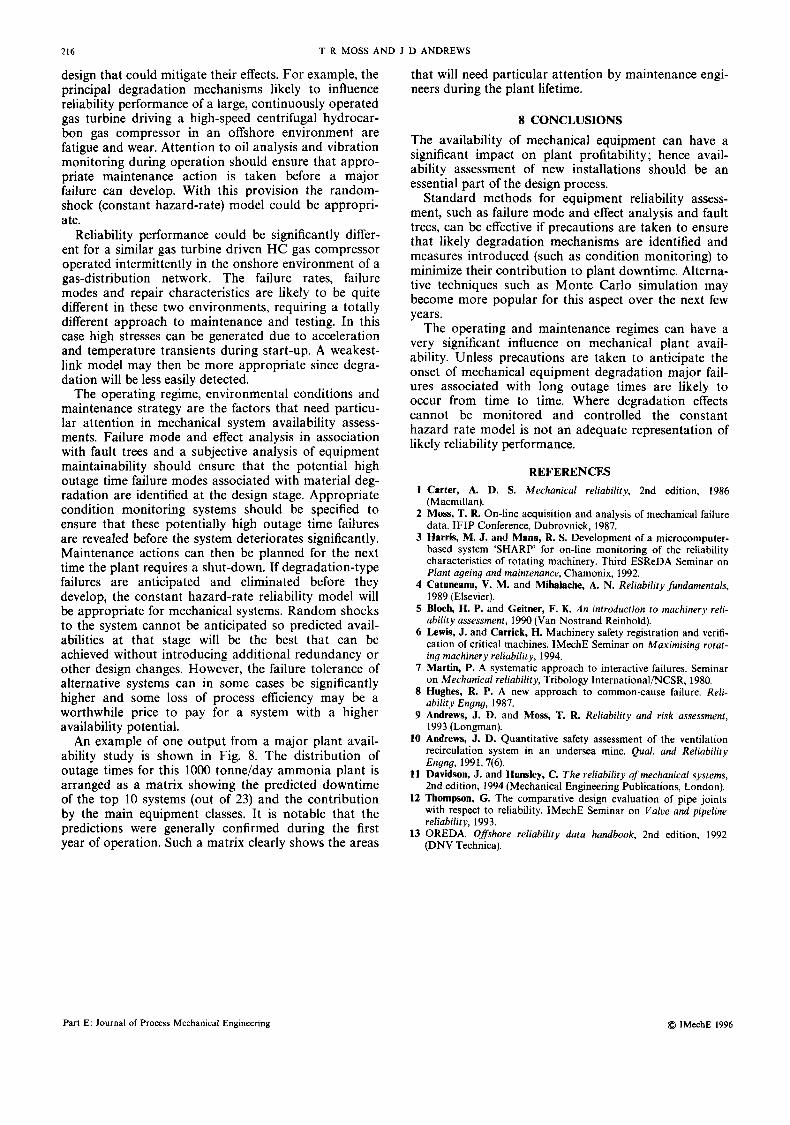
that will need particular attention by maintenance engi- neers during the plant lifetime.
8 CONCLUSIONS bon gas compressor in an offshore environment are fatigue and wear. Attention to oil analysis and vibration monitoring during operation should ensure that appro- priate maintenance action is taken before a major failure can develop. With this provision the random- shock (constant hazard-rate) model could be appropri- ate.
Reliability performance could be significantly differ- ent for a similar gas turbine driven HC gas compressor operated intermittently in the onshore environment of a gas-distribution network. The failure rates, failure modes and repair characteristics are likely to be quite different in these two environments, requiring a totally different approach to maintenance and testing. In this case high stresses can be generated due to acceleration and temperature transients during start-up. A weakest- link model may then be more appropriate since degra- dation will be less easily detected.
The operating regime, environmental conditions and maintenance strategy are the factors that need particu- lar attention in mechanical system availability assess- ments. Failure mode and effect analysis in association with fault trees and a subjective analysis of equipment maintainability should ensure that the potential high outage time failure modes associated with material deg- radation are identified at the design stage. Appropriate condition monitoring systems should be specified to ensure that these potentially high outage time failures are revealed before the system deteriorates significantly. Maintenance actions can then be planned for the next time the plant requires a shut-down. If degradation-type failures are anticipated and eliminated before they develop, the constant hazard-rate reliability model will be appropriate for mechanical systems. Random shocks to the system cannot be anticipated so predicted avail- abilities at that stage will be the best that can be achieved without introducing additional redundancy or other design changes. However, the failure tolerance of alternative systems can in some cases be significantly higher and some loss of process efficiency may be a worthwhile price to pay for a system with a higher availability potential.
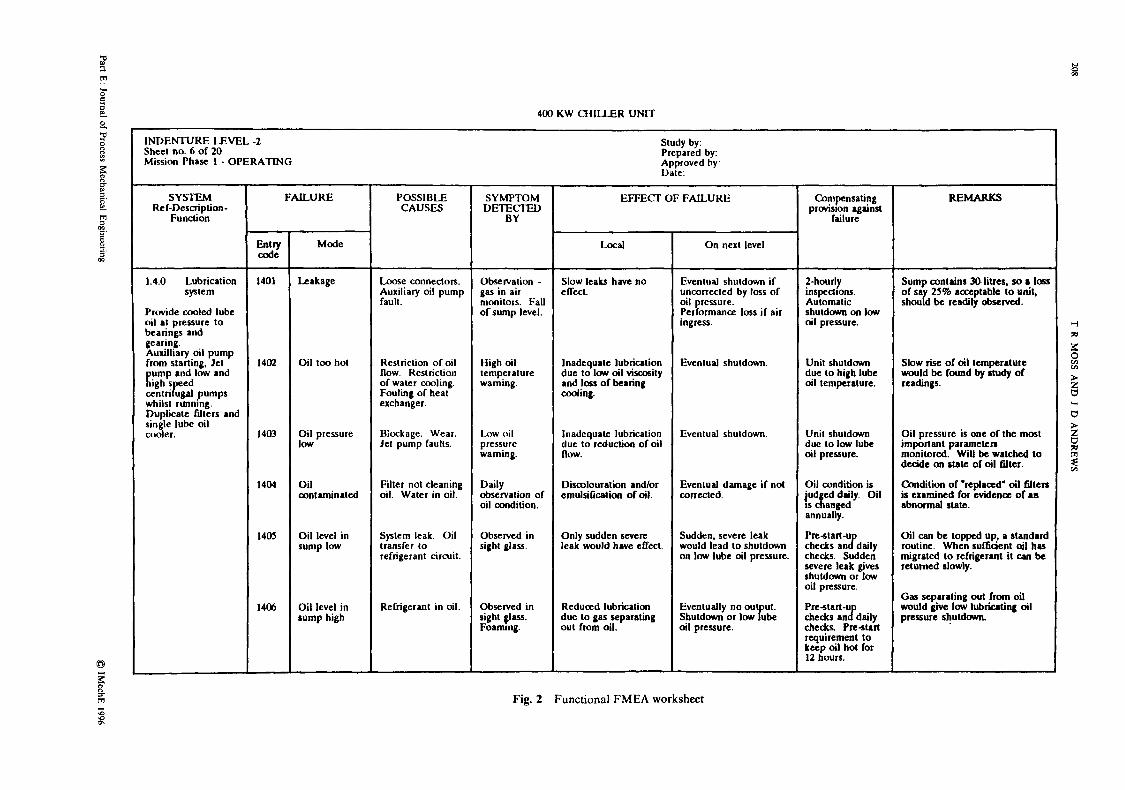
An example of one output from a major plant avail- ability study is shown in Fig. 8. The distribution of outage times for this 1000 tonne/day ammonia plant is arranged as a matrix showing the predicted downtime of the top 10 systems (out of 23) and the contribution by the main equipment classes. It is notable that the predictions were generally confirmed during the first year of operation. Such a matrix clearly shows the areas
The availability of mechanical equipment can have a significant impact on plant profitability; hence avail- ability assessment of new installations should be an essential part of the design process.
Standard methods for equipment reliability assess- ment, such as failure mode and effect analysis and fault trees, can be effective if precautions are taken to ensure that likely degradation mechanisms are identified and measures introduced (such as condition monitoring) to minimize their contribution to plant downtime. Alterna- tive techniques such as Monte Carlo simulation may become more popular for this aspect over the next few years.
The operating and maintenance regimes can have a very significant influence on mechanical plant avail- ability. Unless precautions are taken to anticipate the onset of mechanical equipment degradation major fail- ures associated with long outage times are likely to occur from time to time. Where degradation effects cannot be monitored and controlled the constant hazard rate model is not an adequate representation of likely reliability performance.
REFERENCES 1 Carter, A. D. S. Mechanical reliability, 2nd edition, 1986
(Macmillan). 2 Moss, T. R. On-line acquisition and analysis of mechanical failure
data. IFIP Conference, Dubrovnick, 1987. 3 Harris, M. J. and Mann, R. S. Development of a microcomputer-
based system ‘SHARP for on-line monitoring of the reliability characteristics of rotating machinery. Third ESReDA Seminar on Plant ageing and maintenance, Chamonix, 1992.
4 Catuneanu, V. M. and Mihalache, A. N. Reliability fundamentals, 1989 (Elsevier).
5 Bloch, H. P. and Geitner, F. K. An introduction to machinery reli- ability assessment, 1990 (Van Nostrand Reinhold).
6 Lewis, J. and Carrick, H. Machinery safety registration and verifi- cation of critical machines. IMechE Seminar on Maximising rotat- ing machinery reliability, 1994.
7 Martin, P. A systematic approach to interactive failures. Seminar on Mechanical reliability, Tribology International/NCSR, 1980.
8 Hughes, R. P. A new approach to common-cause failure. Reli- ability Engng, 1987.
9 Andrews, J. D. and Moss, T. R. Reliability and risk assessment, 1993 (Longman).
10 Andrews, J. D. Quantitative safety assessment of the ventilation recirculation system in an undersea mine. Qual. and Reliability Engng, 1991, 7(6).
11 Davidson, J. and Hunsley, C. The reliability of mechanical sysrems, 2nd edition, 1994 (Mechanical Engineering Publications, London).
12 Thompson, G. The comparative design evaluation of pipe joints with respect to reliability. IMechE Seminar on Value and pipeline reliability, 1993.
13 OREDA. Offshore reliability data handbook, 2nd edition, 1992 (DNV Technica).
Part E: Journal of Process Mechanical Engineering Q IMechE 1996