Embed Size (px)
Citation preview
Reliability and Usability in Data Transmission Networks of the AMR System: A Pilot Study
PETRI OKSA, MIKAEL SOINI, JUSSI NUMMELA, LAURI SYDÄNHEIMO, MARKKU
KIVIKOSKI Institute of Electronics
Tampere University of Technology, Rauma Research Unit Kalliokatu 2, FIN-26100 Rauma
FINLAND http://www.rauma.tut.fi/
Abstract: - This paper shows the results of the data transmission measurements in the automatic meter reading (AMR) system environment. The aim of the research was to examine the existing data transmission network and to explore significant quality factors in data transmission. Another part of the research focuses on usability and reliability of different data transmission networks for the AMR system. The results of the measurements show the profitability of data communication investigations at a time when new technologies are involved in meter reading requirements. Moreover, the measurement data analysis and information provide one essential way to test functionality of the communication alternatives between the consumption meter and the concentrator and also make it possible to adapt different types of communication methods. Key-Words: - Data transmission, Reliability, Usability, Measurement, Automatic meter reading 1 Introduction AMR systems provide access to the consumption and status of individual customers [1]. In addition to automated meter reading, AMR systems enable load balancing and distribution, rapid identification of power faults, and remote service activation or deactivation [2]. Energy companies can remotely read electricity, water, gas and district heat meters by using an AMR system. The consumption data is stored by the host computer and utilized, for instance, in billing operations. Broadband networks offers new opportunities to enhance added value in the meter reading and companies can improve their real-time billing operations and also achieve cost-effective solutions in this market area.
AMR is much more than replacing consumption meters and providing more accurate customer bills. It is a pivotal information source that used effectively can drive company efficiencies within Transmission and Distribution (T&D) operations, asset management, customer service, and energy efficiency [3]. However, very few of the energy companies design their AMR system infrastructure on the basis of any studies about data transmission or its specific details. This was an important factor in approaching the measurement aspects of this research especially when companies develop new network structures.
AMR system investment has been shown to be a very economical decision. This can be demonstrated
by system investment calculations when the repayment period is about eight years. When adding costs of consumption meter replacement to these calculations, profitability decreases intrinsically and the repayment period increases to about ten years [4].
As stated earlier, AMR does not only make its acquisition profitable, it has several other benefits: added value in customer service satisfaction, more realistic cash flow and fewer ambiguities in the billing operations. Risks were included in the investment calculations. The most remarkable attribute of these primary profitability components are too high total investment and change in the interest rate [3], [4].
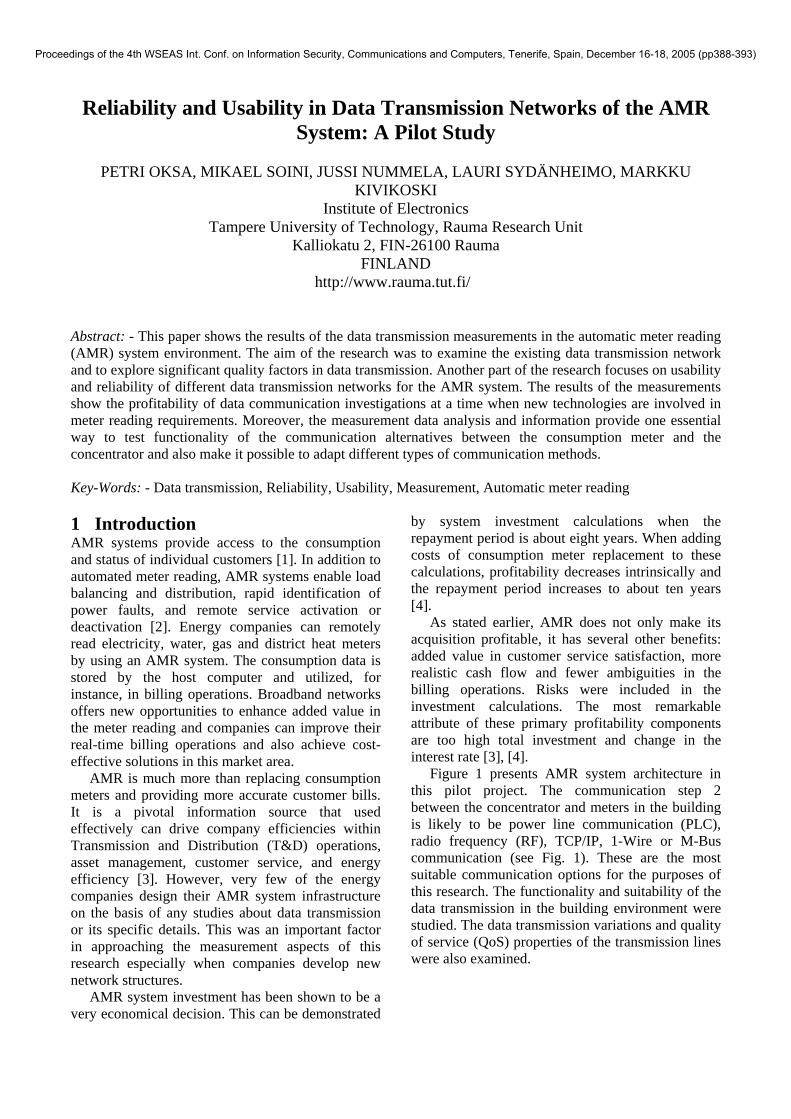
Figure 1 presents AMR system architecture in this pilot project. The communication step 2 between the concentrator and meters in the building is likely to be power line communication (PLC), radio frequency (RF), TCP/IP, 1-Wire or M-Bus communication (see Fig. 1). These are the most suitable communication options for the purposes of this research. The functionality and suitability of the data transmission in the building environment were studied. The data transmission variations and quality of service (QoS) properties of the transmission lines were also examined.
Proceedings of the 4th WSEAS Int. Conf. on Information Security, Communications and Computers, Tenerife, Spain, December 16-18, 2005 (pp388-393)
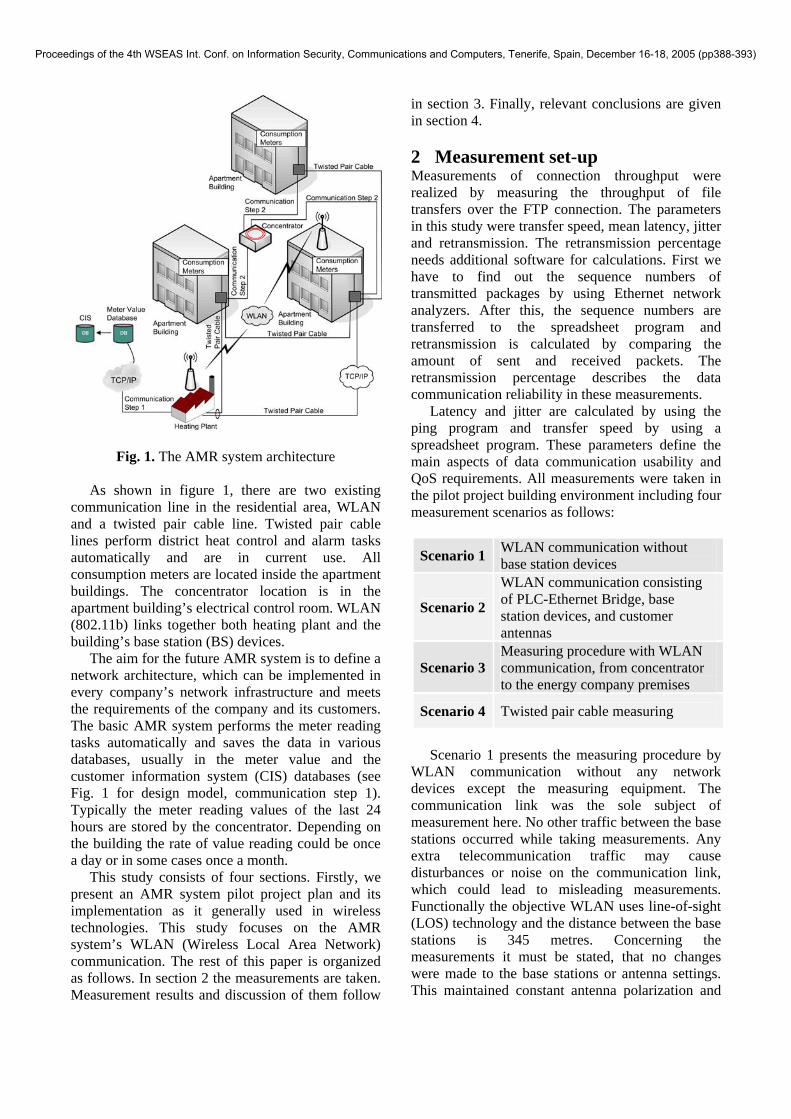
Fig. 1. The AMR system architecture
As shown in figure 1, there are two existing communication line in the residential area, WLAN and a twisted pair cable line. Twisted pair cable lines perform district heat control and alarm tasks automatically and are in current use. All consumption meters are located inside the apartment buildings. The concentrator location is in the apartment building’s electrical control room. WLAN (802.11b) links together both heating plant and the building’s base station (BS) devices.
The aim for the future AMR system is to define a network architecture, which can be implemented in every company’s network infrastructure and meets the requirements of the company and its customers. The basic AMR system performs the meter reading tasks automatically and saves the data in various databases, usually in the meter value and the customer information system (CIS) databases (see Fig. 1 for design model, communication step 1). Typically the meter reading values of the last 24 hours are stored by the concentrator. Depending on the building the rate of value reading could be once a day or in some cases once a month.
This study consists of four sections. Firstly, we present an AMR system pilot project plan and its implementation as it generally used in wireless technologies. This study focuses on the AMR system’s WLAN (Wireless Local Area Network) communication. The rest of this paper is organized as follows. In section 2 the measurements are taken. Measurement results and discussion of them follow
in section 3. Finally, relevant conclusions are given in section 4. 2 Measurement set-up Measurements of connection throughput were realized by measuring the throughput of file transfers over the FTP connection. The parameters in this study were transfer speed, mean latency, jitter and retransmission. The retransmission percentage needs additional software for calculations. First we have to find out the sequence numbers of transmitted packages by using Ethernet network analyzers. After this, the sequence numbers are transferred to the spreadsheet program and retransmission is calculated by comparing the amount of sent and received packets. The retransmission percentage describes the data communication reliability in these measurements.
Latency and jitter are calculated by using the ping program and transfer speed by using a spreadsheet program. These parameters define the main aspects of data communication usability and QoS requirements. All measurements were taken in the pilot project building environment including four measurement scenarios as follows:
Scenario 1 WLAN communication without base station devices
Scenario 2
WLAN communication consisting of PLC-Ethernet Bridge, base station devices, and customer antennas
Scenario 3 Measuring procedure with WLAN communication, from concentrator to the energy company premises
Scenario 4 Twisted pair cable measuring
Scenario 1 presents the measuring procedure by
WLAN communication without any network devices except the measuring equipment. The communication link was the sole subject of measurement here. No other traffic between the base stations occurred while taking measurements. Any extra telecommunication traffic may cause disturbances or noise on the communication link, which could lead to misleading measurements. Functionally the objective WLAN uses line-of-sight (LOS) technology and the distance between the base stations is 345 metres. Concerning the measurements it must be stated, that no changes were made to the base stations or antenna settings. This maintained constant antenna polarization and
Proceedings of the 4th WSEAS Int. Conf. on Information Security, Communications and Computers, Tenerife, Spain, December 16-18, 2005 (pp388-393)
direction. Measurement arrangements in scenario 1 are shown in Fig. 2.
In the first scenario we constructed an environment to support the sending of certain data packets through the link. The size of the data packet was 50 Mb (5248869 bits) including a mixed file bundle. For transferring the data packets we used WS_FTP software. The measuring procedure was implemented so that the data packet was firstly sent in the downlink direction and then in the uplink direction. Thus, one PC operated as the FTP-client and the other PC as the FTP-server (see Fig. 2). The main purpose of implementation as shown in figure 2 was to get reference values for measurements in further scenarios.
Fig. 2. Scenario 1
In scenario 2, a PLC-Ethernet Bridge, base
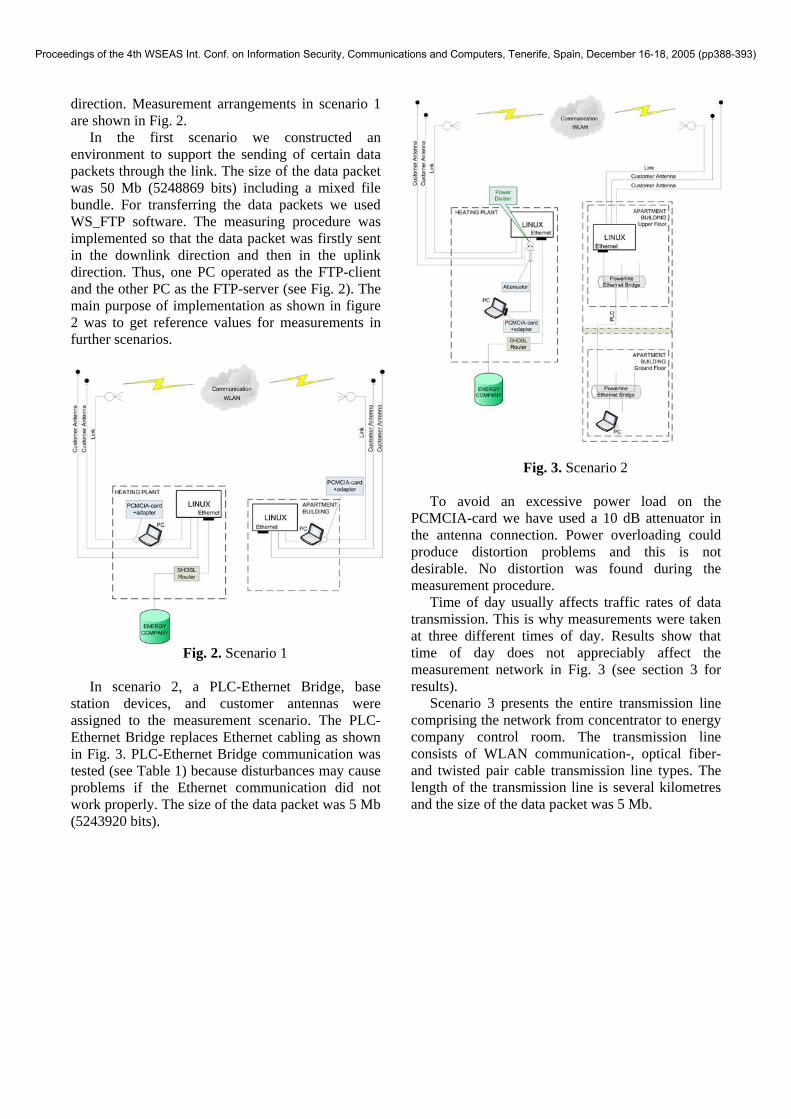
station devices, and customer antennas were assigned to the measurement scenario. The PLC-Ethernet Bridge replaces Ethernet cabling as shown in Fig. 3. PLC-Ethernet Bridge communication was tested (see Table 1) because disturbances may cause problems if the Ethernet communication did not work properly. The size of the data packet was 5 Mb (5243920 bits).
Fig. 3. Scenario 2
To avoid an excessive power load on the PCMCIA-card we have used a 10 dB attenuator in the antenna connection. Power overloading could produce distortion problems and this is not desirable. No distortion was found during the measurement procedure.
Time of day usually affects traffic rates of data transmission. This is why measurements were taken at three different times of day. Results show that time of day does not appreciably affect the measurement network in Fig. 3 (see section 3 for results).
Scenario 3 presents the entire transmission line comprising the network from concentrator to energy company control room. The transmission line consists of WLAN communication-, optical fiber- and twisted pair cable transmission line types. The length of the transmission line is several kilometres and the size of the data packet was 5 Mb.
Proceedings of the 4th WSEAS Int. Conf. on Information Security, Communications and Computers, Tenerife, Spain, December 16-18, 2005 (pp388-393)
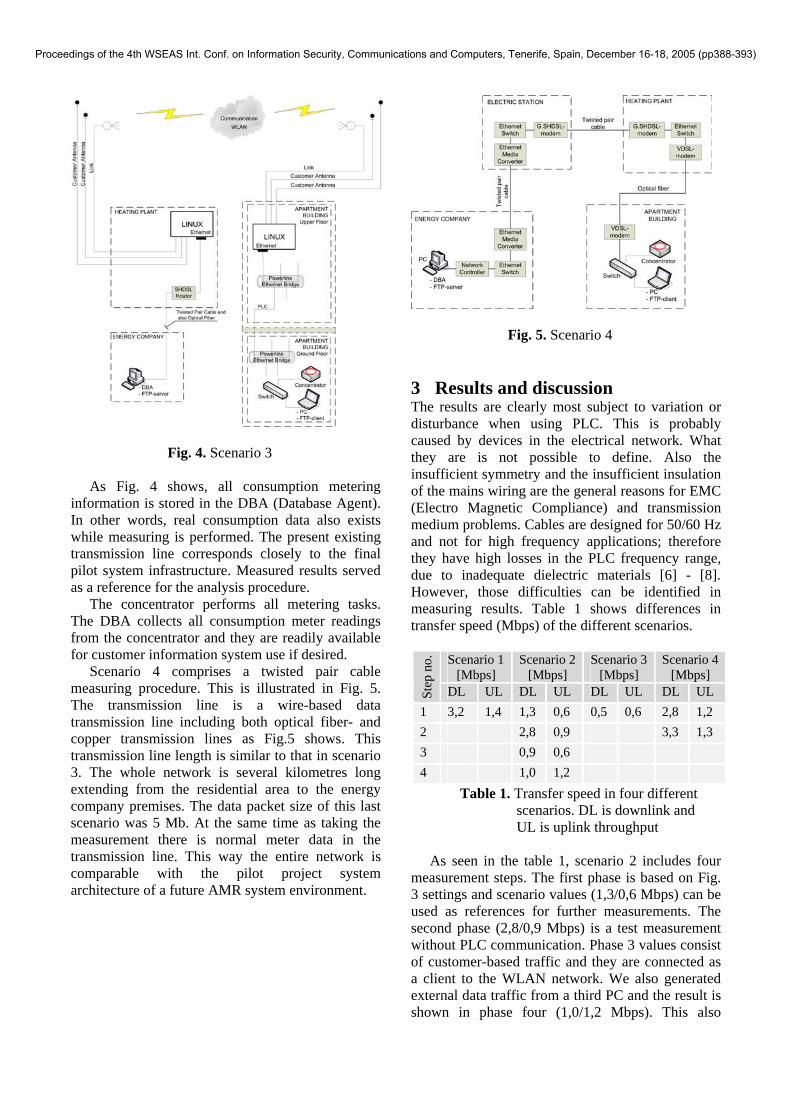
Fig. 4. Scenario 3
As Fig. 4 shows, all consumption metering information is stored in the DBA (Database Agent). In other words, real consumption data also exists while measuring is performed. The present existing transmission line corresponds closely to the final pilot system infrastructure. Measured results served as a reference for the analysis procedure.
The concentrator performs all metering tasks. The DBA collects all consumption meter readings from the concentrator and they are readily available for customer information system use if desired.
Scenario 4 comprises a twisted pair cable measuring procedure. This is illustrated in Fig. 5. The transmission line is a wire-based data transmission line including both optical fiber- and copper transmission lines as Fig.5 shows. This transmission line length is similar to that in scenario 3. The whole network is several kilometres long extending from the residential area to the energy company premises. The data packet size of this last scenario was 5 Mb. At the same time as taking the measurement there is normal meter data in the transmission line. This way the entire network is comparable with the pilot project system architecture of a future AMR system environment.
Fig. 5. Scenario 4 3 Results and discussion The results are clearly most subject to variation or disturbance when using PLC. This is probably caused by devices in the electrical network. What they are is not possible to define. Also the insufficient symmetry and the insufficient insulation of the mains wiring are the general reasons for EMC (Electro Magnetic Compliance) and transmission medium problems. Cables are designed for 50/60 Hz and not for high frequency applications; therefore they have high losses in the PLC frequency range, due to inadequate dielectric materials [6] - [8]. However, those difficulties can be identified in measuring results. Table 1 shows differences in transfer speed (Mbps) of the different scenarios.
Scenario 1 [Mbps]
Scenario 2 [Mbps]
Scenario 3 [Mbps]
Scenario 4 [Mbps]
Step
no.
DL UL DL UL DL UL DL UL 1 3,2 1,4 1,3 0,6 0,5 0,6 2,8 1,2 2 2,8 0,9 3,3 1,3 3 0,9 0,6 4 1,0 1,2
Table 1. Transfer speed in four different scenarios. DL is downlink and UL is uplink throughput
As seen in the table 1, scenario 2 includes four
measurement steps. The first phase is based on Fig. 3 settings and scenario values (1,3/0,6 Mbps) can be used as references for further measurements. The second phase (2,8/0,9 Mbps) is a test measurement without PLC communication. Phase 3 values consist of customer-based traffic and they are connected as a client to the WLAN network. We also generated external data traffic from a third PC and the result is shown in phase four (1,0/1,2 Mbps). This also
Proceedings of the 4th WSEAS Int. Conf. on Information Security, Communications and Computers, Tenerife, Spain, December 16-18, 2005 (pp388-393)
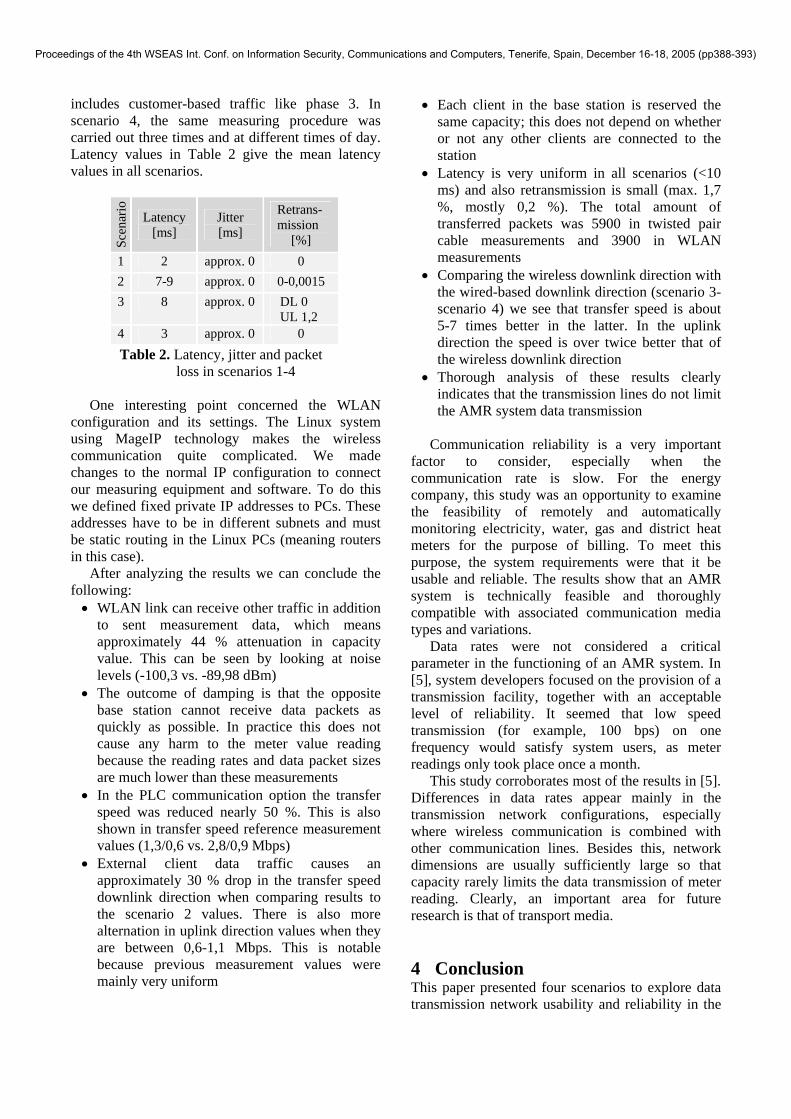
includes customer-based traffic like phase 3. In scenario 4, the same measuring procedure was carried out three times and at different times of day. Latency values in Table 2 give the mean latency values in all scenarios.
Scen
ario
Latency [ms]
Jitter [ms]
Retrans-mission
[%] 1 2 approx. 0 0 2 7-9 approx. 0 0-0,0015 3 8 approx. 0 DL 0
UL 1,2 4 3 approx. 0 0 Table 2. Latency, jitter and packet
loss in scenarios 1-4
One interesting point concerned the WLAN configuration and its settings. The Linux system using MageIP technology makes the wireless communication quite complicated. We made changes to the normal IP configuration to connect our measuring equipment and software. To do this we defined fixed private IP addresses to PCs. These addresses have to be in different subnets and must be static routing in the Linux PCs (meaning routers in this case).
After analyzing the results we can conclude the following: • WLAN link can receive other traffic in addition
to sent measurement data, which means approximately 44 % attenuation in capacity value. This can be seen by looking at noise levels (-100,3 vs. -89,98 dBm)
• The outcome of damping is that the opposite base station cannot receive data packets as quickly as possible. In practice this does not cause any harm to the meter value reading because the reading rates and data packet sizes are much lower than these measurements
• In the PLC communication option the transfer speed was reduced nearly 50 %. This is also shown in transfer speed reference measurement values (1,3/0,6 vs. 2,8/0,9 Mbps)
• External client data traffic causes an approximately 30 % drop in the transfer speed downlink direction when comparing results to the scenario 2 values. There is also more alternation in uplink direction values when they are between 0,6-1,1 Mbps. This is notable because previous measurement values were mainly very uniform
• Each client in the base station is reserved the same capacity; this does not depend on whether or not any other clients are connected to the station
• Latency is very uniform in all scenarios (<10 ms) and also retransmission is small (max. 1,7 %, mostly 0,2 %). The total amount of transferred packets was 5900 in twisted pair cable measurements and 3900 in WLAN measurements
• Comparing the wireless downlink direction with the wired-based downlink direction (scenario 3-scenario 4) we see that transfer speed is about 5-7 times better in the latter. In the uplink direction the speed is over twice better that of the wireless downlink direction
• Thorough analysis of these results clearly indicates that the transmission lines do not limit the AMR system data transmission
Communication reliability is a very important
factor to consider, especially when the communication rate is slow. For the energy company, this study was an opportunity to examine the feasibility of remotely and automatically monitoring electricity, water, gas and district heat meters for the purpose of billing. To meet this purpose, the system requirements were that it be usable and reliable. The results show that an AMR system is technically feasible and thoroughly compatible with associated communication media types and variations.
Data rates were not considered a critical parameter in the functioning of an AMR system. In [5], system developers focused on the provision of a transmission facility, together with an acceptable level of reliability. It seemed that low speed transmission (for example, 100 bps) on one frequency would satisfy system users, as meter readings only took place once a month.
This study corroborates most of the results in [5]. Differences in data rates appear mainly in the transmission network configurations, especially where wireless communication is combined with other communication lines. Besides this, network dimensions are usually sufficiently large so that capacity rarely limits the data transmission of meter reading. Clearly, an important area for future research is that of transport media. 4 Conclusion This paper presented four scenarios to explore data transmission network usability and reliability in the
Proceedings of the 4th WSEAS Int. Conf. on Information Security, Communications and Computers, Tenerife, Spain, December 16-18, 2005 (pp388-393)
AMR system environment. These measurements have proved that the transmission line is well-designed and that none of the data transmission reliability terms are threatened. Because there is sufficient capacity, control and alarm data can also be transferred without effect of transmissions. The results of the measurements demonstrate good usability in different network configurations. In addition, this enables companies to improve their AMR system and also achieve more reliable transmission line infrastructures.
The present study investigated data transmission from apartment building to energy company. More research should be undertaken to determine exact details of communication options from the consumption meter to the concentrator. Future research work should also examine meter reading reliability and monitoring. Results from these analyses can be used for selecting the optimal meter reading option for sparsely populated areas or densely populated districts in towns and cities. References: [1] Y. Liu, R.A. Fischer, N.N. Schulz,
“Distribution System Outage and Restoration Analysis Using a wireless AMR System,” IEEE Power Engineering Society Winter Meeting, vol. 2, pp. 871 – 875, January 2002
[2] C. Brasek, “Urban utilities warm up to the idea of wireless automatic meter reading,” IEE Computing & Control Engineering Journal, vol. 15, pp. 10 – 14, December 2004 - January 2005
[3] I. Steklac, H. Tram, “How to Maximize the Benefits of AMR Enterprise-Wide,” IEEE Rural Electric Power Conference, Page(s): C5/1 - C5/7, May 2005
[4] P. Laitinen, “Automatic Meter Reading of Electricity as an Investment Project,” Master of Science Thesis, 59 pages, October 2004
[5] Metering International., http://www.metering.com/archive/031/36_1.htm
[6] S. Battermann, H. Garbe, “Influence of PLC transmission on the Sensitivity of a Short-Wave Receiving Station,” IEEE Power Line Communications and Its Applications, 2005 International Symposium, Page(s): 224 - 227, April 2005
[7] B.S. Park, D.H. Hyun, S.K. Cho, “Implementation of AMR system using power line communication,” IEEE Transmission and Distribution Conference and Exhibition 2002: Asia Pacific, vol. 1, Page(s):18 - 21, October
2005 [8] K.Y. See, P.L. So, A. Kamarul, E. Gunawan,
“Radio-Frequency Common-Mode Noise Propagation Model for Power-Line Cable,” IEEE Transactions, Power Delivery, vol. 20, Page(s): 2443 - 2449, October 2005
Proceedings of the 4th WSEAS Int. Conf. on Information Security, Communications and Computers, Tenerife, Spain, December 16-18, 2005 (pp388-393)