Embed Size (px)
Citation preview
Reliability and Power Quality Standards and Frameworks Presented by Craig Savage
General Manager, Asset Management United Energy
API Power Engineering Summer School Feb 2016
United Energy and Multinet Gas
2
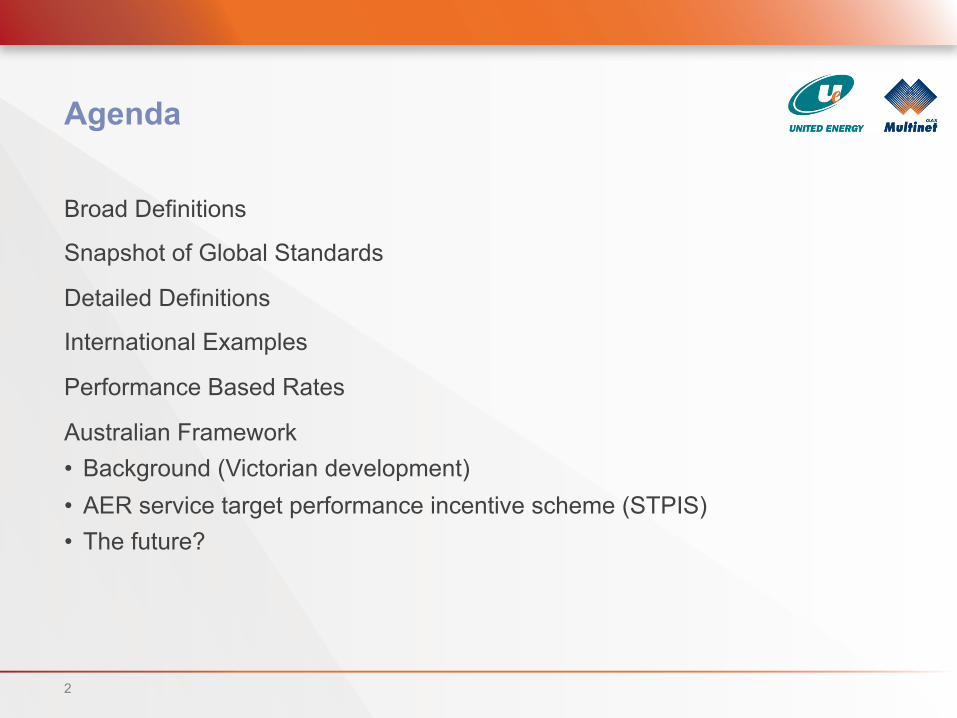
Agenda
Broad Definitions
Snapshot of Global Standards
Detailed Definitions
International Examples
Performance Based Rates
Australian Framework • Background (Victorian development) • AER service target performance incentive scheme (STPIS) • The future?
3
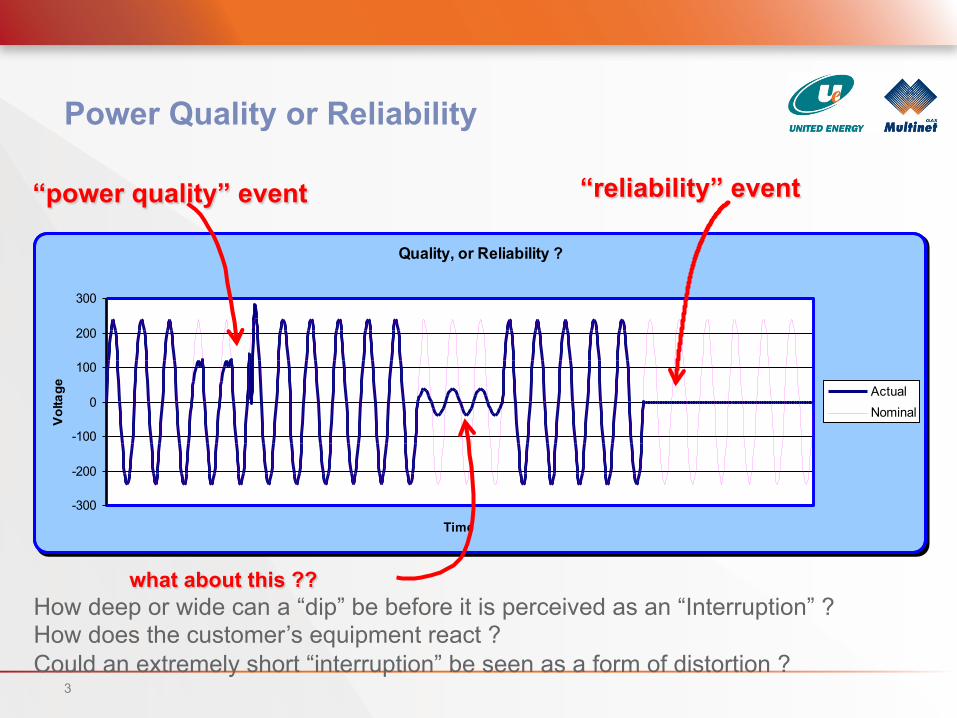
Quality, or Reliability ?
-300
-200
-100
0
100
200
300
Time
Vol
tage Actual
Nominal
Power Quality or Reliability
“power quality” event “reliability” event
what about this ?? How deep or wide can a “dip” be before it is perceived as an “Interruption” ? How does the customer’s equipment react ? Could an extremely short “interruption” be seen as a form of distortion ?
4
Power Quality or Reliability
So, to resolve these uncertainties, where customers’ equipment could react as if they’d experienced either an interruption or a disturbance, there is a generally accepted definition:
Power quality: • There is supply (includes interruptions of less than 1 minute) • How “pure” is the shape of the voltage waveform? • Concept of “Waveform Distortion”
Supply reliability: • There is no supply (for a period of at least 1 minute) • No voltage waveform • Concept of “interruption”
5
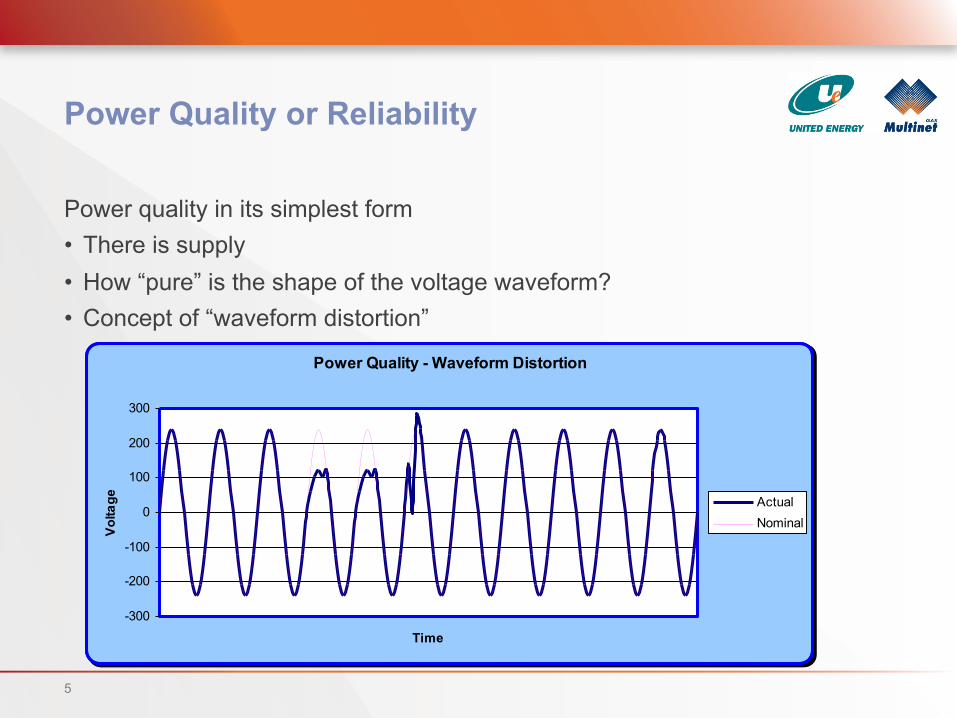
Power Quality or Reliability
Power quality in its simplest form • There is supply • How “pure” is the shape of the voltage waveform? • Concept of “waveform distortion”
Power Quality - Waveform Distortion
-300
-200
-100
0
100
200
300
Time
Volta
ge ActualNominal
6
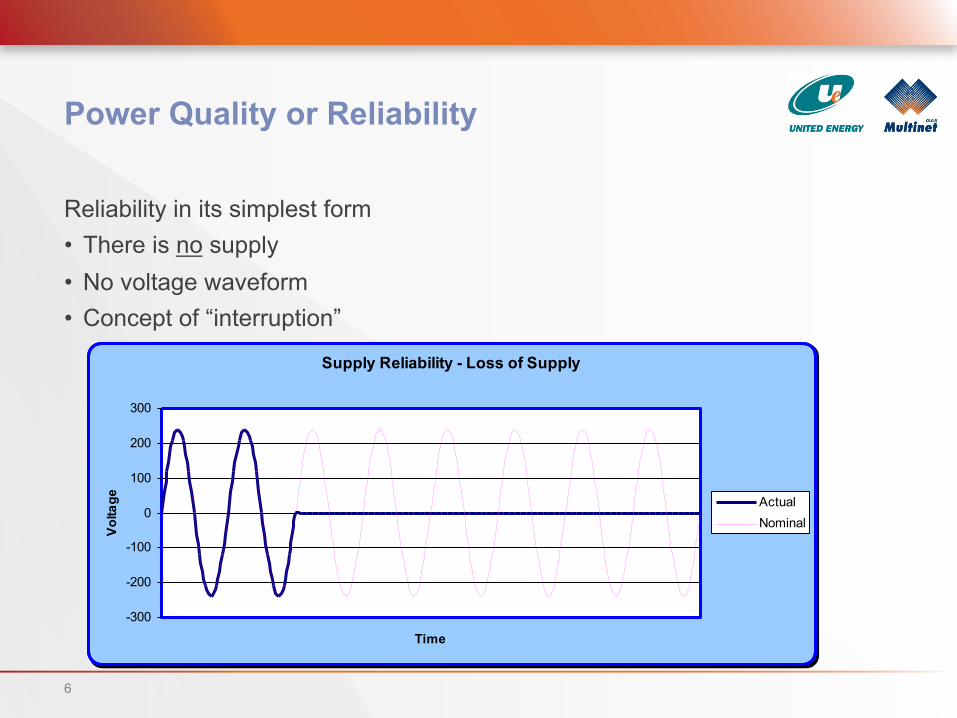
Power Quality or Reliability
Reliability in its simplest form • There is no supply • No voltage waveform • Concept of “interruption”
Supply Reliability - Loss of Supply
-300
-200
-100
0
100
200
300
Time
Volta
ge ActualNominal
7
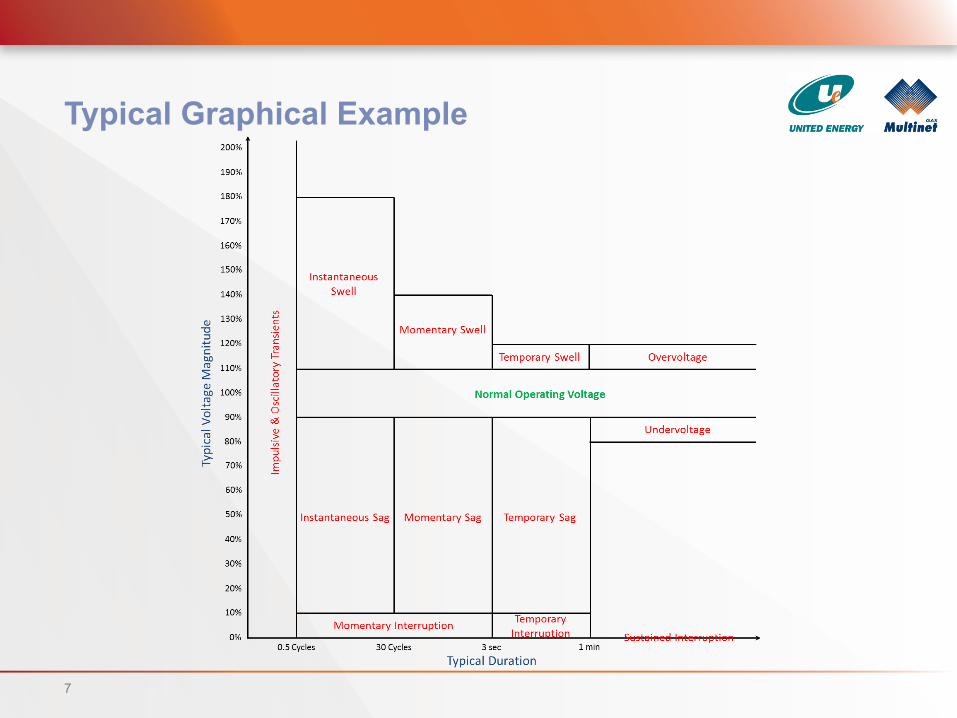
Typical Graphical Example
8
Agenda
Broad Definitions
Snapshot of Global Standards
Detailed Definitions
International Examples
Performance Based Rates
Australian Framework • Background (Victorian development) • AER service target performance incentive scheme (STPIS) • The future?
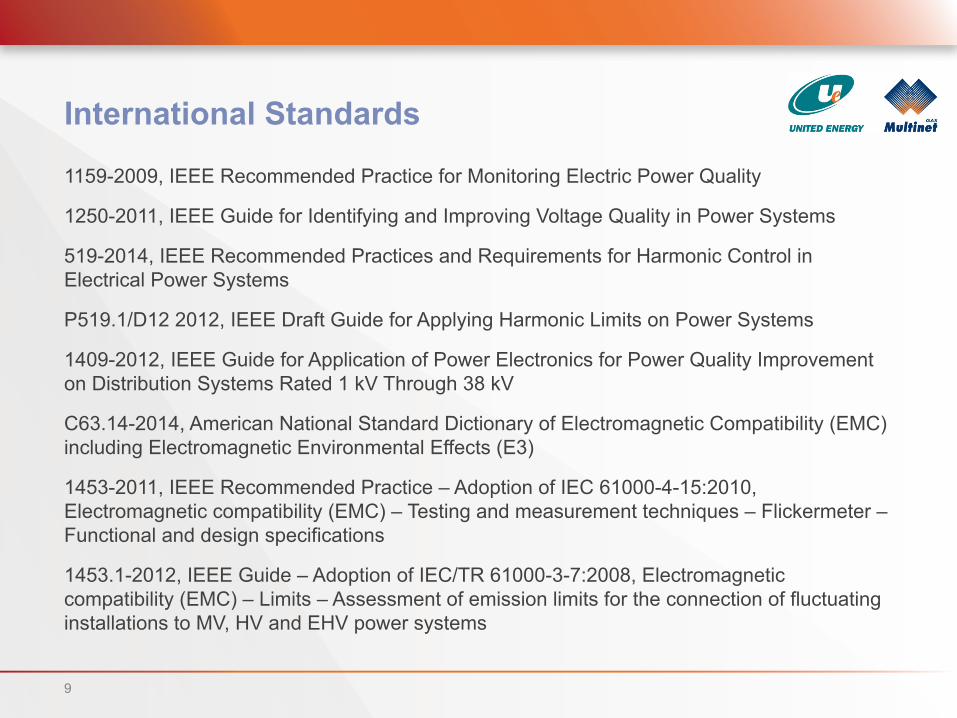
International Standards
1159-2009, IEEE Recommended Practice for Monitoring Electric Power Quality
1250-2011, IEEE Guide for Identifying and Improving Voltage Quality in Power Systems
519-2014, IEEE Recommended Practices and Requirements for Harmonic Control in Electrical Power Systems
P519.1/D12 2012, IEEE Draft Guide for Applying Harmonic Limits on Power Systems
1409-2012, IEEE Guide for Application of Power Electronics for Power Quality Improvement on Distribution Systems Rated 1 kV Through 38 kV
C63.14-2014, American National Standard Dictionary of Electromagnetic Compatibility (EMC) including Electromagnetic Environmental Effects (E3)
1453-2011, IEEE Recommended Practice – Adoption of IEC 61000-4-15:2010, Electromagnetic compatibility (EMC) – Testing and measurement techniques – Flickermeter – Functional and design specifications
1453.1-2012, IEEE Guide – Adoption of IEC/TR 61000-3-7:2008, Electromagnetic compatibility (EMC) – Limits – Assessment of emission limits for the connection of fluctuating installations to MV, HV and EHV power systems
9
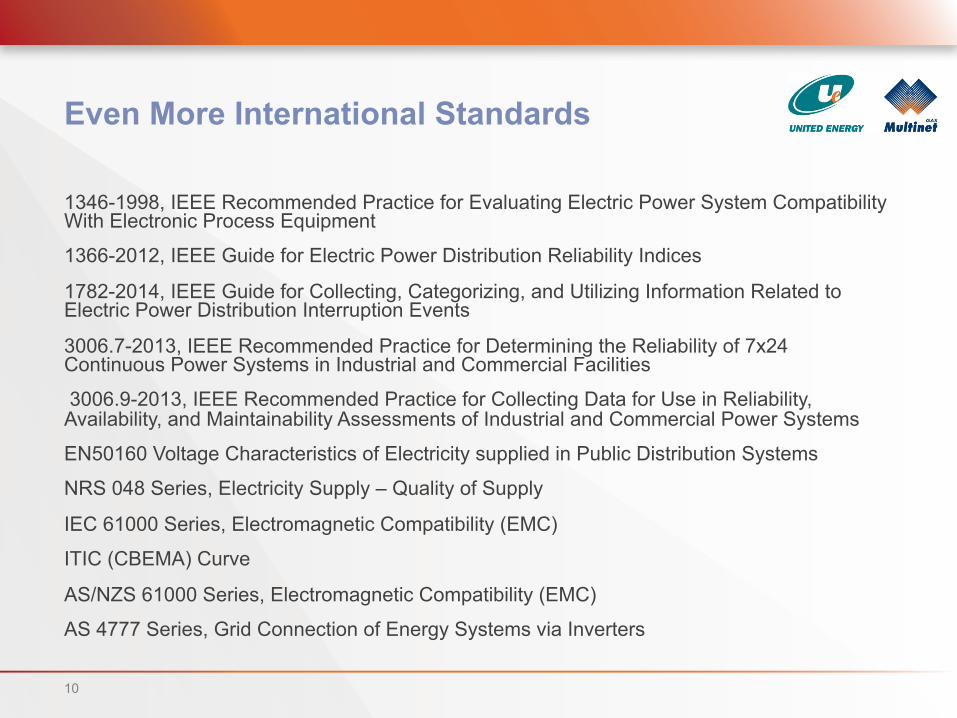
Even More International Standards
1346-1998, IEEE Recommended Practice for Evaluating Electric Power System Compatibility With Electronic Process Equipment
1366-2012, IEEE Guide for Electric Power Distribution Reliability Indices
1782-2014, IEEE Guide for Collecting, Categorizing, and Utilizing Information Related to Electric Power Distribution Interruption Events
3006.7-2013, IEEE Recommended Practice for Determining the Reliability of 7x24 Continuous Power Systems in Industrial and Commercial Facilities
3006.9-2013, IEEE Recommended Practice for Collecting Data for Use in Reliability, Availability, and Maintainability Assessments of Industrial and Commercial Power Systems
EN50160 Voltage Characteristics of Electricity supplied in Public Distribution Systems
NRS 048 Series, Electricity Supply – Quality of Supply
IEC 61000 Series, Electromagnetic Compatibility (EMC)
ITIC (CBEMA) Curve
AS/NZS 61000 Series, Electromagnetic Compatibility (EMC)
AS 4777 Series, Grid Connection of Energy Systems via Inverters
10
11
International Standards
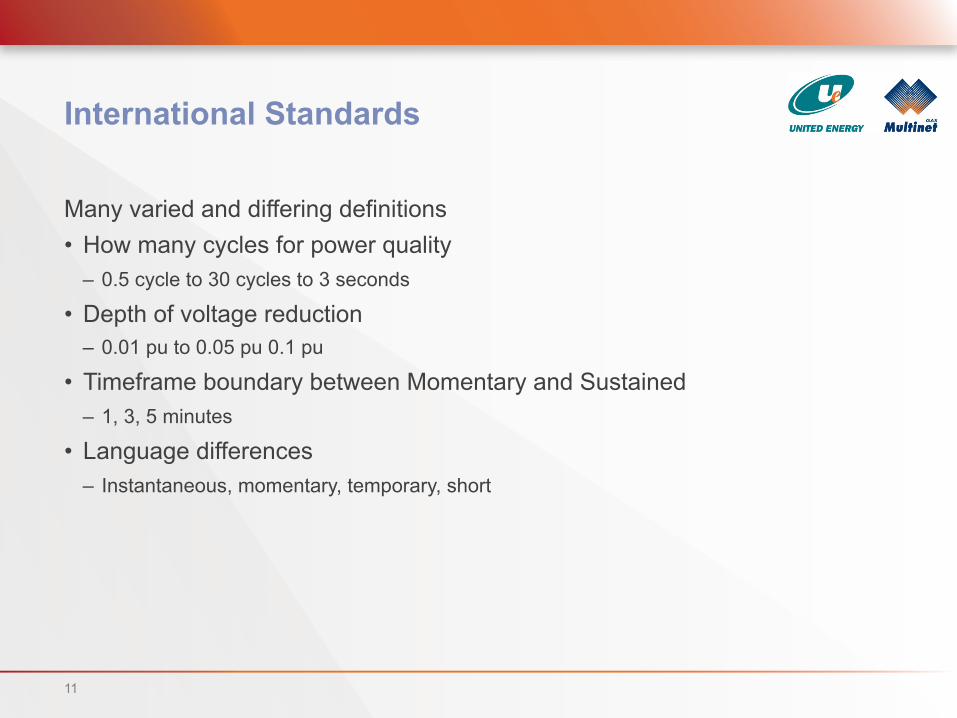
Many varied and differing definitions • How many cycles for power quality
– 0.5 cycle to 30 cycles to 3 seconds
• Depth of voltage reduction – 0.01 pu to 0.05 pu 0.1 pu
• Timeframe boundary between Momentary and Sustained – 1, 3, 5 minutes
• Language differences – Instantaneous, momentary, temporary, short
Steady State Voltage – The Issue
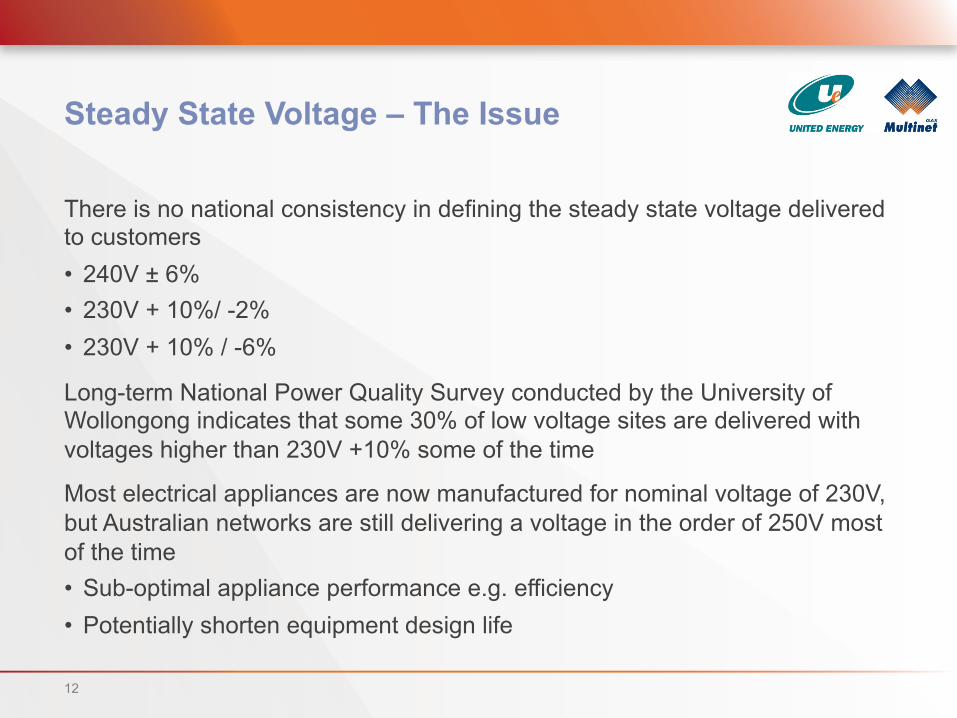
There is no national consistency in defining the steady state voltage delivered to customers • 240V ± 6% • 230V + 10%/ -2% • 230V + 10% / -6%
Long-term National Power Quality Survey conducted by the University of Wollongong indicates that some 30% of low voltage sites are delivered with voltages higher than 230V +10% some of the time
Most electrical appliances are now manufactured for nominal voltage of 230V, but Australian networks are still delivering a voltage in the order of 250V most of the time • Sub-optimal appliance performance e.g. efficiency • Potentially shorten equipment design life
12
AS61000.3.100 Voltage Standard
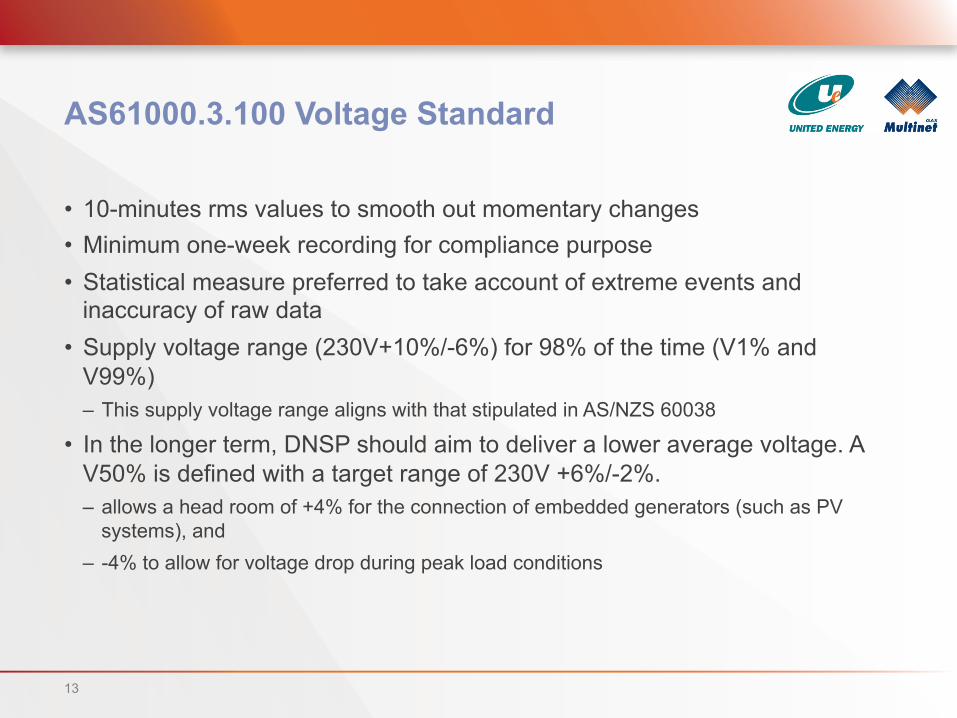
• 10-minutes rms values to smooth out momentary changes • Minimum one-week recording for compliance purpose • Statistical measure preferred to take account of extreme events and
inaccuracy of raw data • Supply voltage range (230V+10%/-6%) for 98% of the time (V1% and
V99%) – This supply voltage range aligns with that stipulated in AS/NZS 60038
• In the longer term, DNSP should aim to deliver a lower average voltage. A V50% is defined with a target range of 230V +6%/-2%. – allows a head room of +4% for the connection of embedded generators (such as PV
systems), and – -4% to allow for voltage drop during peak load conditions
13
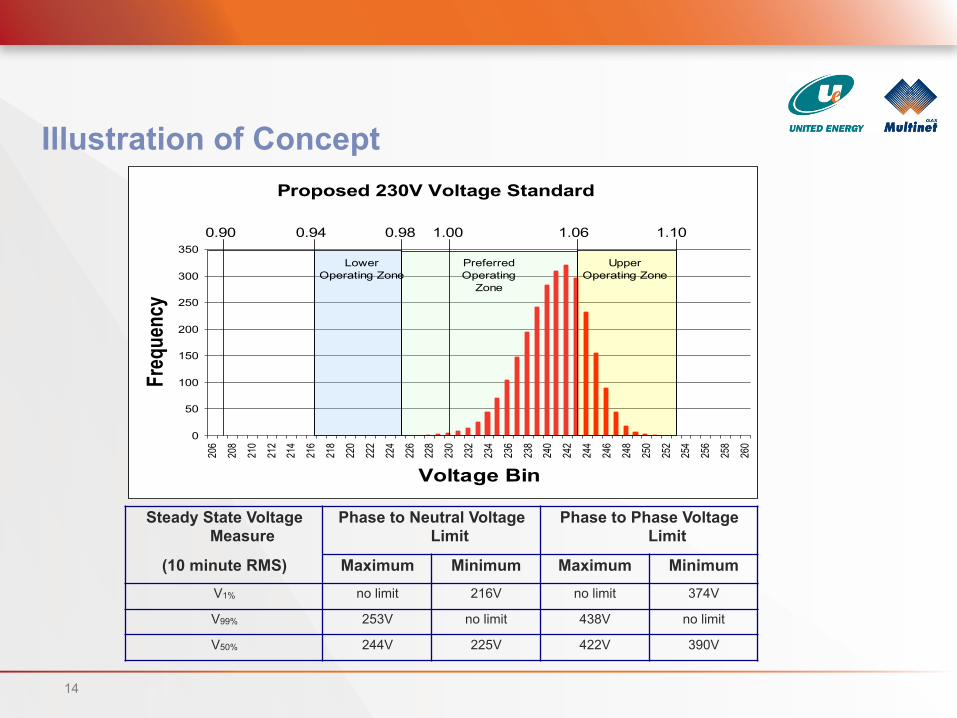
Illustration of Concept
Steady State Voltage Measure
Phase to Neutral Voltage Limit
Phase to Phase Voltage Limit
(10 minute RMS) Maximum Minimum Maximum Minimum
V1% no limit 216V no limit 374V
V99% 253V no limit 438V no limit
V50% 244V 225V 422V 390V
0
50
100
150
200
250
300
350
206
208
210
212
214
216
218
220
222
224
226
228
230
232
234
236
238
240
242
244
246
248
250
252
254
256
258
260
Voltage Bin
Freq
uenc
y
0.94 0.98 1.00 1.06 1.10
Upper Operating Zone
Preferred Operating
Zone
0.90
Lower Operating Zone
Proposed 230V Voltage Standard
14
15
Agenda
Broad Definitions
Snapshot of Global Standards
Detailed Definitions
International Examples
Performance Based Rates
Australian Framework • Background (Victorian development) • AER service target performance incentive scheme (STPIS) • The future?
16
Reliability Definitions (IEEE1366)
3.14 momentary interruption: A single operation of an interrupting device that results in a voltage zero. For example, two circuit breaker or recloser operations (each operation being an open followed by a close) that momentarily interrupts service to one or more customers is defined as two momentary interruptions.
3.15 momentary interruption event: An interruption of duration limited to the period required to restore service by an interrupting device.
NOTE—Such switching operations must be completed within a specified time of 5 min or less. This definition includes all reclosing operations that occur within five minutes of the first interruption. For example, if a recloser or circuit breaker operates two, three, or four times and then holds (within 5 min of the first operation), those momentary interruptions shall be considered one momentary interruption event.
3.21 sustained interruption: Any interruption not classified as a part of a momentary event. That is, any interruption that lasts more than 5 minutes.
17
Metric Definitions (IEEE1366)
4.2.1 System average interruption frequency index (SAIFI) • The system average interruption frequency index indicates how often the average
customer experiences a sustained interruption over a predefined period of time.
4.2.2 System average interruption duration index (SAIDI) • This index indicates the total duration of interruption for the average customer during a
predefined period of time. It is commonly measured in customer minutes or customer hours of interruption.
4.2.3 Customer average interruption duration index (CAIDI) • CAIDI represents the average time required to restore service. 4.4.1 Momentary average interruption frequency index (MAIFI) • This index indicates the average frequency of momentary interruptions. 4.4.2 Momentary average interruption event frequency index (MAIFIe) • This index indicates the average frequency of momentary interruption events. This index
does not include the events immediately preceding a lockout. 4.2.6 Average service availability index (ASAI) • The average service availability index represents the fraction of time (often in percentage)
that a customer has received power during the defined reporting period.
18
Customer Guidelines
4 documents
technical base document
business guide
residential guides • blackouts, glitches, flicker & hum (common power supply problems and how
to deal with them) • blackouts, glitches, flicker & hum (problem solver)
19
Ena Customer Guideline
Provides information on how electricity is supplied, the quality and reliability of electricity supply that can be expected from an electricity network, and steps that customers should take when they lose supply or believe that the quality of their supply is below an acceptable level.
PART 1 – Electricity Supply • describes the way in which electricity is supplied to customers and the roles of generators, transmission
companies, distribution companies and retailers.
PART 2 – Understanding your Load and Needs • describes the key items that customers need to understand about their load when negotiating a new or upgraded
connection to a Network Service Provider (NSP).
PART 3 – Network Reliability • describes how despite suppliers’ efforts to optimise the reliability of their power systems, customer interruptions to
electricity supply are inevitable and customers need to identify and manage the associated risks.
PART 4 – Network Power Quality • describes how the quality of the electricity provided to customers is not always suitable for use by all customer
equipment. The major power quality disturbance types are identified and discussed and the importance of purchasing electrical equipment with sufficient levels of power quality immunity is highlighted.
http://www.ena.asn.au/sites/default/files/ENA-Customer-Guide-to-Electricity-Supply1.pdf
ENA Power Quality Guidelines
ENA Doc 033-2014 Guideline for Power Quality: Harmonics Recommendations for the application of the Joint Aus/NZ Technical Report TR IEC 61000.3.6:2012 • provide a coherent and practical guide to the application of TR IEC
61000.3.6:2012, for limiting harmonic voltages in medium voltage (MV) and high voltage (HV) distribution networks
ENA Doc 034-2014 Guideline for Power Quality: Flicker - Recommendations for the application of the Joint Aus/NZ Technical Report TR IEC 61000.3.7:2012 • Guide to the application of TR IEC 61000.3.7:2012 for limiting voltage
fluctuations in medium voltage (MV) and high voltage (HV) distribution networks, and to present a simplified approach that a particular DNSP may elect to adopt
United Energy and Multinet Gas
20
ENA Power Quality Guidelines
ENA Doc 035-2014 Guideline for Power Quality: Inverter Energy Systems for Connection to Low Voltage Distribution Networks • Provide a simplified approach to managing the connection of low voltage
embedded generators
ENA Doc 037-2015 Guideline for Power Quality: Voltage Unbalance Recommendations for the application of the Joint Australian / New Zealand Technical Report TR IEC 61000.3.13:2012 • Guide to the application of the joint Australian/New Zealand Technical
Report, TR IEC 61000.3.13:2008 for limiting voltage unbalance in medium voltage (MV) and high voltage (HV) distribution networks and to present a simplified approach that a particular DNSP may elect to adopt
United Energy and Multinet Gas
21
22
Agenda
Broad Definitions
Snapshot of Global Standards
Detailed Definitions
International Examples
Performance Based Rates
Australian Framework • Background (Victorian development) • AER service target performance incentive scheme (STPIS) • The future?
23
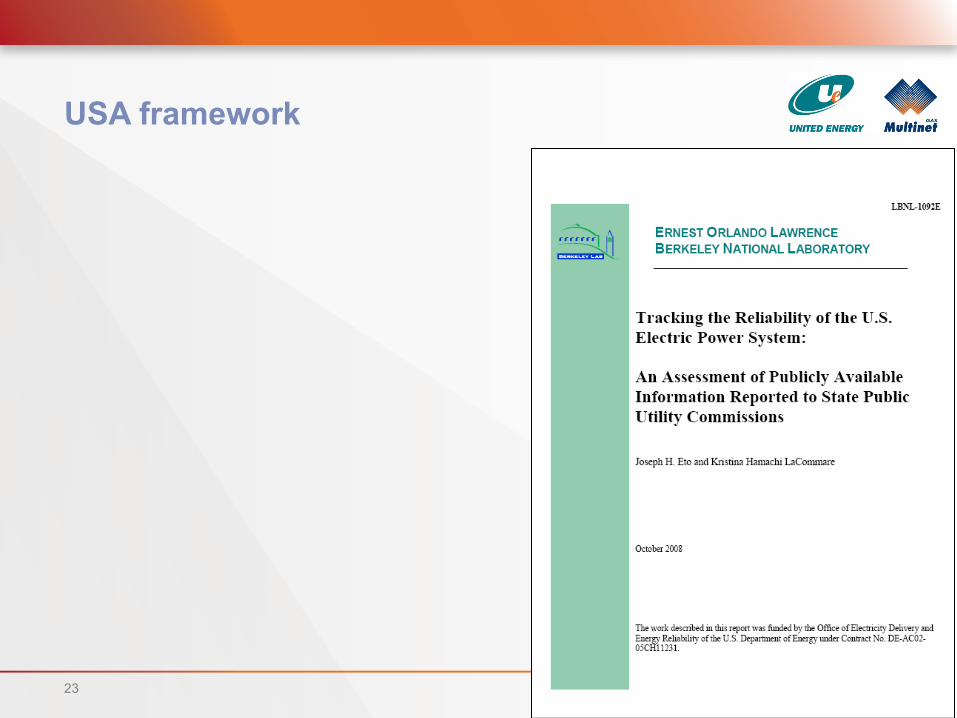
USA framework
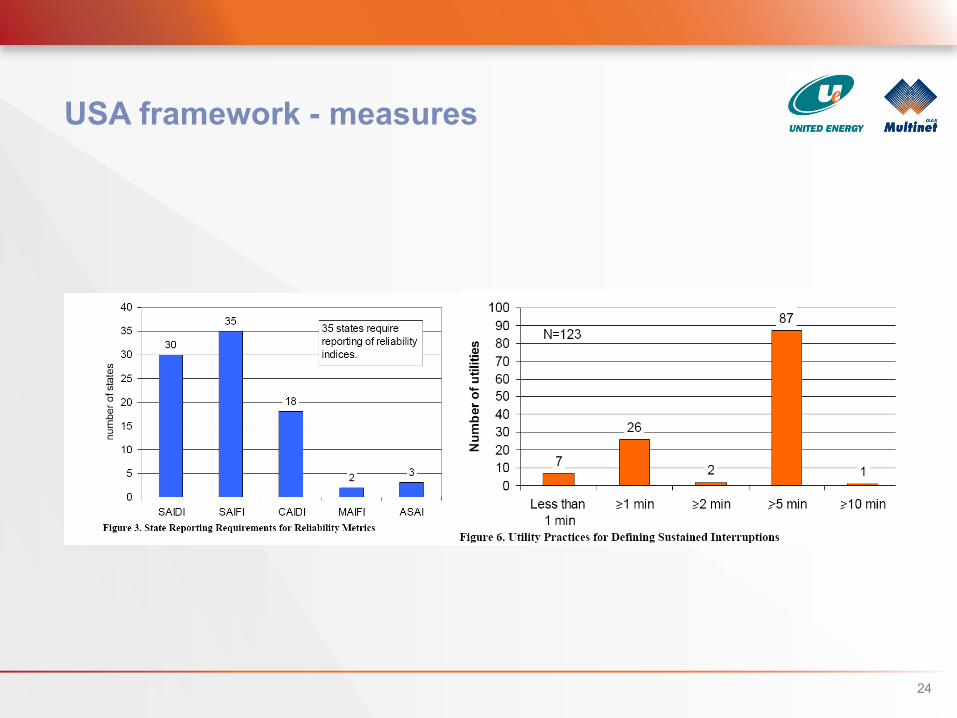
USA framework - measures
24
25
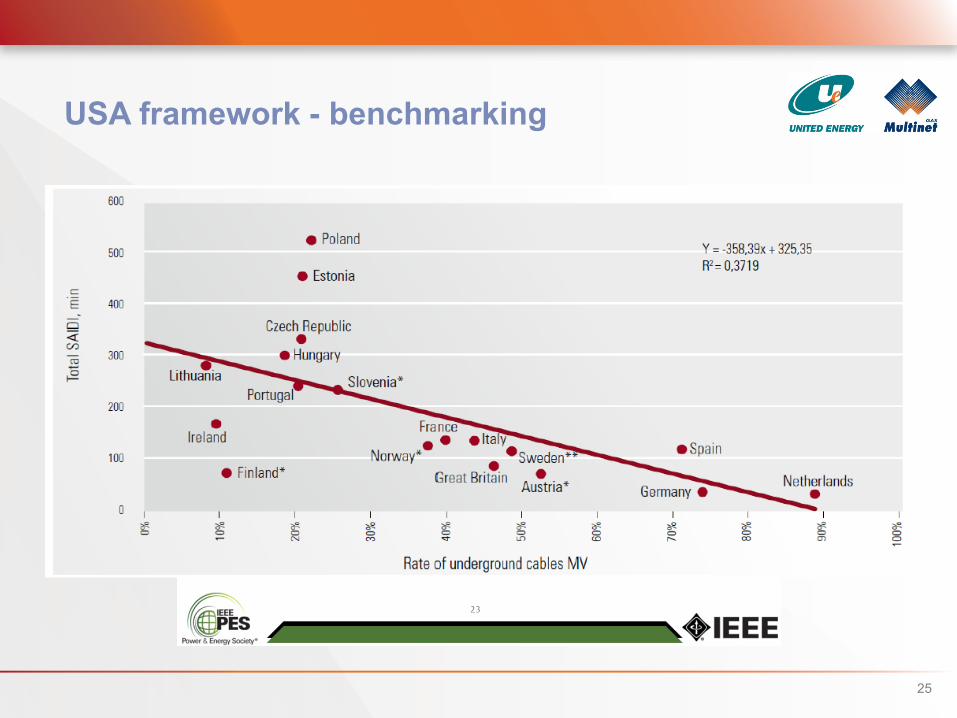
USA framework - benchmarking
26
United Kingdom framework
Ofgem administers a price control regime in UK
There are financial incentives in place on DNOs
Focus on delivering an improved level of performance in relation to the number and duration of power cuts and the quality of telephone response
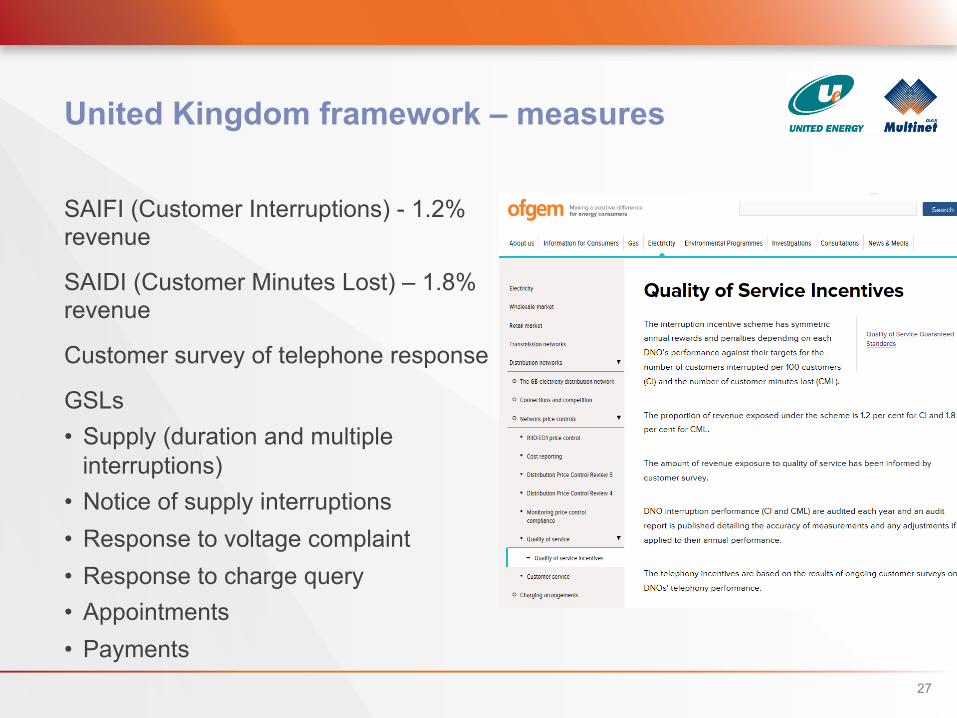
United Kingdom framework – measures
SAIFI (Customer Interruptions) - 1.2% revenue
SAIDI (Customer Minutes Lost) – 1.8% revenue
Customer survey of telephone response
GSLs • Supply (duration and multiple
interruptions) • Notice of supply interruptions • Response to voltage complaint • Response to charge query • Appointments • Payments
27
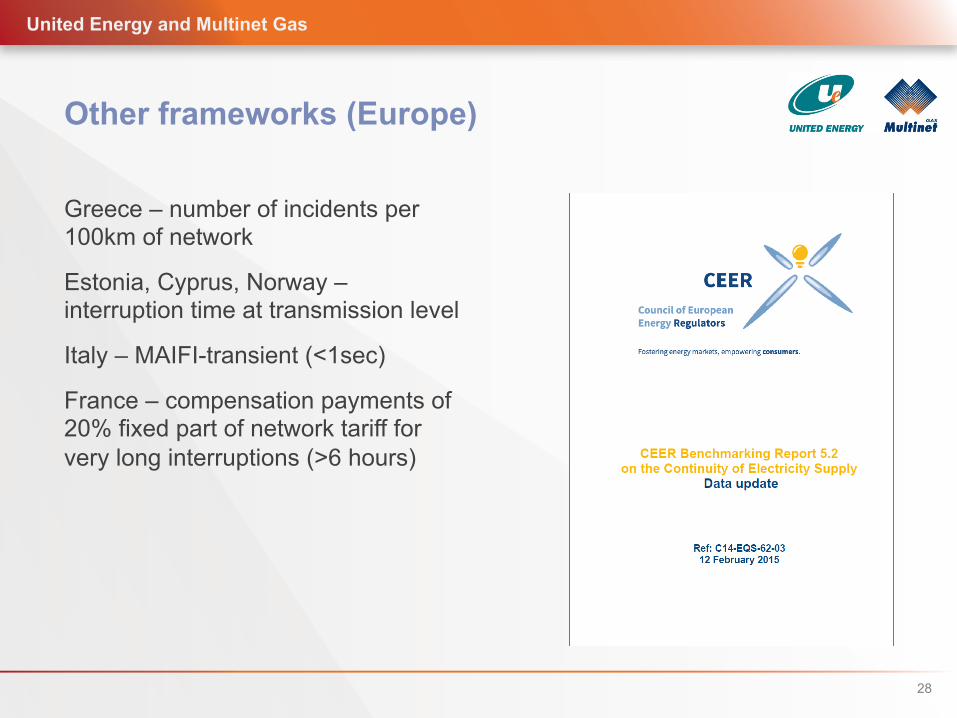
Other frameworks (Europe)
Greece – number of incidents per 100km of network
Estonia, Cyprus, Norway – interruption time at transmission level
Italy – MAIFI-transient (<1sec)
France – compensation payments of 20% fixed part of network tariff for very long interruptions (>6 hours)
United Energy and Multinet Gas
28
29
Agenda
Broad Definitions
Snapshot of Global Standards
Detailed Definitions
International Examples
Performance Based Rates
Australian Framework • Background (Victorian development) • AER service target performance incentive scheme (STPIS) • The future?
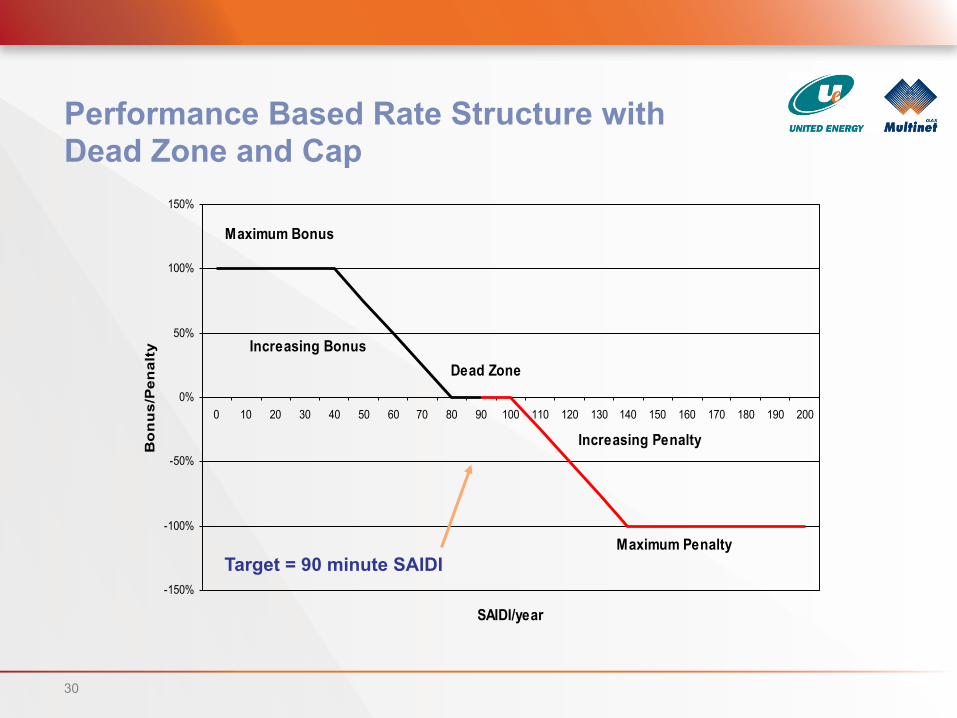
Performance Based Rate Structure with Dead Zone and Cap Performance Based Rate Structure with Dead Zone
-150%
-100%
-50%
0%
50%
100%
150%
0 10 20 30 40 50 60 70 80 90 100 110 120 130 140 150 160 170 180 190 200
SAIDI/year
Bo
nu
s/P
enal
ty
Maximum Bonus
Increasing Bonus
Maximum Penalty
Increasing Penalty
Dead Zone
30
Target = 90 minute SAIDI
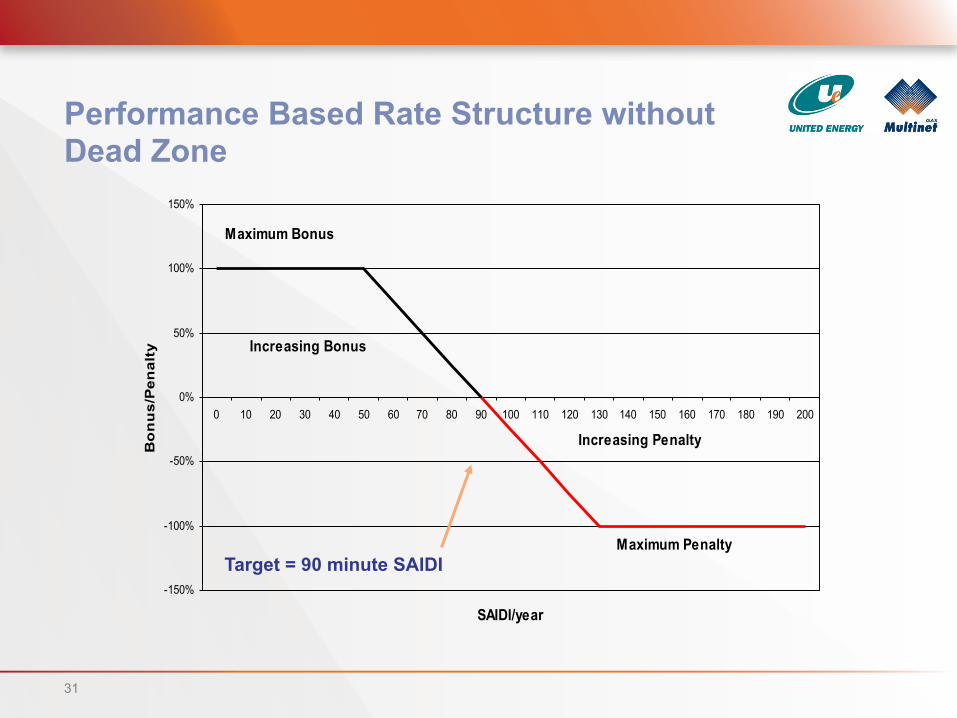
Performance Based Rate Structure without Dead Zone Performance Based Rate Structure with Dead Zone
-150%
-100%
-50%
0%
50%
100%
150%
0 10 20 30 40 50 60 70 80 90 100 110 120 130 140 150 160 170 180 190 200
SAIDI/year
Bo
nu
s/P
enal
ty
Maximum Bonus
Increasing Bonus
Maximum Penalty
Increasing Penalty
31
Target = 90 minute SAIDI
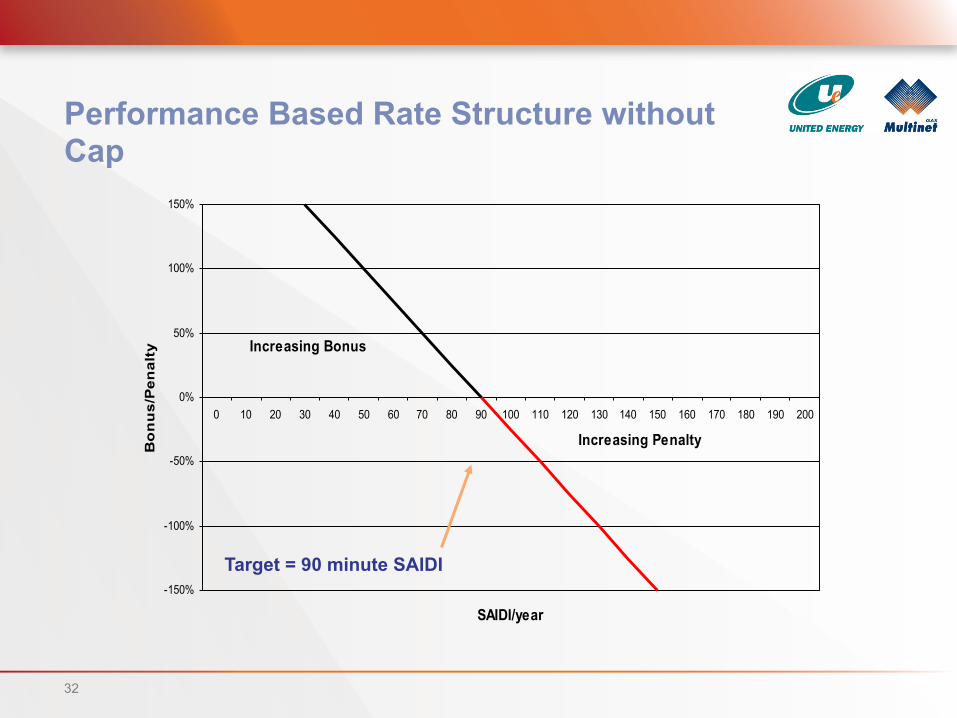
Performance Based Rate Structure without Cap Performance Based Rate Structure with Dead Zone
-150%
-100%
-50%
0%
50%
100%
150%
0 10 20 30 40 50 60 70 80 90 100 110 120 130 140 150 160 170 180 190 200
SAIDI/year
Bo
nu
s/P
enal
ty Increasing Bonus
Increasing Penalty
32
Target = 90 minute SAIDI

33
Agenda
Broad Definitions
Snapshot of Global Standards
Detailed Definitions
International Examples
Performance Based Rates
Australian Framework • Background (Victorian development) • AER service target performance incentive scheme (STPIS) • The future?
34
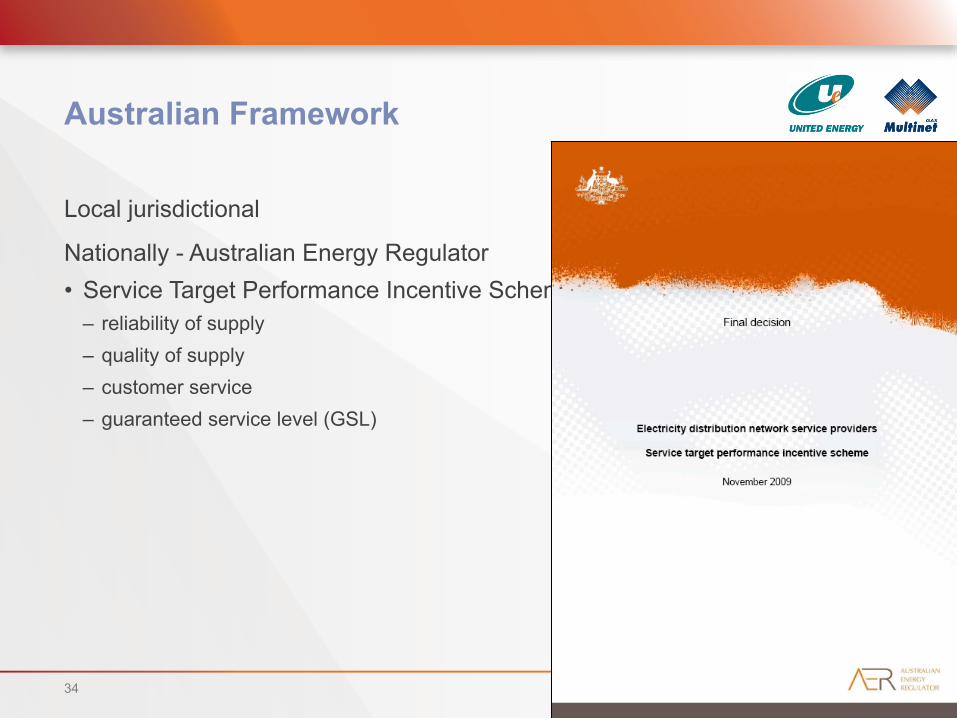
Australian Framework
Local jurisdictional
Nationally - Australian Energy Regulator • Service Target Performance Incentive Scheme (STPIS)
– reliability of supply – quality of supply – customer service – guaranteed service level (GSL)
35
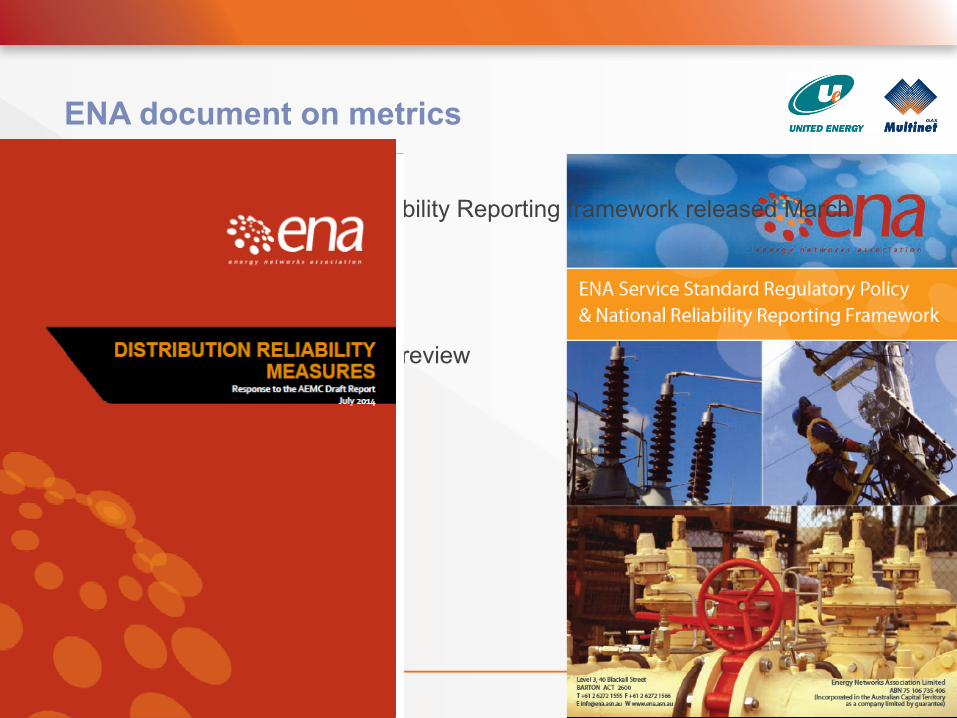
ENA document on metrics
ENA service standard and Reliability Reporting framework released March 2007 • Detailed industry position
AEMC review over 2013/14 • ENA consulted heavily on the review
36
Service Target Performance Incentive Scheme (STPIS) The beginning - How was it developed in Victoria? • EDPR 2001-2005 (s-factor) • Working Group with DNSPs, regulator, consultant • Based on 2 years data for definitions of CBD, Urban, Short Rural, Long
Rural • Value based on PB Power report
– $/MWh of DNSPs submissions on reliability improvement – Checked against Value of Lost Load (VoLL) of the time – Weightings between reliability indicators
How it operated
6 years of benefit for sustained improvement Returned through DUOS in tariff submission 2 years post reliability results GSLs for reliability (worst served 1%) Exclusion criteria
No “dead band” or cap on performance Split between customer feeder category • CBD, Urban, Short Rural, Long Rural
S bank to smooth year-on-year variability 2001 to 2005 • SAIFI, CAIDI, planned SAIDI
2006 to 2010 • SAIFI, SAIDI, MAIFI & call centre response • Rates increased by 2.5 to 4 times the first period rates
37
Definitions for customer segmentation
CBD, Urban, Short Rural, Long Rural • SCNRRR definition by feeder
– Based on 2 years Victorian data from 1997/8
• Tasmanian definition by load block • Ena R+PQC work
Year end review of feeder categorisation
38
39
AER STPIS
First developed in June 2008 • AER requirement to do so under chapter 6 of the National Electricity Rules
Amended May 2009 • Amended s-factor calculation • Amended cap from +/-3% to +/-5% • Amended Major Event Day calculation
Current version November 2009
STPIS changes from Vic ESC to AER
Downside Caps (and upside)
S bank to smooth revenue fluctuations
Valuation of incentives (VCR)
SAIDI/SAIFI incentive ratio • Distributor specific to common ratio for all
Exclusions • Victoria SAIFI to SAIDI AER
40
41
Structure of the AER distribution service target performance incentive scheme Scheme comprises of four components: • reliability of supply • quality of supply • customer service • guaranteed service level (GSL)
Exclusions to remove outlier performance • AER considers the IEEE 1366 standard to be a robust method for
determining exclusions
42
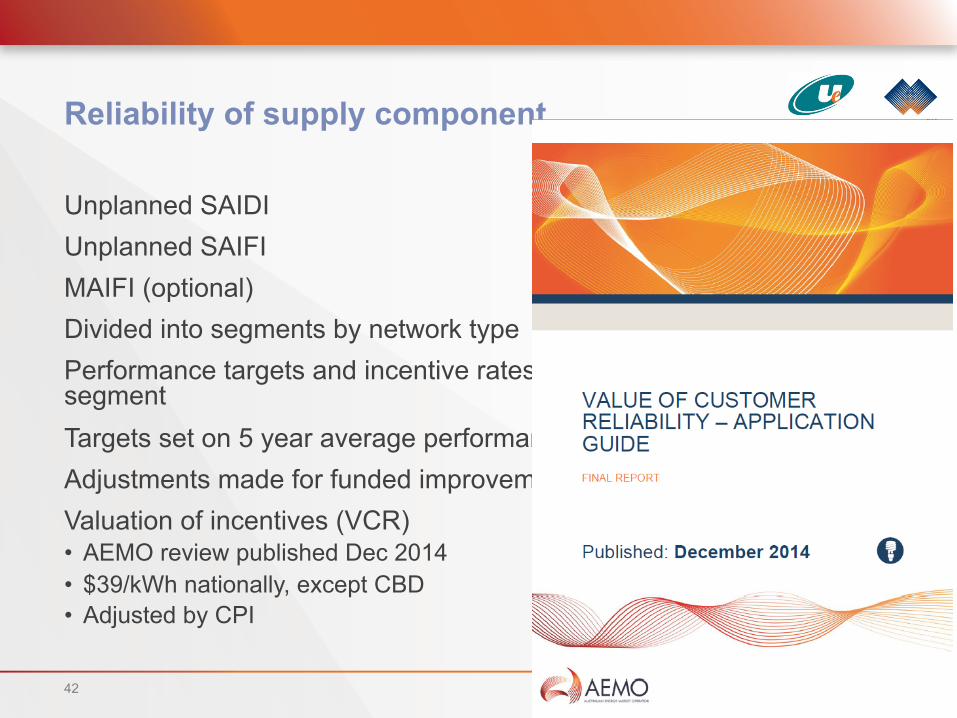
Reliability of supply component
Unplanned SAIDI Unplanned SAIFI MAIFI (optional) Divided into segments by network type Performance targets and incentive rates applied for each parameter segment Targets set on 5 year average performance Adjustments made for funded improvements Valuation of incentives (VCR) • AEMO review published Dec 2014 • $39/kWh nationally, except CBD • Adjusted by CPI
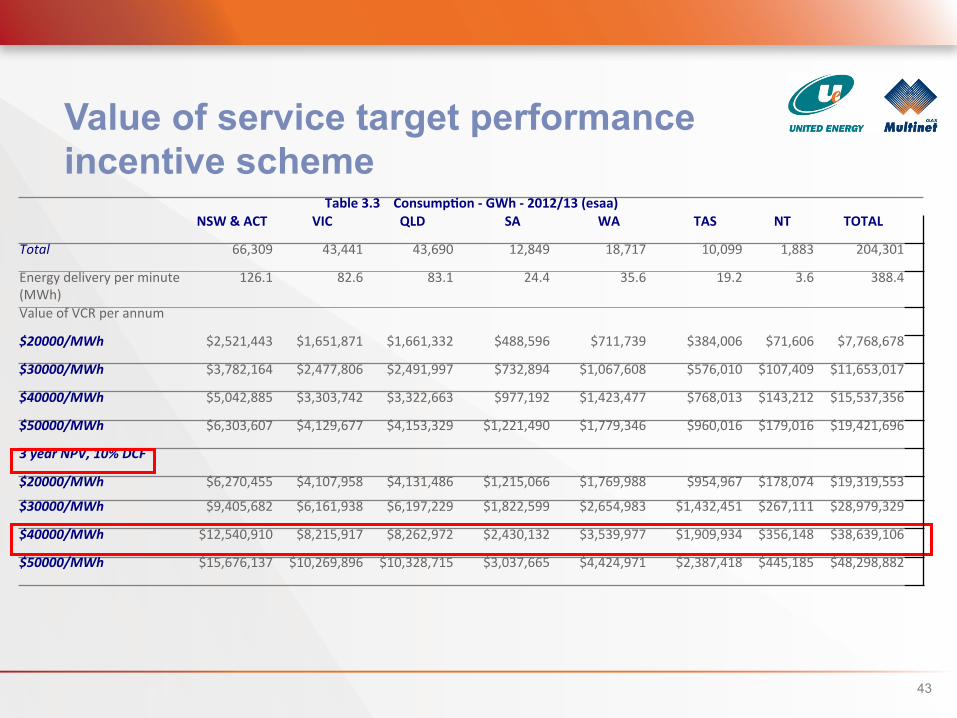
Value of service target performance incentive scheme
43
Table3.3Consump0on-GWh-2012/13(esaa) NSW&ACT VIC QLD SA WA TAS NT TOTAL Total 66,309 43,441 43,690 12,849 18,717 10,099 1,883 204,301
Energydeliveryperminute(MWh)
126.1 82.6 83.1 24.4 35.6 19.2 3.6 388.4
ValueofVCRperannum
$20000/MWh $2,521,443 $1,651,871 $1,661,332 $488,596 $711,739 $384,006 $71,606 $7,768,678
$30000/MWh $3,782,164 $2,477,806 $2,491,997 $732,894 $1,067,608 $576,010 $107,409 $11,653,017
$40000/MWh $5,042,885 $3,303,742 $3,322,663 $977,192 $1,423,477 $768,013 $143,212 $15,537,356
$50000/MWh $6,303,607 $4,129,677 $4,153,329 $1,221,490 $1,779,346 $960,016 $179,016 $19,421,696
3yearNPV,10%DCF
$20000/MWh $6,270,455 $4,107,958 $4,131,486 $1,215,066 $1,769,988 $954,967 $178,074 $19,319,553
$30000/MWh $9,405,682 $6,161,938 $6,197,229 $1,822,599 $2,654,983 $1,432,451 $267,111 $28,979,329
$40000/MWh $12,540,910 $8,215,917 $8,262,972 $2,430,132 $3,539,977 $1,909,934 $356,148 $38,639,106
$50000/MWh $15,676,137 $10,269,896 $10,328,715 $3,037,665 $4,424,971 $2,387,418 $445,185 $48,298,882
44
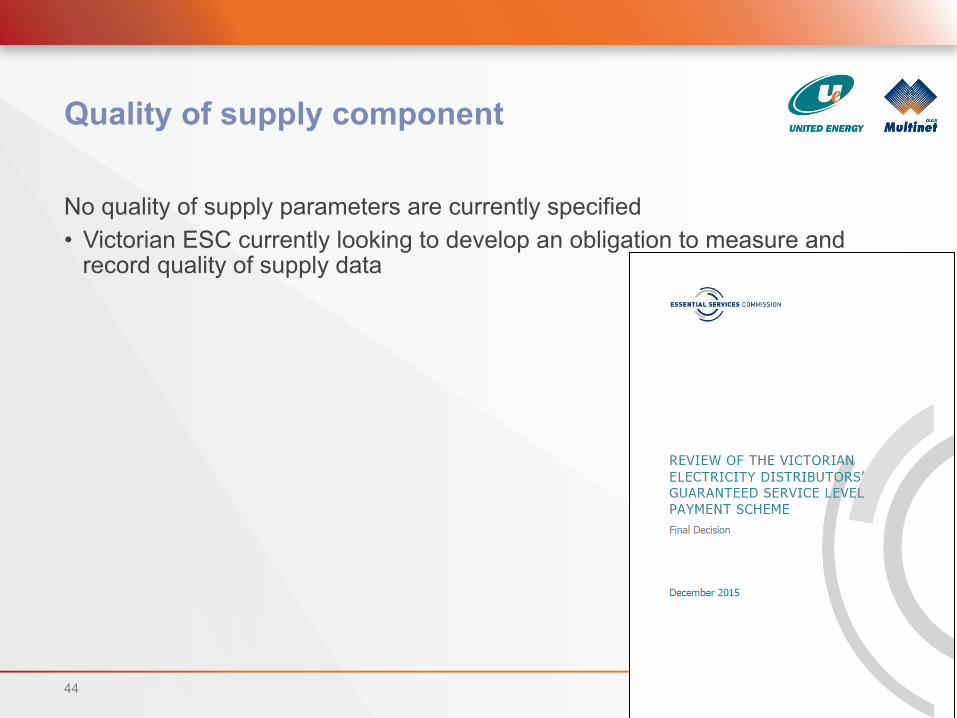
Quality of supply component
No quality of supply parameters are currently specified • Victorian ESC currently looking to develop an obligation to measure and
record quality of supply data
45
Customer service component
Telephone answering
Streetlight repair
New connections
Response to written enquiries
Performance targets and incentive rates applied for each parameter
Revenue at risk for all customer service parameters shall be +/-1%
Revenue at risk for an individual customer service parameters shall be +/-0.5%
Incentive rate of -0.040% per unit of ‘telephone answering’ parameter
May be proposed by a DNSP
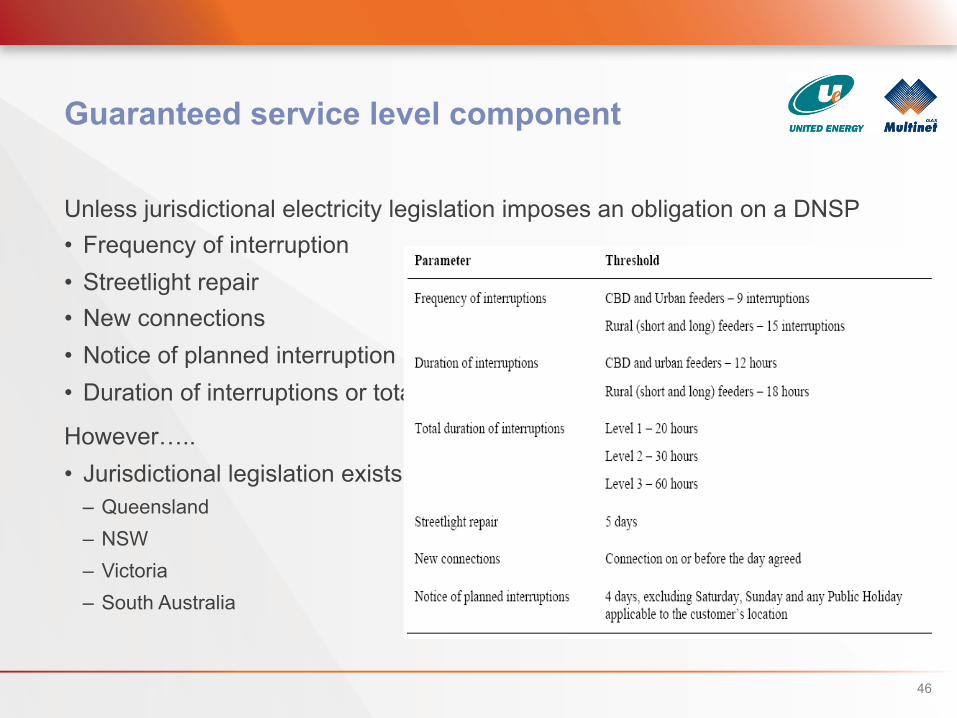
Guaranteed service level component
Unless jurisdictional electricity legislation imposes an obligation on a DNSP • Frequency of interruption • Streetlight repair • New connections • Notice of planned interruption • Duration of interruptions or total duration of interruptions
However….. • Jurisdictional legislation exists in
– Queensland – NSW – Victoria – South Australia
46
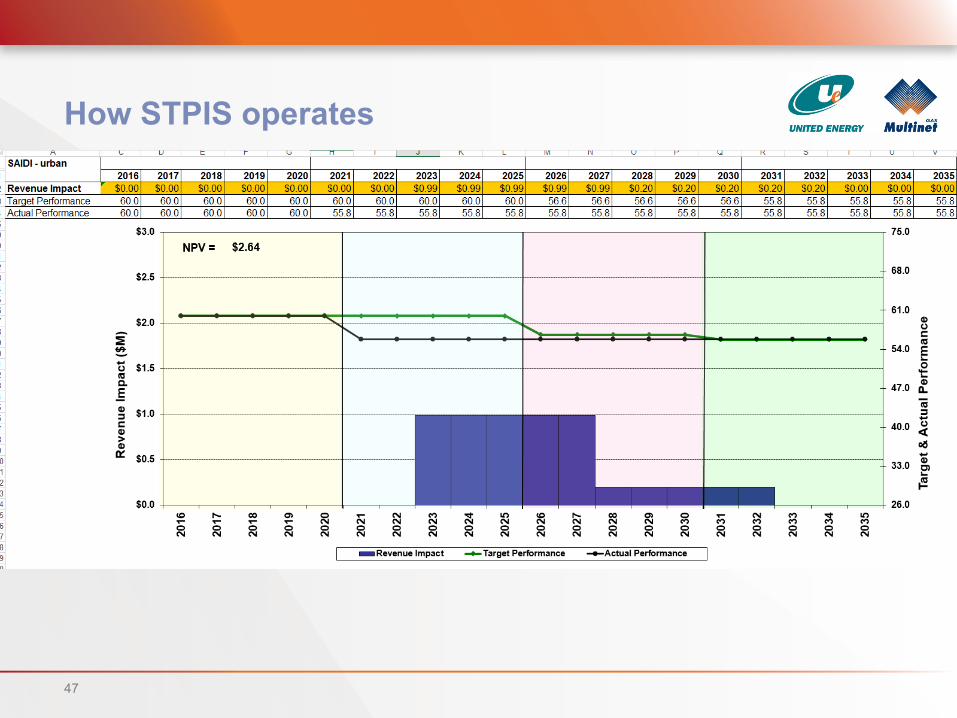
6 years of benefit for sustained improvement (equivalent)
Returned through DUOS in tariff submission 2 years post reliability results
Exclusion criteria based on IEEE1366
Symmetrical
S bank to smooth year-on-year variability
Capped at +/-5%
How STPIS operates
47
AER exclusion criteria
The 2.5 beta method described in the IEEE Standard 1366-2003 will be used to determine exclusion threshold for Major Events Days
• any day (midnight to midnight) where daily unplanned SAIDI exceeds the major event day threshold
In addition, impacts of specific events will be excluded • load shedding directed by NEMMCO due to a generation shortfall • load interruptions caused by a failure of the shared transmission network • load interruptions caused by a failure of transmission connection assets except
where the interruptions were due to inadequate planning of transmission connections and the DNSP is responsible for transmission connection planning
• load interruptions caused by the exercise of any obligation, right or discretion imposed upon or provided for under jurisdictional or national legislation
48
49
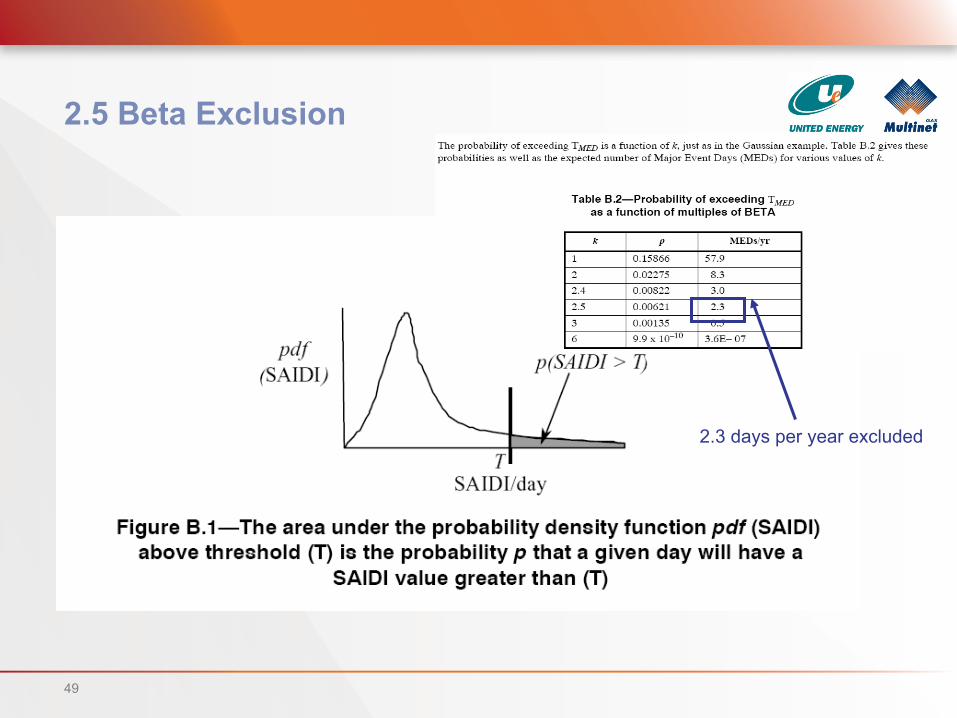
2.5 Beta Exclusion
2.3 days per year excluded
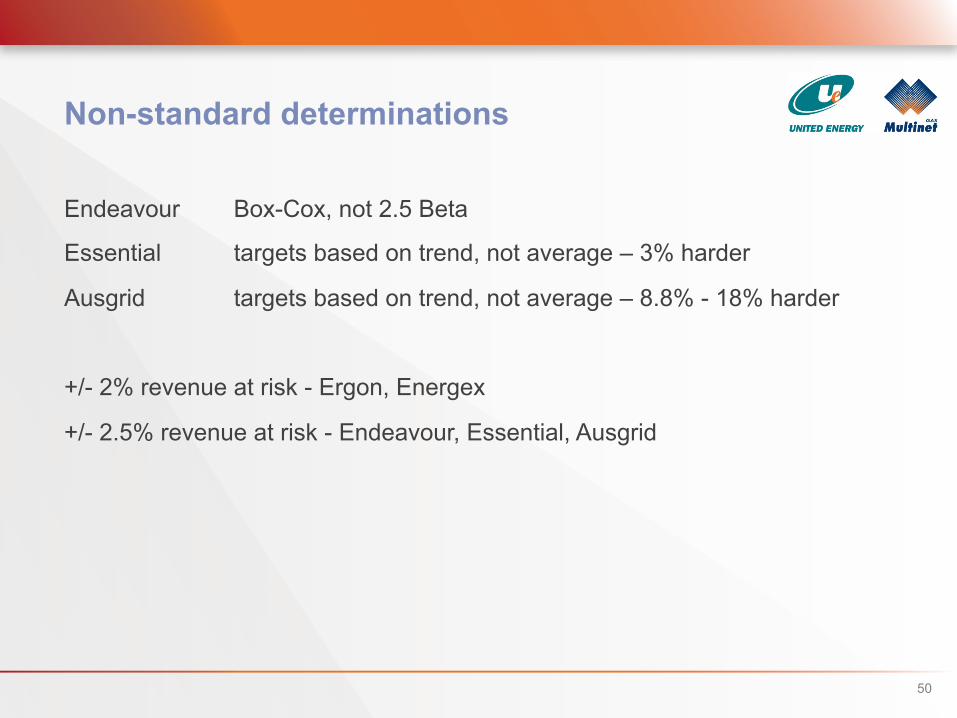
Non-standard determinations
Endeavour Box-Cox, not 2.5 Beta
Essential targets based on trend, not average – 3% harder
Ausgrid targets based on trend, not average – 8.8% - 18% harder
+/- 2% revenue at risk - Ergon, Energex
+/- 2.5% revenue at risk - Endeavour, Essential, Ausgrid
50
51
The future?
Inclusion of Power Quality measures • Ena R+PQ Ref Group developing National PQ Indices
Tightening of Definitions
IEEE1366 developments • 4.15 Beta for catastrophic events
OFGEM Incentive and Obligations project
Victorian f factor (fire starts) • $25,000 per fire start currently
AEMC Review of electricity distribution reliability outcomes and standards
Ena Reliability and Power Quality Reference Group work
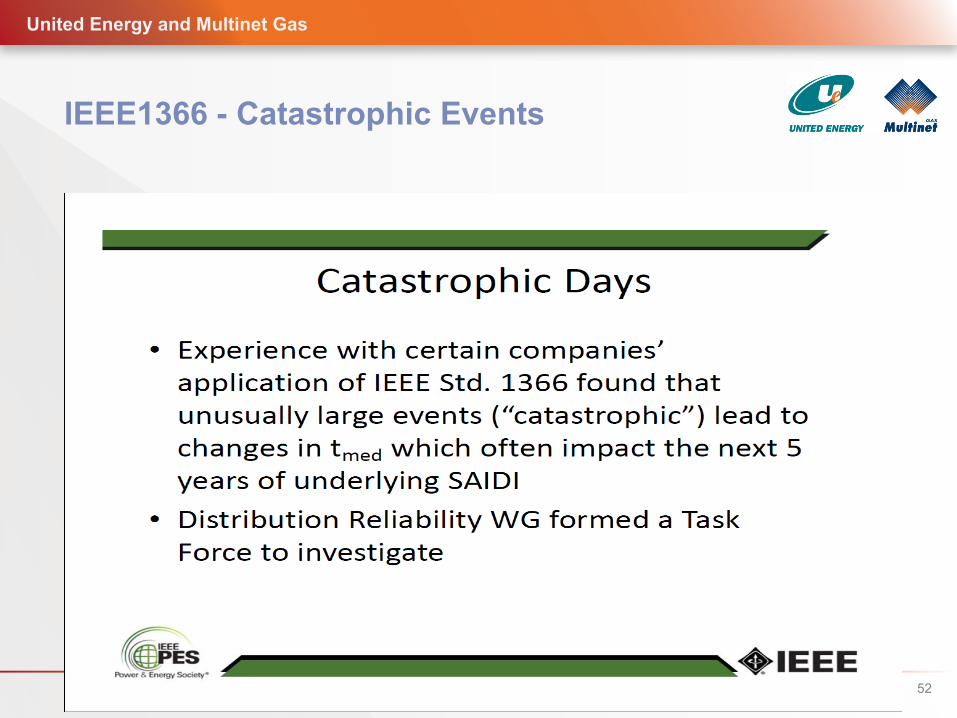
IEEE1366 - Catastrophic Events
API Power Engineering Summer School Feb 2012
United Energy and Multinet Gas
52
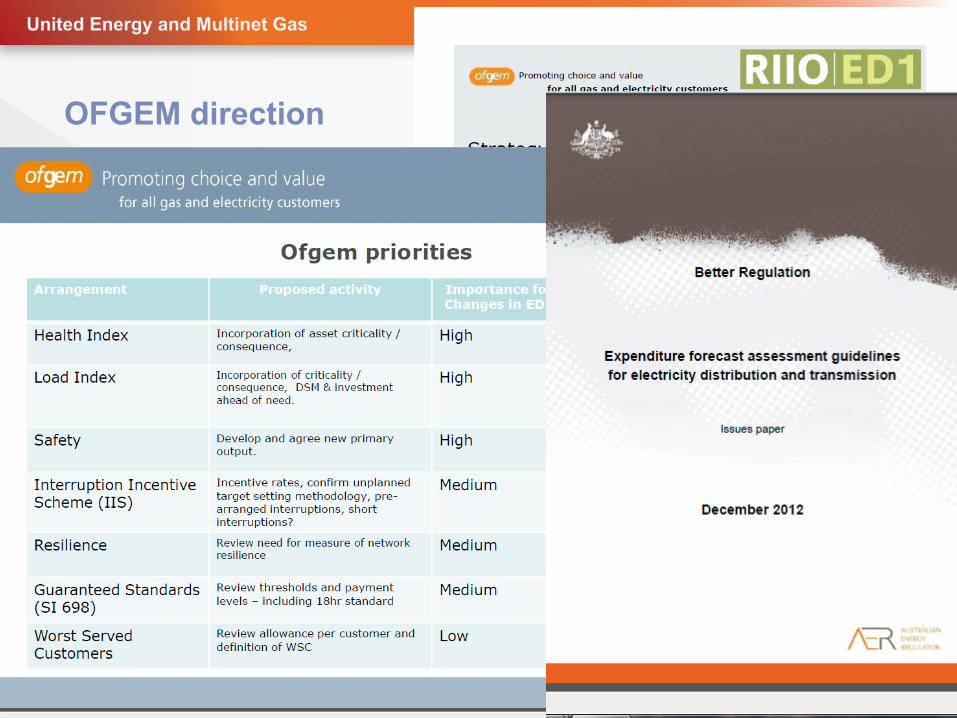
OFGEM direction
Link longer-term reliability benefits of healthier and less highly-loaded assets to a measurable deliverable within the price control • Load Index (LI) to maintain a specific average level of loading
– 5 stage Significant spare capacity to fully utilised, mitigation required
• Health index (HI) to measure the probability of asset failure – 5 stage New to End of Service Life, intervention required
• Risk index (RI) to combine the impact of asset failure with HI • Network Resilience measure for use in scenarios such as during floods “Unplanned interruptions and minutes lost targets set using a combination of DNO own and industry average“
United Energy and Multinet Gas
53
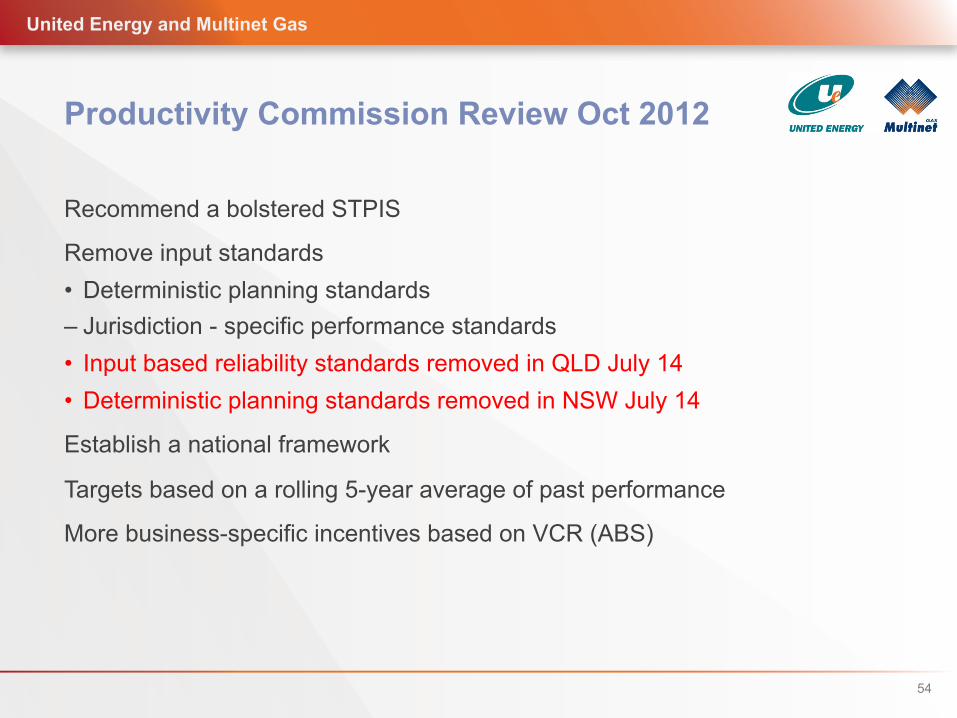
Productivity Commission Review Oct 2012
Recommend a bolstered STPIS
Remove input standards • Deterministic planning standards – Jurisdiction - specific performance standards • Input based reliability standards removed in QLD July 14 • Deterministic planning standards removed in NSW July 14
Establish a national framework
Targets based on a rolling 5-year average of past performance
More business-specific incentives based on VCR (ABS)
United Energy and Multinet Gas
54
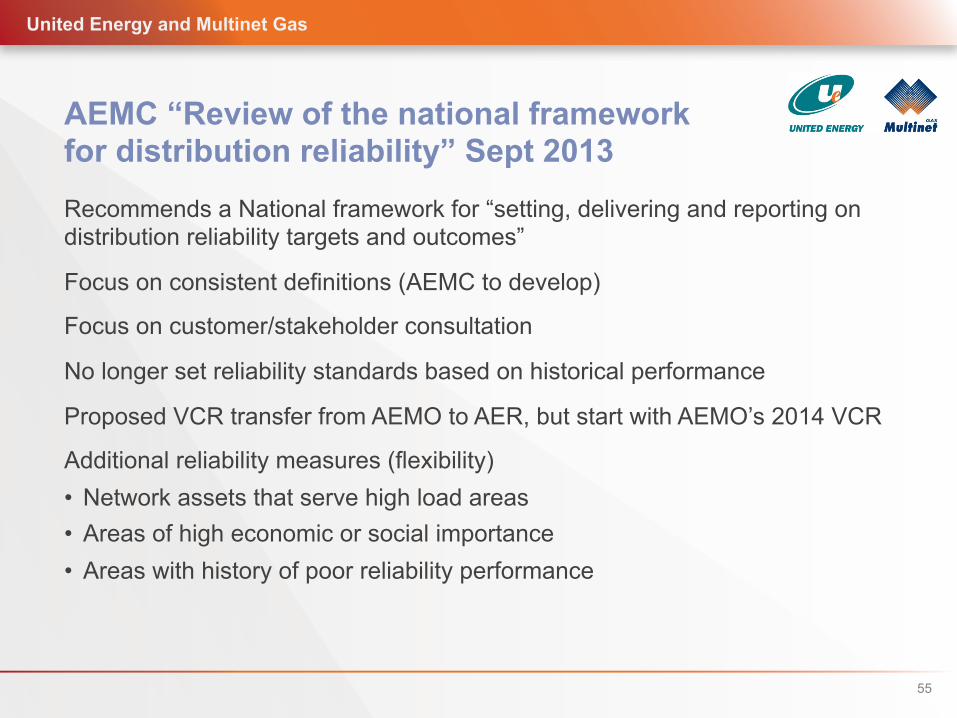
AEMC “Review of the national framework for distribution reliability” Sept 2013 Recommends a National framework for “setting, delivering and reporting on distribution reliability targets and outcomes”
Focus on consistent definitions (AEMC to develop)
Focus on customer/stakeholder consultation
No longer set reliability standards based on historical performance
Proposed VCR transfer from AEMO to AER, but start with AEMO’s 2014 VCR
Additional reliability measures (flexibility) • Network assets that serve high load areas • Areas of high economic or social importance • Areas with history of poor reliability performance
United Energy and Multinet Gas
55
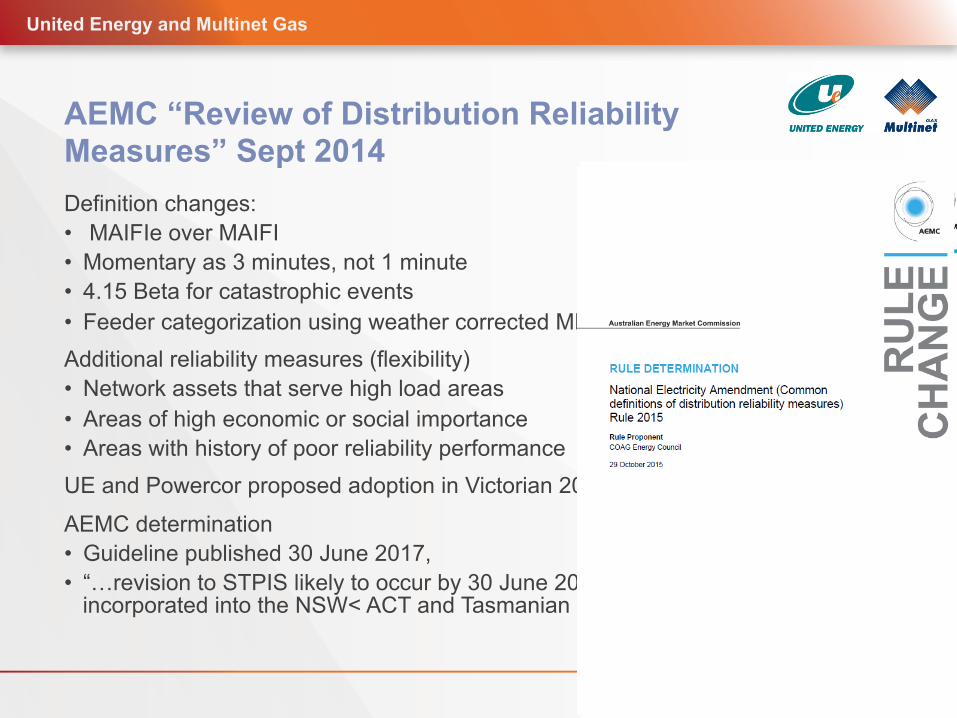
AEMC “Review of Distribution Reliability Measures” Sept 2014 Definition changes: • MAIFIe over MAIFI • Momentary as 3 minutes, not 1 minute • 4.15 Beta for catastrophic events • Feeder categorization using weather corrected MDs for load density assessment Additional reliability measures (flexibility) • Network assets that serve high load areas • Areas of high economic or social importance • Areas with history of poor reliability performance UE and Powercor proposed adoption in Victorian 2016-2020 determination
AEMC determination • Guideline published 30 June 2017, • “…revision to STPIS likely to occur by 30 June 2017 to allow revisions to be
incorporated into the NSW< ACT and Tasmanian 2019-2024 determinations”
United Energy and Multinet Gas
56
Ena Reliability and Power Quality Reference Group work PQ Voltage Unbalance Draft Guideline with Standards Australia for publishing – promotes nationally consistent approach to connection assessment (companion to flicker and harmonics)
PQ Amendments to NER to align with Australian Standards
Australian Standard AS61000.3.100 Amd1:2015: draft amendment released for public comment closed October 2015 – provides a statistical sample approach to measure network compliance
Guidelines for the Classification of Feeders – scope Q1 2016 to improve reliability reporting consistency, better align with expectations and requirements of customers
Reliability Performance Management Opportunities – survey Q1 2016 as input into update of existing guidelines to promote continuing best practice
Guidelines for reporting poor reliability – discussion paper Q2 2016 to better align with the experience of customers
United Energy and Multinet Gas
57
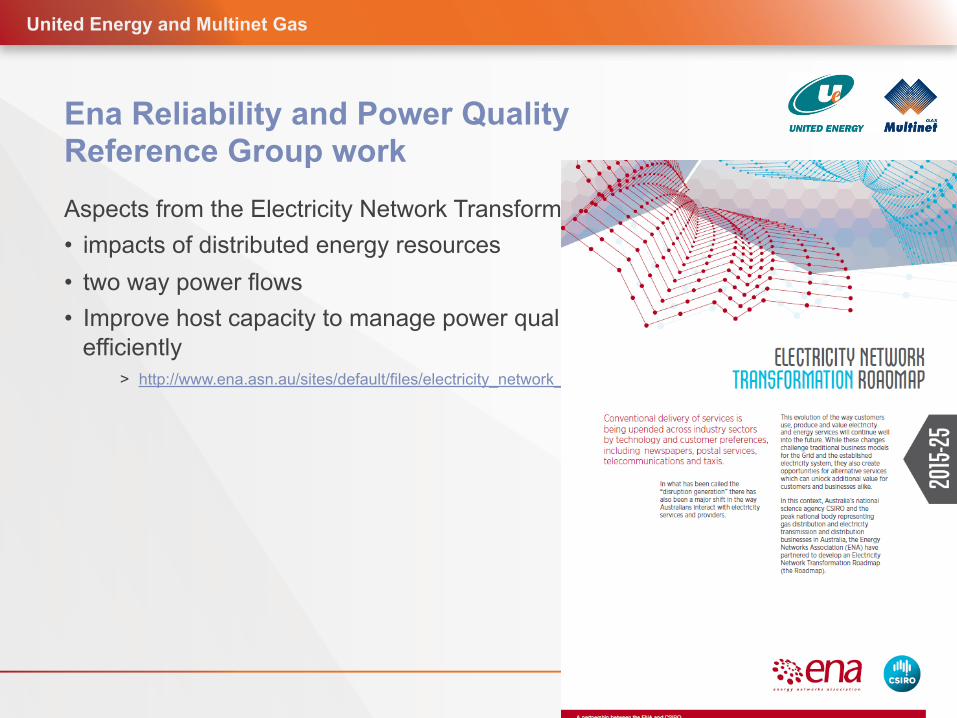
Ena Reliability and Power Quality Reference Group work Aspects from the Electricity Network Transformation Roadmap • impacts of distributed energy resources • two way power flows • Improve host capacity to manage power quality and reliability prudently and
efficiently > http://www.ena.asn.au/sites/default/files/electricity_network_transformation_roadmap_overview.pdf
United Energy and Multinet Gas
58
Summary Closing
Broad Definitions
Snapshot of Global Standards
Detailed Definitions
International Examples
Performance Based Rates
Australian Framework • Background (Victorian development) • AER service target performance incentive scheme (STPIS) • The future
United Energy and Multinet Gas
59