Embed Size (px)
Citation preview
Reliability analysis of road safety barriers
J. Markova1, M. Kalinsky2, P. Marek2 & O. Janda3 1Czech Technical University in Prague, Klokner Institute, Czech Republic 2TÜV SÜD Czech Ltd., Czech Republic 3ALGON a.s., Czech Republic
Abstract
The design and verification of the new types of road safety barriers suffers from several deficiencies including a lack of prescriptive models for impact forces caused by various types of road vehicles. For specification of the load-bearing members of barriers, alternative procedures including dynamic, non-linear and probabilistic analyses may be applied. Detailed analysis is based on crash test simulations using models of vehicles based on the finite element method. Keywords: road barrier, impact forces, crash test, crash simulation, models of vehicles, reliability.
1 Introduction
Road safety barriers provide protection for traffic on roads, as well as for their immediate surroundings. Various aspects have to be considered when selecting the appropriate types of safety barrier, including road categories, surface characteristics, road surroundings, the permitted speed for vehicles, types of danger spots in road surroundings, and traffic intensity including expected future trends. For the selection of appropriate safety measures, the retention level for road barriers has to be determined, taking into account the dangerous sections of the road and the need for the protection of road surroundings. The safety barriers are designed for the relevant retaining levels, and verified within a crash test. Presently, it is not allowed to substitute experimental tests with theoretical analyses only. However, analyses are mostly accepted for barrier modifications. Therefore, the aim of the current research is to contribute to the development of a methodology for the possible improvements of vehicle crash tests into traffic barriers by computer simulation, together with the application of the methods of the theory of structural reliability.
Safety and Security Engineering VI 365
www.witpress.com, ISSN 1743-3509 (on-line) WIT Transactions on The Built Environment, Vol 151, © 2015 WIT Press
doi:10.2495/SAFE150311
For structural design and theoretical verification of road safety barriers, the basic requirements given in EN 1317 and in Eurocodes should be applied. Additional guidance for the application of probabilistic methods and dynamics is provided in Annexes B and C of EN 1991-1-7 [1]. Presently, the working draft of the Technical report [2] of CEN/TC 226 gives basic guidance for the verification of road safety barriers based on crash test simulations. The general guidance on how to specify models of vehicles is included. However, the standardised models of vehicles which could be applied for theoretical simulations have not yet been recommended. For the approval of a new type of road safety barrier, the crash test, at present, is the only one recognized. The results of theoretical simulations may be compared with crash tests, which may be used for test validation with respect to the modification of barriers (improvement of details, changes in material and restraining level). However, the modifications of specific barriers cannot significantly differ from the experimentally tested original barrier. For the designing of barriers, various supplementary national codes and technical requirements should also be applied in various countries, including the Technical Requirements TP 114 [3] in the Czech Republic. Two types of road barrier are given within the scope of this document: “approved” road barriers, for which rules of EN 1317 shall be applied (barriers are considered as construction products), and “other” road bridge barriers, which include barriers designed according to project specifications that are not repeated in individual bridges. They represent the original road restraining system. For these “other” barrier designs, five categories of impact forces are given in TP 114 [3] in a range from 100 kN to 600 kN. The requirements on impact forces for verification of “other” safety barriers are based on EN 1991-2 [5]. However, it appears that the recommended impact forces for the design of road safety barriers are rather low and should be further verified. The aim of the research is to prepare and verify the methodology which facilitates the design and production of the innovative traffic barrier prototype possible. The first phase of the research was focused on the analysis of the critical points of existing types of road barriers. Non-linear dynamic software PAM-CRASH, suitable for the computation of large plastic deformations step-by step beyond the yield strength of the material, is used for all crash simulations in the research project.
2 Development of models
2.1 Impact characteristics of vehicles
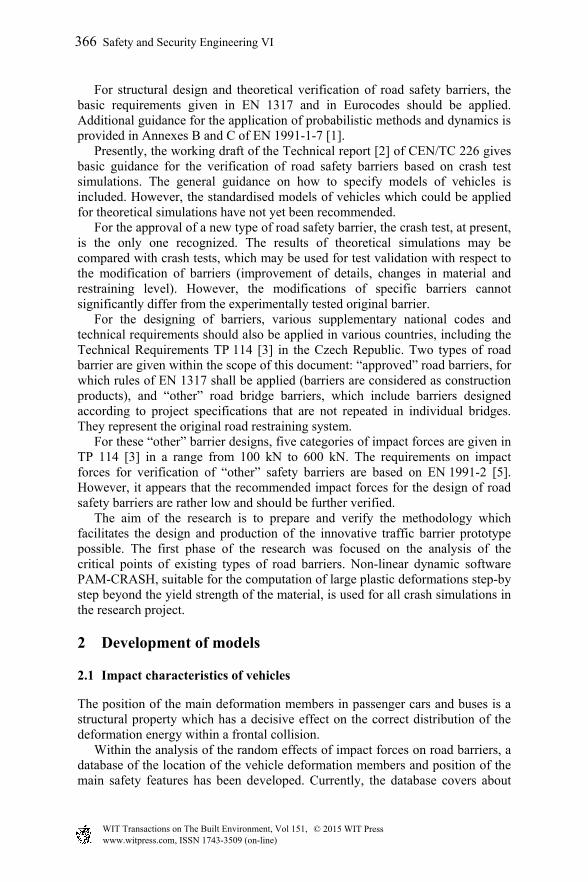
The position of the main deformation members in passenger cars and buses is a structural property which has a decisive effect on the correct distribution of the deformation energy within a frontal collision. Within the analysis of the random effects of impact forces on road barriers, a database of the location of the vehicle deformation members and position of the main safety features has been developed. Currently, the database covers about
366 Safety and Security Engineering VI
www.witpress.com, ISSN 1743-3509 (on-line) WIT Transactions on The Built Environment, Vol 151, © 2015 WIT Press
Figure 1: Different height of deformation members on several classes of cars.
70% of all types of registered cars in the Czech Republic. Results of measurements of the height of vehicle deformation elements are shown in fig. 1. EN 1317-2 [4] defines the basic parameters of cars to be used in real crash tests, such as dimensions, weight and centre of gravity position. However, the results of the real test may vary according to the vehicle type. The type of passenger vehicle has quite a significant effect on the simulation results. If each testing institution uses different vehicles then the compatibility of the crash test results cannot be fully guaranteed. This may be even more significant when older vehicles are applied because their structure might be considerably damaged by corrosion or improper repair.
2.2 Model of passenger car
The model of the car used for tests TB11, TB 21 and TB 22 is based on the model of Skoda Fabia. The model of the passenger car is also equipped with two dummies Hybrid HIII 50%, as well as other safety features such as safety belts, belt pretensioners etc., allowing to assume the biomechanical load of the occupants within the crash test. However, these basic variables are not required to be considered by EN 1317.
2.3 Model of bus
For test TB51, the basic model of a bus is developed (see fig. 2). It is a typical representative of the intercity bus (category MII) with a length of 12 m. EN 1317 defines the basic parameters of the vehicle to be used in real crash tests, such as dimensions, weight and centre of gravity position. According to the available information, the testing institution in the Czech Republic uses an older type of Karosa bus for the standard crash test.
Safety and Security Engineering VI 367
www.witpress.com, ISSN 1743-3509 (on-line) WIT Transactions on The Built Environment, Vol 151, © 2015 WIT Press
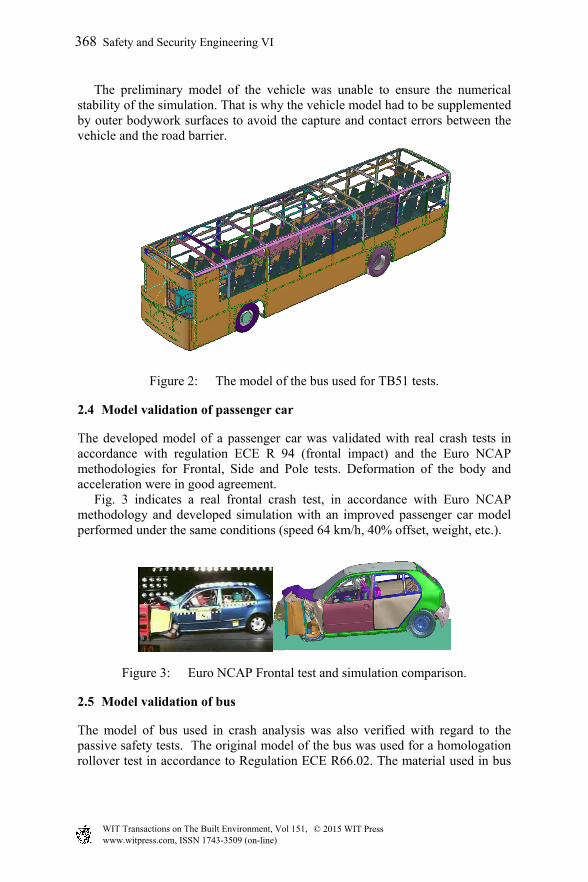
The preliminary model of the vehicle was unable to ensure the numerical stability of the simulation. That is why the vehicle model had to be supplemented by outer bodywork surfaces to avoid the capture and contact errors between the vehicle and the road barrier.
Figure 2: The model of the bus used for TB51 tests.
2.4 Model validation of passenger car
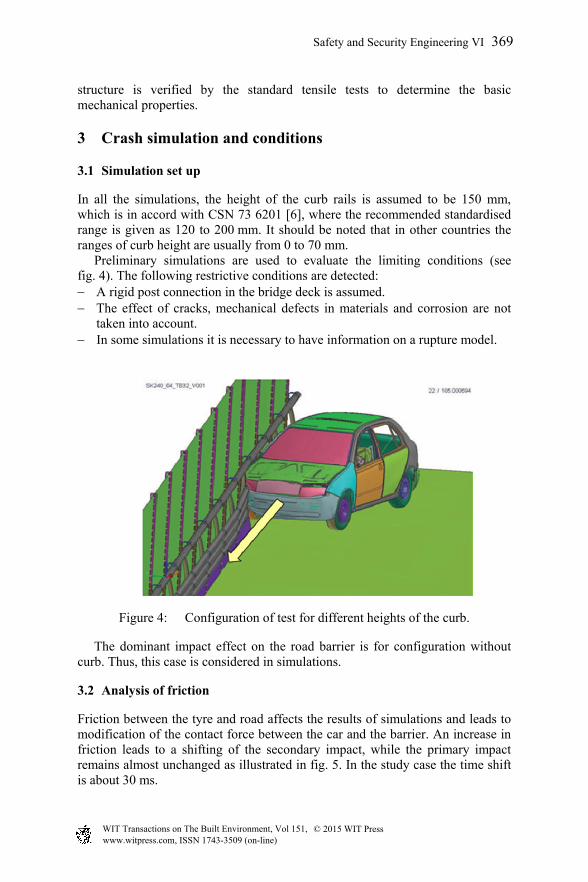
The developed model of a passenger car was validated with real crash tests in accordance with regulation ECE R 94 (frontal impact) and the Euro NCAP methodologies for Frontal, Side and Pole tests. Deformation of the body and acceleration were in good agreement. Fig. 3 indicates a real frontal crash test, in accordance with Euro NCAP methodology and developed simulation with an improved passenger car model performed under the same conditions (speed 64 km/h, 40% offset, weight, etc.).
Figure 3: Euro NCAP Frontal test and simulation comparison.
2.5 Model validation of bus
The model of bus used in crash analysis was also verified with regard to the passive safety tests. The original model of the bus was used for a homologation rollover test in accordance to Regulation ECE R66.02. The material used in bus
368 Safety and Security Engineering VI
www.witpress.com, ISSN 1743-3509 (on-line) WIT Transactions on The Built Environment, Vol 151, © 2015 WIT Press
structure is verified by the standard tensile tests to determine the basic mechanical properties.
3 Crash simulation and conditions
3.1 Simulation set up
In all the simulations, the height of the curb rails is assumed to be 150 mm, which is in accord with CSN 73 6201 [6], where the recommended standardised range is given as 120 to 200 mm. It should be noted that in other countries the ranges of curb height are usually from 0 to 70 mm. Preliminary simulations are used to evaluate the limiting conditions (see fig. 4). The following restrictive conditions are detected: A rigid post connection in the bridge deck is assumed. The effect of cracks, mechanical defects in materials and corrosion are not
taken into account. In some simulations it is necessary to have information on a rupture model.
Figure 4: Configuration of test for different heights of the curb.
The dominant impact effect on the road barrier is for configuration without curb. Thus, this case is considered in simulations.
3.2 Analysis of friction
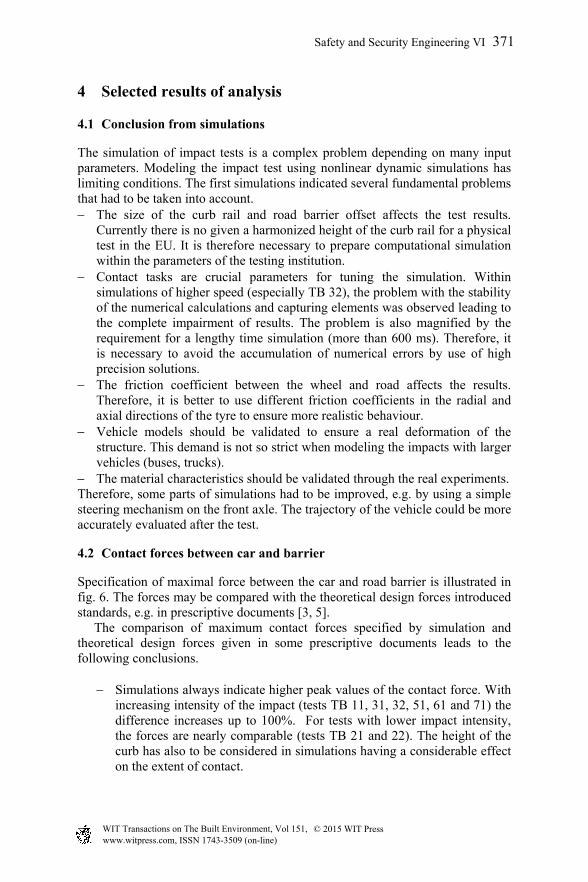
Friction between the tyre and road affects the results of simulations and leads to modification of the contact force between the car and the barrier. An increase in friction leads to a shifting of the secondary impact, while the primary impact remains almost unchanged as illustrated in fig. 5. In the study case the time shift is about 30 ms.
Safety and Security Engineering VI 369
www.witpress.com, ISSN 1743-3509 (on-line) WIT Transactions on The Built Environment, Vol 151, © 2015 WIT Press
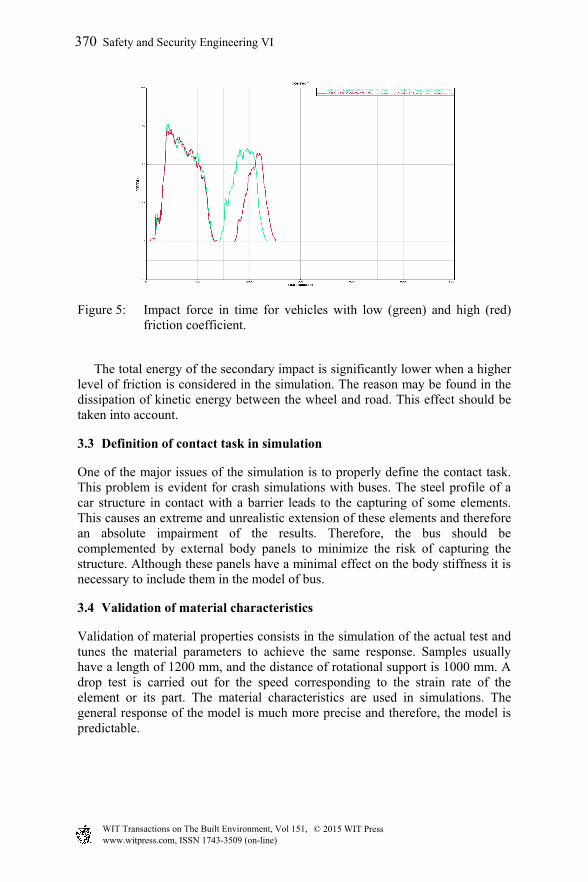
Figure 5: Impact force in time for vehicles with low (green) and high (red) friction coefficient.
The total energy of the secondary impact is significantly lower when a higher level of friction is considered in the simulation. The reason may be found in the dissipation of kinetic energy between the wheel and road. This effect should be taken into account.
3.3 Definition of contact task in simulation
One of the major issues of the simulation is to properly define the contact task. This problem is evident for crash simulations with buses. The steel profile of a car structure in contact with a barrier leads to the capturing of some elements. This causes an extreme and unrealistic extension of these elements and therefore an absolute impairment of the results. Therefore, the bus should be complemented by external body panels to minimize the risk of capturing the structure. Although these panels have a minimal effect on the body stiffness it is necessary to include them in the model of bus.
3.4 Validation of material characteristics
Validation of material properties consists in the simulation of the actual test and tunes the material parameters to achieve the same response. Samples usually have a length of 1200 mm, and the distance of rotational support is 1000 mm. A drop test is carried out for the speed corresponding to the strain rate of the element or its part. The material characteristics are used in simulations. The general response of the model is much more precise and therefore, the model is predictable.
370 Safety and Security Engineering VI
www.witpress.com, ISSN 1743-3509 (on-line) WIT Transactions on The Built Environment, Vol 151, © 2015 WIT Press
4 Selected results of analysis
4.1 Conclusion from simulations
The simulation of impact tests is a complex problem depending on many input parameters. Modeling the impact test using nonlinear dynamic simulations has limiting conditions. The first simulations indicated several fundamental problems that had to be taken into account. The size of the curb rail and road barrier offset affects the test results.
Currently there is no given a harmonized height of the curb rail for a physical test in the EU. It is therefore necessary to prepare computational simulation within the parameters of the testing institution.
Contact tasks are crucial parameters for tuning the simulation. Within simulations of higher speed (especially TB 32), the problem with the stability of the numerical calculations and capturing elements was observed leading to the complete impairment of results. The problem is also magnified by the requirement for a lengthy time simulation (more than 600 ms). Therefore, it is necessary to avoid the accumulation of numerical errors by use of high precision solutions.
The friction coefficient between the wheel and road affects the results. Therefore, it is better to use different friction coefficients in the radial and axial directions of the tyre to ensure more realistic behaviour.
Vehicle models should be validated to ensure a real deformation of the structure. This demand is not so strict when modeling the impacts with larger vehicles (buses, trucks).
The material characteristics should be validated through the real experiments. Therefore, some parts of simulations had to be improved, e.g. by using a simple steering mechanism on the front axle. The trajectory of the vehicle could be more accurately evaluated after the test.
4.2 Contact forces between car and barrier
Specification of maximal force between the car and road barrier is illustrated in fig. 6. The forces may be compared with the theoretical design forces introduced standards, e.g. in prescriptive documents [3, 5]. The comparison of maximum contact forces specified by simulation and theoretical design forces given in some prescriptive documents leads to the following conclusions.
Simulations always indicate higher peak values of the contact force. With increasing intensity of the impact (tests TB 11, 31, 32, 51, 61 and 71) the difference increases up to 100%. For tests with lower impact intensity, the forces are nearly comparable (tests TB 21 and 22). The height of the curb has also to be considered in simulations having a considerable effect on the extent of contact.
Safety and Security Engineering VI 371
www.witpress.com, ISSN 1743-3509 (on-line) WIT Transactions on The Built Environment, Vol 151, © 2015 WIT Press
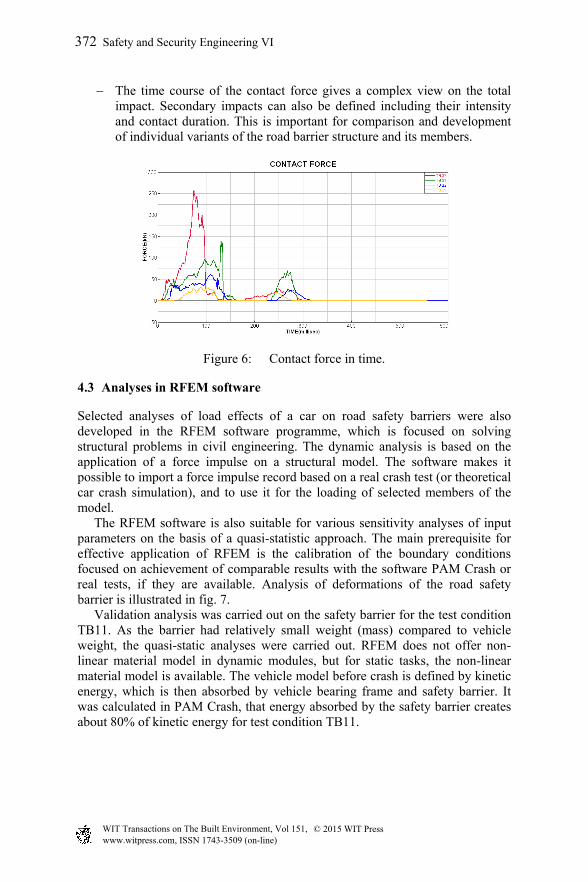
The time course of the contact force gives a complex view on the total impact. Secondary impacts can also be defined including their intensity and contact duration. This is important for comparison and development of individual variants of the road barrier structure and its members.
Figure 6: Contact force in time.
4.3 Analyses in RFEM software
Selected analyses of load effects of a car on road safety barriers were also developed in the RFEM software programme, which is focused on solving structural problems in civil engineering. The dynamic analysis is based on the application of a force impulse on a structural model. The software makes it possible to import a force impulse record based on a real crash test (or theoretical car crash simulation), and to use it for the loading of selected members of the model. The RFEM software is also suitable for various sensitivity analyses of input parameters on the basis of a quasi-statistic approach. The main prerequisite for effective application of RFEM is the calibration of the boundary conditions focused on achievement of comparable results with the software PAM Crash or real tests, if they are available. Analysis of deformations of the road safety barrier is illustrated in fig. 7. Validation analysis was carried out on the safety barrier for the test condition TB11. As the barrier had relatively small weight (mass) compared to vehicle weight, the quasi-static analyses were carried out. RFEM does not offer non-linear material model in dynamic modules, but for static tasks, the non-linear material model is available. The vehicle model before crash is defined by kinetic energy, which is then absorbed by vehicle bearing frame and safety barrier. It was calculated in PAM Crash, that energy absorbed by the safety barrier creates about 80% of kinetic energy for test condition TB11.
372 Safety and Security Engineering VI
www.witpress.com, ISSN 1743-3509 (on-line) WIT Transactions on The Built Environment, Vol 151, © 2015 WIT Press
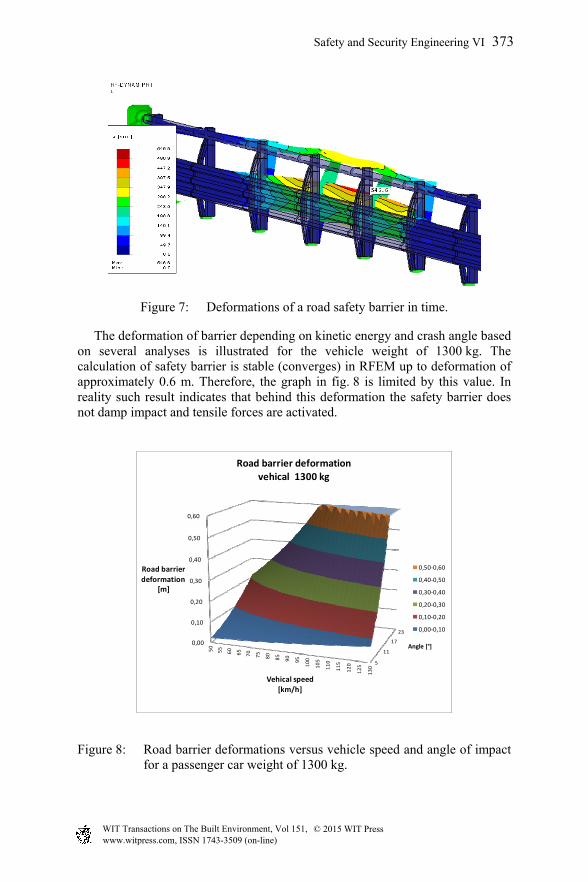
Figure 7: Deformations of a road safety barrier in time.
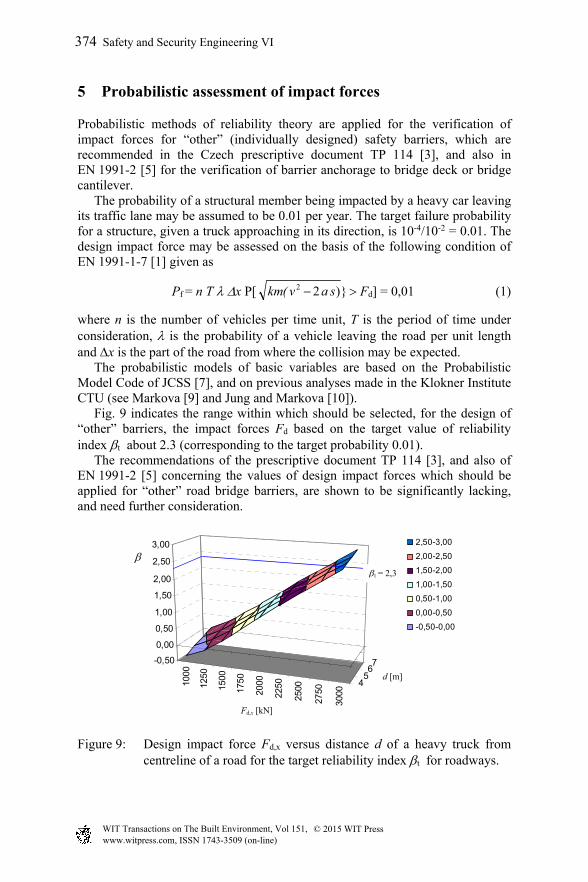
The deformation of barrier depending on kinetic energy and crash angle based on several analyses is illustrated for the vehicle weight of 1300 kg. The calculation of safety barrier is stable (converges) in RFEM up to deformation of approximately 0.6 m. Therefore, the graph in fig. 8 is limited by this value. In reality such result indicates that behind this deformation the safety barrier does not damp impact and tensile forces are activated.
5
11
17
23
0,00
0,10
0,20
0,30
0,40
0,50
0,60
50
55
60
65
70
75
80
85
90
95
100
105
110
115
120
125
130
Angle [°]
Road barrier
deformation[m]
Vehical speed[km/h]
Road barrier deformationvehical 1300 kg
0,50‐0,60
0,40‐0,50
0,30‐0,40
0,20‐0,30
0,10‐0,20
0,00‐0,10
Figure 8: Road barrier deformations versus vehicle speed and angle of impact for a passenger car weight of 1300 kg.
Safety and Security Engineering VI 373
www.witpress.com, ISSN 1743-3509 (on-line) WIT Transactions on The Built Environment, Vol 151, © 2015 WIT Press
5 Probabilistic assessment of impact forces
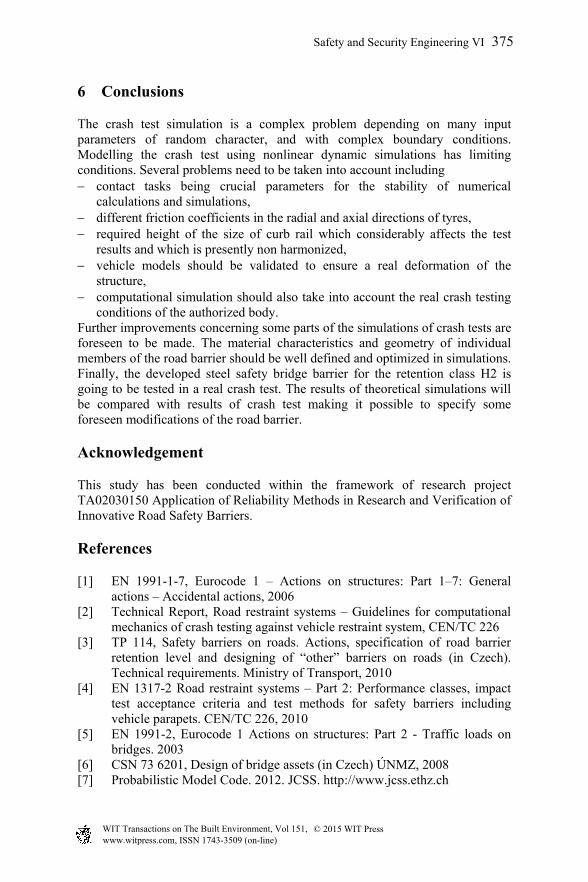
Probabilistic methods of reliability theory are applied for the verification of impact forces for “other” (individually designed) safety barriers, which are recommended in the Czech prescriptive document TP 114 [3], and also in EN 1991-2 [5] for the verification of barrier anchorage to bridge deck or bridge cantilever. The probability of a structural member being impacted by a heavy car leaving its traffic lane may be assumed to be 0.01 per year. The target failure probability for a structure, given a truck approaching in its direction, is 10-4/10-2 = 0.01. The design impact force may be assessed on the basis of the following condition of EN 1991-1-7 [1] given as
Pf = n T x P[ })22 sav(km Fd] = 0,01 (1)
where n is the number of vehicles per time unit, T is the period of time under consideration, is the probability of a vehicle leaving the road per unit length and x is the part of the road from where the collision may be expected. The probabilistic models of basic variables are based on the Probabilistic Model Code of JCSS [7], and on previous analyses made in the Klokner Institute CTU (see Markova [9] and Jung and Markova [10]). Fig. 9 indicates the range within which should be selected, for the design of “other” barriers, the impact forces Fd based on the target value of reliability index tabout 2.3 (corresponding to the target probability 0.01). The recommendations of the prescriptive document TP 114 [3], and also of EN 1991-2 [5] concerning the values of design impact forces which should be applied for “other” road bridge barriers, are shown to be significantly lacking, and need further consideration.
1000
1250
1500
1750
2000
2250
2500
2750
3000
4567-0,50
0,00
0,50
1,00
1,50
2,00
2,50
3,00
F d
d
2,50-3,00
2,00-2,50
1,50-2,00
1,00-1,50
0,50-1,00
0,00-0,50
-0,50-0,00
= 2,3
d [m]
Fd,x [kN]
t = 2,3
Figure 9: Design impact force Fd,x versus distance d of a heavy truck from centreline of a road for the target reliability index t for roadways.
374 Safety and Security Engineering VI
www.witpress.com, ISSN 1743-3509 (on-line) WIT Transactions on The Built Environment, Vol 151, © 2015 WIT Press
6 Conclusions
The crash test simulation is a complex problem depending on many input parameters of random character, and with complex boundary conditions. Modelling the crash test using nonlinear dynamic simulations has limiting conditions. Several problems need to be taken into account including contact tasks being crucial parameters for the stability of numerical
calculations and simulations, different friction coefficients in the radial and axial directions of tyres, required height of the size of curb rail which considerably affects the test
results and which is presently non harmonized, vehicle models should be validated to ensure a real deformation of the
structure, computational simulation should also take into account the real crash testing
conditions of the authorized body. Further improvements concerning some parts of the simulations of crash tests are foreseen to be made. The material characteristics and geometry of individual members of the road barrier should be well defined and optimized in simulations. Finally, the developed steel safety bridge barrier for the retention class H2 is going to be tested in a real crash test. The results of theoretical simulations will be compared with results of crash test making it possible to specify some foreseen modifications of the road barrier.
Acknowledgement
This study has been conducted within the framework of research project TA02030150 Application of Reliability Methods in Research and Verification of Innovative Road Safety Barriers.
References
[1] EN 1991-1-7, Eurocode 1 – Actions on structures: Part 1–7: General actions – Accidental actions, 2006
[2] Technical Report, Road restraint systems – Guidelines for computational mechanics of crash testing against vehicle restraint system, CEN/TC 226
[3] TP 114, Safety barriers on roads. Actions, specification of road barrier retention level and designing of “other” barriers on roads (in Czech). Technical requirements. Ministry of Transport, 2010
[4] EN 1317-2 Road restraint systems – Part 2: Performance classes, impact test acceptance criteria and test methods for safety barriers including vehicle parapets. CEN/TC 226, 2010
[5] EN 1991-2, Eurocode 1 Actions on structures: Part 2 - Traffic loads on bridges. 2003
[6] CSN 73 6201, Design of bridge assets (in Czech) ÚNMZ, 2008 [7] Probabilistic Model Code. 2012. JCSS. http://www.jcss.ethz.ch
Safety and Security Engineering VI 375
www.witpress.com, ISSN 1743-3509 (on-line) WIT Transactions on The Built Environment, Vol 151, © 2015 WIT Press
[8] ISO DP 10252, Accidental actions due to human activities, ISO, 1994 [9] Markova, J., Calibration of Safety Elements in Accidental Design
Situation. In: Esrel 2006. pp. 1515-1518. Estoril, 2006 [10] Jung, K. & Markova, J., Risk Assessment of Safety Barriers on Roads in
the Czech Republic. In: Esrel 2007. Stavanger, pp. 2615-2618, 2007
376 Safety and Security Engineering VI
www.witpress.com, ISSN 1743-3509 (on-line) WIT Transactions on The Built Environment, Vol 151, © 2015 WIT Press


![SIDISA 2012 - UniPa · experimental study on the reliability of column tests for the design of permeable reactive barriers [id 1121] - calabro’ p.s. combined use of reactive barrier](https://img.pdfslide.us/doc/110x75/5fc26adbe1405c39a03fd1e4/sidisa-2012-unipa-experimental-study-on-the-reliability-of-column-tests-for-the.jpg)