Embed Size (px)
Citation preview

ble at ScienceDirect
Petroleum 1 (2015) 244e250
Contents lists availa
Petroleum
journal homepage: www.keaipubl ishing.com/en/ journals /pet lm
Original article
Reliability analysis of Lan Chengyu corroded pipeline withassociated defects
Qin Li, Chunmei Sun*, Zhiqiang Huang, Xiang Xiao, Haiping Thang, Shiying ZhaoInstitute of Mechanical and Electrical Engineering, Southwest Petroleum University, Chengdu 610500, China
a r t i c l e i n f o
Article history:Received 13 May 2015Received in revised form8 July 2015Accepted 10 July 2015
Keywords:Corroded pipelineAssociated pipelineReliability analysisThe remaining lifeSensitivity
* Corresponding author.E-mail address: [email protected] (C. Sun).Peer review under responsibility of Southwest Pe
Production and Hosting by Elsev
http://dx.doi.org/10.1016/j.petlm.2015.07.0062405-6561/Copyright © 2015, Southwest Petroleum Uaccess article under the CC BY-NC-ND license (http://
a b s t r a c t
Traditional reliability evaluation method for corroded pipeline exists the problem of not consid-ering the associated defects. We therefore propose a new calculation method considering theassociated defects. In this paper, the traditional and new methods are respectively used to calculateand contrastively analyze the failure probability of corroded pipeline; we then perform the researchof residual life prediction for the corroded pipeline, followed by the sensitivity calculation of allrandom evaluation parameters. And then the Monte Carlo method (MCS) is applied to verify therationality of the new method. The research results show that: the method considering associateddefect is more objective, and truly react corroded pipeline's dynamic reliability changes; obtainnewmethod to predict residual life of corroded pipeline; corrosion depth, radial corrosion rate havea significant impact on reliability of corroded pipeline considering associated defects. The calcu-lation results of the method are more accurate, more time-saving.
Copyright © 2015, Southwest Petroleum University. Production and hosting by Elsevier B.V. onbehalf of KeAi Communications Co., Ltd. This is an open access article under the CC BY-NC-ND
license (http://creativecommons.org/licenses/by-nc-nd/4.0/).
1. Introduction
Considering the stability and security of the pipeline structure,in order to reduce the failure probability and prolong the servicelife of oil and gas pipelines, it's necessary to quantify the degree ofattenuation of structure performance. Thereby, we can optimizethe repair scheme and avoid the sudden failure of the pipeline [1].
The deterministic mechanics analysis method is usuallyapplied to the conventional pipeline reliability analysis [2].However, in fact the uncertainty caused by the corrosion defectsize, pipe material characteristics and working environment andso on influence the pipeline reliability analysis greatly [3]. Atpresent, even though the influence of uncertain factors on reli-ability has been considered, but most of them are based on theassumption that the corrosion defects on the mutual are inde-pendent. Nevertheless, for the reason of the work environment
troleum University.
ier on behalf of KeAi
niversity. Production and hostcreativecommons.org/licenses/b
and operational errors, the corrosion is a region, so the defectsare interrelated and interplay. As a consequence, the indepen-dent suption is uncorrect in practice. There is great conservatismto calculate reliability by using the theory of conditional inde-pendence assumption [4].
Furthermore, many scholars have made great efforts on thereliability of the pipeline and try to obtain the reliability theorywhich can satisfy the objective law of corroded pipeline withassociated defects. Hai Long-Zeng [5] considered the effect ofcorrosion associated defects, but it just could get the failureprobability of the upper and lower bounds and is not able tocalculate the failure probability value of associated defectsaccurately. In 2005, David et al. [6] used the first order and sec-ond moment method (FOSM) to do reliability analysis aboutassociated defects of corroded pipeline. However, FOSM can't gethigh accuracy results when the limit state function is strongnonlinear. According to the fatal weakness of FOSM, theadvanced first order and second moment method (AFOSM)overcomes this defect. In 2011, Wang Weihu, Lv Zhenzhou et al.[7] used the adaptive truncated sampling method to analyzereliability of corroded pipeline with associated defects. Althoughit improved the computational efficiency, it had low calculationstability, which couldn't be accepted by the engineeringproblems.
ing by Elsevier B.V. on behalf of KeAi Communications Co., Ltd. This is an openy-nc-nd/4.0/).

Q. Li et al. / Petroleum 1 (2015) 244e250 245
Therefore, this paper sets the associated defects of corrodedpipelines as the starting point and develops the research on thereliability and sensitivity analysis mathematical model ofcorroded pipeline with associated defects. Then it predicts theremaining life of corroded pipeline with associated defects byusing AFOSM and provides a more objective and effective reli-ability analysis method. Meanwhile, although MCS is time-consuming and complicated, as long as the calculation times ismuch enough, it has the characteristics of relatively accurate, soit is usually used to check precision of various reliability analysismethods [8].
2. Reliability analysis model of corroded pipeline
2.1. Conventional failure probability analysis model
Standards for evaluating pipeline failure pressure are ASMEB31G, Modified ASME B31G, Battelle, DNV-99, Shell-92 etc. andthe Modified ASME B31G is the most widely used among theexisting industry standards. The Modified ASME B31G standardis development from a full-scale burst test of pipe with defect,which is suitable for the evaluation of residual strength ofpipeline with volume defects. Besides, it is also used to evaluatethe situation that the corrosion depth between 10% and 80% ofthe wall thickness which is caused by internal and externalcorrosion [9]. For the pipeline just suffered internal pressure, theeffect of circumferential stress is the dominant factor [10]. Ac-cording to this model the failure pressure formula of pipeline isgiven by:
Pf ¼ ð2ðQ þ 68:95Þt=DÞ*ðð1� 0:85d=tÞ=ð1� 0:85d=MtÞÞ
G<4 (1)
G ¼ 0:893L. ffiffiffiffiffiffi
Dtp
(2)
where Q: the yield strength of pipe, t: pipewall thickness, D: pipeouter diameter, d: corrosion depth of pipeline, M: expansionfactor, L: defect length.
M ¼ffiffiffiffiffiffiffiffiffiffiffiffiffiffiffiffiffiffiffiffiffiffiffiffiffiffiffiffiffiffiffiffiffiffiffiffiffiffiffiffiffiffiffiffiffiffiffiffiffiffiffiffiffiffiffiffiffiffiffiffiffiffiffiffiffiffiffiffiffiffiffiffiffiffiffiffiffiffiffiffiffiffiffiffiffiffiffiffi1þ 0:6275L2
�ðDtÞ � 0:003375L4��
D2t2�q
L2.ðDtÞ � 50 (3)
M ¼ 0:032L2.ðDtÞ þ 3:3
L2.ðDtÞ>50 (4)
where L: the length of corrosion, t: pipe wall thickness, D:corroded pipeline (outer) diameter.
According to the statistical analysis of the previous test data,we obtain that the assumption on linear growth of corrosion rateis reasonable [11]. Based on this assumption, the initial value ofthe length, the depth can be indicated by L0, d0. So the steadygrowth prediction equation of corroded pipeline at T moment isgiven by:
L ¼ L0 þ VaðT � T0Þ (5)
d ¼ d0 þ VrðT � T0Þ (6)
In order to analyze the probabilistic characteristics of thedevelopment process of oil and gas corroded pipelines andevaluate the reliability of corroded pipeline, the correspondinglimit state function is given by:
gðxÞ ¼ Pf � P (7)
where Pf: pipe failure pressure, P: pipeline operating pressure.Plug (5), (6) into (7), the new limit state function of corroded
pipeline is given by:
gðxÞ¼ ð2ðQ þ68:95Þt=DÞ* ð1�0:85ðd0þVrðT�T0ÞÞÞ=tð1�0:85ðd0þVrðT�T0ÞÞÞ=Mt
�P
(8)
If g (x) > 0, the pipeline is reliable; g (x) < 0, the pipeline isfailure.
By using the AFOSM method to do reliability analysis, thefailure probability of pipeline with single corrosion defects isgiven by:
Pf ¼ Pðg<0Þ ¼ Fð�bÞ (9)
where F is standard normal distribution; b is the reliabilityindex.
b ¼ ug�sg (10)
where ug and sg stand for the mean and standard deviation inthe limit state function (8). There are lots of corrosion defects incorroded pipeline and its failure probability are Pf1, Pf2, Pf3…Pfn. So under the situation that the conventional assumption, thefailure probability can be expressed as follows [12]:
Pf ¼ 1�Yni¼1
�1� Pfi
�(11)
1.2. Failure probability model of corroded pipeline withassociated defects
The AFOSM analysis method is very efficient because itspreads the limit state function at design point (A point whichmake the largest contribution to failure probability), whichmakethe approximate value of the failure probability get higher ac-curacy [13]. Because of the relevance of corroded pipeline's de-fects, we can't simply assume that the defects are individual fromeach other. According to the probability theory, the failureprobability of n defects as follows:
Pf ¼Z
U1∪U2∪…Un
…
Zfx1;x2;…xnðx1…xnÞdx1…dxn (12)
where Ui ¼ (g < 0) for a single defect failure events fx1 x2…xn(x1…xn), the joint probability density function of failure for ndefects. But it is difficult to determine the joint probabilitydensity function of a number of defects. So Kounias and Hunterput forward the theory mode of upper and lower bounds of tocalculate failure probability [5].
Pf1 þmax
24Xn
i¼2
8<:Pfi �
Xi�1
j¼1
P�Ei; Ej
�9=;; 0
35 � Pf
�Xni¼1
Pfi �Xni¼2
maxj< i
P�Ei; Ej
�(13)

Q. Li et al. / Petroleum 1 (2015) 244e250246
Joint probability density function is still required in the for-mula and the calculation is difficult. For the normal variables,Ditleevsert put forward the famous two order narrow reliabilitytheory.
max½PðAÞ; PðBÞ� � P�Ei; Ej
� � PðAÞ þ PðBÞ (14)
PðAÞ ¼ Fð�bÞF�� �bj � rijbi
�. ffiffiffiffiffiffiffiffiffiffiffiffiffiffi1� r2ij
q �(15)
PðBÞ ¼ Fð�bÞF�� �bI � rIJbJ
�. ffiffiffiffiffiffiffiffiffiffiffiffiffiffi1� r2IJ
q �(16)
where Вi, bj reliability index are the two corroded defects, Pijcorrelation coefficient of two defects. The joint probability den-sity function (13) can be represented by the boundary function(14), but the Ditlevsert's two order narrow reliability theory,with the increase of correlation coefficient the failure probabilityinterval estimation is also increased. When it comes to thepipeline's reliability estimation, it's not only should calculate thereliability limit of corroded pipeline, but also need to calculatethe failure probability of corroded pipeline. So failure probabilityof n associated defect formulas is given by Ref. [5]:
Pf¼Pf1 þ ð1� r12ÞPf2 þ…þ ð1� r12…nÞPfn (17)
rij ¼ F��bij
�þ �Pfi.Pfj�CijF��bji�
(18)
Cij ¼ 0:5�r2ij þ rij
ffiffiffiffiffiffiffiffiffiffiffiffiffiffi1� r2ij
q �(19)
bij ¼�bi � rijbj
�. ffiffiffiffiffiffiffiffiffiffiffiffiffiffi1� r2ij
q; bji ¼
�bj � rijbi
�. ffiffiffiffiffiffiffiffiffiffiffiffiffiffi1� r2ij
q(20)
where r12…n is Correlation between r12…n�1 and rn, P 12…nis expressed as:
r12…n ¼ max�r1;n; r2;n;…rn�1;n
(21)
rij ¼ 0 has two defects are independent of each other, rij ¼ 1 thetwo defect completely related, 0 < rij<1 means the two defect isnot completely independent is not entirely associated.
3. Corroded pipeline reliability sensitivity analysis model
Pearson moment correlation coefficient indicates the linearcorrelation relationship of parameters, on the premise ofassuming that the distributions of random parameters arenormal distribution. However, Spearman calculated the rankcorrelation coefficient of the parameters without assumption,which is non parametric correlation and has more widelyapplication in the pipeline reliability evaluation [14].
Table 1Random parameters for reliability evaluation.
Parameter name Symbol Dimension
Pipe diameter D mmwall thickness t mmPressure P MPa
The yield strength Q MPa
Corrosion depth d mmcorrosion length L mmRadial corrosion rate Vr mm/aAxial corrosion rate Va mm/a
rsxy ¼ Xn
i¼1
�Ri � R
��Si � S
�!, ffiffiffiffiffiffiffiffiffiffiffiffiffiffiffiffiffiffiffiffiffiffiffiffiffiffiffiffiffiffiffiffiffiffiffiffiffiffiffiffiffiffiXni¼1
�Ri � R
��Si � S
�vuut (22)
R ¼ Q ¼ ðnþ 1Þ=2 (23)
Xni¼1
�Ri� R
�2 ¼Xni¼1
�Qi� Q
�2 ¼ n�n2 � 1
�.12 (24)
rsxy ¼ 12Xni¼1
RiQi� 3nðnþ 1Þ2!.
n�n2 � 1
�(25)
The reliability sensitivity is the ratio of the change of failureprobability caused by the change of random variables, whichreflect the effect degree that basic random variables has onfailure probability. Reliability sensitivity analysis is based on thebasis of reliability. Dimensionless regularization reliabilitysensitivity can give the importance ranking on the random pa-rameters that have effect on reliability. According to equation(25), we can calculate the Spearman correlation coefficientsamong every random variable and limit state function by usingASOSM and then do the Spearman correlation coefficient'ssquared percentage figure.
4. Analysis of cases
Take the pipeline from Chengxian to Guangyuan as anexample, it is 90 km in Lan-Cheng-yu pipeline. The randomevaluation parameters data are shown in Table 1.
4.1. The failure probability of corroded pipeline with associateddefect
4.1.1. Using the two order narrow reliability theory to verify thecorrectness of the new model
Dual mode of lower and upper bound theory is conducive tostudy the system uncertainty. As for the independent failuremodel, when the failure probability is very small, and the cor-relation coefficient is relatively small, the lower and upper limitrange is narrow [15]. Figs. 2e4 shows the defects number ofn ¼ 3, n ¼ 4, n ¼ 5, the failure probability is between the upperand lower bounds, and with the increase of the defects numberthe failure probability of associated defects is close to the upperbound, so illustrates the rationality of the calculation method. Atthe same time, the results of failure probability of corrodedpipeline with associated defects consistent with the trend ofliterature [6], have illustrated the validity of the analysis method.But the literature [6] did not consider the multi factor problem ofrandom parameters. Make no prediction of corroded pipelinelife, nor do the quantitative analysis of the impact factors ofrandom parameters. This paper tries to further improve the
Distribution type Mean Variance
Normal distribution 508 0.02Normal distribution 7.1e11.1 0.02Normal distribution 11 0.1Lognormal distribution 415e565 0.07Normal distribution 2.5 0.1Normal distribution 260 0.1Normal distribution 0.0213 0.0017Normal distribution 0.0234 0.002
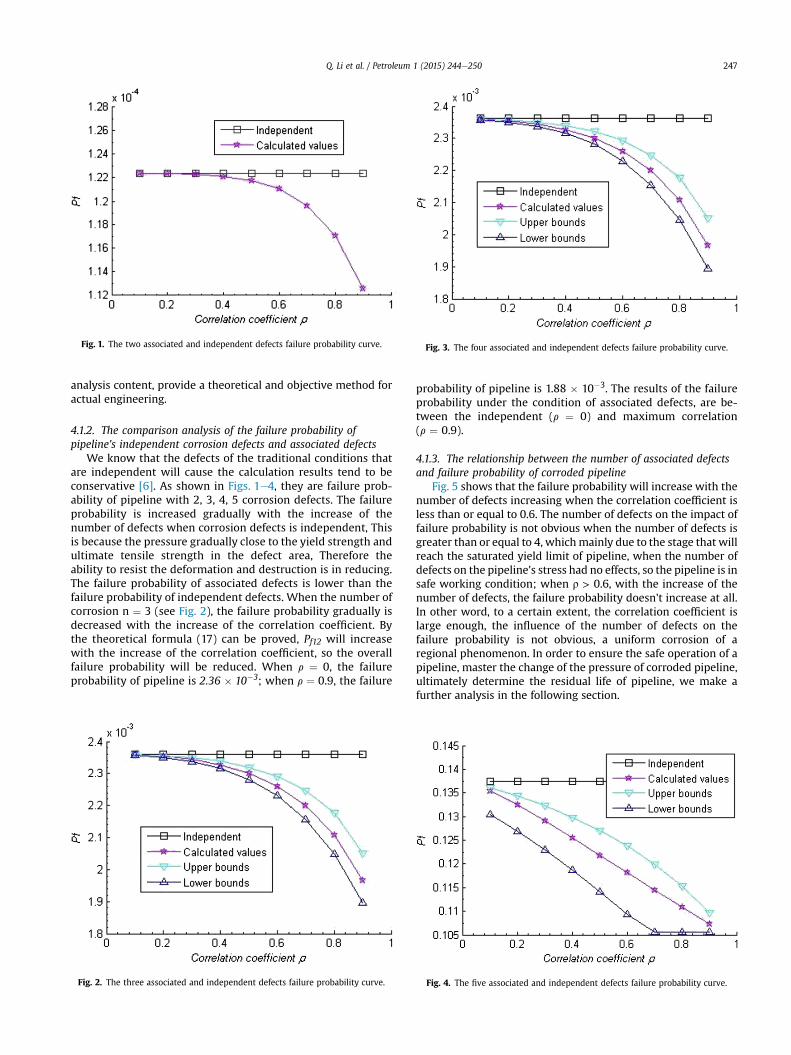
Fig. 1. The two associated and independent defects failure probability curve. Fig. 3. The four associated and independent defects failure probability curve.
Q. Li et al. / Petroleum 1 (2015) 244e250 247
analysis content, provide a theoretical and objective method foractual engineering.
4.1.2. The comparison analysis of the failure probability ofpipeline's independent corrosion defects and associated defects
We know that the defects of the traditional conditions thatare independent will cause the calculation results tend to beconservative [6]. As shown in Figs. 1e4, they are failure prob-ability of pipeline with 2, 3, 4, 5 corrosion defects. The failureprobability is increased gradually with the increase of thenumber of defects when corrosion defects is independent, Thisis because the pressure gradually close to the yield strength andultimate tensile strength in the defect area, Therefore theability to resist the deformation and destruction is in reducing.The failure probability of associated defects is lower than thefailure probability of independent defects. When the number ofcorrosion n ¼ 3 (see Fig. 2), the failure probability gradually isdecreased with the increase of the correlation coefficient. Bythe theoretical formula (17) can be proved, Pf12 will increasewith the increase of the correlation coefficient, so the overallfailure probability will be reduced. When r ¼ 0, the failureprobability of pipeline is 2.36 � 10�3; when r ¼ 0.9, the failure
Fig. 2. The three associated and independent defects failure probability curve.
probability of pipeline is 1.88 � 10�3. The results of the failureprobability under the condition of associated defects, are be-tween the independent (r ¼ 0) and maximum correlation(r ¼ 0.9).
4.1.3. The relationship between the number of associated defectsand failure probability of corroded pipeline
Fig. 5 shows that the failure probability will increase with thenumber of defects increasing when the correlation coefficient isless than or equal to 0.6. The number of defects on the impact offailure probability is not obvious when the number of defects isgreater than or equal to 4, whichmainly due to the stage that willreach the saturated yield limit of pipeline, when the number ofdefects on the pipeline's stress had no effects, so the pipeline is insafe working condition; when r > 0.6, with the increase of thenumber of defects, the failure probability doesn't increase at all.In other word, to a certain extent, the correlation coefficient islarge enough, the influence of the number of defects on thefailure probability is not obvious, a uniform corrosion of aregional phenomenon. In order to ensure the safe operation of apipeline, master the change of the pressure of corroded pipeline,ultimately determine the residual life of pipeline, we make afurther analysis in the following section.
Fig. 4. The five associated and independent defects failure probability curve.

Fig. 5. The curve between the number of associated defects and failure probability.
Q. Li et al. / Petroleum 1 (2015) 244e250248
4.2. The life prediction of corroded pipeline
Based on the target reliability, which determine the remain-ing life of the corroded pipeline. DNV and API Standard Specifi-cation pointed out that the maximum failure probability is notgreater than 10�5, 10�5 as a starting point for evaluating theresidual life of corroded pipeline. Fig. 6 shows the relationshipbetween the service time and the failure probability of pipeline.When the service time is less than 21 years, the failure proba-bility is almost zero, when the pipeline resistance is far greaterthan the pressure, which is in the safe operation stage; theoperation time in 21 years, with the extension of time, thestructure of small changes will cause the failure probabilitygreatly increased of the whole system, pipeline's securitybecome very sensitive. By AFOSM analysis, when n ¼ 1, T ¼ 25,the failure probability reached 1e-5. When n ¼ 2, T ¼ 23.5, thefailure probability is up to 1e-5. When n ¼ 3, T ¼ 23, the failureprobability reached 1e-5. When n ¼ 4 and n ¼ 5 T ¼ 22, thefailure probability is up to 1e�5, therefore to predict theremaining life of corroded pipeline, and take correspondingmeasures in a timely manner. r ¼ 0.7 and r ¼ 0.8 the corre-sponding n ¼ 4 and n ¼ 5 two curves almost coincide, alsoverified the conclusion of 3.1 (3). That is, when p > 0.6, influenceof the number of defects on the failure probability is very small;first order second moment method (FOSM) analysis diagramshows, when n ¼ 2 T ¼ 24, the failure probability reached 1e�5.
Fig. 6. Life prediction curve of corroded pipeline with associated defects.
Under the same conditions, the failure probability of AFOSM isless than the value of FOSM. This is because AFOSM is starting atthe design point of the nonlinear limit state function (8). It is inthe point which is the biggest contributing to the failure prob-ability. Therefore, AFOSM has a higher accuracy to approximatefailure probability of corroded pipeline.
4.3. Verify the reliability analytical methods
With the method in this paper, the correlation coefficient ofthe pipeline is 0.3, using MCS and AFOSM to calculate failureprobability of corroded pipeline and make comparative analysisin Fig. 7 and Table 2. As shown in Fig. 7, there are no significantdifferences between the failure probabilities of the twomethods,onlywhen the correlation coefficient is relatively small therewillbe a slight gap. This is because when the correlation coefficient isrelatively small, closing to the defects independent with eachother, and the Monte Carlo method is conservative. But with theincrease in the correlation coefficient, the failure probabilitycurves are almost coincide, indicating the validity of the pro-posed method.
As can be seen from Table 2, when the number of cycles isincreased, the failure probability is varied within the range of0.001% by AFOSM and the failure probability of MCS in the rangeof 0.011%. At the same time it is clear that the increase in thecalculation time of the AFOSM is not obvious, while the MCScomputation time increase is very obvious, which shows that thecalculation of AFOSM is high efficiency.
4.4. Sensitivity analysis of corroded pipeline
As shown in Fig. 8 and 9 each random assessment parametersensitivity analysis with AFOSM of two situation namely Inde-pendent defects and associated defects, respectively. Eachrandom parameter ratio represents the impacting extent oncorroded pipeline reliability, positive number indicates a positivecorrelation while a negative number indicates a negative one.
As shown in Fig. 8, when any one of them as a random vari-ables and the other six variables as a given value, calculating eachrandom parameters' spearman rank correlation coefficient oflimit state function, the proportion of radial corrosion rate
Fig. 7. Comparison of two calculation results.
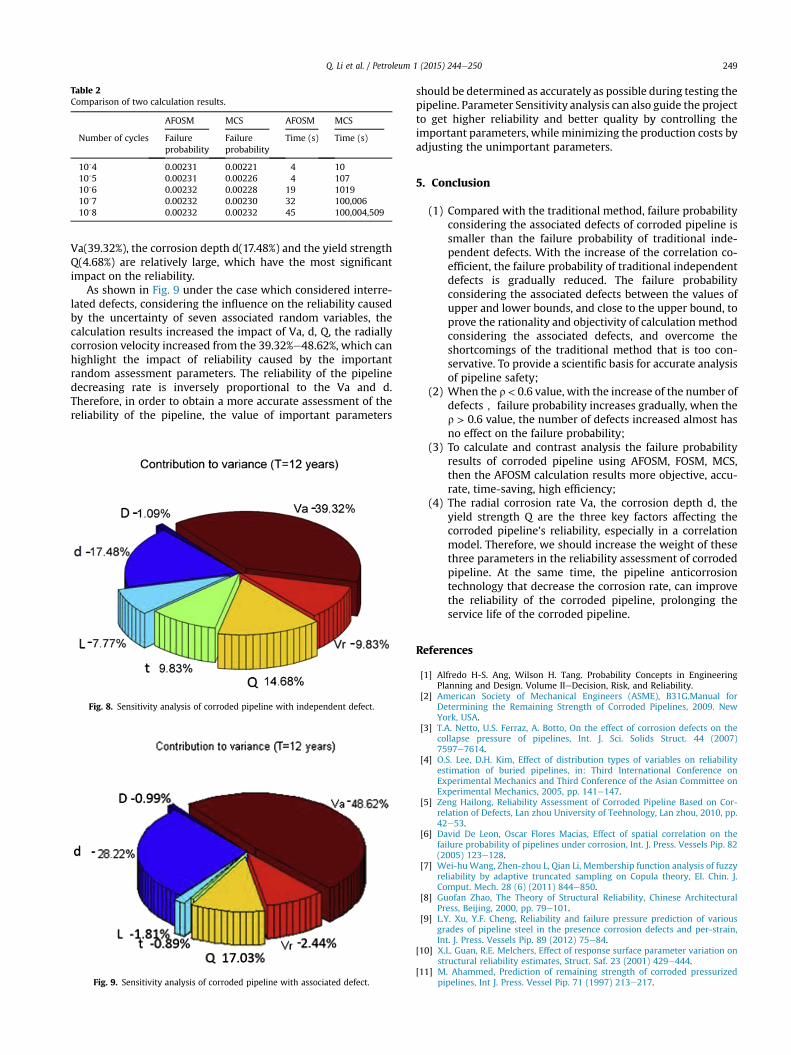
Table 2Comparison of two calculation results.
AFOSM MCS AFOSM MCS
Number of cycles Failureprobability
Failureprobability
Time (s) Time (s)
10^4 0.00231 0.00221 4 1010^5 0.00231 0.00226 4 10710^6 0.00232 0.00228 19 101910^7 0.00232 0.00230 32 100,00610^8 0.00232 0.00232 45 100,004,509
Q. Li et al. / Petroleum 1 (2015) 244e250 249
Va(39.32%), the corrosion depth d(17.48%) and the yield strengthQ(4.68%) are relatively large, which have the most significantimpact on the reliability.
As shown in Fig. 9 under the case which considered interre-lated defects, considering the influence on the reliability causedby the uncertainty of seven associated random variables, thecalculation results increased the impact of Va, d, Q, the radiallycorrosion velocity increased from the 39.32%e48.62%, which canhighlight the impact of reliability caused by the importantrandom assessment parameters. The reliability of the pipelinedecreasing rate is inversely proportional to the Va and d.Therefore, in order to obtain a more accurate assessment of thereliability of the pipeline, the value of important parameters
Fig. 8. Sensitivity analysis of corroded pipeline with independent defect.
Fig. 9. Sensitivity analysis of corroded pipeline with associated defect.
should be determined as accurately as possible during testing thepipeline. Parameter Sensitivity analysis can also guide the projectto get higher reliability and better quality by controlling theimportant parameters, while minimizing the production costs byadjusting the unimportant parameters.
5. Conclusion
(1) Compared with the traditional method, failure probabilityconsidering the associated defects of corroded pipeline issmaller than the failure probability of traditional inde-pendent defects. With the increase of the correlation co-efficient, the failure probability of traditional independentdefects is gradually reduced. The failure probabilityconsidering the associated defects between the values ofupper and lower bounds, and close to the upper bound, toprove the rationality and objectivity of calculation methodconsidering the associated defects, and overcome theshortcomings of the traditional method that is too con-servative. To provide a scientific basis for accurate analysisof pipeline safety;
(2) When the r < 0.6 value, with the increase of the number ofdefects, failure probability increases gradually, when ther > 0.6 value, the number of defects increased almost hasno effect on the failure probability;
(3) To calculate and contrast analysis the failure probabilityresults of corroded pipeline using AFOSM, FOSM, MCS,then the AFOSM calculation results more objective, accu-rate, time-saving, high efficiency;
(4) The radial corrosion rate Va, the corrosion depth d, theyield strength Q are the three key factors affecting thecorroded pipeline's reliability, especially in a correlationmodel. Therefore, we should increase the weight of thesethree parameters in the reliability assessment of corrodedpipeline. At the same time, the pipeline anticorrosiontechnology that decrease the corrosion rate, can improvethe reliability of the corroded pipeline, prolonging theservice life of the corroded pipeline.
References
[1] Alfredo H-S. Ang, Wilson H. Tang. Probability Concepts in EngineeringPlanning and Design. Volume IIeDecision, Risk, and Reliability.
[2] American Society of Mechanical Engineers (ASME), B31G.Manual forDetermining the Remaining Strength of Corroded Pipelines, 2009. NewYork, USA.
[3] T.A. Netto, U.S. Ferraz, A. Botto, On the effect of corrosion defects on thecollapse pressure of pipelines, Int. J. Sci. Solids Struct. 44 (2007)7597e7614.
[4] O.S. Lee, D.H. Kim, Effect of distribution types of variables on reliabilityestimation of buried pipelines, in: Third International Conference onExperimental Mechanics and Third Conference of the Asian Committee onExperimental Mechanics, 2005, pp. 141e147.
[5] Zeng Hailong, Reliability Assessment of Corroded Pipeline Based on Cor-relation of Defects, Lan zhou University of Teehnology, Lan zhou, 2010, pp.42e53.
[6] David De Leon, Oscar Flores Macias, Effect of spatial correlation on thefailure probability of pipelines under corrosion, Int. J. Press. Vessels Pip. 82(2005) 123e128.
[7] Wei-huWang, Zhen-zhou L, Qian Li, Membership function analysis of fuzzyreliability by adaptive truncated sampling on Copula theory, EI. Chin. J.Comput. Mech. 28 (6) (2011) 844e850.
[8] Guofan Zhao, The Theory of Structural Reliability, Chinese ArchitecturalPress, Beijing, 2000, pp. 79e101.
[9] L.Y. Xu, Y.F. Cheng, Reliability and failure pressure prediction of variousgrades of pipeline steel in the presence corrosion defects and per-strain,Int. J. Press. Vessels Pip. 89 (2012) 75e84.
[10] X.L. Guan, R.E. Melchers, Effect of response surface parameter variation onstructural reliability estimates, Struct. Saf. 23 (2001) 429e444.
[11] M. Ahammed, Prediction of remaining strength of corroded pressurizedpipelines, Int J. Press. Vessel Pip. 71 (1997) 213e217.

Q. Li et al. / Petroleum 1 (2015) 244e250250
[12] Min Xiang, Reliability of on line corrosion monitoring system, J. SouthwestPetrol. Univ. 29 (3) (2007) 157e161.
[13] Zhenzhou Lv, Analysis of Structure Reliability and Reliability Sensitivity,Science Press, 2009, pp. 9e33, 91-120.
[14] Jinglong Wang, Nonparametric Statistical Analysis, Higher education press,Beijing, 2006, pp. 130e146.
[15] Ditlevsen, Narrow reliability bounds for structural systems, J. Struct. Mech.(1979) 453e472.