Embed Size (px)
Citation preview

Reliability Analysis of High-Rise Buildings under Wind Loads
Ming-Yi Liu
1) and Yu-Jie Li
2)
1)Department of Civil Engineering, Chung Yuan Christian University, Jhongli City, Taoyuan County 32023,
Taiwan, [email protected] 2)
Department of Civil Engineering, Chung Yuan Christian University, Jhongli City, Taoyuan County 32023,
Taiwan, [email protected]
Abstract: The objective of this paper is to conduct the reliability analysis of high-rise buildings under wind
loads. Numerical examples are provided to capture the dynamic effects of structures with eccentricity
between the elastic and mass centers. The framework of this research consists of two stages. The first stage
includes two parts: the deterministic analysis of wind-induced acceleration for a variety of attack angles,
i.e., the demand, and the determination of allowable acceleration based on the occupant comfort criteria for
wind-excited buildings, i.e., the capacity. According to the results obtained in the first stage, the reliability
analysis is conducted in the second stage, which can predict the probability of dissatisfaction with occupant
comfort criteria for a variety of probability distributions of the structural eccentricity. The findings indicate
that, compared to the lognormal and type I extreme value distributions, the normal distribution can be used
to more conservatively simulate the uncertainties of the eccentricity between the elastic and mass centers.
Furthermore, the probability of dissatisfaction with occupant comfort criteria of the torsionally coupled
system is relatively higher than that of the torsionally uncoupled system for each attack angle due to the
coupled mode effects.
Keywords: Reliability analysis, High-rise building, Wind load, Elastic center, Attack angle
1. Introduction
Traditionally, structural analysis is based on deterministic approaches, i.e., each parameter of analytical
model is considered to be a certain value. In fact, uncertainties exist in design, construction, operation and
maintenance of real structures. Consequently, traditional analysis is not able to effectively capture structural
properties. On the basis of probabilistic approaches, reliability analysis is used to simulate probability
distribution of each parameter, implying that uncertainties can be reasonably modeled by such method. This
fact indicates that reliability analysis is a more appropriate tool than traditional analysis. In Taiwan, both
structural safety and occupant comfort of high-rise buildings have become important due to frequent
typhoons, implying that wind hazard is a significant factor for design purposes. Uncertainties of both wind
loads and high-rise buildings have to be considered for structural design. From the above description,
reliability analysis is useful for exploring the problem of high-rise buildings under wind loads.
The objective of this paper is to conduct the reliability analysis of high-rise buildings under wind loads.
Numerical examples are provided to capture the dynamic effects of structures with eccentricity between the
elastic and mass centers. The framework of this research consists of two stages, as shown in Figure 1. The
first stage includes two parts: the deterministic analysis of wind-induced acceleration for a variety of attack
angles, i.e., the demand, and the determination of allowable acceleration based on the occupant comfort
5th International Conference on Reliable Engineering Computing (REC 2012) Edited by M. Vořechovský, V. Sadílek, S. Seitl, V. Veselý, R. L. Muhanna and R. L. Mullen Copyright © 2012 BUT FCE, Institute of Structural Mechanics ISBN 978-80-214-4507-9. Published by Ing. Vladislav Pokorný − LITERA
271

Ming-Yi Liu and Yu-Jie Li
criteria for wind-excited buildings, i.e., the capacity. According to the results obtained in the first stage, the
reliability analysis is conducted in the second stage, which can predict the probability of dissatisfaction with
occupant comfort criteria for a variety of probability distributions of the structural eccentricity.
Probability of dissatisfaction
with occupant comfort criteria
Cross-spectral density function
of wind velocity
Cross-spectral density function
of wind load
Root-mean-square acceleration
at corner
Wind velocity profile
Wind load model
Cross-spectral density function
of acceleration
Frequency response function
of acceleration
Mass, stiffness and damping matrices
High-rise building model
Peak factor
Root-mean-square acceleration
at mass center
Peak acceleration
at corner
Demand
(frequency domain analysis)
Allowable peak acceleration
Capacity
(occupant comfort criteria)
Rackwitz-Fiessler method Finite difference method
Design point
Reliability analysis
(synthetic method)
The second stage
The first stage
Reliability index
Figure 1. Framework of the research.
272
5th International Conference on Reliable Engineering Computing (REC 2012)

Reliability Analysis of High-Rise Buildings under Wind Loads
2. High-Rise Building Model
An N -story torsionally coupled system is used to simulate a high-rise building, and its corresponding
three-dimensional configuration and top view of the i th floor are illustrated in Figure 2(a) and 2(b),
respectively1, where x , y , z and are the coordinates of the system;
iD ,
iB ,
iH and iZ are the depth,
breadth, height and elevation, respectively; iMC ,
iEC and
iAC are the mass, elastic and aerodynamic
centers, respectively; iEx and
iEy are the eccentricities between i
EC and iMC in the x and y axes,
respectively; iAx and
iAy are the eccentricities between i
AC and iMC in the x and y axes, respectively.
Several assumptions are adopted in this study: (1) each rigid diaphragm with three degrees of freedom ix ,
iy and
i is characterized by the mass i
M and the moment of inertia iI about
iMC ; (2) each massless
column is characterized by iKx ,
iKy and i
K , which individually denote the stiffnesses in the x , y and
axes referred to i
EC ; (3) wind loads are applied at i
AC ; (4) iMC , i
EC and i
AC are non-coincident, and
iMC is located in the centroid of the diaphragm; (5) the Rayleigh damping with the mass-related coefficient
0A and the stiffness-related coefficient
1A is used. The model in Figure 2 can be simplified to an N -story
torsionally uncoupled system when iEx and
iEy both equal zero.
The procedure for the modeling of high-rise buildings is summarized in Figure 1. Based on the
parameters mentioned above, the mass, stiffness and damping matrices of the system can be generated, and
the frequency response function of acceleration can therefore be obtained (Kan and Chopra, 1977; Yang et
al., 1981; Samali et al., 1985; Kareem, 1985; Kareem, 1992; Wu and Yang, 2000; Liu et al., 2008).
3. Wind Load Model
Wind loads can be decomposed into an average, aerodynamic damping and fluctuation terms. The
fluctuation term is considered and the other two terms are neglected, which can be used to appropriately
conduct the dynamic analysis under the assumption of small deformation theory. The wind load
components including the drag, lift and torque are illustrated in Figure 3, where the attack angle is
defined as the angle between the wind direction and the x axis. The drag and lift both act through i
AC ,
where the former and the latter are parallel and perpendicular to the wind direction, respectively. The torque
is due to the eccentricity between iAC and iMC . The drag, lift and torque can be written as a function of
(Yang et al., 1981; Samali et al., 1985; Wu and Yang, 2000; Simiu and Scanlan, 1996; Peng, 2005).
The procedure for the computation of wind loads is summarized in Figure 1. According to the power
law, the wind velocity profile showing the variations in the mean wind velocity over the elevation can be
expressed as a function of the exponent , the gradient height GZ and the gradient wind velocity
GV
(Simiu and Scanlan, 1996). Based on the wind velocity profile, the reference mean wind velocity at 10 m
above the ground RV , the ground roughness coefficient
0K and the exponential decay coefficient
1C are
used to calculate the cross-spectral density function of wind velocity between two elevations (Davenport,
1 The subscript i in Figure 1 represents the parameter of the i th floor in this research.
5th International Conference on Reliable Engineering Computing (REC 2012)
273

Ming-Yi Liu and Yu-Jie Li
1968). By combining both the wind velocity profile and cross-spectral density function of wind velocity,
the cross-spectral density function of wind load between two axes can be obtained by the air density , the
windward side area of floor, the mean wind velocity, the drag coefficient DC , the lift coefficient
LC , iAx
and iAy for a variety of (Yang et al., 1981; Samali et al., 1985; Wu and Yang, 2000).
Elastic
Center
Axis
Mass
Center
Axis
ith Floor
2nd Floor
Nth Floor
(N-1)th Floor
1st Floor
Di
BiHi
Zi
Aerodynamic
Center
Axis
θixi
yi
θ
y
x
z
MCi
ECi
ACi
x
y
Di
Bi
Ayi
Axi
Eyi
Exi
θ
(a) Three-dimensional configuration (b) Top view of the i th floor
Figure 2. N -story torsionally coupled system.
274
5th International Conference on Reliable Engineering Computing (REC 2012)

Reliability Analysis of High-Rise Buildings under Wind Loads
MCi
ECi
ACi
x
y
Di
Bi θ
Drag
Lift
Torque
Wind Direction
Figure 3. Wind load components.
4. Demand and Capacity
As shown in Figure 1, the deterministic analysis of wind-induced acceleration of structures with
eccentricity between i
EC and iMC for a variety of is conducted from the high-rise building and wind
load models. The computational procedure is based on the frequency domain analysis. By combining both
the frequency response function of acceleration and cross-spectral density function of wind load, the cross-
spectral density function of acceleration between two axes, and the corresponding root-mean-square
acceleration at mass center and that at corner can be calculated (Kareem, 1985; Kareem, 1992). The peak
acceleration at corner, i.e., the demand, then can be obtained by multiplying the response at mass center by
the peak factor (Melbourne, 1977).
The allowable peak acceleration of structures, i.e., the capacity, can be determined based on the
occupant comfort criteria for wind-excited buildings. The threshold can be written as a function of the
frequency of structural oscillation F , the duration of wind velocity T and the return period of wind
velocity R (Melbourne and Palmer, 1992).
5. Reliability Analysis
According to the demand and capacity for different attack angles obtained in the first stage, the reliability
analysis of high-rise buildings under wind loads based on the synthetic method combining both the
Rackwitz-Fiessler and finite difference methods is conducted in the second stage, which can predict the
5th International Conference on Reliable Engineering Computing (REC 2012)
275

Ming-Yi Liu and Yu-Jie Li
design point, reliability index and probability of dissatisfaction with occupant comfort criteria for a variety
of probability distributions of the structural eccentricity, as shown in Figure 1.
The basic variables iX ( ni ,,2,1 ) and the corresponding limit state function
nXXXgZ ,,,21
are the essences of reliability analysis. iX ( ni ,,2,1 ) can be used to simulate the uncertainties of n
parameters in a system. Z is the standard to judge whether each performance criterion is satisfied in the
system. Figure 4(a) illustrates the relationships between Z and iX ( ni ,,2,1 ) in the original coordinate
system. The limit state ( 0Z ) is the boundary between the safe region ( 0Z ) and the unsafe region
( 0Z ). iX ( ni ,,2,1 ) can be transformed to the standard normal variables
iX ( ni ,,2,1 ),
respectively, and the corresponding limit state function nXXXgZ ,,,
21 can therefore be determined.
The relationships between Z and iX ( ni ,,2,1 ) in the transformed coordinate system are illustrated in
Figure 4(b). The safe region ( 0Z ) and the unsafe region ( 0Z ) are divided by the limit state ( 0Z )
similar to Figure 4(a). The design point *,*,*,21 nxxx 2
is located in 0Z closest to the origin. The
reliability index with the distance between the design point and the origin is a useful index for assessing
the system reliability. The probability of dissatisfaction with occupant comfort criteria fp can be expressed
as a function of (Haldar and Mahadevan, 2000a; Haldar and Mahadevan, 2000b).
0Z
0Z
0ZLimit state
Unsafe region
Safe region
Limit state function
1X
2X nXXXgZ ,,, 21 Basic variable
Basic variable
0Z
0Z
0Z
1X
2X nXXXgZ ,,, 21
*,*,*, 21 nxxx
Design point
Reliability
index
Basic variable
Basic variable
Unsafe regionLimit state
Safe region
Limit state function
(a) Original coordinate system (b) Transformed coordinate system
Figure 4. Relationships between the limit state function and the basic variables.
The Rackwitz-Fiessler method contains the parameters in both the original and transformed coordinate
systems. The algorithm is formulated as follows (Rackwitz and Fiessler, 1978):
2 The parameters marked with asterisk represent the ones based on the design point in this research.
276
5th International Conference on Reliable Engineering Computing (REC 2012)

Reliability Analysis of High-Rise Buildings under Wind Loads
Step 1. Z is defined.
Step 2. The initial value for each component of the design point in the original coordinate system
*ix ( ni ,,2,1 ) is given. These values are assumed to be iX
( ni ,,2,1 ) representing the mean
values of iX ( ni ,,2,1 ), respectively. The corresponding initial value of *,*,*,
21 nxxxg can
therefore be determined.
Step 3. For the non-normal variables in iX ( ni ,,2,1 ), both their mean values and standard deviations of
the equivalent normal variables, i.e., N
X i and N
X i ( ni ,,2,1 ), respectively, can be estimated
based on the Rackwitz-Fiessler transformation (Rackwitz and Fiessler, 1976). *ix ( ni ,,2,1 )
then can be calculated as
N
X
N
Xi
i
i
ix
x
** . (1)
Step 4.
*
iX
g( ni ,,2,1 ) are calculated.
Step 5.
*
iX
g( ni ,,2,1 ) can be calculated as
N
X
ii
iX
g
X
g
**
. (2)
Step 6. *ix ( ni ,,2,1 ) can be modified by the recursive formula
**
2
*
1
1
*2
21
1
*
21,,,
*,*,*,*
*,*,*,n
n
i i
n
n
i
i
i
nX
g
X
g
X
g
X
g
xxxgxX
g
xxxNew
. (3)
Step 7. can be calculated as
2
1
*
n
i
ix , (4)
indicating that its value is equal to the distance between *,*,*,21 nxxx and the origin. The
convergence tolerance for is assigned.
5th International Conference on Reliable Engineering Computing (REC 2012)
277

Ming-Yi Liu and Yu-Jie Li
Step 8. Eq. (1) can be rewritten as
**i
N
X
N
Xixxii
, (5)
implying that *ix ( ni ,,2,1 ) are modified and *,*,*,21 nxxxg can therefore be redetermined.
The convergence tolerance for *,*,*,21 nxxxg is assigned. Steps 3 to 8 are repeated until the
convergence tolerances for both and *,*,*,21 nxxxg are achieved.
Eqs. (1), (2) and (5) will also be valid for the normal variables in iX ( ni ,,2,1 ) if N
X i and N
X i are
replaced by their mean values iX
and standard deviations iX
( ni ,,2,1 ), respectively. fp can be
approximately estimated based on the convergent .
The finite difference method used herein is a perturbation-based approach. The computational
procedure is summarized as follows (Haldar and Mahadevan, 2000b):
Step 1. The initial values of iX , i.e., 0
iX ( ni ,,2,1 ), are assumed to be
iX ( ni ,,2,1 ), respectively.
The corresponding value of Z before perturbation can therefore be determined as
00
2
0
10,,,
nXXXgZ . (6)
Step 2. The small and positive 1X with respect to the perturbation of
1X is given.
1X is assumed to be
proportional to 1X
. 0
1X is replaced by
1
0
1XX and 0
iX ( ni ,,3,2 ) remain the previous
values. The corresponding value of Z after perturbation can therefore be determined as
00
21
0
11,,,
nXXXXgZ . (7)
Step 3. The difference of Z before and after perturbation can be calculated as
01ZZZ . (8)
The derivative of Z with respect to 1X can be approximately estimated as
1X
Z
.
Step 4. Similarly, the derivatives of Z with respect to iX ( ni ,,3,2 ) can also be approximately obtained
as iX
Z
( ni ,,3,2 ), respectively, by repeating Steps 2 and 3.
278
5th International Conference on Reliable Engineering Computing (REC 2012)

Reliability Analysis of High-Rise Buildings under Wind Loads
By individually substituting 00
2
0
1,,,
nXXXg and
iX
Z
( ni ,,2,1 ) of the finite difference method
for *,*,*,21 nxxxg and
*
iX
g( ni ,,2,1 ) of the Rackwitz-Fiessler method, these two methods can
be combined (Haldar and Mahadevan, 2000b).
6. Numerical Examples
To illustrate the computational procedure in Figure 1, two numerical examples, i.e., the torsionally
uncoupled and coupled systems, are provided to conduct the reliability analysis of high-rise buildings under
wind loads for a variety of attack angles. The results can be used to capture the dynamic effects due to the
structural eccentricity.
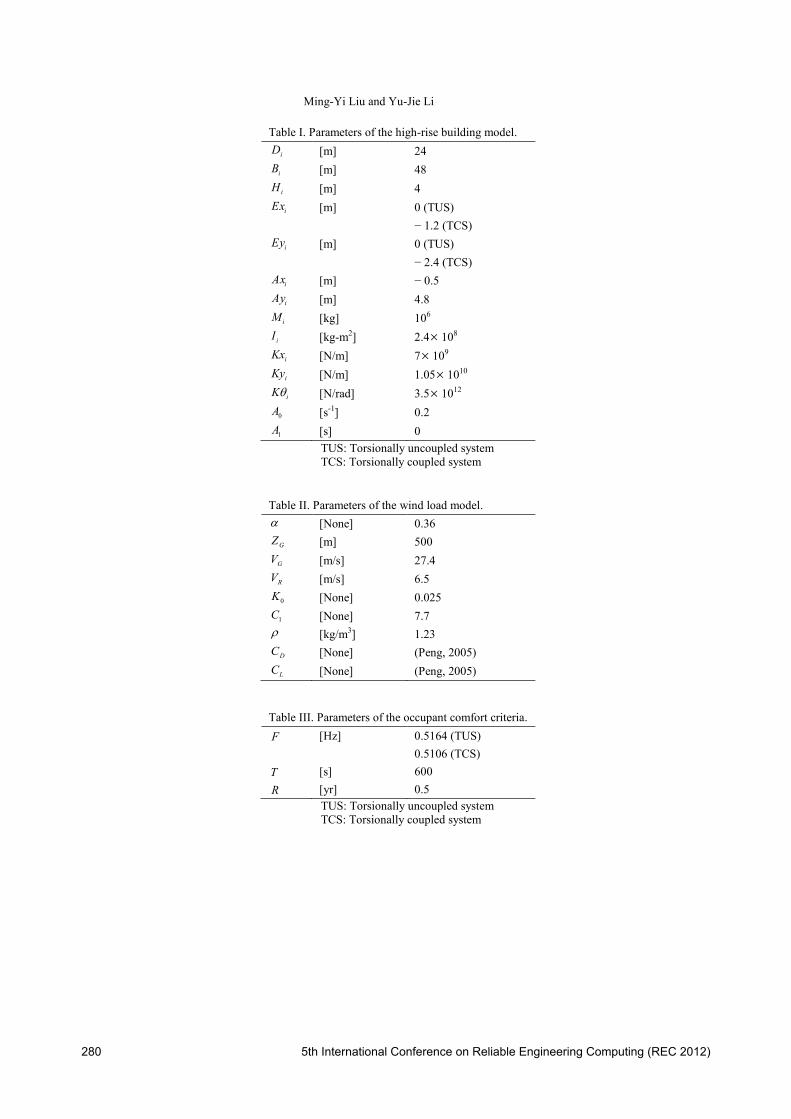
Four types of parameters: the high-rise building model, wind load model, occupant comfort criteria and
reliability analysis, are considered in this study. All parameters of the two numerical examples are the same
except the eccentricity between the elastic and mass centers. For the parameters of the high-rise building
model, a 40-story building ( N 40) with a height of 160 m is used. The geometric configuration and
dynamic properties of each floor are assumed to be identical, as shown in Table I. Table II summarizes the
parameters of the wind load model, where DC and
LC are a function of (Peng, 2005). Table III lists the
parameters of the occupant comfort criteria, where F is selected from the natural frequency of the first
mode of each system. The parameters of the reliability analysis are illustrated in Table IV, where 1X and
2X are employed to simulate
iEx and iEy , respectively. For both the torsionally uncoupled and coupled
systems, iXEx
1 and iX
Ey2
are given, and the probability distribution of 1X and that of
2X are
assumed to be identical. Three types of probability distributions: the normal, lognormal and type I extreme
value distributions, are used to model the uncertainties of both 1X and
2X .
The acceleration at the top floor corner is the target of both the deterministic and reliability analyses.
This is because such response is the maximum throughout the system. The relationships between the peak
acceleration at corner of the 40th floor, i.e., the demand, and for the torsionally uncoupled and coupled
systems are shown in Figure 5(a) and 5(b), respectively. The allowable peak acceleration independent of i.e., the capacity, is displayed in the figures. Both the figures illustrate that the demand is comparatively
lower than the capacity for each . Consequently, the occupant comfort criteria are satisfied in the two
numerical examples from the viewpoint of deterministic approaches. These two figures also show that the
maximum peak acceleration occurs when the wind direction is parallel to the x axis, i.e., = 0˚ or 180˚. The
peak acceleration of the torsionally coupled system is relatively higher than that of the torsionally
uncoupled system for each due to the coupled mode effects.
5th International Conference on Reliable Engineering Computing (REC 2012)
279
Ming-Yi Liu and Yu-Jie Li
Table I. Parameters of the high-rise building model.
iD [m] 24
iB [m] 48
iH [m] 4
iEx [m] 0 (TUS)
− 1.2 (TCS)
iEy [m] 0 (TUS)
− 2.4 (TCS)
iAx [m] − 0.5
iAy [m] 4.8
iM [kg] 106
iI [kg-m2] 2.4 108
iKx
[N/m] 7 109
iKy
[N/m] 1.05 1010
iK
[N/rad] 3.5 1012
0A [s-1] 0.2
1A [s] 0
TUS: Torsionally uncoupled system
TCS: Torsionally coupled system
Table II. Parameters of the wind load model.
[None] 0.36
GZ [m] 500
GV [m/s] 27.4
RV [m/s] 6.5
0K [None] 0.025
1C [None] 7.7
[kg/m3] 1.23
DC [None] (Peng, 2005)
LC [None] (Peng, 2005)
Table III. Parameters of the occupant comfort criteria.
F
[Hz] 0.5164 (TUS)
0.5106 (TCS)
T
[s] 600
R
[yr] 0.5
TUS: Torsionally uncoupled system
TCS: Torsionally coupled system
280
5th International Conference on Reliable Engineering Computing (REC 2012)

Reliability Analysis of High-Rise Buildings under Wind Loads
Table IV. Parameters of the reliability analysis.
1X
[m] 0 (TUS)
− 1.2 (TCS)
2X
[m] 0 (TUS)
− 2.4 (TCS)
1X
[m] 0.8
2X
[m] 0.8
TUS: Torsionally uncoupled system
TCS: Torsionally coupled system
0.02
0.04
0.06
0.08
0.1
30
210
60
240
90
270
120
300
150
330
180 0
Unit: m/sec2
Capacity
Demand
0.0625
0.02
0.04
0.06
0.08
0.1
30
210
60
240
90
270
120
300
150
330
180 0
Unit: m/sec2
Capacity
Demand
0.0627
(a) Torsionally uncoupled system (b) Torsionally coupled system
Figure 5. Relationships between the peak acceleration at corner of the 40th floor and the attack angle.
The reliability analysis is conducted based on the demand and capacity obtained by the deterministic
analysis. The relationships between the probability of dissatisfaction with occupant comfort criteria for
three types of probability distributions of the structural eccentricity, i.e., the normal, lognormal and type I
extreme value distributions, and for the torsionally uncoupled and coupled systems are shown in Figure
6(a) and 6(b), respectively. Both the figures illustrate that the probability for the case of the normal
distribution is relatively higher than that for the other two cases for each . Furthermore, the probability for
the case of the lognormal distribution is close to that of the type I extreme value distribution for each .
The findings indicate that, compared to the lognormal and type I extreme value distributions, the normal
distribution can be used to more conservatively simulate the uncertainties of the eccentricity between iEC
and iMC in the two numerical examples from the viewpoint of probabilistic approaches. These two figures
also show that the maximum probability occurs when the wind direction is parallel to the x axis, i.e., 0˚
or 180˚. The probability of the torsionally coupled system is relatively higher than that of the torsionally
5th International Conference on Reliable Engineering Computing (REC 2012)
281

Ming-Yi Liu and Yu-Jie Li
uncoupled system for each due to the coupled mode effects. The results are in agreement with those
obtained by the deterministic analysis.
0.2
0.4
0.6
0.8
1
30
210
60
240
90
270
120
300
150
330
180 0
.
Normal 常態分佈
Lognormal 對數常態分佈
Type I Extreme Value 型 I極值分佈
0.2
0.4
0.6
0.8
1
30
210
60
240
90
270
120
300
150
330
180 0
.
Normal 常態分佈
Lognormal 對數常態分佈
Type I Extreme Value 型 I極值分佈
(a) Torsionally uncoupled system (b) Torsionally coupled system
Figure 6. Relationships between the probability of dissatisfaction with occupant comfort criteria and the attack angle.
7. Conclusions
The objective of this paper is to conduct the reliability analysis of high-rise buildings under wind loads.
Two numerical examples, i.e., the torsionally uncoupled and coupled systems, are provided to capture the
dynamic effects of structures with eccentricity between the elastic and mass centers. The framework of this
research consists of two stages. The first stage includes two parts: the deterministic analysis of wind-
induced acceleration for a variety of attack angles, i.e., the demand, and the determination of allowable
acceleration based on the occupant comfort criteria for wind-excited buildings, i.e., the capacity. According
to the results obtained in the first stage, the reliability analysis is conducted in the second stage, which can
predict the probability of dissatisfaction with occupant comfort criteria for three types of probability
distributions of the structural eccentricity, i.e., the normal, lognormal and type I extreme value distributions.
In the first stage, both the examples illustrate that the demand is comparatively lower than the capacity
for each attack angle. Consequently, the occupant comfort criteria are satisfied in the two numerical
examples from the viewpoint of deterministic approaches. These two examples also show that the
maximum peak acceleration occurs when the wind direction is parallel to the x axis. The peak acceleration
of the torsionally coupled system is relatively higher than that of the torsionally uncoupled system for each
attack angle due to the coupled mode effects.
In the second stage, both the examples illustrate that the probability for the case of the normal
distribution is relatively higher than that for the other two cases for each attack angle. Furthermore, the
282
5th International Conference on Reliable Engineering Computing (REC 2012)
Reliability Analysis of High-Rise Buildings under Wind Loads
probability for the case of the lognormal distribution is close to that of the type I extreme value distribution
for each attack angle. The findings indicate that, compared to the lognormal and type I extreme value
distributions, the normal distribution can be used to more conservatively simulate the uncertainties of the
eccentricity between the elastic and mass centers in the two numerical examples from the viewpoint of
probabilistic approaches. These two examples also show that the maximum probability occurs when the
wind direction is parallel to the x axis. The probability of the torsionally coupled system is relatively
higher than that of the torsionally uncoupled system for each attack angle due to the coupled mode effects.
The results are in agreement with those obtained by the deterministic analysis.
Acknowledgements
The authors would like to acknowledge the support of the National Science Council, Taiwan, under Grant
No. NSC 98-2218-E-033-001.
References Davenport, A. G. The Dependence of Wind Load upon Meteorological Parameters. Proceedings of the International Research
Seminar on Wind Effects on Buildings and Structures, University of Toronto Press, Toronto, Canada, 1968.
Haldar, A. and S. Mahadevan. Probability, Reliability, and Statistical Methods in Engineering Design. John Wiley & Sons, Inc.,
New York City, New York, USA, 2000a.
Haldar, A. and S. Mahadevan. Reliability Assessment Using Stochastic Finite Element Analysis. John Wiley & Sons, Inc., New
York City, New York, USA, 2000b.
Kan, C. L. and A. K. Chopra. Elastic Earthquake Analysis of Torsionally Coupled Multistorey Buildings. Earthquake Engineering
and Structural Dynamics, 5(4):395-412, 1977.
Kareem, A. Lateral-Torsional Motion of Tall Buildings to Wind Loads. Journal of Structural Engineering, ASCE, 111(11):2479-
2496, 1985.
Kareem, A. Dynamic Response of High-Rise Buildings to Stochastic Wind Loads. Journal of Wind Engineering and Industrial
Aerodynamics, 42(1-3):1101-1112, 1992.
Liu, M. Y., W. L. Chiang, J. H. Hwang, and C. R. Chu. Wind-Induced Vibration of High-Rise Building with Tuned Mass Damper
Including Soil-Structure Interaction. Journal of Wind Engineering and Industrial Aerodynamics, 96(6-7):1092-1102, 2008.
Melbourne, W. H. Probability Distributions Associated with the Wind Loading of Structures. Civil Engineering Transactions,
Institution of Engineers, Australia, CE19(1):58-67, 1977.
Melbourne, W. H. and T. R. Palmer. Accelerations and Comfort Criteria for Buildings Undergoing Complex Motions. Journal of
Wind Engineering and Industrial Aerodynamics, 41(1-3):105-116, 1992.
Peng, M. H. Investigation of Wind Forces on Objects in Gusty Flow Using Hilbert-Huang Transform. Master thesis, National
Central University, Taiwan, 2005.
Rackwitz, R. and B. Fiessler. Note on Discrete Safety Checking when Using Non-Normal Stochastic Models for Basic Variables.
Load Project Working Session, Massachusetts Institute of Technology, Cambridge, Massachusetts, USA, 1976.
Rackwitz, R. and B. Fiessler. Structural Reliability under Combined Random Load Sequences. Computers and Structures,
9(5):489-494, 1978.
Samali, B., J. N. Yang, and C. T. Yeh. Control of Lateral-Torsional Motion of Wind-Excited Buildings. Journal of Engineering
Mechanics, ASCE, 111(6):777-796, 1985.
Simiu, E. and R. H. Scanlan. Wind Effects on Structures: Fundamentals and Applications to Design. Third Edition, John Wiley &
Sons, Inc., New York City, New York, USA, 1996.
Wu, J. C. and J. N. Yang. LQG Control of Lateral-Torsional Motion of Nanjing TV Transmission Tower. Earthquake Engineering
and Structural Dynamics, 29(8):1111-1130, 2000.
Yang, J. N., Y. K. Lin, and B. Samali. Coupled Motion of Wind-Loaded Multi-Story Building. Journal of Engineering Mechanics
Division, ASCE, 107(EM6):1209-1226, 1981.
5th International Conference on Reliable Engineering Computing (REC 2012)
283

284
5th International Conference on Reliable Engineering Computing (REC 2012)