Embed Size (px)
Citation preview

© 2017 Relia, Inc. All rights reserved.
Results Briefing For the Year Ended March 31, 2017
May 16, 2017
*NOTICE: This document is a translation of the original Japanese document and is only for reference purposes. In the event of any discrepancy between this translated document and the original Japanese document, the latter shall prevail.

© 2017 Relia, Inc. All rights reserved. 2
Overview of FY2016

Net sales 96.2 (118%) Operating income 4.8 (103%)
Profit after tax 3.7 (118%)
© 2017 Relia, Inc. All rights reserved. 3
(Before amortization of goodwill)
(Before amortization of goodwill)
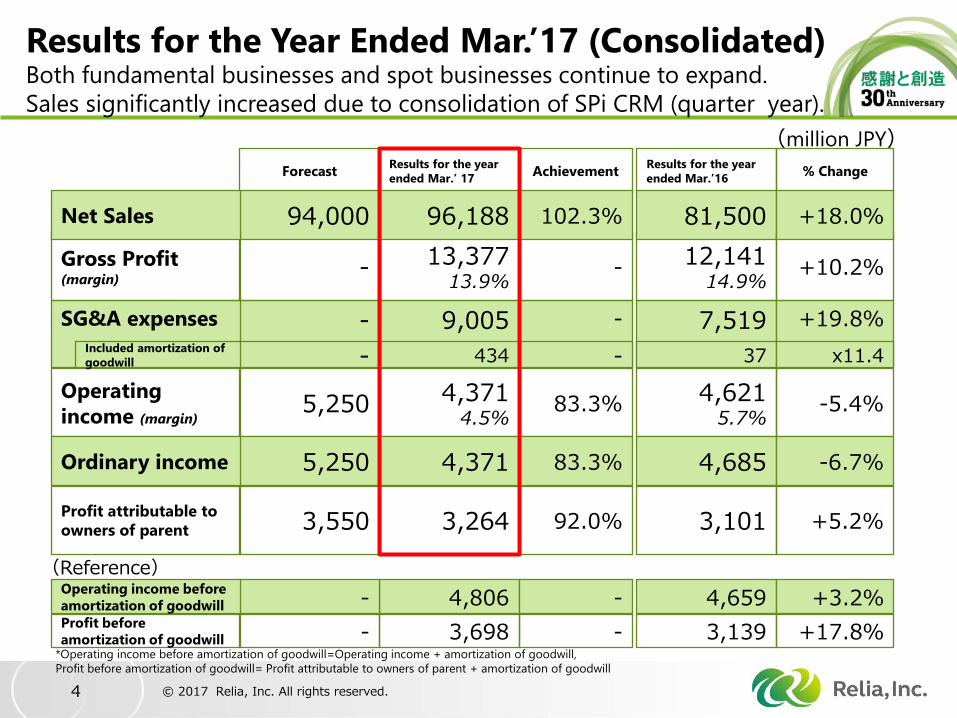
Results for the Year Ended Mar.’17
(billion JPY)
Results for the year ended Mar.’16
Results for the year ended Mar.’ 17 Forecast Achievement % Change
© 2017 Relia, Inc. All rights reserved. 4
7,519
12,141 14.9%
81,500
4,621 5.7%
4,685
3,101
9,005
13,377 13.9%
96,188
4,371 4.5%
4,371
3,264
-
-
94,000
5,250
5,250
3,550
-
-
102.3%
83.3%
83.3%
92.0%
SG&A expenses
Gross Profit (margin)
Net Sales
Operating income (margin)
Ordinary income
Profit attributable to owners of parent
+19.8%
+10.2%
+18.0%
-5.4%
-6.7%
+5.2%
(Reference) 4,659 4,806 - - Operating income before
amortization of goodwill +3.2% 3,139 3,698 - - Profit before
amortization of goodwill +17.8%
37 434 - - Included amortization of goodwill x11.4
Results for the Year Ended Mar.’17 (Consolidated) Both fundamental businesses and spot businesses continue to expand. Sales significantly increased due to consolidation of SPi CRM (quarter year).
(million JPY)
*Operating income before amortization of goodwill=Operating income + amortization of goodwill, Profit before amortization of goodwill= Profit attributable to owners of parent + amortization of goodwill

© 2017 Relia, Inc. All rights reserved. 5
1.6 38.1
45.5
50.7
44.5
FY2015 1H FY2016 2H
36.5
4.4
3.3
41.1 40.1
3.3
43.4
FY2016 1H
2.9
FY2015 2H
● Fundamental businesses continue to expand. ● SPi CRM and Infocom consolidated capture start from 4Q.
Transition of Consolidated Sales
(billion JPY)
Large spot business Recurring business
Sales<Overseas>

© 2017 Relia, Inc. All rights reserved. 6
96.2
Increases in fundamental
business
Termination of spot
business
4.9
Oversea subsidiaries
business
81.5
0.8 3.3
Expansion of domestic subsidiaries businesses
8.2
7.3
Large spot business
● Fundamental businesses on non-consolidated base and large spot business continue to grow.
● Covered the decrease in
income due to Field Operation business by the rest company.
● Increases sales with acquisition of SPi CRM and Infocom from 4Q.
Non-Consolidated Consolidated
(billion JPY)
Main Fluctuation Factors of Sales(yoy)
Mar.’16 Mar.’17
© 2017 Relia, Inc. All rights reserved. 7
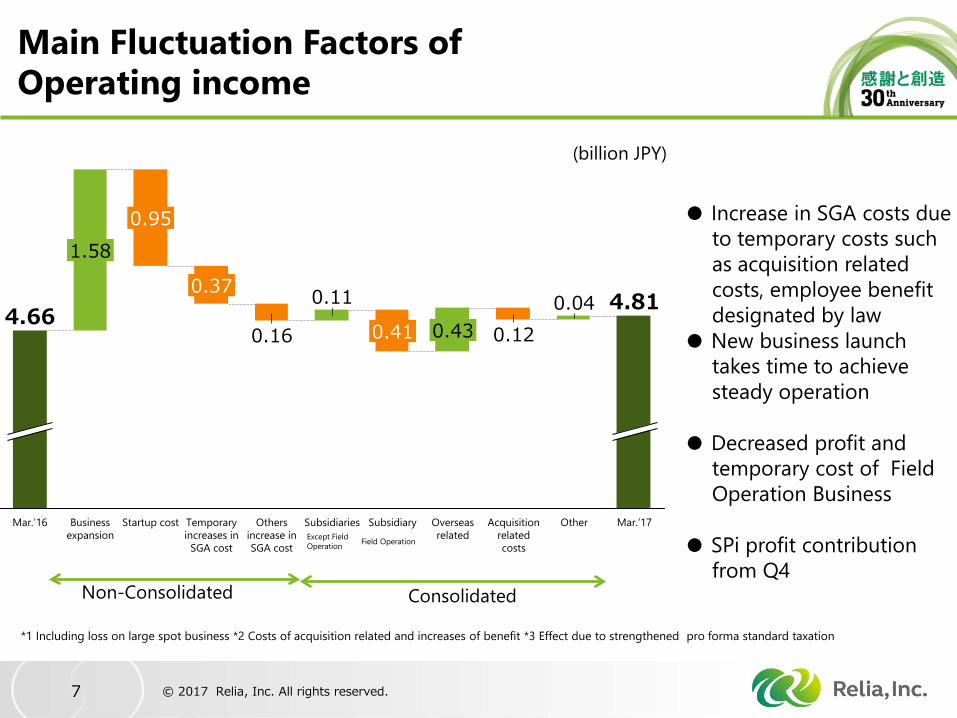
1.58
0.41
Mar.’17 Other
0.12
Temporary increases in
SGA cost
Startup cost Acquisition related costs
Overseas related
Business expansion
0.04
Subsidiaries
0.11
0.16
0.37
Mar.’16
4.81 0.43
Others increase in SGA cost
Subsidiary
4.66
0.95 ● Increase in SGA costs due to temporary costs such as acquisition related costs, employee benefit designated by law
● New business launch takes time to achieve steady operation
● Decreased profit and
temporary cost of Field Operation Business
● SPi profit contribution
from Q4
Main Fluctuation Factors of Operating income
(billion JPY)
Non-Consolidated Consolidated
*1 Including loss on large spot business *2 Costs of acquisition related and increases of benefit *3 Effect due to strengthened pro forma standard taxation
Except Field Operation Field Operation

© 2017 Relia, Inc. All rights reserved. 8
40
1
0
45
35
30
2
0
31.4
3.3
28.7
FY2015 1H
1.9
1.5
1.4
2.0 2.7
1.3
FY2016 1H
32.2
FY2015 2H FY2016 2H
35.2
1.3
0.9
Transition of Consolidated Sales For Contact Center Business
(billion JPY) Overseas related business Segment profit (Right axis)
Large spot business Recurring business

© 2017 Relia, Inc. All rights reserved. 9
0
1.0
0.5
0.0
5
10
0.7
FY2015 2H
5.0
FY2016 2H FY2016 1H
5.5
1.7
6.0
1.5
0.8
1.3
0.2
FY2015 1H
0.7
4.5
0.7
Transition of Consolidated Sales For Back Office Business
(billion JPY)
Segment profit (Right axis)
Recurring business Large spot business

© 2017 Relia, Inc. All rights reserved. 10
-1
0
0.5
0.3
0.4
0.1
5
3
0.0
4
2 0.2
-0.1
1 2.6
1.1
0.2
FY2015 2H FY2015 1H
0.2
2.2
0.0
1.2
FY2016 1H
1.1
2.1
1.2
FY2016 2H
2.2
0.1
Transition of Consolidated Sales by Service for Field Operation Business
(billion JPY)
OTC service Visiting service
Segment profit (Right axis)

© 2017 Relia, Inc. All rights reserved. 11
Financial service
18.6
Broadcasting
9.1
3.0
Government / municipal offices
Utilities / infrastructure
11.2
10.7
2.7
13.1
16.8 15.8
17.5
Telecommunication 20.2
5.5 Distribution
Services 3.3
3.9 4.6
Information
3.0
6.7
Manufacturing 8.8
FY2016 FY2015
● Almost all industries experienced growth
● Government and municipal offices, utility industry and telecommunication have expanded
Consolidated Sales by Industry
(billion JPY)

12
Progress of Mid-term Business Plan
© 2017 Relia, Inc. All rights reserved.
13
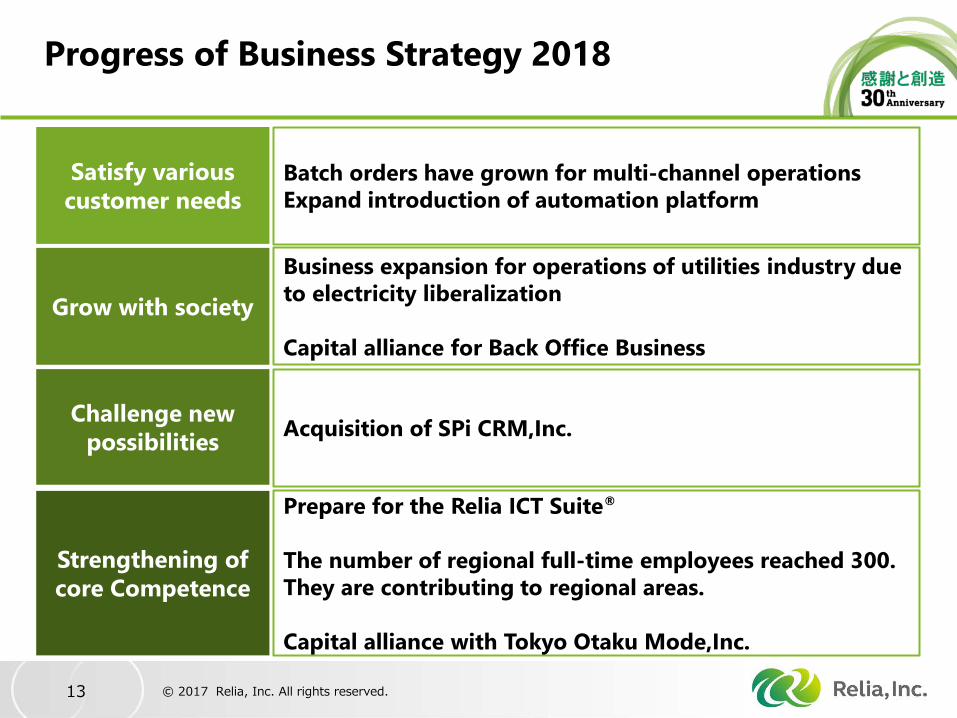
Acquisition of SPi CRM,Inc.
Batch orders have grown for multi-channel operations Expand introduction of automation platform
Business expansion for operations of utilities industry due to electricity liberalization Capital alliance for Back Office Business
Prepare for the Relia ICT Suite® The number of regional full-time employees reached 300. They are contributing to regional areas. Capital alliance with Tokyo Otaku Mode,Inc.
Progress of Business Strategy 2018
Satisfy various customer needs
Grow with society
Challenge new possibilities
Strengthening of core Competence
© 2017 Relia, Inc. All rights reserved.
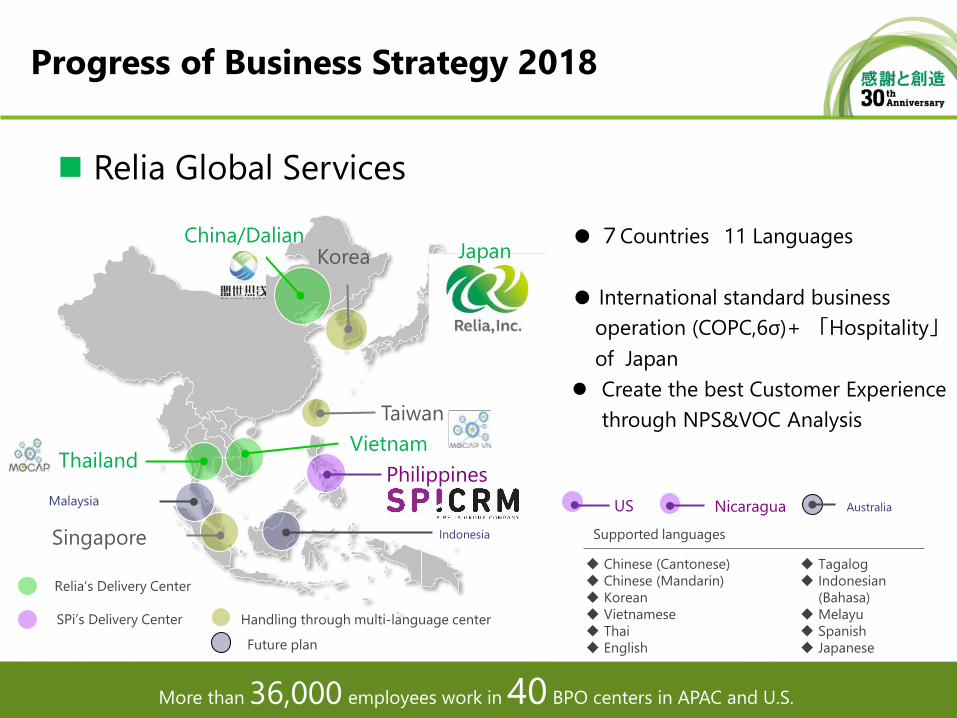
● 7Countries 11 Languages
● International standard business operation (COPC,6σ)+ 「Hospitality」 of Japan Create the best Customer Experience
through NPS&VOC Analysis
Relia Global Services
More than 36,000 employees work in 40 BPO centers in APAC and U.S.
Progress of Business Strategy 2018
Taiwan
Korea China/Dalian
Philippines Thailand
Malaysia
Singapore
Vietnam
Indonesia
Relia’s Delivery Center
SPi’s Delivery Center Handling through multi-language center
Chinese (Cantonese) Chinese (Mandarin) Korean Vietnamese Thai English
Supported languages
Tagalog Indonesian
(Bahasa) Melayu Spanish Japanese
Japan
US Nicaragua Australia
Future plan

Contribution from SPi
© 2017 Relia, Inc. All rights reserved. 15
FY2017 Net Sales
108.2
93.8
8.6 5.8
5.9
1.8 1.7
7.7
Operating income before amortization of goodwill
Domestic
Over seas
Asia
North America
Japan
(billion JPY)
●Account for 13 % of group Net sales in Mar.’18 Contribute to 23 % of Operating income after amortization of goodwill ● 5 orders received for synergy proposals
Progress of Business Strategy 2018
Amortization of goodwill

Capital and business tie-up
Back Office
Marketing Human Resorce
Back Office
DENTSU OPERATION PARTNERS INC. Works Applications Co.,Ltd.
Tokyo Otaku Mode Inc. Mama square
© 2017 Relia, Inc. All rights reserved. 16
Progress of Business Strategy 2018

Communication agent on the web that uses AI technology
Starting to offer Virtual Agent ®that utilizes Japanese version of IBM Watson . Introduced to “LOHACO”.* Conversation engine is Manami-san. 30 clients have introduced (including basic model)
Upgrade call center operation efficiency via smartphone
Introduce proprietary intercept function of calls from users to Web and SNS.
19 clients have introduced
Cloud voice recognition platform Naturally spoken Interactive Voice-Recognition system has been utilized for contact center automation and optimization. Commercial service started in April of 2016.
5 clients have introduced
Automation platform
17
Progress of Business Strategy 2018
Virtual Agent® Mobile Select® Relia Voice Cloud
© 2017 Relia, Inc. All rights reserved.

18
Business Plan for FY2017
© 2017 Relia, Inc. All rights reserved.

Net Sales 108.2 (113%)
Operating income 7.7 (160%)
Profit after tax 5.6 (151%)
ROE* 10.1% / 8.5% (Before amortization of goodwill) (After amortization of goodwill)
*Calculate simply on the forecast of Shareholders' equity
© 2017 Relia, Inc. All rights reserved. 19
(Before amortization of goodwill)
(Before amortization of goodwill)
Budget for Fiscal Year 2017
(billion yen)

+12,011 Net sales 108,200 96,188 +12.5%
Change Annual forecast Results for the
year ended Mar.’17
% change
© 2017 Relia, Inc. All rights reserved. 20
+1,628
+1,628
+635
Operating income (margin)
Ordinary income
Profit attributable to owners of parent
6,000 5.5%
6,000
3,900
4,371 4.5%
4,371
3,264
+37.2%
+37.2%
+19.5%
+1,265 Amortization of goodwill 1,700 434 x3.9
(Reference)
+2,893 Operating income before amortization of goodwill (margin)
7,700 7.1%
4,806 5.0% +60.2%
+1,901 Profit before amortization of goodwill 5,600 3,698 +51.4%
(million JPY)
Assumed exchange rates(FY2017) : ¥110 to the U.S. dollar, ¥ 2.24 to the Philippine peso *amortization of goodwill before Operating income=Operating income+ Amortization of goodwill , Profit after amortization of goodwill=Profit attributable to owners of parent after amortization of goodwill
Budget for Fiscal Year 2017

Domestic business ・Expanding net sales to quality of net sales - Monetization of new business - Improve profitability of fundamental business -Rebuilding field operation business ➡ Operating profit ratio in Japan 6.3% (FY2016 plan 5.6%, Actual 4.7%) Oversea business ・SPi CRM contributes to full business year
Transition of consolidated sales(Plan)
© 2017 Relia, Inc. All rights reserved. 21
FY2017 E FY2016 FY2017 E FY2015
3.3
4.9
76.6 85.6
81.5
96.2
7.3
8.6
5.8
108.2
91.2
2.6
93.8
14.4
(billion JPY)
Asia
North America
Japan
Other areas
Large spot business <Japan> Recurring business <Japan>
Sales <Overseas>

Progress of Med-term management plan
© 2017 Relia, Inc. All rights reserved. 22
12
0
9
140
100
40
20
6 60
0
80
120
3
FY2015 FY2019 objective
FY2014 FY2016 FY2017 E
3.7
108.2
127.0
96.2
4.7
7.7
12.0
5.6
74.2
3.7
3.1
4.8
81.5
2.5
Business Strategy2018 Mid-term management plan
Accomplished the
base case Challenging
to Up side
(billion JPY) Operating income before amortization of goodwill Profit before amortization of goodwill Consolidated Net sales

© 2017 Relia, Inc. All rights reserved. 23
Change of dividend policy
Past : Our dividend policy is 50% consolidated dividend payout ratio unless drastic change occurs in the business environment such as another large-scale investment.
Current : New dividend policy is a dividend ratio of 45% calculated after excluding amortization of goodwill related to the acquisition of SPi CRM, Inc. and Infocom Technologies, Inc. ※The policy can be changed flexibly, in case of drastic change in the business environment.
Considering net income without amortization of goodwill, as well as overall cash flow and cash equivalents, we changed dividend policy to avoid the dividend payout affected by amortization of goodwill related to the acquisition of SPi CRM, Inc. and Infocom Technologies, Inc.

© 2017 Relia, Inc. All rights reserved. 24
2929292936
0
10
20
30
40
50
60
0
20
40
60
80
(JPY) (%)
64% 58%
61% 64%
81% DPS Dividend payout ratio
Dividend forecast : Annual : JPY 36 per share Interim : JPY 18 per share, year-end 18 per share
Return to Shareholders
FY2017E FY2016 FY2013 FY2015 FY2014

© 2017 Relia, Inc. All rights reserved. 25
Cautionary Statement This material contains statements (including figures) regarding Relia, Inc. (“Relia”)'s corporate strategies, objectives, and views of future developments that are forward-looking in nature and are not simply reiterations of historical facts. These statements are presented to inform stakeholders of the views of Relia's management but should not be relied on solely in making investment and other decisions. You should be aware that a number of important risk factors could lead to outcomes that differ materially from those presented in such forward-looking statements. These include, but are not limited to, (i) change in economic conditions that may lead to unforeseen developments in markets for products handled by Relia, (ii) fluctuations in currency exchange rates that may cause unexpected deterioration in the value of transactions, (iii) adverse political developments that may create unavoidable delays or postponement of transactions and projects, (iv) changes in laws, regulations, or policies in any of the countries where Relia conducts its operations that may affect Relia's ability to fulfill its commitments, and (v) significant changes in the competitive environment. In the course of its operations, Relia adopts measures to control these and other types of risks, but this does not constitute a guarantee that such measures will be effective. All rights reserved.
© 2017 Relia, Inc. All rights reserved.