Embed Size (px)
Citation preview
Release Notes
QUE$TOR
2018 Q1 Release
May 2018
QUE$TOR is a registered trademark of IHS Markit.
Windows is a registered trademark of MicrosoftCorporation.

Contents
Introduction 2
Version compatibility 3
What’s on the CD-ROM 3
System requirements 4
Application execution 5
Activating standalone licenses 5
Setting network license location 6
General upgrades in QUE$TOR 2018 Q1 8
Subsea multiphase pumping 8
Umbilical selection 15
New personnel transport boat option 15
Improved fluid inlet conditions for onshore production facility 15
Selected other technical revisions 17
Cost database update 18
General 18
Oil price trend 19
Currencymarket 20
Steel 23
Equipment 26
Bulks 27
Offshore rigs 28
Offshore vessels 31
Subsea equipment 34
Labour 35
Land rigs 37
IHS Markit May 2018 Page 1
QUE$TOR 2018 Q1 Release Notes
IntroductionWe are pleased to provide the 2018 Q1 release of the QUE$TOR costestimating software.
All cost databases have been reviewed and updated to incorporatecurrent unit rates, exchange rates and man hour costs for all regions toreflect first quarter 2018 prices.
The main technical enhancements made to QUE$TOR 2018 Q1 are:
l Subsea multiphase pumping.
l Umbilical selection.
l New personnel transport boat option.
l Improved production facility fluid inlet conditions.
The above changes as well as numerous other improvements andminor bug fixes have been made at the request of users and throughinternal review. We actively encourage feedback from users as ameans of improving the accuracy and ease of use of the program.
This version of QUE$TOR uses a new licensing system: the IHS MarkitCommon Licensing system. This requires a different installationprocedure for QUE$TOR and to set up the licenses for the program.Please read the Installation procedure and licensing section in thisdocument prior to installation of QUE$TOR.
Page 2 May 2018 IHS Markit
QUE$TOR 2018 Q1 Release Notes
Version compatibilityProjects created in QUE$TOR v8.0 and later are compatible withQUE$TOR 2018 Q1. However, projects created or saved in QUE$TOR2018 Q1 cannot be opened in earlier versions.
Opening a project created in an earlier version of QUE$TOR will result inthe costs and technical calculations automatically being updated, exceptwhere unit rates or results have been ‘locked’ when creating the originalproject. Changes will be made permanent when the project is savedand the case will no longer open in the earlier version. It is thereforeadvisable to make a copy of your project file before opening it in thenew version.
QUE$TOR allowsmultiple versions of the program to be installed side byside in order to view projects created using earlier databases.
In order to run the latest version of QUE$TOR alongside older versionsthat use the previous licensing system, both the new and previouslicensing systems will have to be setup on the machine runningQUE$TOR.
What’s on the CD-ROMThe QUE$TOR 2018 Q1 CD-ROM contains the following:
l QUE$TOR 2018 Q1 installation files.l An ‘Application’ directory containing QUE$TOR 2018 Q1 programfiles.
l A ‘Documents’ directory containing a copy of the full help file, thequick start guide and a copy of the full and short release notes inportable document format (.pdf).
l A ‘Licensing’ folder containing an 'IHS Markit Common' sub-folderfor setting up and managing network licenses
l A ‘Prerequisites’ folder containing the following two folders:
l A ‘dotNET Framework’ directory containing the executable toinstall the required .NET Framework on your machine if it isnot already installed.
l A ‘Microsoft Visual C++ Redistributable for Visual Studio2017’ containing the executable for installing files required forthe new licensing system.
l A ‘Utils’ directory containing a set of utilities to assist IHS Markitsupport staff with troubleshooting should any problems arise whilstinstalling or running the application.
IHS Markit May 2018 Page 3
QUE$TOR 2018 Q1 Release Notes
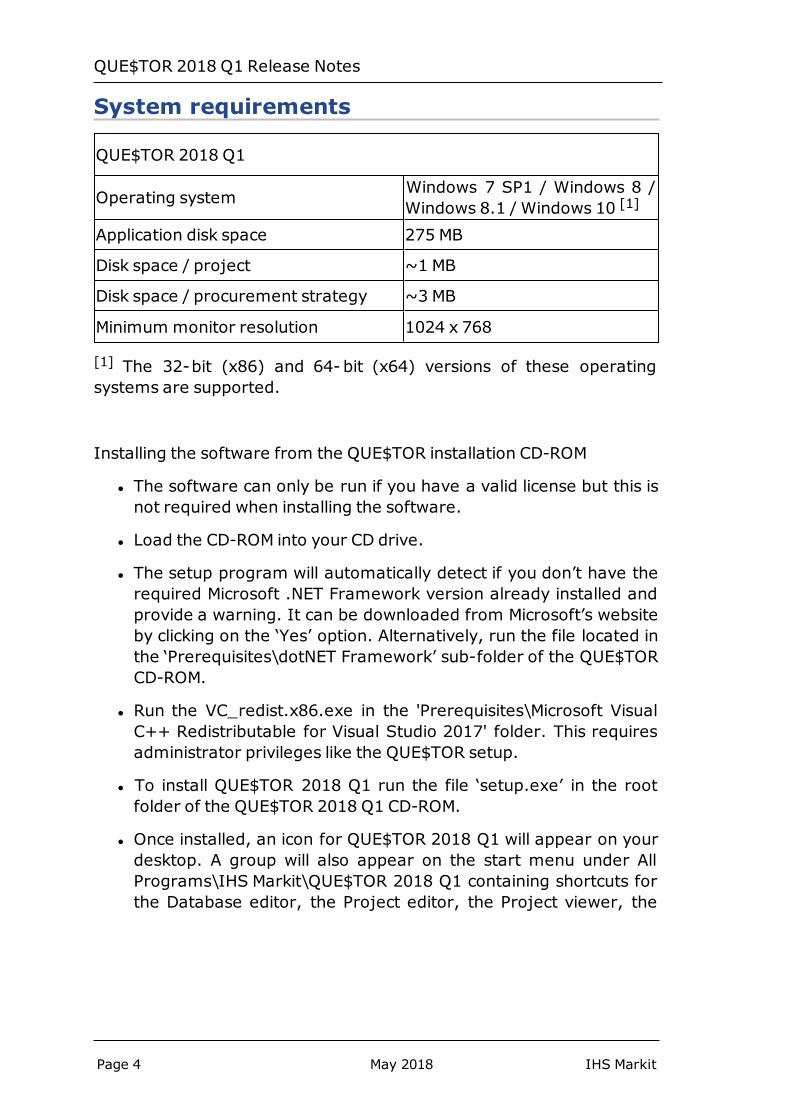
System requirements
QUE$TOR 2018 Q1
Operating system Windows 7 SP1 / Windows 8 /Windows 8.1 / Windows 10 [1]
Application disk space 275 MB
Disk space / project ~1 MB
Disk space / procurement strategy ~3 MB
Minimum monitor resolution 1024 x 768
[1] The 32-bit (x86) and 64-bit (x64) versions of these operatingsystems are supported.
Installing the software from the QUE$TOR installation CD-ROM
l The software can only be run if you have a valid license but this isnot required when installing the software.
l Load the CD-ROM into your CD drive.
l The setup program will automatically detect if you don’t have therequired Microsoft .NET Framework version already installed andprovide a warning. It can be downloaded from Microsoft’s websiteby clicking on the ‘Yes’ option. Alternatively, run the file located inthe ‘Prerequisites\dotNET Framework’ sub-folder of the QUE$TORCD-ROM.
l Run the VC_redist.x86.exe in the 'Prerequisites\Microsoft VisualC++ Redistributable for Visual Studio 2017' folder. This requiresadministrator privileges like the QUE$TOR setup.
l To install QUE$TOR 2018 Q1 run the file ‘setup.exe’ in the rootfolder of the QUE$TOR 2018 Q1 CD-ROM.
l Once installed, an icon for QUE$TOR 2018 Q1 will appear on yourdesktop. A group will also appear on the start menu under AllPrograms\IHS Markit\QUE$TOR 2018 Q1 containing shortcuts forthe Database editor, the Project editor, the Project viewer, the
Page 4 May 2018 IHS Markit
QUE$TOR 2018 Q1 Release Notes
main QUE$TOR application and the Unit editor.
l If you get any warnings during the installation then please contactthe QUE$TOR support desk, [email protected].
Note: You may receive an e-mail from IHS Markit Customer Carecontaining an Entitlement ID for activating your QUE$TOR licenses.
Application executionl To run the software click Start and follow All Programs >IHS Markit > QUE$TOR 2018 Q1 > QUE$TOR 2018 Q1 ordouble-click the icon created on your desktop.
Activating standalone licensesTo activate a standalone license you will need to have QUE$TORinstalled and you will need to have your Entitlement ID (EID). This EIDwill be emailed to the primary license contact at each company.
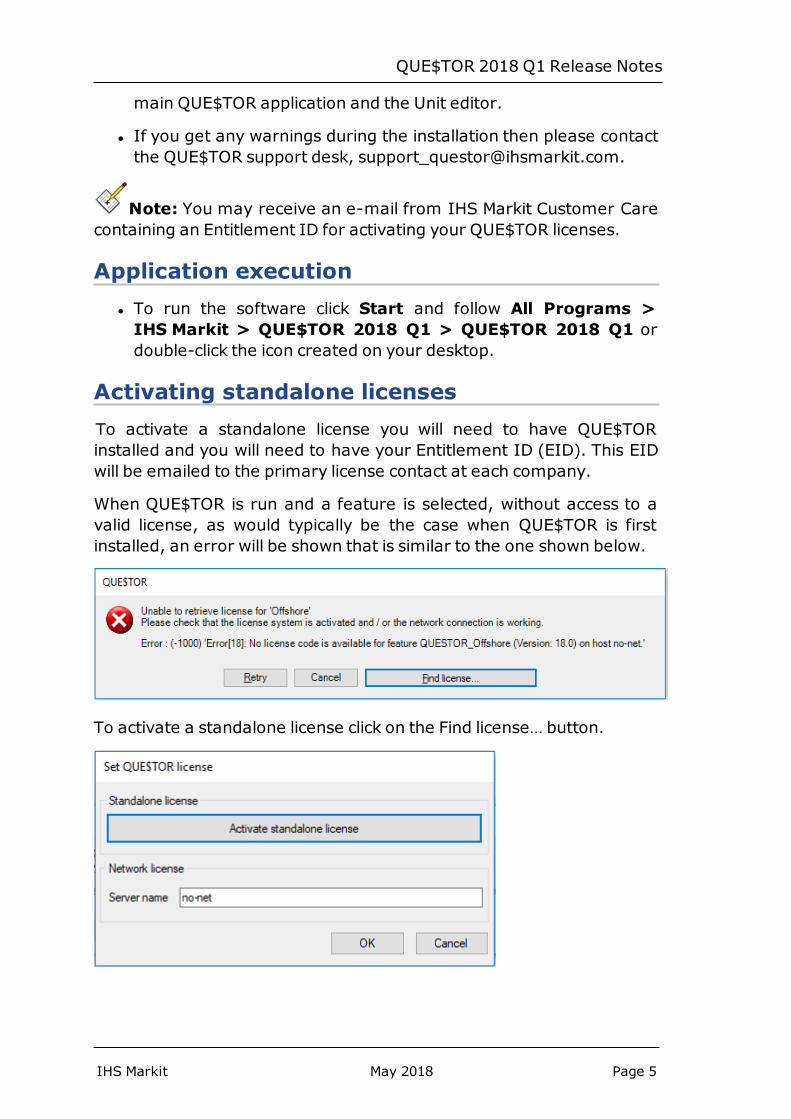
When QUE$TOR is run and a feature is selected, without access to avalid license, as would typically be the case when QUE$TOR is firstinstalled, an error will be shown that is similar to the one shown below.
To activate a standalone license click on the Find license… button.
IHS Markit May 2018 Page 5
QUE$TOR 2018 Q1 Release Notes
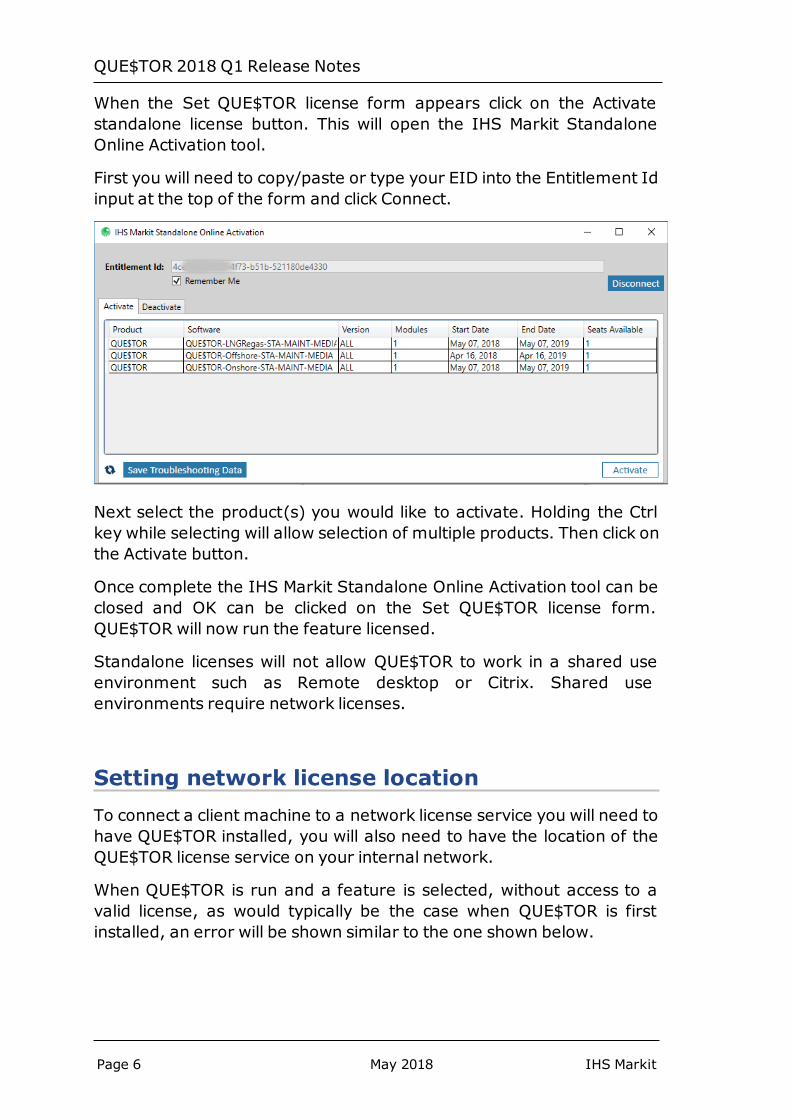
When the Set QUE$TOR license form appears click on the Activatestandalone license button. This will open the IHS Markit StandaloneOnline Activation tool.
First you will need to copy/paste or type your EID into the Entitlement Idinput at the top of the form and click Connect.
Next select the product(s) you would like to activate. Holding the Ctrlkey while selecting will allow selection of multiple products. Then click onthe Activate button.
Once complete the IHS Markit Standalone Online Activation tool can beclosed and OK can be clicked on the Set QUE$TOR license form.QUE$TOR will now run the feature licensed.
Standalone licenses will not allow QUE$TOR to work in a shared useenvironment such as Remote desktop or Citrix. Shared useenvironments require network licenses.
Setting network license locationTo connect a client machine to a network license service you will need tohave QUE$TOR installed, you will also need to have the location of theQUE$TOR license service on your internal network.
When QUE$TOR is run and a feature is selected, without access to avalid license, as would typically be the case when QUE$TOR is firstinstalled, an error will be shown similar to the one shown below.
Page 6 May 2018 IHS Markit
QUE$TOR 2018 Q1 Release Notes
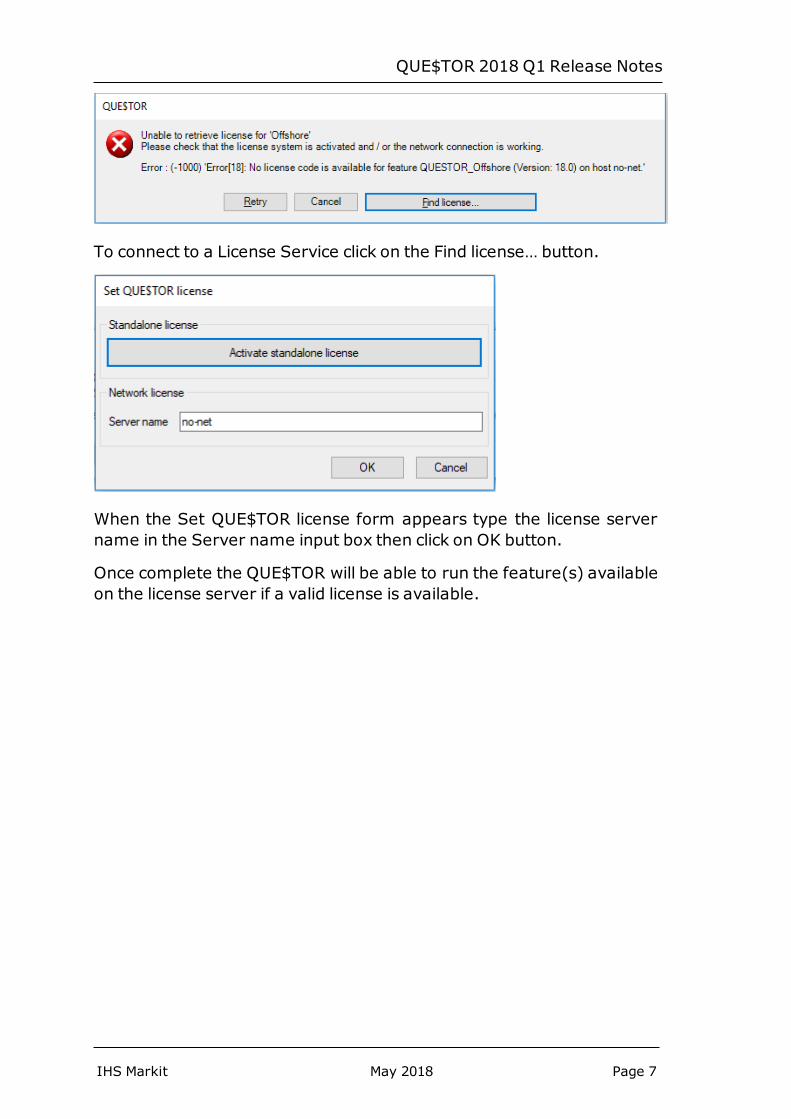
To connect to a License Service click on the Find license… button.
When the Set QUE$TOR license form appears type the license servername in the Server name input box then click on OK button.
Once complete the QUE$TOR will be able to run the feature(s) availableon the license server if a valid license is available.
IHS Markit May 2018 Page 7
QUE$TOR 2018 Q1 Release Notes
General upgrades in QUE$TOR 2018 Q1In response to feedback the following features have been implementedin QUE$TOR 2018 Q1.
l Subsea multiphase pumping.
l Umbilical selection.
l New personnel transport boat option.
l Improved production facility fluid inlet conditions.
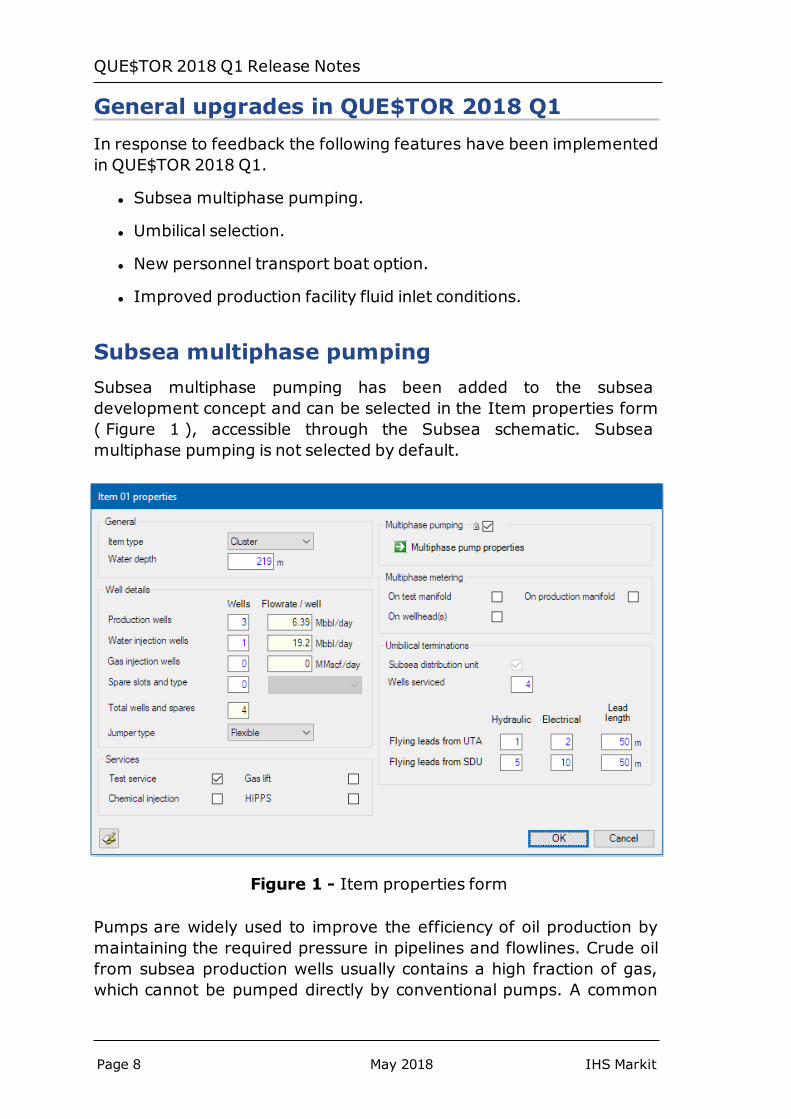
Subsea multiphase pumpingSubsea multiphase pumping has been added to the subseadevelopment concept and can be selected in the Item properties form( Figure 1 ), accessible through the Subsea schematic. Subseamultiphase pumping is not selected by default.
Figure 1 - Item properties form
Pumps are widely used to improve the efficiency of oil production bymaintaining the required pressure in pipelines and flowlines. Crude oilfrom subsea production wells usually contains a high fraction of gas,which cannot be pumped directly by conventional pumps. A common
Page 8 May 2018 IHS Markit
QUE$TOR 2018 Q1 Release Notes
solution to this problem is to separate the gas and liquid, then pumpand compress the fluids in parallel and recombine them in a commonflowline, if necessary.
Multiphase pumps (MPPs) have been gradually introduced into subseaover the last twenty years to eliminate separators, compressors, andsome pumping equipment to increase oil production at lower cost. Incomparison with conventional pumps, the main advantage of MPPs istheir ability to handle flows with a high gas volume fraction (GVF), ashigh as 98% at inlet conditions, which means a single MPP can completethe same work as a scrubber, a conventional pump and a compressor.
There are different types of MPPs. The multiphase pumping option inQUE$TOR refers to a subsea multiphase helico-axial pump (HAP). Thisis a special pump designed to overcome the presence of gas in the fluidstream. A multiphase HAP is a multi-stage rotodynamic pump. Eachpump stage consists of an impeller, a static diffuser, and a rotating partmounted on a shaft. It is like a hybrid between a centrifugal pump andan axial compressor.
The typical application of subsea MPPs is in mature assets which havelost their own natural pressure, or in wells located far from topsidefacilities (e.g. in ultra-deepwater), when the reservoir pressure is nothigh enough to allow natural flow to the facility.
When the multiphase pumping option is selected in the Item propertiesform, a multiphase pump properties form (Figure 2) is available toprovide the main pump parameters.
IHS Markit May 2018 Page 9
QUE$TOR 2018 Q1 Release Notes
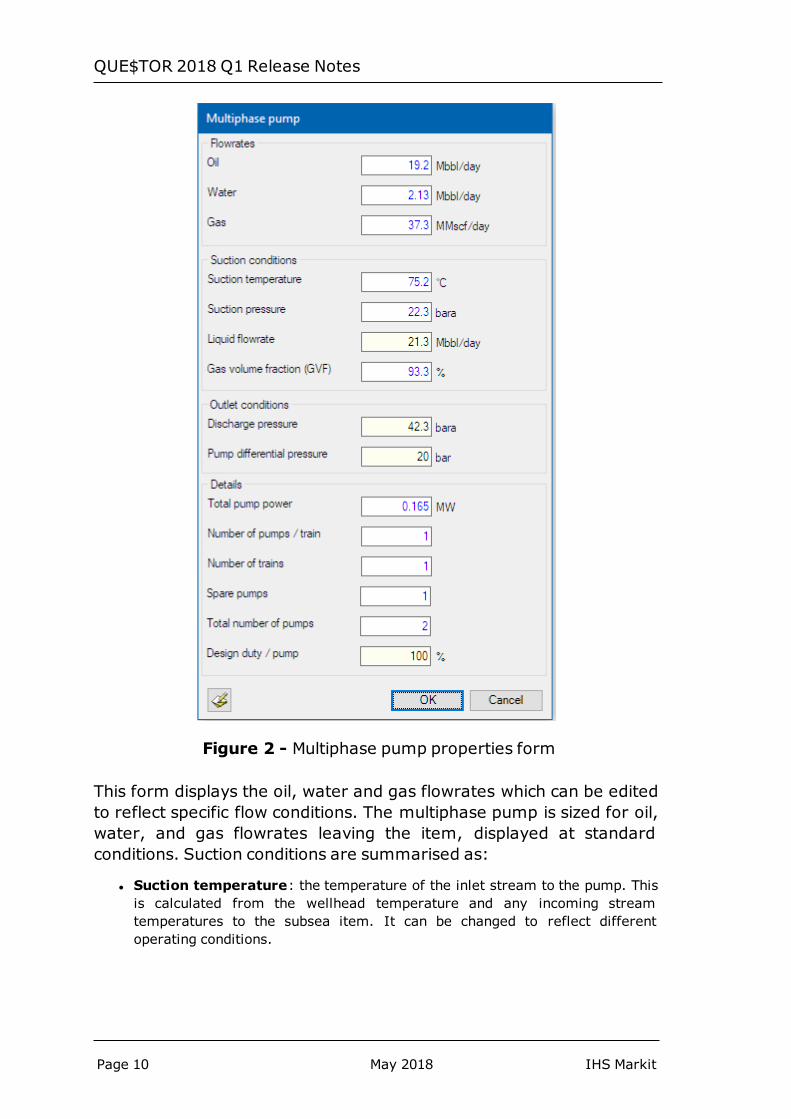
Figure 2 - Multiphase pump properties form
This form displays the oil, water and gas flowrates which can be editedto reflect specific flow conditions. The multiphase pump is sized for oil,water, and gas flowrates leaving the item, displayed at standardconditions. Suction conditions are summarised as:
l Suction temperature: the temperature of the inlet stream to the pump. Thisis calculated from the wellhead temperature and any incoming streamtemperatures to the subsea item. It can be changed to reflect differentoperating conditions.
Page 10 May 2018 IHS Markit
QUE$TOR 2018 Q1 Release Notes
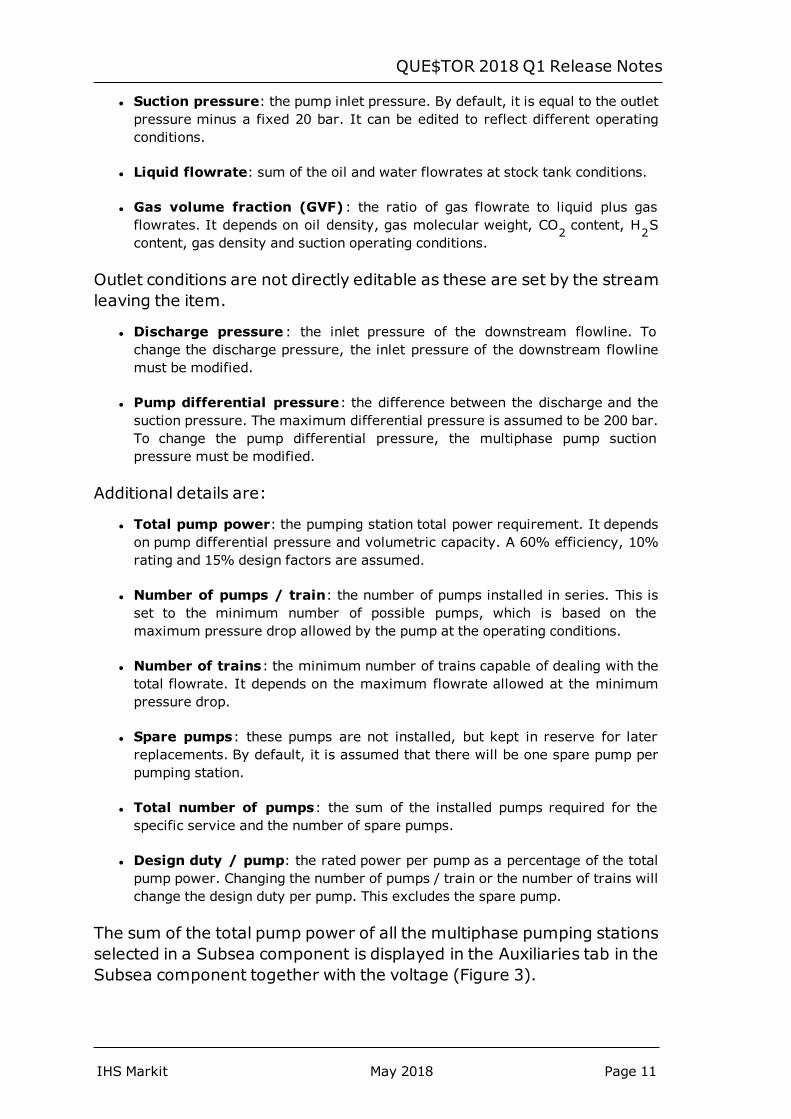
l Suction pressure: the pump inlet pressure. By default, it is equal to the outletpressure minus a fixed 20 bar. It can be edited to reflect different operatingconditions.
l Liquid flowrate: sum of the oil and water flowrates at stock tank conditions.
l Gas volume fraction (GVF): the ratio of gas flowrate to liquid plus gasflowrates. It depends on oil density, gas molecular weight, CO2 content, H2Scontent, gas density and suction operating conditions.
Outlet conditions are not directly editable as these are set by the streamleaving the item.
l Discharge pressure : the inlet pressure of the downstream flowline. Tochange the discharge pressure, the inlet pressure of the downstream flowlinemust be modified.
l Pump differential pressure: the difference between the discharge and thesuction pressure. The maximum differential pressure is assumed to be 200 bar.To change the pump differential pressure, the multiphase pump suctionpressure must be modified.
Additional details are:
l Total pump power: the pumping station total power requirement. It dependson pump differential pressure and volumetric capacity. A 60% efficiency, 10%rating and 15% design factors are assumed.
l Number of pumps / train: the number of pumps installed in series. This isset to the minimum number of possible pumps, which is based on themaximum pressure drop allowed by the pump at the operating conditions.
l Number of trains: the minimum number of trains capable of dealing with thetotal flowrate. It depends on the maximum flowrate allowed at the minimumpressure drop.
l Spare pumps: these pumps are not installed, but kept in reserve for laterreplacements. By default, it is assumed that there will be one spare pump perpumping station.
l Total number of pumps: the sum of the installed pumps required for thespecific service and the number of spare pumps.
l Design duty / pump: the rated power per pump as a percentage of the totalpump power. Changing the number of pumps / train or the number of trains willchange the design duty per pump. This excludes the spare pump.
The sum of the total pump power of all the multiphase pumping stationsselected in a Subsea component is displayed in the Auxiliaries tab in theSubsea component together with the voltage (Figure 3).
IHS Markit May 2018 Page 11
QUE$TOR 2018 Q1 Release Notes
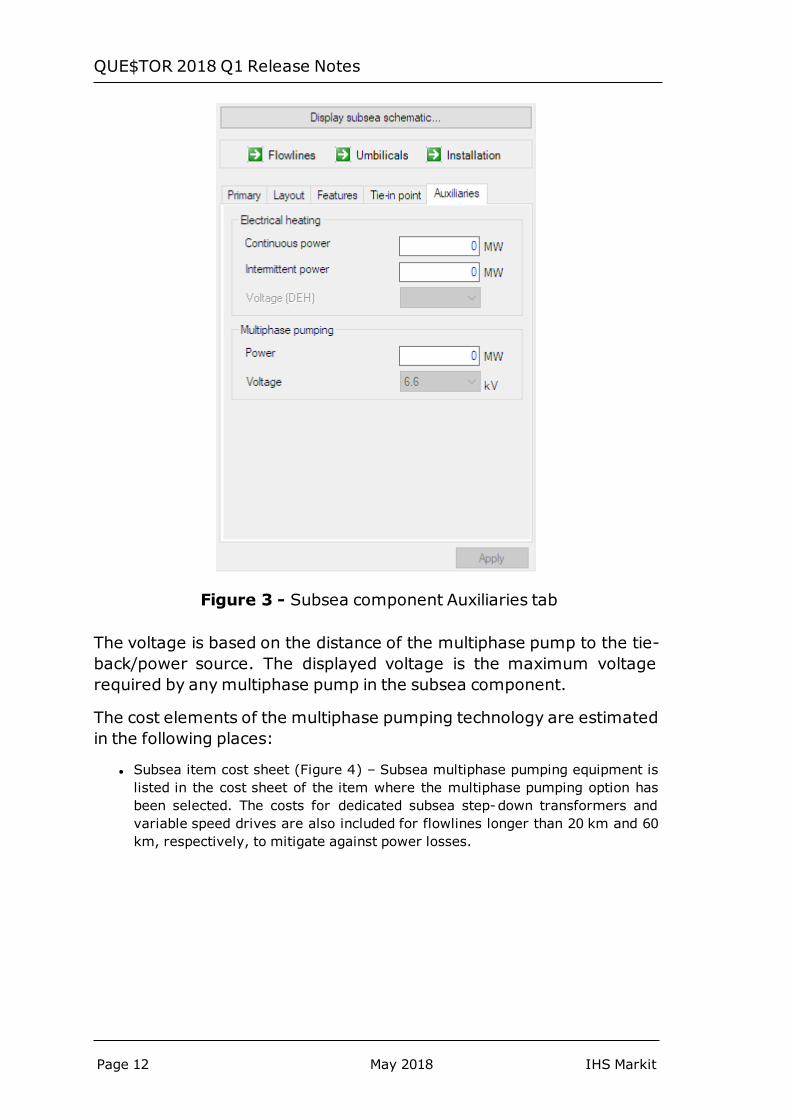
Figure 3 - Subsea component Auxiliaries tab
The voltage is based on the distance of the multiphase pump to the tie-back/power source. The displayed voltage is the maximum voltagerequired by anymultiphase pump in the subsea component.
The cost elements of the multiphase pumping technology are estimatedin the following places:
l Subsea item cost sheet (Figure 4) – Subsea multiphase pumping equipment islisted in the cost sheet of the item where the multiphase pumping option hasbeen selected. The costs for dedicated subsea step-down transformers andvariable speed drives are also included for flowlines longer than 20 km and 60km, respectively, to mitigate against power losses.
Page 12 May 2018 IHS Markit
QUE$TOR 2018 Q1 Release Notes
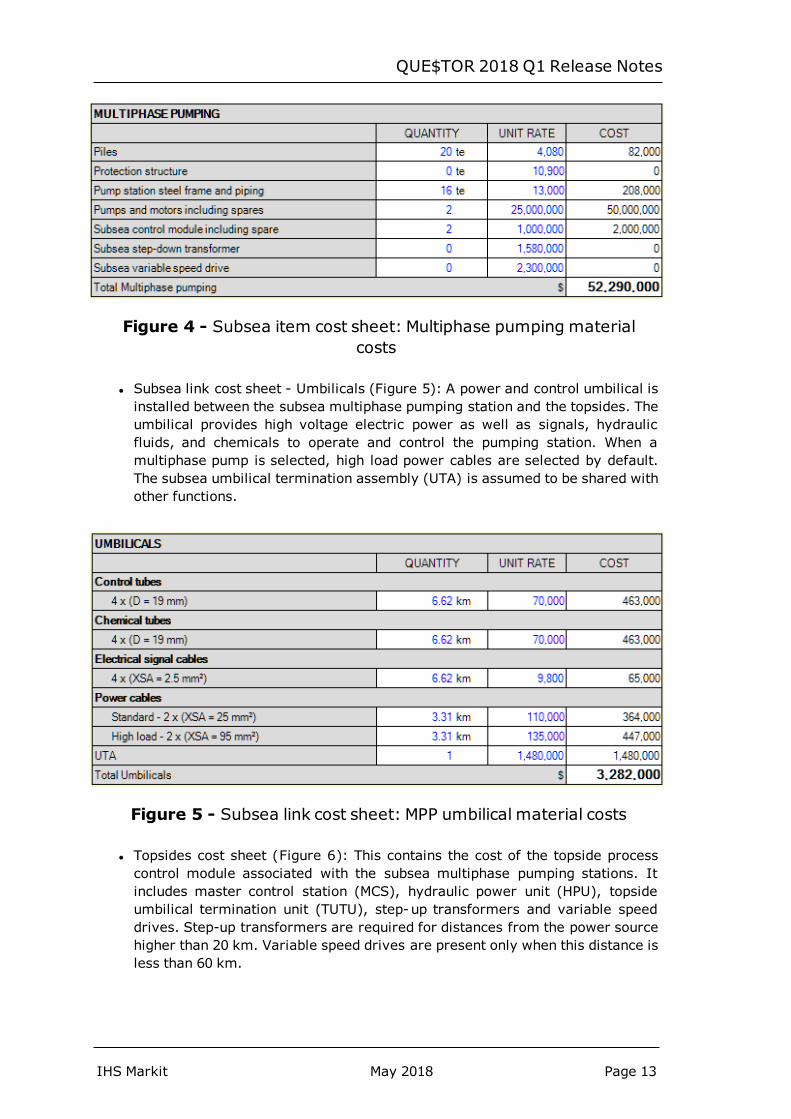
Figure 4 - Subsea item cost sheet: Multiphase pumping materialcosts
l Subsea link cost sheet - Umbilicals (Figure 5): A power and control umbilical isinstalled between the subsea multiphase pumping station and the topsides. Theumbilical provides high voltage electric power as well as signals, hydraulicfluids, and chemicals to operate and control the pumping station. When amultiphase pump is selected, high load power cables are selected by default.The subsea umbilical termination assembly (UTA) is assumed to be shared withother functions.
Figure 5 - Subsea link cost sheet: MPP umbilical material costs
l Topsides cost sheet (Figure 6): This contains the cost of the topside processcontrol module associated with the subsea multiphase pumping stations. Itincludes master control station (MCS), hydraulic power unit (HPU), topsideumbilical termination unit (TUTU), step-up transformers and variable speeddrives. Step-up transformers are required for distances from the power sourcehigher than 20 km. Variable speed drives are present only when this distance isless than 60 km.
IHS Markit May 2018 Page 13
QUE$TOR 2018 Q1 Release Notes
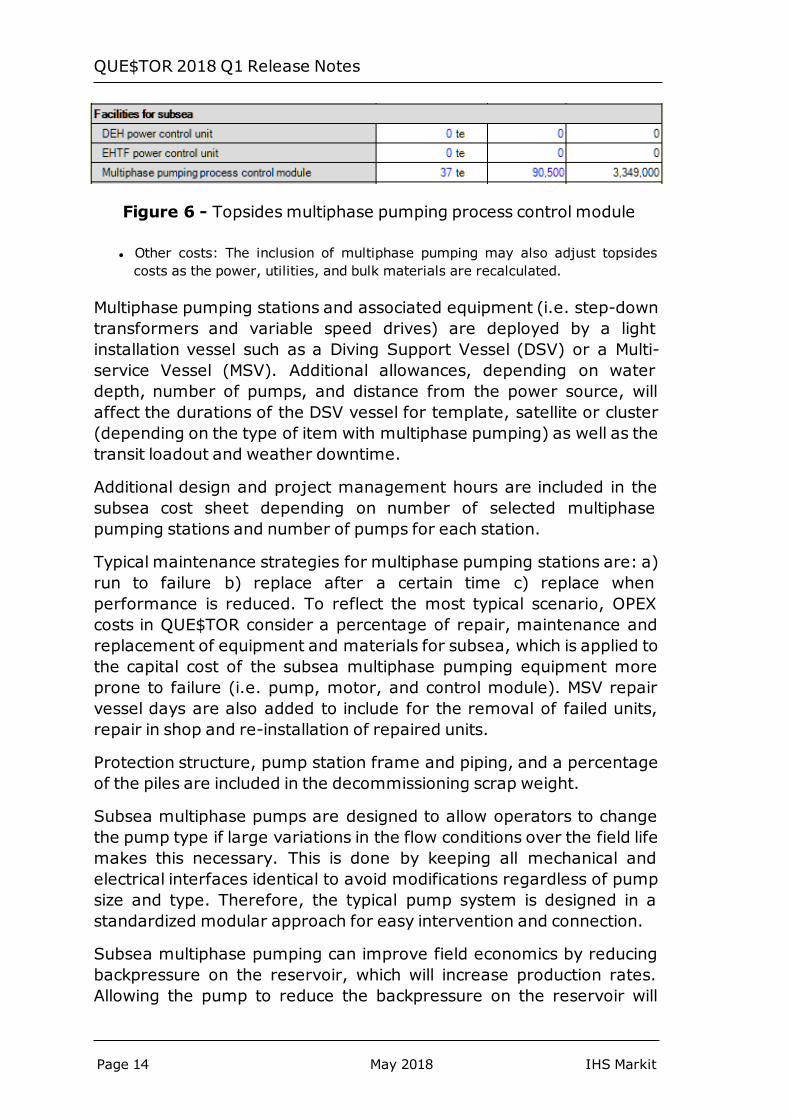
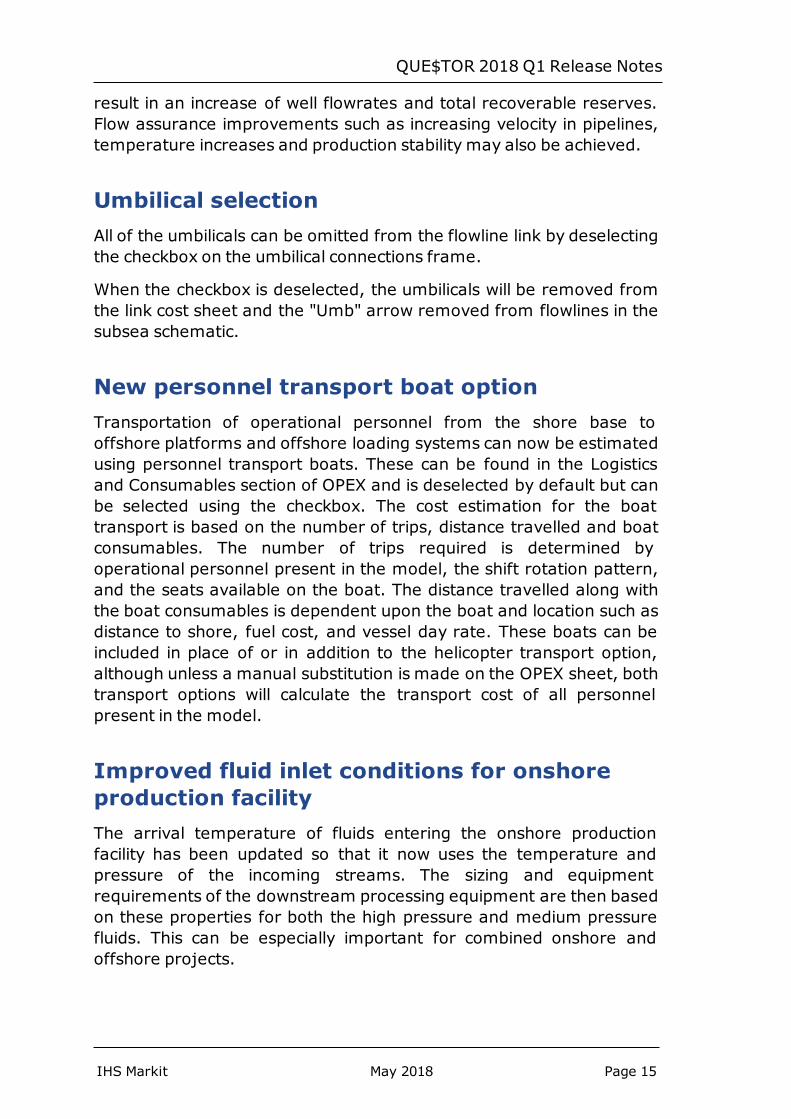
Figure 6 - Topsides multiphase pumping process control module
l Other costs: The inclusion of multiphase pumping may also adjust topsidescosts as the power, utilities, and bulk materials are recalculated.
Multiphase pumping stations and associated equipment (i.e. step-downtransformers and variable speed drives) are deployed by a lightinstallation vessel such as a Diving Support Vessel (DSV) or a Multi-service Vessel (MSV). Additional allowances, depending on waterdepth, number of pumps, and distance from the power source, willaffect the durations of the DSV vessel for template, satellite or cluster(depending on the type of item with multiphase pumping) as well as thetransit loadout and weather downtime.
Additional design and project management hours are included in thesubsea cost sheet depending on number of selected multiphasepumping stations and number of pumps for each station.
Typical maintenance strategies for multiphase pumping stations are: a)run to failure b) replace after a certain time c) replace whenperformance is reduced. To reflect the most typical scenario, OPEXcosts in QUE$TOR consider a percentage of repair, maintenance andreplacement of equipment and materials for subsea, which is applied tothe capital cost of the subsea multiphase pumping equipment moreprone to failure (i.e. pump, motor, and control module). MSV repairvessel days are also added to include for the removal of failed units,repair in shop and re-installation of repaired units.
Protection structure, pump station frame and piping, and a percentageof the piles are included in the decommissioning scrap weight.
Subsea multiphase pumps are designed to allow operators to changethe pump type if large variations in the flow conditions over the field lifemakes this necessary. This is done by keeping all mechanical andelectrical interfaces identical to avoid modifications regardless of pumpsize and type. Therefore, the typical pump system is designed in astandardized modular approach for easy intervention and connection.
Subsea multiphase pumping can improve field economics by reducingbackpressure on the reservoir, which will increase production rates.Allowing the pump to reduce the backpressure on the reservoir will
Page 14 May 2018 IHS Markit
QUE$TOR 2018 Q1 Release Notes
result in an increase of well flowrates and total recoverable reserves.Flow assurance improvements such as increasing velocity in pipelines,temperature increases and production stability may also be achieved.
Umbilical selectionAll of the umbilicals can be omitted from the flowline link by deselectingthe checkbox on the umbilical connections frame.
When the checkbox is deselected, the umbilicals will be removed fromthe link cost sheet and the "Umb" arrow removed from flowlines in thesubsea schematic.
New personnel transport boat optionTransportation of operational personnel from the shore base tooffshore platforms and offshore loading systems can now be estimatedusing personnel transport boats. These can be found in the Logisticsand Consumables section of OPEX and is deselected by default but canbe selected using the checkbox. The cost estimation for the boattransport is based on the number of trips, distance travelled and boatconsumables. The number of trips required is determined byoperational personnel present in the model, the shift rotation pattern,and the seats available on the boat. The distance travelled along withthe boat consumables is dependent upon the boat and location such asdistance to shore, fuel cost, and vessel day rate. These boats can beincluded in place of or in addition to the helicopter transport option,although unless a manual substitution is made on the OPEX sheet, bothtransport options will calculate the transport cost of all personnelpresent in the model.
Improved fluid inlet conditions for onshoreproduction facilityThe arrival temperature of fluids entering the onshore productionfacility has been updated so that it now uses the temperature andpressure of the incoming streams. The sizing and equipmentrequirements of the downstream processing equipment are then basedon these properties for both the high pressure and medium pressurefluids. This can be especially important for combined onshore andoffshore projects.
IHS Markit May 2018 Page 15
QUE$TOR 2018 Q1 Release Notes
The arrival temperature is now based on a mass flowrate average of allthe valid input flowlines and pipelines, using the outlet temperature ofeach line. The mass flowrate is approximated from volumetric flowratesusing field level oil density and gas molecular weight values. Thischange will apply to all fluid pipelines and flowlines with flows greaterthan zero, and with a flow type that is either ‘Two phase’, ‘gas’, ‘oil’ or‘oil and water’. If no such lines are connected to the production facility,the arrival temperature will equal the flowing wellhead temperatureminus a 10°C temperature loss.
Similarly the arrival pressure is the minimum outlet pressure of all suchflowlines and pipelines. If no such lines are connected to the productionfacility, the arrival pressure will equal 35 bara for oil projects and 80bara for gas projects.
Page 16 May 2018 IHS Markit
QUE$TOR 2018 Q1 Release Notes
Selected other technical revisionsA number of other technical revisions have been made to theapplication.
l Onshore wellpad flowlines now have editable values for both thefluid temperature in and out. The fluid temperature out iscalculated, taking into account the insulation and the constructiontype.
l The OPEX leasing values for "Lease company corporation tax" and"Lease company discount rate" for a leased topsides and tankercan be specified up to two decimal places to improve the accuracyof results.
l The subsea commingling item now calculates the manifolding(piping & valve) weight when there is just one flowline passingthrough the item. There is no change in weight calculation forinstances where multiple flowlines are manifolded together.
l The helicopter transportation cost can now be excluded or includedin a single step using the new checkbox in the helicopter section ofthe Logistics and Consumables portion of offshore OPEX.
l The dehydrator detailed results are now shown on the firstdehydrator properties form, this will calculate dynamically as theinputs are modified making it easier to see the impact of thepossible selections. There have also been some other minorcorrections to the calculations when multiple dehydration tanks arepresent, this is all in preparation for making the number of trainsand design capacity an editable input.
l A new input has been added for the annual insurance cost rate inboth onshore and offshore OPEX. The new input allows the rate tobe entered once for the life of the project for each componentmaking data entry simpler.
IHS Markit May 2018 Page 17
QUE$TOR 2018 Q1 Release Notes
Cost database updateSubstantial effort has gone into reviewing all cost databases to bringthem in line with first quarter 2018 costs.
Note: On saving the project, the QUE$TOR 2018 Q1 cost estimate willoverwrite earlier costs except where those costs were ‘locked’ on thecost sheet or in the database. Therefore if you wish to retain a copy ofyour original estimate you should first create a duplicate of the projectbefore opening and saving it in QUE$TOR 2018 Q1.
The following sections outline where the most significant changes to theregional cost databases have been made.
GeneralThe global oil and gas (O&G) industry is slowly recovering from one ofthe most extended oil price downturns in its history, which has radicallychanged how O&G companies do business in two fundamental ways:they have become much more disciplined on costs and have madedramatic improvements in efficiency. As a result, the industry isemerging from this harsh recession completely reshaped and muchmore agile than the one which used to operate when crude oil priceswere over a hundred dollars per barrel.
With the recent oil price boost, an increasingly optimistic mood hasspread around, especially with respect to the offshore sector. The lastfew years have been very difficult. Several companies have leftdeepwater, but overall the industry has kept momentum going throughthese very hard times. The outlook for drilling and oil field servicescompanies has recently become more positive, with earnings likely torise as upstream capital spending and the global rig count continue toincrease. This positive outlook, however, is only an improvement for asector that remains very weak rather than a return to full health.
Although there is increased positive sentiment, it is worth noting thatthere is a downside to increased oil prices that could cost the industry asignificant amount of money. When crude markets collapsed,exploration companies used hedging contracts to lock in payments forfuture barrels to survive decreasing prices. Now, as global tensions andsupply cuts drive prices over the 70 USD/bbl mark, those contracts havebecome a heavy weight on profits, limiting some companies from
Page 18 May 2018 IHS Markit
QUE$TOR 2018 Q1 Release Notes
cashing in while the price is going up. Still the near future trend is verydifficult to forecast, especially because there are factors which candeeply change the direction of the latest trends.
l The global economy is on the edge of a long-feared escalation intrade tensions. The Trump administration’s trade actions have yetto be fully defined and implemented, but are already proving to bedisruptive. While China and the United States are deliveringstronger than expected growth rates, ongoing trade disputesbetween the two countries could undermine their growthtrajectories and also affect the economic development of manyother countries.
l A combination of higher well productivity, lower service costs, andefficiency gains have lowered the break-even price for US oilproducers. Any further increase in oil prices could start anotheroversupply crisis and bring back the oil prices to the low levels seenin the recent past.
Oil price trendCrude oil has been at the forefront of the news for a while now. For thelast few years the attention has centred on the global oil price plungethat started back in 2014, bottoming out in January 2016, by falling tothe lowest level in over a decade. Since middle 2017, the oil price trendhas shown a relatively constant increase with a price rally this firstquarter, fuelled by geopolitical tensions, extended supply cuts androbust energy demand.
Brent crude oil price has risen by more than 20 USD/bbl since middle2017, recently reaching the 70 USD/bbl level. West Texas Intermediate(WTI) price has followed a similar path and remained above 60 USD/bblsince the beginning of this year (Figure 7). However, investing in the USupstream industry is very responsive to changes in the oil price. WTIprices near or above 60 USD/bbl are unlocking the potential for verystrong US crude oil production increases. It is likely that the scale ofgrowth will approach levels last reached in 2012-14. The price risesupports more drilling activity with most of the production growthcoming from the Permian Basin. Fast rising US output will put a restrainton the upward trend of the crude oil price. Strong compliance on supplycuts from members of the Organization of the Petroleum ExportingCountries (OPEC) and its allies like Russia have also supported therecent rising prices. It is likely that the group and its allies will keep their
IHS Markit May 2018 Page 19
QUE$TOR 2018 Q1 Release Notes
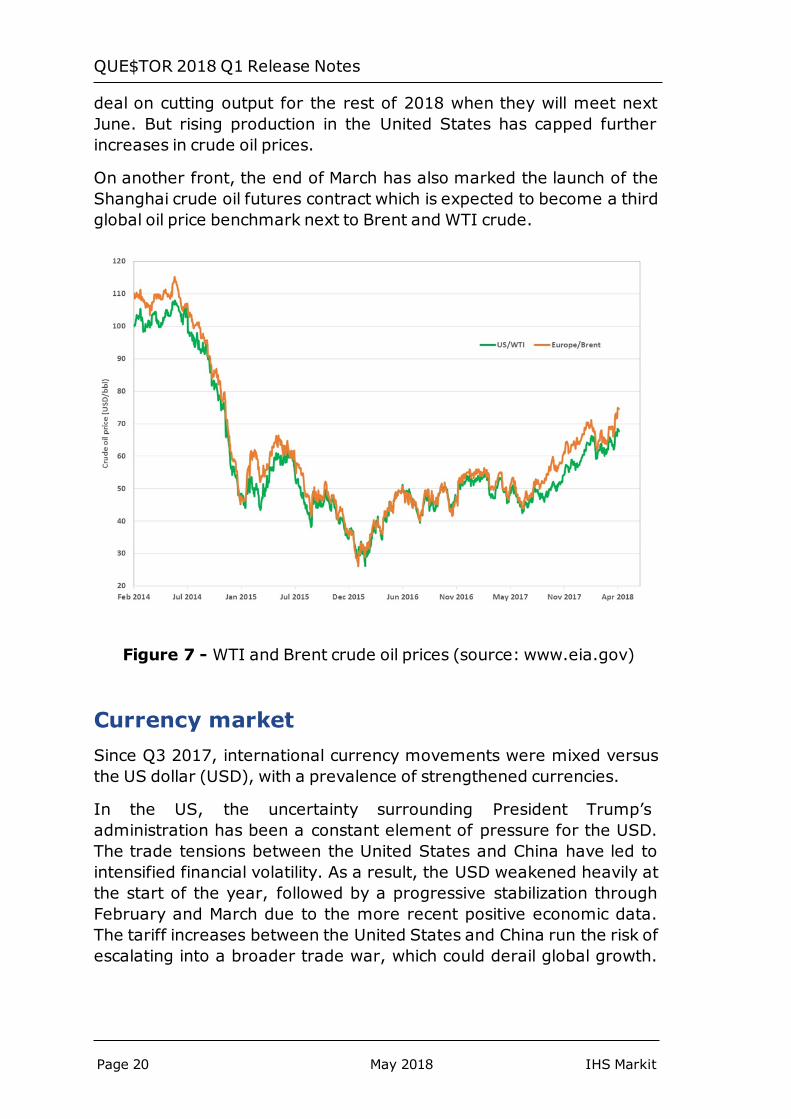
deal on cutting output for the rest of 2018 when they will meet nextJune. But rising production in the United States has capped furtherincreases in crude oil prices.
On another front, the end of March has also marked the launch of theShanghai crude oil futures contract which is expected to become a thirdglobal oil price benchmark next to Brent and WTI crude.
Figure 7 - WTI and Brent crude oil prices (source: www.eia.gov)
Currency marketSince Q3 2017, international currency movements were mixed versusthe US dollar (USD), with a prevalence of strengthened currencies.
In the US, the uncertainty surrounding President Trump’sadministration has been a constant element of pressure for the USD.The trade tensions between the United States and China have led tointensified financial volatility. As a result, the USD weakened heavily atthe start of the year, followed by a progressive stabilization throughFebruary and March due to the more recent positive economic data.The tariff increases between the United States and China run the risk ofescalating into a broader trade war, which could derail global growth.
Page 20 May 2018 IHS Markit
QUE$TOR 2018 Q1 Release Notes
For the moment, the probability of such an outcome appears to be low.However, an escalation in retaliatory trade tariffs could weigh heavilyon financial markets and business investment plans.
The Canadian dollar (CAD) performed poorly in Q1 2018, falling againstthe USD. Business investment in Canada is being depressed byuncertainty over the future of the North American Free TradeAgreement (NAFTA), escalating trade tensions between US and Chinaand, internally, by changes in housing policies and mortgage lendingstandards. At the same time, the domestic oil sector is suffering due tooversupply and lack of pipeline capacity to export product.
The euro (EUR) performed well for much of the first quarter 2018,consolidating the strong gains seen at the end of 2017. This time lastyear, the EUR was threatened by the emergence of populism in Franceand the Netherlands. Instead EU elections went smoothly and investors’concerns faded once President Macron won a majority in France. As aresult, the EUR started its solid recovery. The year 2018 is shaping up tobe an interesting one. On one side, the elections in Italy and thedevelopments of the ongoing Brexit negotiations are likely to addpressure to the currency. On the other, recently the EUR has beenlargely insensitive to adverse trends versus the USD and it is likely that itwill benefit further from signs of increasing capital inflows into theEurozone in the months ahead.
The British pound (GBP) has strengthened against the USD but not asmuch against the EUR. The UK and its EU partners have made someprogress on the UK’s terms of withdrawal from the EU, although there isan awful lot of work still to be done. In general, UK growth is capped asBrexit-related uncertainty delays investments. Recently, the UK hasbenefitted from an increase in wages which has eased pressure ondomestic consumers, squeezed by weak real wage growth.
In Asia, China’s resilient economic growth and improving dynamics inIndia are supporting economic activity in the region. The economy ofmost South Asian countries continues to defy any sign of an economicslowdown due to a combination of largely loose financial conditions inthe region and a robust global trade cycle. The Chinese yuan (CNY), theJapanese yen (JPY), Malaysian ringgit (MYR), the Singaporean dollar(SGD), and the Thai baht (THB) were amongst the best performers.The Australian dollar (AUD) lost value slightly versus the USD onconcerns over rising global protectionism. The Australian labour markethas slowed down in recent months although the economy is expected tobe supported by robust LNG exports as new projects come onstream.
IHS Markit May 2018 Page 21
QUE$TOR 2018 Q1 Release Notes
Eastern Europe, meanwhile, is benefiting from the ongoing economicrecovery in Russia, solid growth among some key regional economiessuch as Romania and Turkey, and resilient dynamics in the EuropeanUnion.
The Russian ruble (RUB) has reflected the country’s economic steadyrecovery from 2015-16 recession, supported by low inflation, reducedinterest rates and higher commodity prices. Both Russian industrialproduction and exports expanded notably in the first quarter of 2018.
In Latin and South America, the Mexican peso (MXN) strengthenedsignificantly in Q1, although recovering from a record low against theUSD in Q4 2017. The Mexican economy accelerated in Q1, but thefuture is clouded by uncertainties on NAFTA renegotiations and generalelections scheduled for next July. The MXN remains very volatile andsubject to US presidential attitudes. The Colombian (COP) and Chilean(CLP) pesos strengthened but remained influenced by global tradedeliberations and risks around the near-term outlook for commodities.The Venezuelan bolivar (VEF) had an unprecedented decline as thecountry has continued to remain in a deep recession on the back ofhyperinflation, shortages of goods and large fiscal imbalances.Presidential elections have been re scheduled for the second half ofMay, although many political parties have decided to not participate inwhat they see as illegitimate elections. It is very likely that presidentMaduro will be re-elected even if a group of neighbour countries havealready declared to reject the election outcome. Besides, the US andthe EU are considering implementing additional sanctions against thecountry. While a rebound in the oil sector could alleviate some of thecountry’s issues, oil prices are expected to remain well below the typicalbreak-even level for Venezuelan projects, removing any chance for oilprofits to improve the country’s fortunes.
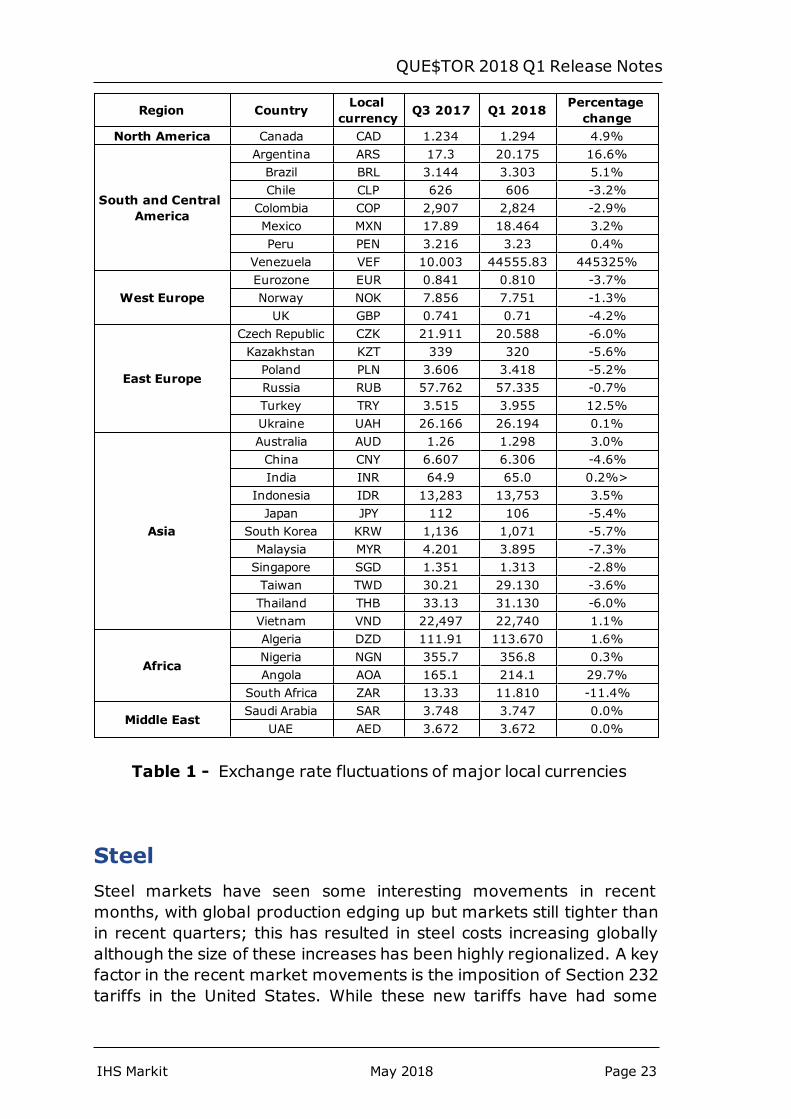
Table 1 lists the exchange rates, averaged over the last two weeksbefore the end of each quarter, of the major local currencies expressedas local currency equivalent to 1 USD, and the percentage changebetween Q1 2018 and Q3 2017.
Page 22 May 2018 IHS Markit
QUE$TOR 2018 Q1 Release Notes
Region Country Localcurrency Q3 2017 Q1 2018 Percentage
changeNorth America Canada CAD 1.234 1.294 4.9%
South and CentralAmerica
Argentina ARS 17.3 20.175 16.6%Brazil BRL 3.144 3.303 5.1%Chile CLP 626 606 -3.2%
Colombia COP 2,907 2,824 -2.9%Mexico MXN 17.89 18.464 3.2%Peru PEN 3.216 3.23 0.4%
Venezuela VEF 10.003 44555.83 445325%
West EuropeEurozone EUR 0.841 0.810 -3.7%Norway NOK 7.856 7.751 -1.3%UK GBP 0.741 0.71 -4.2%
East Europe
Czech Republic CZK 21.911 20.588 -6.0%Kazakhstan KZT 339 320 -5.6%Poland PLN 3.606 3.418 -5.2%Russia RUB 57.762 57.335 -0.7%Turkey TRY 3.515 3.955 12.5%Ukraine UAH 26.166 26.194 0.1%
Asia
Australia AUD 1.26 1.298 3.0%China CNY 6.607 6.306 -4.6%India INR 64.9 65.0 0.2%>
Indonesia IDR 13,283 13,753 3.5%Japan JPY 112 106 -5.4%
South Korea KRW 1,136 1,071 -5.7%Malaysia MYR 4.201 3.895 -7.3%Singapore SGD 1.351 1.313 -2.8%Taiwan TWD 30.21 29.130 -3.6%Thailand THB 33.13 31.130 -6.0%Vietnam VND 22,497 22,740 1.1%
Africa
Algeria DZD 111.91 113.670 1.6%Nigeria NGN 355.7 356.8 0.3%Angola AOA 165.1 214.1 29.7%
South Africa ZAR 13.33 11.810 -11.4%
Middle EastSaudi Arabia SAR 3.748 3.747 0.0%
UAE AED 3.672 3.672 0.0%
Table 1 - Exchange rate fluctuations of major local currencies
SteelSteel markets have seen some interesting movements in recentmonths, with global production edging up but markets still tighter thanin recent quarters; this has resulted in steel costs increasing globallyalthough the size of these increases has been highly regionalized. A keyfactor in the recent market movements is the imposition of Section 232tariffs in the United States. While these new tariffs have had some
IHS Markit May 2018 Page 23
QUE$TOR 2018 Q1 Release Notes
immediate impacts especially in the US they are expected to have someongoing impacts across the globe as regional markets continue tore-adjust and find a new normality.
In March of 2018 President Trump announced the imposition of a 25%tariff which took effect on March 23rd 2018. This tariff is imposed onimports of a variety of steel products many of which are heavily used inthe oil and gas industry. Canada and Mexico were exempt from thetariff and several other countries have negotiated, or are in the processof negotiating, relief. The extent and type of mitigation ultimatelynegotiated will have a large effect on how the global steel marketrebalances. Tariff relief is expected to be in the form of import quotasinto the US and as such the size of quota and specific materialsimpacted, either by manufacturing location or segment specification,will determine the impact on the global steel market.
Global steel production edged up early in 2018 with a relatively tightdemand side which has pushed up prices globally although the size andcause for the market shifts has been very regionalized. The immediatetariff impacts have already had a notable effect on the steel price in theUS. The tariffs are targeted at removing 13.3 million tons of importsfrom the US market with the intention of protecting US mills. It is nosurprise that the supply in the US has dropped considerably, driving upprices. Whether this is real demand or customers looking to securesupply is not clear although the result is the same either way. USdomestic production is expected to grow to meet the demand caused bythe reduced imports. However due to the uncertainty of US trade policyand the extent of tariff relief expected to be provided, there is anunwillingness to ramp up production too quickly. In the meantimesupply will tighten and lead to a drawdown on inventory resulting in asubstantial price spike in the first half of 2018, a significant element ofwhich can be seen in the 2018 Q1 databases. Structural steel costs inthe US were already somewhat high but increased further; plate andcoil prices have shown the largest increase of 25-30% in the last sixmonths. Oil Country Tubular Goods (OCTG) and linepipe have alsoincreased although the extent has been less pronounced but isexpected to increase further as the impact of increasing raw materialprice filters in. As the effects of the tariffs and the exemptions becomeclearer demand will continue to fluctuate as manufacturers attempt totarget the most profitable segment for themselves; this however willlikely result in some short-term spikes across the market segments.
Asian steel prices increased in the last six months but significantly lessthan the rest of the world. China makes up for about 50% of global steelproduction and while China has said it will reduce production by 20% by
Page 24 May 2018 IHS Markit
QUE$TOR 2018 Q1 Release Notes
2020, it is unlikely that this will have much effect in the short term. Theincrease in supply in the local market due to the reduction in exports tothe US has likely been a significant factor. Chinese production has beenincreasing with some incentives for more efficient less polluting mills,however overall stimulus expectations in China have not been met.Suppliers of small diameter linepipe are facing a tight credit market andstrong competition especially for the smaller less efficient end of themarket. Some mills have been forced to shut down and further closuresare expected. The Chinese New Year has also had an impact on marketactivity although the return from the holiday has not seen the uptickusually expected. The Indian steel market has seen stronger growth inpart due to almost doubling of exports to the Europe market. Asianlinepipe costs have also risen 1-2%. This is likely due to South Korearecently shifting their focus towards production of the higher marginOCTG; as they are the major player in Asia for linepipe their localchanges can impact the whole region.
Demand in Europe has been firm in recent months driving up prices inthe 10% range, with expectations for demand to continue to increasethrough 2018, albeit at a moderate rate. However, these high pricesare attracting imports and the excess Chinese supply no longerexported to the US market will be looking for a home; some is likely toenter the European market. However, Chinese exports to the EU havefallen substantially in recent months and the EU have their own tradedefence measures to avoid dumping. While it is difficult to predict theexact extent of Chinese steel imported into Europe, the recent tariffs inthe US are bound to have some impact in this market. Considering allthis is likely to result in an increase in supply greater than the expectedincrease in demand, all of which is likely to have a negative effect onEuropean prices.
Overall the steel market is still in the midst of an appreciable shift ofwhich the final outcome is far from clear. As the US tariffs andassociated exemption impacts are finalized and the resultantrebalancing of steel supply globally is worked out we are likely to seesome notable spikes and dips in pricing, many of which will likely besomewhat short lived. However, increases in the steel price in USmarkets and declines in global markets is the most probable scenario.
IHS Markit May 2018 Page 25
QUE$TOR 2018 Q1 Release Notes
EquipmentEquipment costs have continued to increase steadily in the last sixmonths, continuing their gradual recovery started at the end of 2016.This first quarter of 2018 marks the sixth consecutive quarter thatequipment costs have increased.
During the O&G industry downturn, equipment suppliers implementedvarious measures to adjust their activity to a lower demand level,focussing on manufacturing efficiency improvements and structuralchanges. The slowdown has provided suppliers with the opportunity tofocus their resources on Research and Development (R&D) activitieswhich has resulted in a technological development boost. This hasoccurred especially in the gas turbine and gas compressormanufacturing industries.
The recent improvement in crude oil prices has spread some optimismthat the recovery is sustainable. This has caused equipment costs to goup in all regions. Additional cost drivers were an increased demand andthe rises in raw material prices and labour costs. Furthermore,sub-vendors have started passing their cost increases down the supplychain, contributing to higher prices.
Demand for heat exchangers increased in 2017 thanks to severalrefinery projects going forward, which were favoured by the low oilprices in the two previous years. However, a decrease in spending inthis area is expected in the short to medium term because of someproject postponements in the refinery sector and the pessimisticforecast in the LNG facilities market. Within the heat exchanger marketthere is some differentiation in the supply side depending on the type ofequipment. While the shell and tube type is dominated by localsuppliers, the plate and frame and cryogenic heat exchangers tend tohave global manufacturers, who are finding it difficult to lower entrybarriers in regional markets with local content policies.
Costs of tanks and pressure vessels are on the rise thanks to animprovement in demand. The supply side has started to becometighter, but the global production capacity remains large enough tocope with market demand over the short term. However, an increasingrisk is the recent protectionist measures implemented by the US. Sincesteel is a key rawmaterial for these products, the price increases in theUS following the announcement of steel and aluminium tariffs maycause these costs to rise. Even if fabricated metal products and
Page 26 May 2018 IHS Markit
QUE$TOR 2018 Q1 Release Notes
equipment have not been included in the list of imposed tariffs, thepossibility of their inclusion in the near future remains significant andmay lead to higher market uncertainty.
Pump and compressor costs registered a modest increase. Similarly,costs for gas turbines and generator sets increased moderately.Bargaining power remains on the buyers’ side, but suppliers haveadjusted their manufacturing capacities and improved productionflexibility to reduce their exposure to volatile demand.
BulksBulk materials consist of concrete and cement, wiring and electricalcomponents, instrumentation and valves, paint, asphalt, insulation andother components. These items are shared across many industrieswhere most of the purchasing occurs in the construction sector. Thepricing for bulk materials generally tracks the construction industry andits sub-markets. This does mean that the bulkmaterials market can bein a different cycle when compared to other items that can be relatedmore closely to the oil and gas sector.
In general, bulk material costs have increased slightly since Q3 2017,with a more significant change in USD terms. This was largely due to anincrease in demand from the construction and manufacturingindustries. A stronger financial and economic situation in 2017 sawglobal construction expenditure climbing moderately throughout theyear. This was led by moderate growth in Asia, closely followed bysimilar growth in Europe. In contrast, South America had the lowestregional construction growth.
The global consumption of concrete and cement in 2017 was greaterthan in 2016. This was likely to be the cause of their global pricesincreasing in Q4 2017. The consumption rate of these materials isexpected to increase further throughout 2018.
Asphalt, which is produced through the refining of crude oil, increased incost due to the stronger oil price in the first quarter of 2018.
Upsurges in the cost of copper and aluminium have forced non-ferrouswire and cable manufacturers to make small increases in prices. Inmid-2016 wire and cable costs reached new lows and have only risensince then. Higher spending on infrastructure in 2018 helped strengthenrates of construction, plus recovering investments in energy-relatedindustries should ensure continued positivity in this area.
IHS Markit May 2018 Page 27
QUE$TOR 2018 Q1 Release Notes
Paint costs increased slightly in Q1 2018. This industry in the US,Western Europe and Japan is mature with strong links to housing,construction and transportation.
If the oil price and the global economy continue to improve throughout2018, it is then likely that bulk material costs will rise throughout therest of the year.
Offshore rigsThe international offshore rig market in this first quarter of 2018 hasseen an extension of the trends that have shaped the market over thepast year: further rig owner consolidation, increase in competitive rigsupply as new builds entered the market, more scrapping, and low dayrates. The oil price, which is one of the most influential drivers ofoffshore drilling activity, is now higher than it has been since the oil pricecrash in 2014. However, high uncertainties on its future trend,efficiency measures, cost cutting decisions, and cautiousness inexploration and production planning are still putting heavy constraintson a full recovery of the rig market.
The impact of the new oil price environment can also be seen in thechange of rig migration trends. Migration has changed over the pastyears as the rig market cycle has shifted, with a peak in activity in 2013to a record low in 2015-16, and now entering a phase of stabilizationwith prudent recovery. Before the oil price crash, relocation formarketing was the main reason for a large proportion of moves ofjackup and semi submersible units. During the downturn, most movesfollowed contract completions or termination and resulted in a move toa stacking or scrapping location. Some other rig moves were fromshipyards after rig deliveries to locations for new contracts that werefixed before the downturn. The rest of the moves involved rigs thatwere either already stacked or had just finished a contract moving to anew contract location. Nowadays, when a rig terminates a contract, it isunlikely it will get work immediately; therefore, contractors are forcedto consider a location to stack it, which is not only cost effective but alsobeneficial to its future marketing. A new type of rig move, which hasrecently become more common, is mobilizing rigs speculatively acrossregions for strategic reasons. Now that demand has started to improve,contractors seem more willing to take the risk of finding work after theymove the rig, and more units are expected to migrate on a speculativebasis trusting in the future demand of a specific region.
Page 28 May 2018 IHS Markit
QUE$TOR 2018 Q1 Release Notes
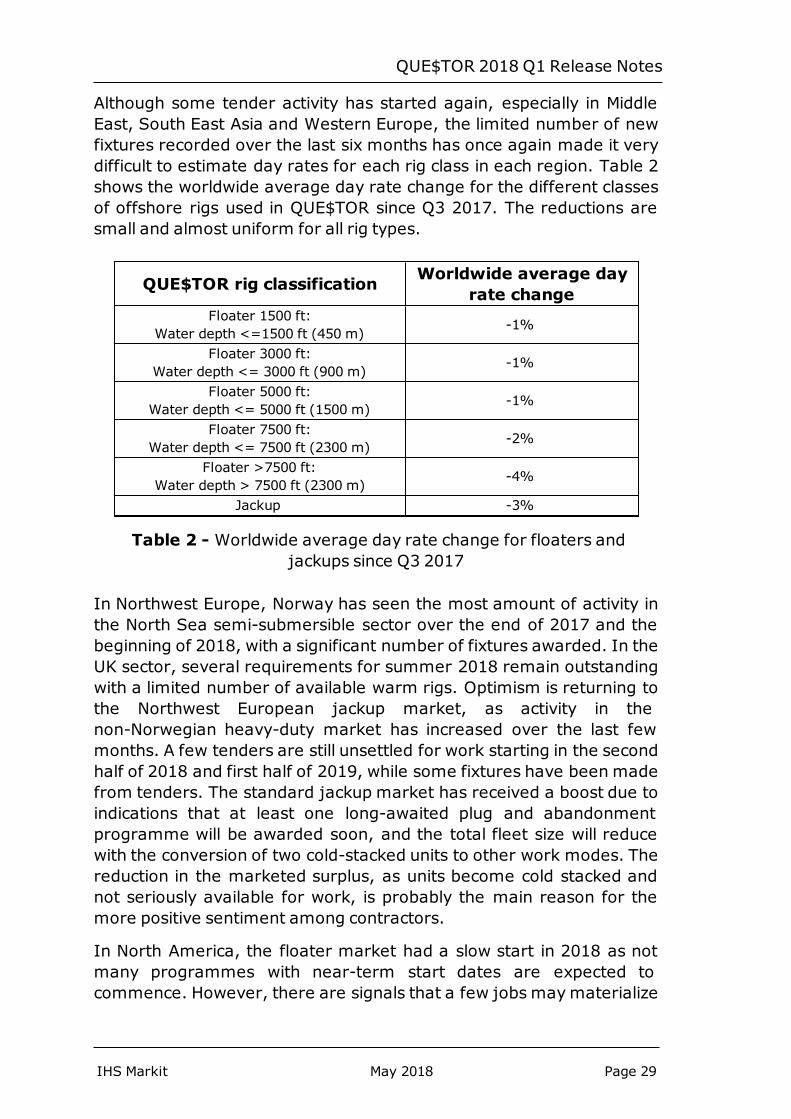
Although some tender activity has started again, especially in MiddleEast, South East Asia and Western Europe, the limited number of newfixtures recorded over the last six months has once again made it verydifficult to estimate day rates for each rig class in each region. Table 2shows the worldwide average day rate change for the different classesof offshore rigs used in QUE$TOR since Q3 2017. The reductions aresmall and almost uniform for all rig types.
QUE$TOR rig classification Worldwide average dayrate change
Floater 1500 ft:Water depth <=1500 ft (450 m) -1%
Floater 3000 ft:Water depth <= 3000 ft (900 m) -1%
Floater 5000 ft:Water depth <= 5000 ft (1500 m) -1%
Floater 7500 ft:Water depth <= 7500 ft (2300 m) -2%
Floater >7500 ft:Water depth > 7500 ft (2300 m) -4%
Jackup -3%
Table 2 - Worldwide average day rate change for floaters andjackups since Q3 2017
In Northwest Europe, Norway has seen the most amount of activity inthe North Sea semi-submersible sector over the end of 2017 and thebeginning of 2018, with a significant number of fixtures awarded. In theUK sector, several requirements for summer 2018 remain outstandingwith a limited number of available warm rigs. Optimism is returning tothe Northwest European jackup market, as activity in thenon-Norwegian heavy-duty market has increased over the last fewmonths. A few tenders are still unsettled for work starting in the secondhalf of 2018 and first half of 2019, while some fixtures have been madefrom tenders. The standard jackup market has received a boost due toindications that at least one long-awaited plug and abandonmentprogramme will be awarded soon, and the total fleet size will reducewith the conversion of two cold-stacked units to other work modes. Thereduction in the marketed surplus, as units become cold stacked andnot seriously available for work, is probably the main reason for themore positive sentiment among contractors.
In North America, the floater market had a slow start in 2018 as notmany programmes with near-term start dates are expected tocommence. However, there are signals that a few jobs maymaterialize
IHS Markit May 2018 Page 29
QUE$TOR 2018 Q1 Release Notes
in the second quarter. In the North American jackup market, only asmall number of units are under contracts while some permits wererecently approved and some shallow water prospects have emerged.
In Latin America, a couple of new rig programmes have commenced offthe coast of Trinidad and Tobago. A few operators are planning to domore work in Venezuela, whilst in Brazil Petrobras and its partners havelaid out plans to develop the Libra area and improve recovery from theRoncador field. Looking further into the future, there is likely to besome activity offshore Peru where Tullow has picked up several blocks,and offshore Argentina where the government has put together blocksto be offered in its first offshore licensing round, scheduled for later thisyear.
Floater utilization in Asia-Pacific is set to improve in 2018. The market isoptimistic that tender and survey activities will keep up and intensifythroughout the year to strengthen floater demand in the region, andowners should look at how they can continue to retire more floaters andreorganize their working fleet. The Asia-Pacific jackup market had arelatively robust year in 2017 and the year 2018 has kicked off with afew new charters, but unless the global oversupply declines, it willcontinue to be hard for day rates to increase.
In West Africa, the beginning of 2018 has proven to be positive for boththe jackup and floater markets with some new fixtures and newrequirements. While at the end of 2017 Nigeria and Namibia were thefocus of activity in the floater market, Ghana, Mauritania, and Senegalhave taken the bulk of recent headlines with new requirements in bothsectors. In terms of demand, 2018 is expected to see a low demand forsemi-submersibles but a more active market for drillships and jackups.
In the Middle East, jackup demand has increased and is projected tofurther rise between now and the end of 2018, driven by increasedactivity in Saudi Arabia, Qatar, and the United Arab Emirates (UAE). Inthe Mediterranean, demand for semi-submersibles and drillships hasremained steady while jackup demand has fallen slightly. There havebeen no recent developments or changes in the Caspian market.
As occurred in the previous release, the increasing reluctance of drillingcontractors and operators to reveal new fixture day rates has made itvery difficult to generate accurate current average earned rates formost of the regions and rig classes.
Shortage of recent fixtures has once again made this update quitechallenging. The spider diagram in Figure 8 shows the percent changesimplemented in QUE$TOR 2018 Q1 to the offshore rig day rates
Page 30 May 2018 IHS Markit
QUE$TOR 2018 Q1 Release Notes
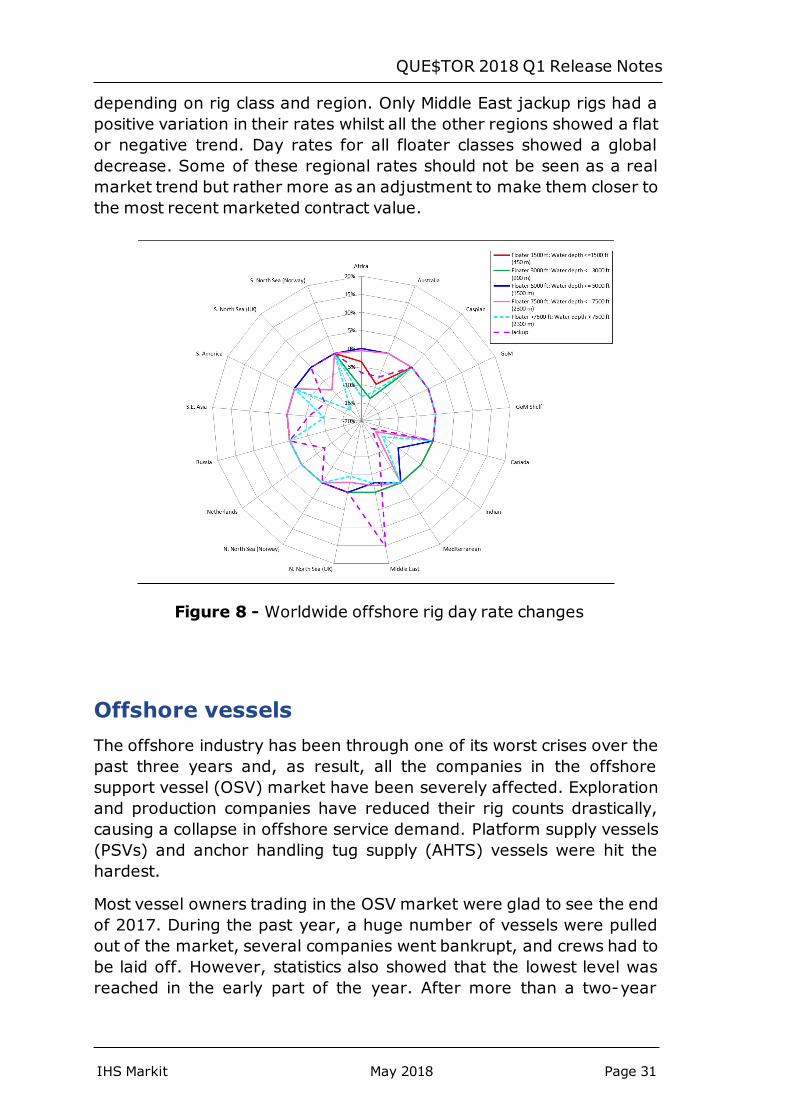
depending on rig class and region. Only Middle East jackup rigs had apositive variation in their rates whilst all the other regions showed a flator negative trend. Day rates for all floater classes showed a globaldecrease. Some of these regional rates should not be seen as a realmarket trend but rather more as an adjustment to make them closer tothe most recent marketed contract value.
Figure 8 - Worldwide offshore rig day rate changes
Offshore vesselsThe offshore industry has been through one of its worst crises over thepast three years and, as result, all the companies in the offshoresupport vessel (OSV) market have been severely affected. Explorationand production companies have reduced their rig counts drastically,causing a collapse in offshore service demand. Platform supply vessels(PSVs) and anchor handling tug supply (AHTS) vessels were hit thehardest.
Most vessel owners trading in the OSV market were glad to see the endof 2017. During the past year, a huge number of vessels were pulledout of the market, several companies went bankrupt, and crews had tobe laid off. However, statistics also showed that the lowest level wasreached in the early part of the year. After more than a two-year
IHS Markit May 2018 Page 31
QUE$TOR 2018 Q1 Release Notes
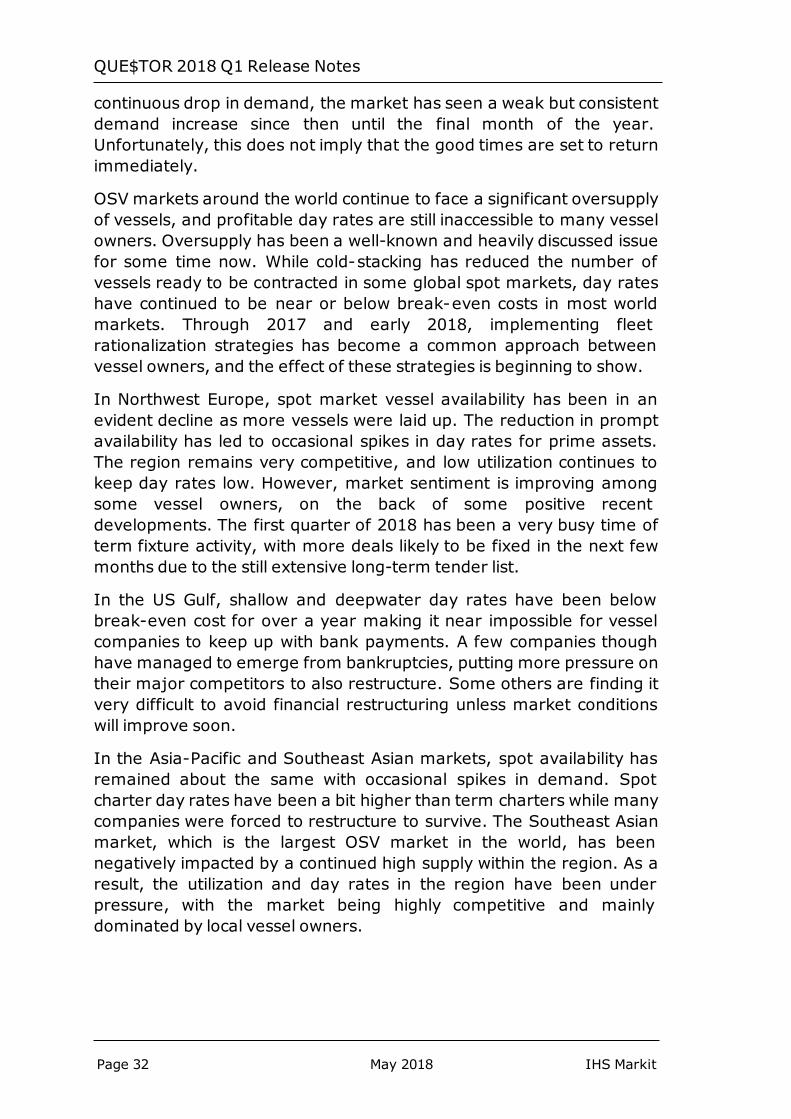
continuous drop in demand, the market has seen a weak but consistentdemand increase since then until the final month of the year.Unfortunately, this does not imply that the good times are set to returnimmediately.
OSV markets around the world continue to face a significant oversupplyof vessels, and profitable day rates are still inaccessible to many vesselowners. Oversupply has been a well-known and heavily discussed issuefor some time now. While cold-stacking has reduced the number ofvessels ready to be contracted in some global spot markets, day rateshave continued to be near or below break-even costs in most worldmarkets. Through 2017 and early 2018, implementing fleetrationalization strategies has become a common approach betweenvessel owners, and the effect of these strategies is beginning to show.
In Northwest Europe, spot market vessel availability has been in anevident decline as more vessels were laid up. The reduction in promptavailability has led to occasional spikes in day rates for prime assets.The region remains very competitive, and low utilization continues tokeep day rates low. However, market sentiment is improving amongsome vessel owners, on the back of some positive recentdevelopments. The first quarter of 2018 has been a very busy time ofterm fixture activity, with more deals likely to be fixed in the next fewmonths due to the still extensive long-term tender list.
In the US Gulf, shallow and deepwater day rates have been belowbreak-even cost for over a year making it near impossible for vesselcompanies to keep up with bank payments. A few companies thoughhave managed to emerge from bankruptcies, putting more pressure ontheir major competitors to also restructure. Some others are finding itvery difficult to avoid financial restructuring unless market conditionswill improve soon.
In the Asia-Pacific and Southeast Asian markets, spot availability hasremained about the same with occasional spikes in demand. Spotcharter day rates have been a bit higher than term charters while manycompanies were forced to restructure to survive. The Southeast Asianmarket, which is the largest OSV market in the world, has beennegatively impacted by a continued high supply within the region. As aresult, the utilization and day rates in the region have been underpressure, with the market being highly competitive and mainlydominated by local vessel owners.
Page 32 May 2018 IHS Markit
QUE$TOR 2018 Q1 Release Notes
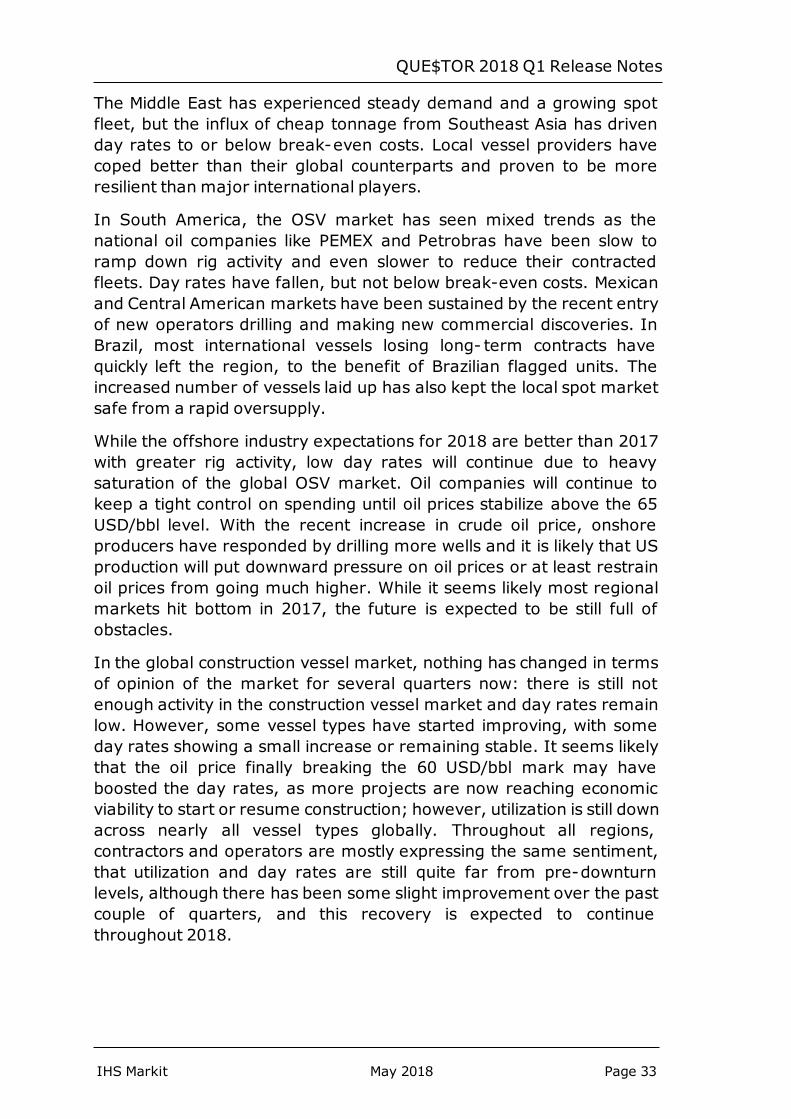
The Middle East has experienced steady demand and a growing spotfleet, but the influx of cheap tonnage from Southeast Asia has drivenday rates to or below break-even costs. Local vessel providers havecoped better than their global counterparts and proven to be moreresilient than major international players.
In South America, the OSV market has seen mixed trends as thenational oil companies like PEMEX and Petrobras have been slow toramp down rig activity and even slower to reduce their contractedfleets. Day rates have fallen, but not below break-even costs. Mexicanand Central American markets have been sustained by the recent entryof new operators drilling and making new commercial discoveries. InBrazil, most international vessels losing long- term contracts havequickly left the region, to the benefit of Brazilian flagged units. Theincreased number of vessels laid up has also kept the local spot marketsafe from a rapid oversupply.
While the offshore industry expectations for 2018 are better than 2017with greater rig activity, low day rates will continue due to heavysaturation of the global OSV market. Oil companies will continue tokeep a tight control on spending until oil prices stabilize above the 65USD/bbl level. With the recent increase in crude oil price, onshoreproducers have responded by drilling more wells and it is likely that USproduction will put downward pressure on oil prices or at least restrainoil prices from going much higher. While it seems likely most regionalmarkets hit bottom in 2017, the future is expected to be still full ofobstacles.
In the global construction vessel market, nothing has changed in termsof opinion of the market for several quarters now: there is still notenough activity in the construction vessel market and day rates remainlow. However, some vessel types have started improving, with someday rates showing a small increase or remaining stable. It seems likelythat the oil price finally breaking the 60 USD/bbl mark may haveboosted the day rates, as more projects are now reaching economicviability to start or resume construction; however, utilization is still downacross nearly all vessel types globally. Throughout all regions,contractors and operators are mostly expressing the same sentiment,that utilization and day rates are still quite far from pre-downturnlevels, although there has been some slight improvement over the pastcouple of quarters, and this recovery is expected to continuethroughout 2018.
IHS Markit May 2018 Page 33
QUE$TOR 2018 Q1 Release Notes
Subsea equipmentThe term “subsea equipment” is used to indicate the highly specializedequipment placed on the seabed and other equipment which is used tocontain and control the flow of crude oil and natural gas from thereservoir to the surface processing facility. The main components ofsubsea equipment are subsea trees, manifolds, control systems, andsubsea umbilicals, risers and flowlines (SURF).
A major driver in the global subsea equipment market is the number ofactive deepwater and ultra-deepwater drilling rigs. Offshore drillingactivity has experienced a strong slowdown after the oil price crisis in2014. The growing focus of oil majors on operational improvementshas resulted in a reduction in their capital and operating expenditures,which, in turn, has reduced the break- even value for crude oilproduction. The declining offshore production costs and the recentincrease in crude oil prices are driving a resurgence in offshore drillingactivity, which is influencing the global subsea market.
The market for subsea equipment appears to have reached its lowestpoint and is currently going through the early phases of a recovery.However, the industry still has a long way to go before returning tonormality. Subsea equipment awards in the past year increasedsignificantly compared with 2016 levels, but the increase is still verysmall when compared to the typical 300 subsea trees awarded annuallybefore the downturn.
After a long static period, subsea equipment costs have shown someupward movement in the last six months. This recent trend may beseen as an improvement considering the suppliers’ weak negotiatingpower; however, it must also be noted that suppliers are nowcompeting in the fastest moving economic environment since thefinancial crisis ten years ago.
A new trend to highlight in the subsea market is the growing number ofintegrated Engineering, Procurement, Construction, and Installation(iEPCI) contracts, bundling different subsea equipment contractpackages into a single iEPCI contract. Under this new contract model,these are no longer sourced by the operator, but by the subsea iEPCIcontractor, possibly according to the operator’s technical specificationor left entirely up to the iEPCI contractor.
This new contract model is shortening the project build time and likelyreducing the project risk as the installer could specify, procure,transport and install subsea equipment and components, ensuring
Page 34 May 2018 IHS Markit
QUE$TOR 2018 Q1 Release Notes
accountability. It is likely that an increase in iEPCI projects will translateinto a drastic drop in suppliers’ negotiating power since the number ofbuyers in the market may reduce significantly.
The subsea equipment market remains oversupplied and it is unlikelythat there will be supply issues in the short to medium term, even if themarket rebounds significantly. An interesting question is whetherfurther mergers and acquisitions in the industry will unsettle the supplyside of the market. After the acquisition of OneSubsea (Cameron) bySchlumberger in 2015 and the merger between FMC Technologies andTechnip in 2016 to form TechnipFMC, Aker Solutions is the onlycompany that is not part of a larger group.
LabourLabour rates have shown some positive movement in local currencyterms since Q3 2017 in all regions. The global economy has started thenew year on a solid footing, supported by healthy trade dynamics,resilient manufacturing activity and tighter job markets.
In North America, the US economy has expanded at a strong rate in thefirst quarter of 2018, led by robust export and surging investment. Thisfast growth has resulted in a tighter labour market. Employment datashows that solid hiring activity carried over from last year, supportingan acceleration in annual wage growth. On the downside, Canada’seconomy continued to cool, with some contraction in January due to adecline in oil and gas output.
In the Asia Pacific region, China continues to defy any sign of aneconomic slowdown as domestic spending remains strong andindustries benefit from robust global demand. This positive moment isovershadowed by the recent trade conflict with the US, but it seemsthat the most probable outcome is that the two countries will reach adeal and avoid a trade war. However, the risk has not completelyvanished and could undermine future economic development of the twocountries. In early April, China imposed tariffs on 128 Americanproducts worth three billion USD in response to US duties on aluminiumand steel imports.
In India, the recovery in investment in the industrial sectors has startedto show its effects on labour rates with a growth in wages. Recent data
IHS Markit May 2018 Page 35
QUE$TOR 2018 Q1 Release Notes
suggests that industrial production was upbeat although optimismremains constrained by an increasing trade deficit and numerous risksto inflation.
In the Eurozone, the economy continued to perform solidly as theconstruction industry’s attitude remains very supportive of growth. Thetailwinds of last year’s robust growth remain largely in place although alittle slowdown is likely to be due to a tightening labour market andmonetary policy.
In the UK, construction market demand remains unsettled due to theuncertainty of the Brexit negotiation process. International constructioncompanies are nervous about what the exit terms from the EuropeanUnion will be and the future impacts these terms will have on marketaccess to the country. The significant slowdown seen in the growth ratesin 2017 compared to the second half of 2016 continues to be evident.This has been intensified by the decline in private consumption growthdue to the squeeze on real disposable income and increased inflation.
In Africa, labour rates have increased especially in Angola where newlocal content legislation, approved in March 2017, is requiring the use ofmore local workforce among subsea suppliers. In Nigeria, Africa’slargest crude exporter, oil output has been volatile over the past fewyears due to militant attacks, pipeline theft and sabotage, and industrialaction. At the end of 2017, a major Nigerian oil union threatened tolaunch a strike after negotiations with domestic oil and gas companiesreached a deadlock.
In Russia, investment in important capital projects has continued from2017. Although the country has agreed to support the OPEC cuts toglobal oil supply through the end of 2018; upstream construction ismainly associated with gas projects as there are plans to sell gas toSaudi Arabia via energy alliances.
In the Middle East, the regional economy appears to have gained steamat the outset of this year, mainly due to higher oil prices, strongexternal demand and stabilization policies and reforms in somecountries. Rising geo political risks particularly between Iran and the USare adding upward pressure to oil prices, which in turn is having aneffect on oil and gas projects and labour market.
In South and Latin America, economic recovery has progressed sincethe last quarter of 2017. Higher commodities prices, solid global growthand indulgent financial conditions have supported growth in the regionin this first quarter of 2018. The labour market has seen an increase inrates, supported by a surge in investments and new field discoveries.
Page 36 May 2018 IHS Markit
QUE$TOR 2018 Q1 Release Notes
In the Engineering and Project Management (EPM) market, charge outrates have increased in most regions. Front- End Engineering andDesign (FEED) awards have remained strong whilst major Engineering,Procurement, and Construction (EPC) companies have announced thestart of new projects. This is the evident result of the recent oil pricerecovery and the following increase in operators’ capital and operatingbudgets. However, declining backlogs and an oversupplied market havekept the negotiating power in the hands of the operators. Theengineering services market will have to continue to opt for capacityreductions and consolidations for any chance to rebalance the volatileequilibrium of supply and demand.
Land rigsThe past year represented a marked recovery in both activity andexpenditure through the global onshore sector. With the start of thenew year, global sentiments appear to be improving further despite aslowing in US onshore rig counts in recent months. The current upwardmovement in oil prices is translating into a return of investor confidencewith an increase in capex budgets and the start of new drillingprograms. As a result, land rig day rates have increased since Q3 2017in most regions.
As for other sectors within the O&G industry, the land rig market hasundergone a radical transformation dictated by the new oil priceenvironment and higher efficiency requirements. The largest shift hasoccurred in North America, where drilling contractors have created anew class of ‘super spec’ rigs. The novelty of these rigs stands in theirboosted capabilities, being mainly upgraded high spec alternatingcurrent (AC) rigs. They are extremely efficient and provide high levelperformance, resulting in lower well costs.
North American high spec day rates rose for the fifth consecutivequarter as result of rigs being upgraded to super spec rigs. Drillingcontractors are not interested in investing in new builds as upgradingavailable rigs is a much cheaper option. Operating costs for drillingcontractors have been under control recently and concerns aboutlabour supply or cost have diminished. It is likely that North Americanday rates will continue to rise as they are based on drillingperformance; the new super spec rigs are the most efficient unitsavailable and therefore will dominate the drilling market.
IHS Markit May 2018 Page 37
QUE$TOR 2018 Q1 Release Notes
On international markets, day rates have also started to increase fromthe levels seen during the downturn. Activity is on the rise although ithas been a slow progression. Tender activity is trending upwards but ismoving slower compared to North America, with delays being related tothe redefinition of some rig fleets.
In the Middle East, high spec rig day rates increased only slightly. Mostof these units comes from Saudi Arabia, but other countries are tryingto move in the same direction. Companies have started to investheavily to upgrade their low spec drilling rigs, which are returningbecause of lack of demand. As drilling programs become more intenseand move towards unconventional wells, the low spec units are unableto do their job efficiently. The new upgraded rigs will reflect thecapabilities of the high spec AC rigs that marked the unconventionalsrevolution in the United States.
In Russia, drilling rigs have not changed very much in the last decadeand that is causing some issues. To maintain the current productionlevels, drilling activity has increased in Eastern Siberia as thebrownfields in Western Russia are declining in production. However, thecurrent rig fleet does not have the required capabilities to drill wells inthe harsh Siberian environment, at least not efficiently at large scale.To address this problem, Russia has started to collaborate with drillingrig manufacturers from Asia, who have managed to introduce somenew technologies. However, the Russian drilling fleet continues to bevery aged, with over half of the units older than fifteen years. All theserecent structural changes within the industry have played a role in dayrate movements.
Day rates for low spec rigs have experienced a slight increase in only afew regions. The North American drilling market has little or no work forthem, while drilling programs are increasingly requesting high spec rigsto meet their high performance targets; low spec rigs have lost favourand are struggling to maintain market share. There are only a fewregions where they still find work such as Eastern Europe, Russia andthe Middle East.
In general, tender activity is expected to increase internationally and inNorth America during this year. The main objective for drillingprograms will be increased performance and having rigs that meet thisobjective will translate into higher costs. At the moment, high specdrilling contractors are in a strong position and will tend to controlpricing, but this may be compromised rapidly if there is a drastic changein the oil price scenario.
Page 38 May 2018 IHS Markit
QUE$TOR 2018 Q1 Release Notes
Contacting customer supportAs part of the continuing licensing agreement for QUE$TOR, IHS Markitoffers a full technical support service via its regional offices. Bothcomputing and engineering support relating to the operation andunderstanding of the program are available.
The QUE$TOR support group has a dedicated support email address:[email protected]
Note: There is an 's', not a '$' in questor in the email address.
The IHS Markit software support team key contacts are as follows:
IHS Markit May 2018 Page 39
QUE$TOR 2018 Q1 Release Notes
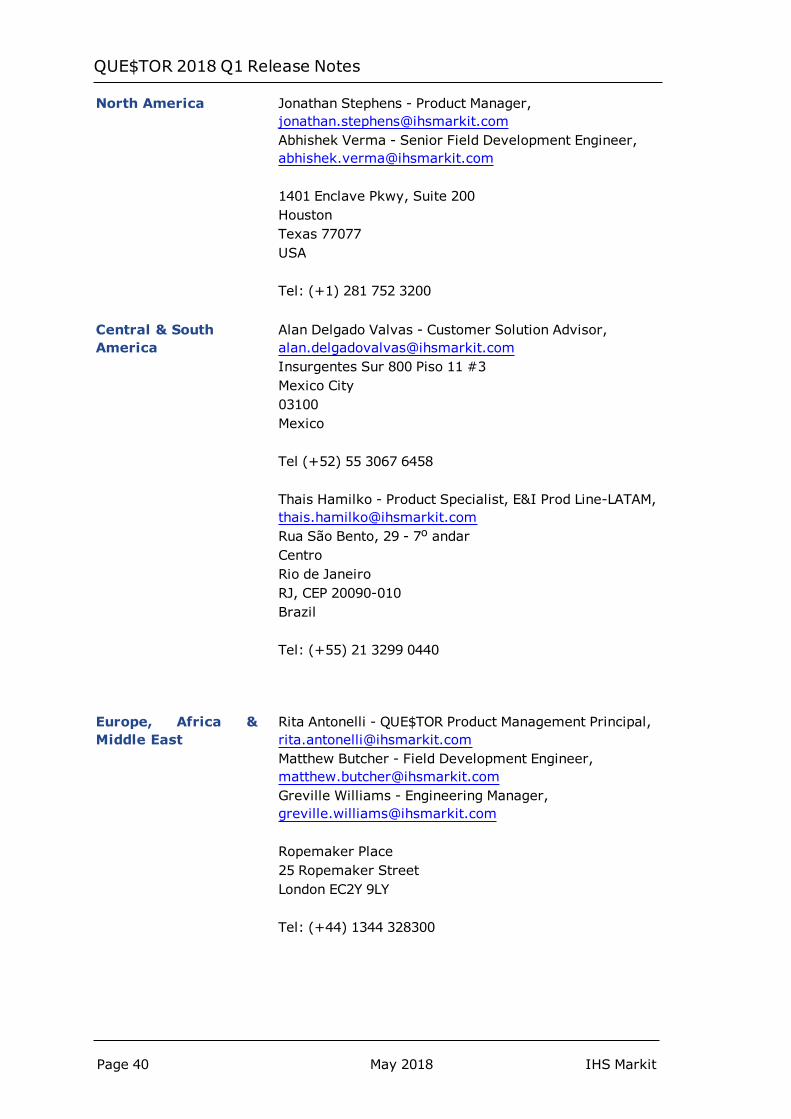
North America Jonathan Stephens - Product Manager,[email protected] Verma - Senior Field Development Engineer,[email protected]
1401 Enclave Pkwy, Suite 200HoustonTexas 77077USA
Tel: (+1) 281 752 3200
Central & SouthAmerica
Alan Delgado Valvas - Customer Solution Advisor,[email protected] Sur 800 Piso 11 #3Mexico City03100Mexico
Tel (+52) 55 3067 6458
Thais Hamilko - Product Specialist, E&I Prod Line-LATAM,[email protected] São Bento, 29 - 7o andarCentroRio de JaneiroRJ, CEP 20090-010Brazil
Tel: (+55) 21 3299 0440
Europe, Africa &Middle East
Rita Antonelli - QUE$TOR Product Management Principal,[email protected] Butcher - Field Development Engineer,[email protected] Williams - Engineering Manager,[email protected]
Ropemaker Place25 Ropemaker StreetLondon EC2Y 9LY
Tel: (+44) 1344 328300
Page 40 May 2018 IHS Markit
QUE$TOR 2018 Q1 Release Notes
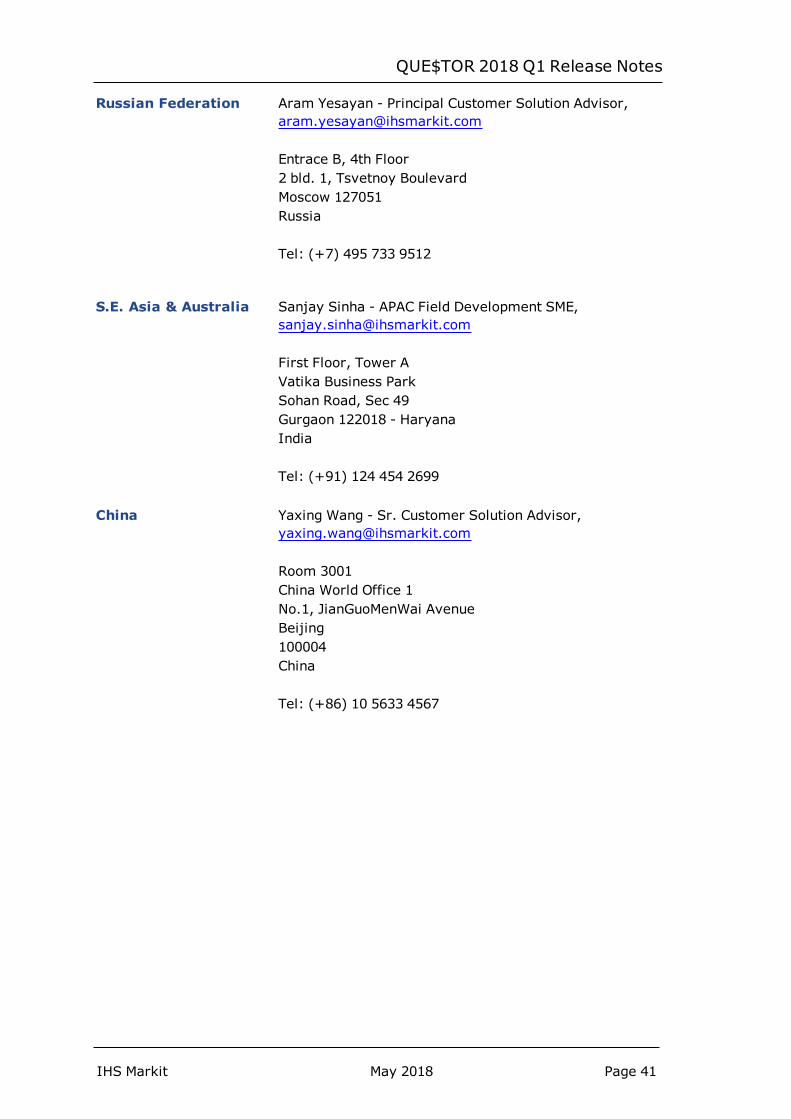
Russian Federation Aram Yesayan - Principal Customer Solution Advisor,[email protected]
Entrace B, 4th Floor2 bld. 1, Tsvetnoy BoulevardMoscow 127051Russia
Tel: (+7) 495 733 9512
S.E. Asia & Australia Sanjay Sinha - APAC Field Development SME,[email protected]
First Floor, Tower AVatika Business ParkSohan Road, Sec 49Gurgaon 122018 - HaryanaIndia
Tel: (+91) 124 454 2699
China Yaxing Wang - Sr. Customer Solution Advisor,[email protected]
Room 3001China World Office 1No.1, JianGuoMenWai AvenueBeijing100004China
Tel: (+86) 10 5633 4567
IHS Markit May 2018 Page 41
QUE$TOR 2018 Q1 Release Notes
CopyrightCopyright© 2018, IHS Markit Inc. and its affiliated and subsidiarycompanies, ALL RIGHTS RESERVED.
Windows® is a registered trademark of Microsoft Corporation.
All other trademarks and service marks, including without limitationQUE$TOR® belong to IHS Markit Inc. and its affiliated and subsidiarycompanies, all rights reserved.
This product, including software, data and documentation, is licensed tothe authorized user for its internal business purposes only and no partthereof may be disclosed, disseminated, sold, licensed, copied,reproduced, translated, transmitted or transferred to any third party.All rights reserved.
IHS Markit Inc.15 Inverness Way EastEnglewood, Colorado 80112
Page 42 May 2018 IHS Markit
QUE$TOR 2018 Q1 Release Notes