Embed Size (px)
Citation preview

University of Nevada, RenoDivision of Minerals
Nevada Commission on Mineral Resources
ALL FOR OUR COUNTRY
N E VA D A
THE
GR
EAT SEA L O F TH E ST A
TE
OF
N E V A D A B U R E A U O F M I N E S A N D G E O L O G Y
NEVADA MINERAL AND ENERGY RESOURCEEXPLORATION SURVEY
2015/2016R E L E A S E D M A R C H 2 0 1 7
M I C H A E L W . R E S S E L A N D D A V I D A . D A V I S
1
NEVADA BUREAU OF MINES AND GEOLOGY NEVADA MINERAL AND ENERGY RESOURCE EXPLORATION SURVEY 2015/2016 Michael W. Ressel David A. Davis Released: March 2017

2
Nevada Mineral and Energy Resource Exploration Survey 2015/2016
Michael W. Ressel and David A. Davis Nevada Bureau of Mines and Geology
University of Nevada, Reno
EXECUTIVE SUMMARY
The Nevada Bureau of Mines and Geology (NBMG) carried out an online survey of companies exploring for new metal, industrial mineral, and geothermal resources in Nevada. The Nevada Commission on Mineral Resources and the Nevada Division of Minerals commissioned and provided partial support for the survey. The impact of mineral and energy production from existing resources on the Nevada economy is well known. However, the impact of exploration activities, which focus on discovering new resources, is poorly understood due to limited data. Exploration activities are burdened with high risk as substantial investments are not guaranteed to result in mineable resources. Indeed, only rarely do exploration programs result in successful resource extraction, and then only after many years of capital investment and development activities. Despite this, exploration success is imperative for the continued well-being and sustainability of natural resource industries in Nevada.
A goal of this survey was to gather data to better assess the impact of exploration on Nevada’s economy. The survey’s focus was to collect data on company expenditures in Nevada and the number of employees involved in exploration in 2015 and 2016. Expenditures were subdivided by various categories and participants were asked to rate the relative importance of external factors on their exploration programs. The survey requested participation from 296 companies presumed to explore for mineral and geothermal resources in the state. Of these, responses from 86 companies were obtained, another 23 responded that they no longer explored in Nevada, and 54 non-responding companies were researched using public domain sources for their 2015 and 2016 Nevada expenditures.
The results verify that Nevada exploration activities were substantially curtailed as a result of the continued global decline in commodity prices since a peak activity during 2011–2012, when the last survey was undertaken. Major findings include the following:
• A minimum of $324.8 million went toward exploration in the Silver State in 2016. This is down by 6.4% from 2015’s
$347.5 million and down more than half from 2011, when exploration spending reached $674.7 million. Exploration spending in Nevada over the last five years mimics global trends.
• About 85% of reported expenditures in 2016 went toward precious metals exploration. The remainder was divided among lithium (6%), geothermal (5%), base metals (3%), and industrial minerals excepting lithium.
• Despite the severe downturn in the commodities sector, an encouraging 51% of Nevada exploration companies forecast they plan to spend more in 2017 on exploration and 37% expect to spend about the same.
• Surveyed companies directly employed 808 people in 2016, up 8% from the 746 employed in 2015 but substantially down from the 1,040 employees reported for 2011.
• Categorized expenditures for 2016 based on estimates supplied by 86 respondents are as follows:
On a cumulative cash basis, respondents indicated that 61% of their 2016 expenditures went toward resource expansions and 39% toward grassroots exploration.
On a similar cash basis, respondents indicated that about 63% was spent on actual exploration including drilling, 11% on land, 8% on permitting costs, 12.0% on corporate costs, and 6% on other expenses.
• Respondents cited most the following positive factors that support their exploration efforts in Nevada: favorable geology, the potential for new discovery, and the ability to access public lands.
• Negative factors among respondents include the time and cost for permitting, threats to withdraw or limit access to public lands—including the proposed sage grouse and military withdrawals—and the high cost of maintaining mining claims.

3
INTRODUCTION
Late in 2016, the Nevada Bureau of Mines and Geology (NBMG) conducted the 19th Nevada Exploration Survey of mining and exploration companies engaged in minerals and geothermal exploration projects and/or holding mining claims or leases in Nevada during 2015 and 2016. As in previous years, the purpose of this survey was to assess the current and projected levels of exploration activity and to determine factors influencing these levels. The rationale for conducting this survey is to provide information to elected officials, government agencies, private companies, and citizens in general, so that they better understand the impact of exploration on the Nevada economy and the factors that influence exploration. The last NBMG-administered survey used data from 2011 (Muntean et al., 2013), and prior to this, surveys were conducted by the Nevada Division of Minerals (NDOM). Partial support for this survey was provided by the Nevada Commission on Mineral Resources. SURVEY METHODOLOGY
The 2016 exploration survey was administered online; it is included here as Appendix A and is referenced online at https://goo.gl/forms/pQ2eV4WE6A3V7mcH2. Information requested included 1) company exploration expenditures in Nevada for 2015 and 2016 (for example, total dollars spent and spending categorized using common industry metrics), 2) the number of people companies directly employed during this two-year period, 3) the type of exploration being conducted, either grass roots or resource expansions, and 4) the relative impacts, both positive and negative, of several factors that influence exploration in Nevada—including geology, discovery potential, commodity prices, accessibility to public lands, the time and cost of permitting, and uncertainty over U.S. mining laws.
NBMG e-mailed requests to participate in the 2016 survey to 296 companies from a compiled list of 318 companies (table 1) that were considered active or recently active in exploration in the Silver State. Of the 296 e-mails, 242 were addressed to individuals, and the remainder were sent to general e-mail accounts for the respective corporations. Two additional e-mail invitations were sent subsequent to the first, and more than 95% of the e-mails were transmitted. From approximately 242 e-mail addresses considered most reliable, 86 online surveys were received over the seven weeks that the survey was conducted, and another 23 responded via e-mail or phone call that exploration had not been conducted in Nevada during 2015 and 2016. To more accurately assess exploration expenditures in Nevada during 2015 and 2016, research on 54 non-reporting companies was conducted using information in corporate financial filings. Thus, information on Nevada expenditures was obtained for 140 companies, excluding the 23 companies that reported no expenditures. This combined expenditure information was used in subsequent analysis. The response rate for the survey among reliable contacts is 45%, and the combined survey with researched companies includes data for about 67% from the pool of reliable corporate contacts.
The response rate between this survey and the survey conducted in 2012 (Muntean et al., 2013) is similar, although the 2012 survey contained more compiled companies (342 versus 318 in 2016), survey respondents (113 versus 86), ‘no exploration’ responses (52 versus 23), and researched companies (72 versus 54).The lower number of companies represented in the 2016 survey reflects, in part, more robust industry economic conditions in 2011 than in 2016.
Table 1. Summary of data acquisition
Activity Dates Compiled a list of 318 companies operating or
recently operating in Nevada September–November, 2016
Sent e-mails to 296 companies December 2016–January 2017 Received online responses from 86 companies December 2016–January 2017 Received additional “no” responses from 23 companies
December 2016–January 2017
Researched expenditures in public domain for 54 non-reporting companies
January 2017
Assessed expenditures for a total of 140 companies January–February 2017
SURVEY COMPARISONS: 2011, 2015, and 2016
Major differences in expenditures and employment are recorded by the present 2015/2016 survey versus the 2011 survey (Muntean et al., 2013). These differences are illustrated in figures 1 through 4. Exploration expenditures in
4
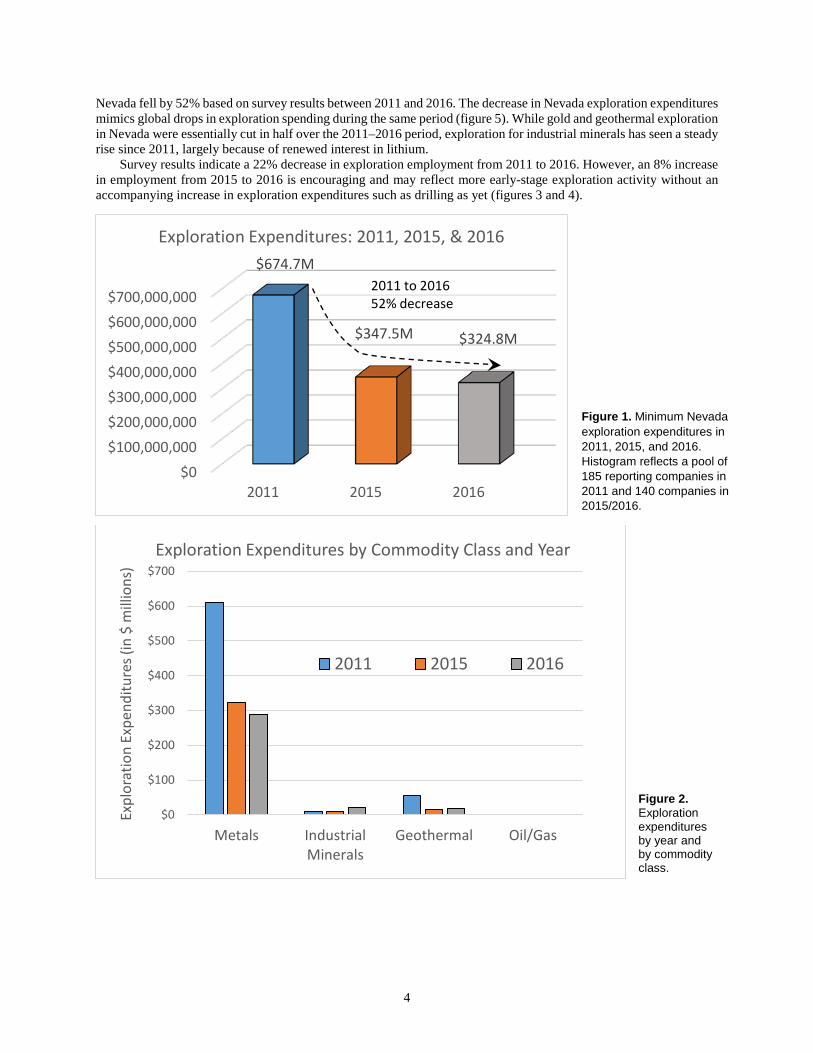
Nevada fell by 52% based on survey results between 2011 and 2016. The decrease in Nevada exploration expenditures mimics global drops in exploration spending during the same period (figure 5). While gold and geothermal exploration in Nevada were essentially cut in half over the 2011–2016 period, exploration for industrial minerals has seen a steady rise since 2011, largely because of renewed interest in lithium.
Survey results indicate a 22% decrease in exploration employment from 2011 to 2016. However, an 8% increase in employment from 2015 to 2016 is encouraging and may reflect more early-stage exploration activity without an accompanying increase in exploration expenditures such as drilling as yet (figures 3 and 4).
$0$100,000,000$200,000,000$300,000,000$400,000,000$500,000,000$600,000,000$700,000,000
2011 2015 2016
$674.7M
$347.5M $324.8M
Exploration Expenditures: 2011, 2015, & 2016
2011 to 201652% decrease
$0
$100
$200
$300
$400
$500
$600
$700
Metals IndustrialMinerals
Geothermal Oil/Gas
Expl
orat
ion
Expe
nditu
res (
in $
mill
ions
)
Exploration Expenditures by Commodity Class and Year
2011 2015 2016
Figure 1. Minimum Nevada exploration expenditures in 2011, 2015, and 2016. Histogram reflects a pool of 185 reporting companies in 2011 and 140 companies in 2015/2016.
Figure 2. Exploration expenditures by year and by commodity class.

5
Figure 3. Surveyed number of workers employed in Nevada exploration in 2011, 2015, and 2016. Number is for direct employment only and does not include third-party contract employees.
Figure 4. Histogram of companies surveyed in 2011, 2015, and 2016 versus number of employees. Employment is for direct hires only and does not include third-party contract employees.
1,040
746808
0
200
400
600
800
1,000
1,200
2011 2015 2016
Num
ber o
f Em
ploy
ees
Year
Surveyed Number of Employees in Exploration
42
2623
5 4
54
18
83 5
42
26
9
3 4
0
10
20
30
40
50
60
<5 5 to <10 10 to <20 20 to <50 ≥50
Num
ber o
f Com
pani
es
Employees
Number of Employees Hired vs. Number of Companies - 2011, 2015, & 2016
2011 2015 2016

6
Figure 5. A. Graph depicts total global expenditures in nonferrous metals exploration between 1993 and 2015 in U.S. dollars. B. Graph of exploration expenditures for nonferrous commodities by major regions from 2005 through 2015. Data from SNL Metals and Mining (2016; 2017).
7
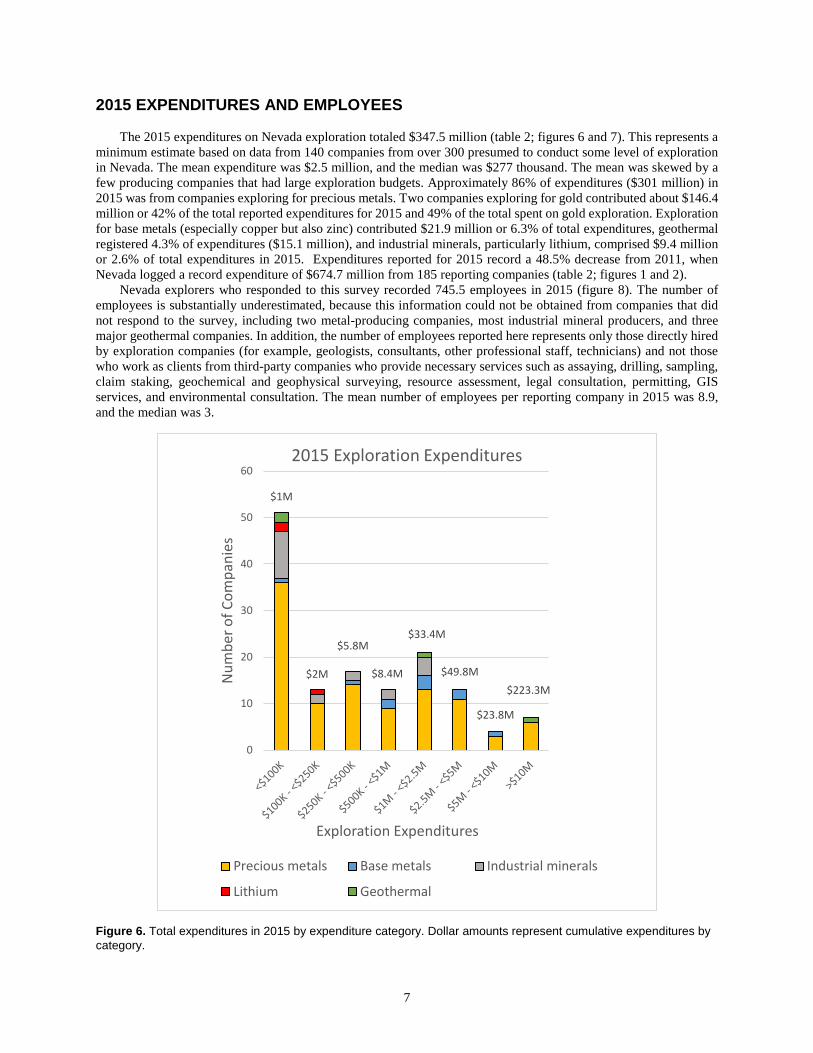
2015 EXPENDITURES AND EMPLOYEES
The 2015 expenditures on Nevada exploration totaled $347.5 million (table 2; figures 6 and 7). This represents a minimum estimate based on data from 140 companies from over 300 presumed to conduct some level of exploration in Nevada. The mean expenditure was $2.5 million, and the median was $277 thousand. The mean was skewed by a few producing companies that had large exploration budgets. Approximately 86% of expenditures ($301 million) in 2015 was from companies exploring for precious metals. Two companies exploring for gold contributed about $146.4 million or 42% of the total reported expenditures for 2015 and 49% of the total spent on gold exploration. Exploration for base metals (especially copper but also zinc) contributed $21.9 million or 6.3% of total expenditures, geothermal registered 4.3% of expenditures ($15.1 million), and industrial minerals, particularly lithium, comprised $9.4 million or 2.6% of total expenditures in 2015. Expenditures reported for 2015 record a 48.5% decrease from 2011, when Nevada logged a record expenditure of $674.7 million from 185 reporting companies (table 2; figures 1 and 2).
Nevada explorers who responded to this survey recorded 745.5 employees in 2015 (figure 8). The number of employees is substantially underestimated, because this information could not be obtained from companies that did not respond to the survey, including two metal-producing companies, most industrial mineral producers, and three major geothermal companies. In addition, the number of employees reported here represents only those directly hired by exploration companies (for example, geologists, consultants, other professional staff, technicians) and not those who work as clients from third-party companies who provide necessary services such as assaying, drilling, sampling, claim staking, geochemical and geophysical surveying, resource assessment, legal consultation, permitting, GIS services, and environmental consultation. The mean number of employees per reporting company in 2015 was 8.9, and the median was 3.
Figure 6. Total expenditures in 2015 by expenditure category. Dollar amounts represent cumulative expenditures by category.
$1M
$2M
$5.8M
$8.4M
$33.4M
$49.8M
$23.8M
$223.3M
0
10
20
30
40
50
60
Num
ber o
f Com
pani
es
Exploration Expenditures
2015 Exploration Expenditures
Precious metals Base metals Industrial minerals
Lithium Geothermal

8
Figure 7. Total reported exploration expenditures in 2015 by commodity type. Total pool of companies represented: 140.
Figure 8. Employees in 2015 based on 86 survey respondents. Includes part- and full-time employment but not third-party contract employees. Total reported employment in 2015 was 745.5.
Base Metals, $21.9M
6%Geothermal
$15.1M4%
Gold-Silver$301M
87%
Lithium$9.2M
3%
Industrial Minerals$0.23M
2015 MINERALS EXPENDITURES
0
10
20
30
40
50
60
<5 5 to <10 10 to <20 20 to < 50 ≥50
Num
ber o
f Com
pani
es
Number of Employees
2015 Exploration Employment
Gold-silver Base metals Lithium Industrial minerals Geothermal

9
2016 EXPENDITURES AND EMPLOYEES
The continued downturn in nearly all commodity prices continued to adversely affect 2016 minerals and geothermal exploration in Nevada. Companies sampled reported total expenditures of $324.8 million in 2016 (figures 9 and 10), down 6.5% from 2015 and down 52% from a peak exploration expenditure of $674.7 million recorded in 2011 for the state. The decreases in exploration expenditures parallel the major decreases experienced worldwide (table 2; figure 5) as reported by SNL Metals and Mining (2017) in their annual summary of global exploration activity. Nevada’s reported 2016 expenditure, which is a minimum estimate, represents 62% of the total U.S. non-energy exploration expenditures in 2016 as reported by SNL Metals and Mining (2017).
$0.9M
$2.9M
$4.6M $7.7M
$36.4M
$35.7M$50.2M
$186.4M
0
5
10
15
20
25
30
35
Num
ber o
f Com
pani
es
Exploration Expenditures
2016 Exploration Expenditures
Precious metals Base metals Industrial minerals Lithium Geothermal
Base Metals$8.9M
3%Geothermal
$16.6M5%
Gold-Silver$278M
86%
Lithium$20.9M
6%
Industrial Minerals
$0.2M
2016 MINERALS EXPENDITURES
Figure 9. Total expenditures in 2016 by expenditure category. Dollar amounts represent cumulative expenditures by category.
Figure 10. Total reported exploration expenditures in 2016 by commodity type. Total pool of companies represented: 125.

10
Table 2. Summary of exploration expenditures and employees 2011, 2015, and 2016
2015 Nevada Reported Expenditures: $347.5 million (n = 140) 2015 Nevada Reported Employees: 745.5 2016 Nevada Reported Expenditures: $324.8 million (n = 125) 2016 U.S. Reported Expenditures: $499.9 million* 2016 Nevada Reported Employees: 807.5
BY COMPARISON: 2011 Nevada Expenditures: $674.7 million (n = 185)
Decrease in Nevada Expenditures: 2011 to 2016: ~54% Global decrease (2012–2016)*: 58%
*SNL Metals and Mining World Exploration Trends, 2016 and 2017
Gold exploration continued to command most of the reported expenditures in Nevada in 2016 (figure 10), capturing about 86% ($278.2 million) of $324.8 million total. Two primarily gold-producing companies contributed about $122 million or, 38% of total expenditures, and about 44% of expenditures from gold explorers. As the price of lithium began to rise in 2016, a boom in lithium exploration resulted in 2.3 times more expenditure in 2016 than 2015. Lithium exploration contributed $20.9 million in expenditures or 6.4% of the total recorded expenditures for 2016. Compared to 2015, expenditures for base metals in 2016 fell significantly to $8.9 million or 2.7% of total 2016 expenditures, reflecting overall poor copper prices during the first three quarters of 2016.
Nevada explorers who responded to this survey recorded 807.5 employees in 2016 (figure 11), a surprising and significant 7.7% increase from 2015 despite lower overall expenditures. Still, the number of employees is substantially underestimated, because this information could not be obtained from companies that did not respond to the survey, including two metal-producers, most industrial minerals producers, and three producing geothermal companies. In addition, the number of employees reported here represents only those directly hired by exploration companies (e.g., geologists, consultants, other professional staff, technicians) and not subcontractors who provide necessary services such as assaying, drilling, sampling, claim staking, geochemical and geophysical surveying, resource assessment, legal consultation, permitting, GIS services, and environmental consultation. The mean number of employees per company in 2016 was 9.6 and the median, 5. Possibly, the year-over-year increase in exploration labor reflects growing investor confidence, notably in the precious metals, base metals, especially copper and zinc, and lithium markets, although this has yet to translate to increased overall expenditures. The price charts of gold, copper, zinc, and lithium all show positive trends since early 2015 (figures 12A through 12D).
0
5
10
15
20
25
30
35
40
45
<5 5 to <10 10 to <20 20 to <50 ≥50
Num
ber o
f Com
pani
es
Number of Employees
2016 Exploration Employment
Gold-silver Base metals Lithium Industrial minerals Geothermal
Figure 11. Employees in 2016 based on 85 survey respondents. Includes part- and full-time employment but not third-party contract employees. Total reported employment in 2016 was 807.5.

11
Figures 12A–12D. Price charts for A) gold from 2012 through 2016, B) copper from 2012 through 2016, C) zinc from 2012 through 2016, and D) lithium from 2015 through mid-2016. Data for 12A-12C from Infomine, 2017; data from 12D from Thomson Reuters, 2016.

12
2017 OUTLOOK
Because this survey was conducted late in 2016, no attempt was made to collect specific data on companies’ forecast budgets for 2017. However, companies were asked whether or not they expected to spend more, less, or about the same as 2016 (figure 13). Of 80 respondents to this question, a surprising 51% indicated more spending in 2017, including 14% who responded that they will be spending much more than in 2016. In addition, 37% of respondents indicated that their exploration spending would be about the same as 2016. Thus, 88% of respondents expected to spend either about the same or more for 2017 than in 2016. The increase in exploration hiring in 2016 coupled with expectations of higher 2017 spending are viewed as positive factors that may be indicative of economic recovery.
EXPENDITURES BY CATEGORY
For the survey, companies were requested to categorize their total 2016 exploration expenditures among the following categories: 1) actual exploration—including drilling, geology, geochemistry, and geophysics, 2) land costs, including claim staking, maintenance fees, and lease payments, 3) permitting and compliance—including environmental studies, bonding, and reclamation, 4) corporate overhead costs—including overhead, legal expenses, and taxes, and (5) other costs. Seventy-two companies responded. The averages of the percentages that the reporting companies provided were 42.4% toward actual exploration costs, 32.0% to land costs, 7.6% to permitting and compliance, 10.7% to corporate overhead costs, and 2.2% to other costs.
However, when the individual percentages were monetized based on the actual exploration expenditures of an individual company, and cumulative expenditures by category were then calculated, the averages are 63.3% spent on actual exploration, 10.7% on land, 8.1% on permitting costs, 12.1% on corporate costs, and 5.8% on other costs. The large increase in the percentage of total expenditures on actual exploration and the large decrease in the percentage of total expenditures on land reflect the strong influence of companies that had relatively large expenditures and tended to spend more on actual exploration than land. For example, fourteen companies that spent $5 million or more on exploration in 2016 accounted for $236.6 million of expenditures, which is 73% of the total 2016 expenditures. These same companies spent an average of 62% on a cash basis on actual exploration.
About the Same37%
Less7%
Much Less 5%
More37%
Much More14%
Will your company spend more, less, or about the same in 2017 compared to 2016?
Figure 13. Chart of exploration outlook for 2017. Survey response is provided to the question, “Will your company spend more, less, or about the same in 2017 compared to 2016?” More than half of respondents indicated their companies will likely spend more in 2017, and an overwhelming majority of respondents (88%) indicated they will spend either the same or more in 2017 than in 2016.

13
EXPANSION VERSUS GRASSROOTS EXPLORATION
When asked to estimate the percentage of 2016 expenditures on exploration aimed at expanding existing mines or resources versus grassroots exploration away from known mines and other known resources, 79 companies responded. The average percentages of responses were 31% for near-mine or in-mine expansion and 69% on grassroots exploration. However, when percentages given by an individual company are multiplied by the 2016 expenditures of a given company, and expenditures for all companies cumulatively summed according to either grassroots or expansion, the percentages are reversed, with expansions responsible for 61% of total expenditures and grassroots garnering about 39%. Thus, as is widely recognized in the industry, larger companies with production and larger exploration budgets tend to spend a larger percentage of funds on expansions of existing mines and other resources, whereas those companies lacking production tend to have smaller expenditures derived from sources other than cash flow from operations and consequently, spend a majority percentage on grassroots exploration. About $85.3 million (26.3% of the total 2016 expenditures) was spent by companies whose budgets consisted of 50% or more grassroots exploration. FACTORS THAT IMPACT EXPLORATION
The survey asked companies to rate on a scale from 1 to 5 how seven factors impact their exploration, a “1” representing low impact and a “5”, high impact (figure 14). The averages for the 81 companies that responded were 4.7 for favorable geology in Nevada, 4.5 for the potential for new discoveries in Nevada, 4.3 for access to public lands in Nevada, 3.8 for time and cost required for permitting, 3.6 for current or projected commodity prices, 3.4 for mining claim or lease fees for public lands, and 3.1 for uncertainty over possible reforms to U.S. mining laws.
High ratings for Nevada’s geology and the potential for new discoveries obviously contribute greatly toward companies choosing to explore in the Silver State. Other ratings are more ambiguous in terms of their positive or negative perception among explorers. In particular, access to public land and reform of the U.S. Mining Law are more difficult issues to gauge, as only proposed changes to these are viewed by explorers negatively, whereas most explorers regard public lands and the U.S. Mining Law as important factors leading to Nevada’s top ranking among places to explore in the U.S. To help clarify, respondents were further questioned to identify those factors that negatively impacted their ability to explore in Nevada. Three factors identified as having a pronounced negative impact on exploration include: the time and cost of permitting exploration projects (39 responses), access to public lands and proposed land withdrawals due to sage grouse habitat and military needs (18 responses), and the high cost of mining claim fees (10 responses). Less cited negative impacts include uncertainty over the mining law (5 responses), restrictive environmental regulations (5 responses), and one response for each of the following: the possibility to overstake, inconsistent permitting, current poor foreign currency exchange rates, high levels of competition, and uncertainty over water rights and regulations in lithium brine extraction.
Figure 14. Impact of factors that impact exploration for minerals and energy in Nevada. A “5” score represents the highest impact, “1” represents lowest impact. Number of respondents: 82.
3.2
3.4
3.6
3.8
4.3
4.5
4.7
0 1 2 3 4 5
Uncertainty over U.S. mining law reformMining claim or lease fees
Commodity pricesTime and cost of permitting
Access to public landsDiscovery potentialPermissive geology
Average Survey Score
Factors Impacting Nevada Exploration in 2016
Positive factor Negative factorPositive & negative factors

14
CONCLUSIONS
Exploration is the first step and an integral part of natural resources development and extraction but is poorly quantified in terms of its overall economic impact. Exploration represents the initial high-risk investment used to locate, define, and quantify new mineral and energy resources. Most exploration investment is economically unsuccessful for a number of reasons that may include insufficient concentrations or volumes of the commodity sought, fluctuating market conditions, complex processing, difficult ground conditions, regulatory and permitting hurdles, and risk-funding, among many other potential constraints. Through the exploration process, new resources replace those resources depleted through extraction.
Nevada commonly leads the U.S. in production of non-fuel mineral commodities. In 2015, Nevada produced more than $6.9 billion worth of minerals, which constituted 8.9% of the value of all mineral products produced in the U.S. (Muntean et al., 2017; U.S. Geological Survey, 2016 Mineral Commodity Summaries, 2016; Perry and Visher, 2016). About 90% of Nevada’s 2015 mineral wealth came from gold production. Other important mineral commodities produced in Nevada include silver, copper, barite, diatomite, gypsum, limestone, magnesite, and lithium.
This 2016 Nevada exploration survey was designed to help quantify the economic impacts associated with mineral and energy exploration in Nevada. Despite the major downturn in commodity prices since 2012, major exploration investment in Nevada continues, although lower than in previous years. Sustained exploration during difficult times reflects favorably on Nevada’s prospective geology and its business climate, as well as the access afforded by its vast federally managed public lands. These factors are important in attracting companies to explore in Nevada. ACKNOWLEDGMENTS
The authors and NBMG acknowledge the support of the Nevada Commission on Mineral Resources and the Nevada Division of Minerals for providing partial support for this survey. The authors also acknowledge Russ Fields of the Mackay School of Earth and Environmental Sciences at the University of Nevada for encouragement in conducting this survey. We thank Mike Visher and Rich Perry of the Nevada Division of Minerals for their assistance and support, David Shaddrick (Director of the Nevada Mineral Exploration Coalition) for his early input to the design of the survey and for helping in compiling a list of exploration companies. Jim Faulds and John Muntean are acknowledged for reviews of drafts.
REFERENCES
Muntean, J.L., Garside, L.J., and Davis, D.A., 2013, Nevada mineral and energy resource exploration survey 2011: Nevada Bureau of Mines and Geology Exploration Survey 2011, 22 p. http://pubs.nbmg.unr.edu/NV-exploration-survey-2011-p/es2011.htm
Muntean, J.L., Davis, D.A., and Ayling, B., 2017, The Nevada mineral industry 2015: Nevada Bureau of Mines and Geology Special Publication MI-2015, 190 p. http://pubs.nbmg.unr.edu/The-NV-mineral-industry-2015-p/mi2015.htm
Perry, R., and Visher, M., 2016, Major mines of Nevada 2015—mineral industries in Nevada’s economy: Nevada Bureau of Mines and Geology Special Publication P-27, 28 p., http://pubs.nbmg.unr.edu/Major-mines-of-Nevada-2015-p/p027.htm
SNL Metals and Mining, 2016, World exploration trends 2015—a special report from SNL Metals & Mining for the PDAC International Convention: SNL Metals and Mining, published for the Prospectors and Developers Association of Canada International Convention, Toronto, Ontario, Canada, March 2016, 12 p. http://go.snl.com/rs/spglobal/images/World-Exploration-Trends-WET-Report-2015-English-USletter.pdf
SNL Metals and Mining, 2017, World exploration trends 2016—a special report from SNL Metals & Mining for the PDAC International Convention: SNL Metals and Mining, published for the Prospectors and Developers Association of Canada International Convention, Toronto, Ontario, Canada, March 2017.
U.S. Geological Survey, 2016, Mineral commodity summaries 2016: U.S. Geological Survey, 202 p. https://minerals.usgs.gov/minerals/pubs/mcs/2016/mcs2016.pdf.
Suggested Citation: Ressel, M.R., and Davis, D.A., 2017, Nevada mineral and energy resource exploration survey 2015/2016: Nevada
Bureau of Mines and Geology Exploration Survey 2016, 16 p.

15
APPENDIX A
Nevada Division of Minerals Nevada Bureau of Mines and Geology
2016 Minerals Exploration Survey
Company Name: __________________________________________________
Contact Person: ___________________________________________________
Email: ___________________________ Phone: ____________________
The first two questions are critical. Please answer the rest if you can.
1. What were your company’s exploration expenditures in Nevada in 2015 and in 2016? 2015 exploration expenditures in Nevada: $____________
2016 exploration expenditures in Nevada: $____________
2. How many people did your company employ in exploration in Nevada in 2015 and in 2016? Include geologists and support staff, both company employees and individual contractors and consultants. 2015 number of employees involved in Nevada exploration: _____________
2016 number of employees involved in Nevada exploration: _____________
3. If you can, please ESTIMATE the percentage of your company’s total Nevada expenditures in 2016 that went toward the following categories, including salaries and benefits. Actual exploration (drilling, geology, geochemistry, geophysics, etc.): _____%
Land holding costs (claims staking and maintenance, lease payments, etc.): _____%
Permitting and compliance (environmental studies, bonding, reclamation, etc.): _____%
Corporate costs (overhead, legal, taxes, etc.): _____%
Other (please specify_________________________________________): _____%
4. Please ESTIMATE the percentage of your Nevada 2016 exploration expenditures dedicated to expansion around existing operations and to grassroots efforts. Expansions: __________% Grassroots exploration: __________%

16
5. Pertaining to Nevada, please rate how the following factors impact your exploration activity, with 1 being insignificant and 5 being very significant.
Favorable geology: 1 2 3 4 5
Potential for new discoveries: 1 2 3 4 5
Commodity prices: 1 2 3 4 5
Access to public land in Nevada: 1 2 3 4 5
Claim fees: 1 2 3 4 5
Time and costs required to permit: 1 2 3 4 5
Uncertainty over U.S. Mining Law reform: 1 2 3 4 5
Other (please specify): _________________ 1 2 3 4 5
6. Which, if any, of the factors in item 5 above negatively impact Nevada’s attractiveness for exploration relative to other regions in which your company explores?
7. Compared to 2016, do you expect your company to spend more or less in 2017 on Nevada exploration? Much more More About the same Less Much Less
Thank you. All individual responses will be held confidential.
Questions or comments? Please call David Davis at (775) 682-8767; e-mail: [email protected], or Mike Ressel at (775) 682-7844, e-mail: [email protected]
Please return this by e-mail or mail to:
NBMG - Great Basin Science Sample and Records Library 2175 Raggio Parkway, Reno, NV 89512 phone (775) 682-8767 c/o David Davis E-mail: [email protected]