Embed Size (px)
Citation preview

1
A CFA Institute Productionwww.cfainstitute.orgSlides provided by speaker
Relative Valuation: Improving the Analysis and Use of Multiples Aswath DamodaranProfessor of FinanceLeonard N. Stern School of BusinessNew York University
18 November 2010

2
A CFA Institute Productionwww.cfainstitute.orgSlides provided by speaker
The Essence of Relative Valuation?
• In relative valuation, the value of an asset is compared to the values assessed by the market for similar or comparable assets.
• To do relative valuation then, we need to:• Identify comparable assets and obtain market values for these assets.• Convert these market values into standardized values, because the absolute prices
cannot be compared. This process of standardizing creates price multiples.• Compare the standardized value or multiple for the asset being analyzed to the
standardized values for comparable assets, controlling for any differences between the firms that might affect the multiple, to judge whether the asset is under- or overvalued.

3
A CFA Institute Productionwww.cfainstitute.orgSlides provided by speaker
Relative Valuation Is Pervasive . . .
• Most asset valuations are relative.• Most equity valuations on Wall Street are relative valuations.
• Almost 85% of equity research reports are based upon a multiple and comparables.• More than 50% of all acquisition valuations are based upon multiples.• Rules of thumb based on multiples are not only common but are often the basis for final
valuation judgments.• Though there are more discounted cash flow valuations in consulting and corporate finance,
they are often relative valuations masquerading as discounted cash flow valuations.• The objective in many discounted cash flow valuations is to back into a number that has
been obtained by using a multiple.• The terminal value in a significant number of discounted cash flow valuations is estimated
using a multiple.
4
A CFA Institute Productionwww.cfainstitute.orgSlides provided by speaker
The Reasons for the Allure . . .
“If you think I’m crazy, you should see the guy who lives across the hall.”— Jerry Seinfeld talking about Kramer in an episode of Seinfeld
“ A little inaccuracy sometimes saves tons of explanation.”— H.H. Munro
“ If you are going to screw up, make sure that you have lots of company.”— Ex-portfolio manager

5
A CFA Institute Productionwww.cfainstitute.orgSlides provided by speaker
The Market Imperative . . .
• Relative valuation is much more likely to reflect market perceptions and moods than discounted cash flow valuation. This can be an advantage when it is important that the price reflect these perceptions, as is the case when:• the objective is to sell a security at that price today (as in the case of an IPO)• investing on “momentum” based strategies
• With relative valuation, there will always be a significant proportion of securities that are undervalued and overvalued.
• Because portfolio managers are judged based upon how they perform on a relative basis (to the market and other money managers), relative valuation is more tailored to their needs.
• Relative valuation generally requires less information than discounted cash flow valuation (especially when multiples are used as screens).

6
A CFA Institute Productionwww.cfainstitute.orgSlides provided by speaker
So, You Believe Only in Intrinsic Value? Here’s Why You Should Still Care about Relative Value
• Even if you are a true believer in discounted cash flow valuation, presenting your findings on a relative valuation basis will make it more likely that your findings/recommendations will reach a receptive audience.
• In some cases, relative valuation can help find weak spots in discounted cash flow valuations and fix them.
• The problem with multiples is not in their use, but in their abuse. If we can find ways to frame multiples right, we should be able to use them better.

7
A CFA Institute Productionwww.cfainstitute.orgSlides provided by speaker
Multiples Are Just Standardized Estimates of Price . . .
• You can standardize either the equity value of an asset or the value of the asset itself, which goes in the numerator.
• You can standardize by dividing by the • Earnings of the asset
• Net income: Price/earnings ratio (PE) and variants (PEG and Relative PE)• Operating income and cash flow: EV/EBIT, EV/EBITDA
• Book value of the asset• Price/book value of equity (PBV)• Enterprise value/invested capital, firm value/book value of capital• Enterprise value/replacement cost (Tobin’s Q)
• Revenues generated by the asset• Price/sales per share (PS)• Enterprise value/sales
• Asset- or industry-specific variable (value/kwh, value/ton of steel . . .)

8
A CFA Institute Productionwww.cfainstitute.orgSlides provided by speaker
The Four Steps to Deconstructing Multiples
• Define the multiple• In use, the same multiple can be defined in different ways by different users. When comparing and
using multiples estimated by someone else, it is critical that we understand how the multiples have been estimated.
• Describe the multiple• Too many people who use a multiple have no idea what its cross sectional distribution is. If you do
not know what the cross sectional distribution of a multiple is, it is difficult to look at a number and pass judgment on whether it is too high or low.
• Analyze the multiple• It is critical that we understand the fundamentals that drive each multiple and the nature of the
relationship between the multiple and each variable.• Apply the multiple
• Defining the comparable universe and controlling for differences is far more difficult in practice than it is in theory.

9
A CFA Institute Productionwww.cfainstitute.orgSlides provided by speaker
Definitional Tests
• Is the multiple consistently defined?• Proposition 1: Both the value (the numerator) and the standardizing variable ( the
denominator) should be to the same claim holders in the firm. In other words, the value of equity should be divided by equity earnings or equity book value, and firm value should be divided by firm earnings or book value.
• Is the multiple uniformly estimated?• The variables used in defining the multiple should be estimated uniformly across assets in
the “comparable firm” list.• If earnings-based multiples are used, the accounting rules to measure earnings should be
applied consistently across assets. The same rule applies with book value-based multiples.

10
A CFA Institute Productionwww.cfainstitute.orgSlides provided by speaker
Example 1: Price Earnings RatioConsistency Test
P/E = Market price per share/Earnings per share (EPS)
• There are a number of variants on the basic P/E ratio in use. They are based upon how the price and the earnings are defined.
• Price:• Usually the current price (though some like to use average price over the last 6 months or year)
• EPS: • Time variants: EPS in most recent financial year (current), EPS in most recent four quarters
(trailing), EPS expected in next fiscal year or next four quarters (both called forward), or EPS in some future year
• Primary, diluted, or partially diluted• Before or after extraordinary items• Measured using different accounting rules (options expensed or not, pension fund income counted
or not . . .)

11
A CFA Institute Productionwww.cfainstitute.orgSlides provided by speaker
P/E Ratios: Google and Cisco — May 2009

12
A CFA Institute Productionwww.cfainstitute.orgSlides provided by speaker
P/E Ratio (Uniformity Test)
• Assume that you are comparing the P/E ratios of a dozen technology companies, with varying numbers of management options outstanding. Which measure of P/E ratio would you use in your comparison (to ensure uniformity)?
a) Price/Primary EPSb) Price/Diluted EPSc) Market capitalization/Net incomed) (Market capitalization + Value of options)/(Net income + Option expense)e) None of the above

13
A CFA Institute Productionwww.cfainstitute.orgSlides provided by speaker
Example 2: Enterprise Value/EBITDA Multiple Consistency Test
• The enterprise value to EBITDA multiple is obtained by netting cash out against debt to arrive at enterprise value and dividing by EBITDA.
• Why do we net out cash from firm value?• What happens if a firm has cross holdings that are categorized as:
• Minority interests?• Majority active interests?
on Depreciati and Taxes, Interest, before EarningsCash -Debt of ValueMarket +Equity of ValueMarket
EBITDAValue Enterprise
14
A CFA Institute Productionwww.cfainstitute.orgSlides provided by speaker
Example 3: Housing Value/Rental Income (Expense)
• This is a measure used to measure whether real estate values are reasonable are not.
Home price/Rental price = Market price of house/Annual rental income (if house were rented)
• The numerator reflects the market price of a house and the denominator the rent you would pay on an annual basis if you rented the same house. An alternative interpretation is that the numerator reflects what you would pay for the house today and the denominator the gross rental income you could generate from the house. According to its users, when this ratio becomes high (relative to historical benchmarks), housing prices are too high. When this ratio is low, real estate is cheap.
• Is this multiple consistently defined?
15
A CFA Institute Productionwww.cfainstitute.orgSlides provided by speaker
Descriptive Tests
• What is the average and standard deviation for this multiple across the universe (market)?• What is the median for this multiple?
• The median for this multiple is often a more reliable comparison point.• How large are the outliers to the distribution, and how do we deal with the outliers?
• Throwing out the outliers may seem like an obvious solution, but if the outliers all lie on one side of the distribution (they usually are large positive numbers), this can lead to a biased estimate.
• Are there cases where the multiple cannot be estimated? Will ignoring these cases lead to a biased estimate of the multiple?

16
A CFA Institute Productionwww.cfainstitute.orgSlides provided by speaker
The Distributional Characteristics of Multiples: P/E Ratios in January 2010

17
A CFA Institute Productionwww.cfainstitute.orgSlides provided by speaker
P/E in 2010: Deciphering the Distribution

18
A CFA Institute Productionwww.cfainstitute.orgSlides provided by speaker
Not Just US StocksP/E Ratios: United States, Europe, Japan, and
Emerging Markets
2009 2010US 9.8 14.9Europe 7.7 14.4Emerging Markets 7.5 17.3Japan 12.3 16.8
Median Current PE

19
A CFA Institute Productionwww.cfainstitute.orgSlides provided by speaker
Simplistic Rules Almost Always Break Down . . . Six Times EBITDA May Not Be Cheap . . .

20
A CFA Institute Productionwww.cfainstitute.orgSlides provided by speaker
Analytical Tests
• What are the fundamentals that determine and drive these multiples?• Proposition 2: Embedded in every multiple are all of the variables that drive every
discounted cash flow valuation—growth, risk, and cash flow patterns.• In fact, using a simple discounted cash flow model and basic algebra should yield the
fundamentals that drive a multiple.• How do changes in these fundamentals change the multiple?
• The relationship between a fundamental (such as growth) and a multiple (such as P/E) is seldom linear. For example, if firm A has twice the growth rate of firm B, it will generally not trade at twice its P/E ratio.
• Proposition 3: It is impossible to properly compare firms on a multiple if we do not know the nature of the relationship between fundamentals and the multiple.

21
A CFA Institute Productionwww.cfainstitute.orgSlides provided by speaker
A Simple Way to Identify the Fundamentals that Drive Multiples
Equity Multiple or Firm Multiple
Equity Multiple Firm Multiple
1. Start with an equity DCF model (a dividend or FCFEmodel)
2. Isolate the denominator of the multiple in the model3. Do the algebra to arrive at the equation for the multiple
1. Start with a firm DCF model (a FCFF model)
2. Isolate the denominator of the multiple in the model3. Do the algebra to arrive at the equation for the multiple

22
A CFA Institute Productionwww.cfainstitute.orgSlides provided by speaker
I. P/E Ratio: Understanding the Fundamentals — Stable
Growth Firm• To understand the fundamentals, start with a basic equity discounted cash flow model.
With the dividend discount model,
• Dividing both sides by the current earnings per share,
• Bottom line: For a stable growth, dividend paying firm, the P/E ratio is a function of three variables: its expected growth rate in EPS, its risk (as manifested in its cost of equity), and its payout ratio (which is a function of the ROE it generates on its investments).
n
n
0
0
-gequity ofCost
)g(1*RatioPayout =PEEPS
P
P0 DPS1
Cost of equitygn

23
A CFA Institute Productionwww.cfainstitute.orgSlides provided by speaker
Extending the Approach:P/E Ratio for a High Growth Firm
• The price-earnings ratio for a high growth firm can also be related to fundamentals. In the special case of the two-stage dividend discount model, this relationship can be made explicit fairly simply:
• For a firm that does not pay what it can afford to in dividends, substitute FCFE/Earnings for the payout ratio.
• Dividing both sides by the earnings per share:
P0 =EPS0 * Payout Ratio *(1+ g)* 1
(1+ g)n
(1+ r)n
r - g+
EPS0 * Payout Ration *(1+ g)n *(1+ gn )(r -gn )(1+ r)n
P0EPS0
=Payout Ratio * (1 + g) * 1 (1 + g)n
(1+ r)n
r - g+
Payout Ratio n *(1+ g)n * (1 + gn )(r - gn )(1+ r)n

24
A CFA Institute Productionwww.cfainstitute.orgSlides provided by speaker
A Simple Example
• Assume that you have been asked to estimate the P/E ratio for a firm that has the following characteristics:
Variable Phase High Growth Phase Stable GrowthExpected Growth Rate 25% 8%Payout Ratio 20% 50%Beta 1.00 1.00Number of years 5 years Forever after year 5• Risk-free rate = T.Bond rate = 6%• Required rate of return = 6% + 1(5.5%) = 11.5%
28.75 = (1.115) .08)-(.115
)(1.08*(1.25) * 0.5 +.25) - (.115
(1.115)(1.25)1 * (1.25) * 0.2
= PE 5
55
5

25
A CFA Institute Productionwww.cfainstitute.orgSlides provided by speaker
a. P/E and Growth: Firm Grows at x% for 5 Years, 8% ThereafterPE Rat ios and Expect ed Growt h: Int erest Rat e Scenarios
0
2 0
4 0
6 0
8 0
1 0 0
1 2 0
1 4 0
1 6 0
1 8 0
5 % 1 0 % 1 5 % 2 0 % 2 5 % 3 0 % 3 5 % 4 0 % 4 5 % 5 0 %
Expect ed Growt h Rat e
PE
Rati
o r = 4 %r = 6 %r = 8 %r = 1 0 %

26
A CFA Institute Productionwww.cfainstitute.orgSlides provided by speaker
b. P/E and Risk: A Follow-up ExamplePE Rat ios and Bet a: Growt h Scenarios
0
5
1 0
1 5
2 0
2 5
3 0
3 5
4 0
4 5
5 0
0 .7 5 1 .0 0 1 .2 5 1 .5 0 1 .7 5 2 .0 0
Bet a
PE
Rati
o g=25%g=20%g=15%g=8%
27
A CFA Institute Productionwww.cfainstitute.orgSlides provided by speaker
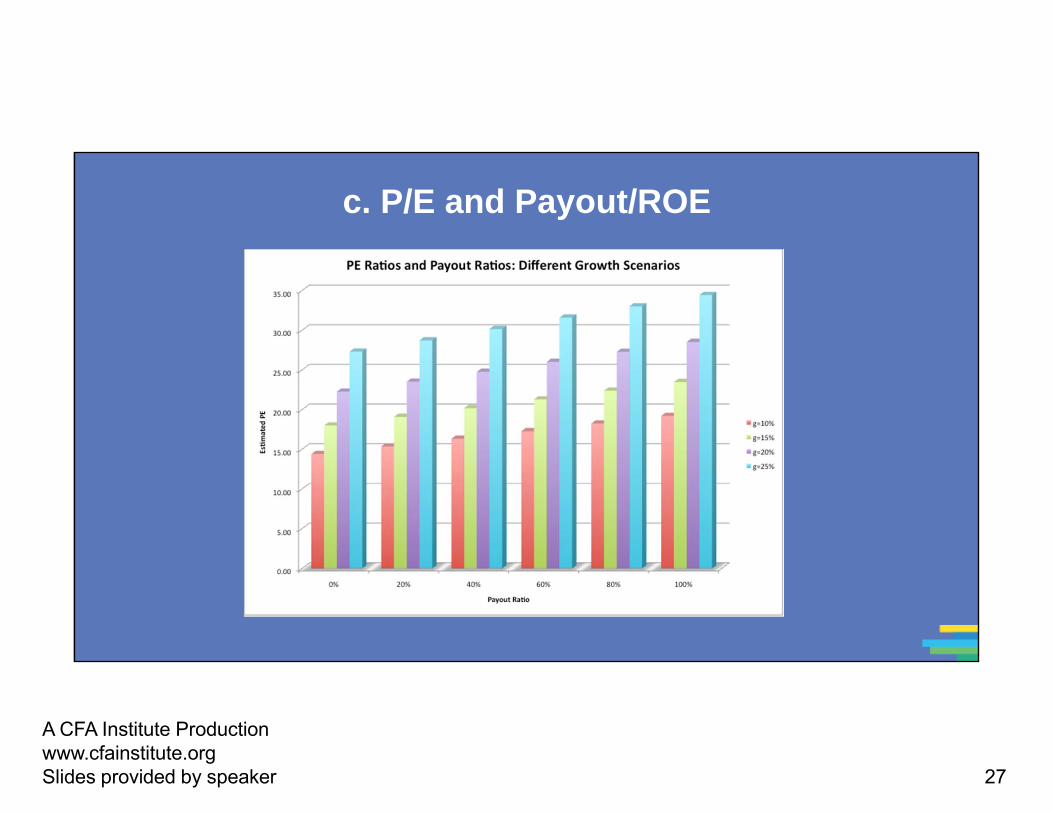
c. P/E and Payout/ROE

28
A CFA Institute Productionwww.cfainstitute.orgSlides provided by speaker
The Perfect Undervalued Company . . .
• If you were looking for the perfect undervalued asset, it would be one with:• A low P/E ratio (it is cheap)• High expected growth in earnings• Low risk (and cost of equity)• High ROEIn other words, it would be cheap with no good reason for being cheap
• In the real world, most assets that look cheap on a multiple of earnings basis deserve to be cheap. In other words, one or more of these variables works against the company (it has low growth, high risk, or a low ROE).
• When presented with a cheap stock (low P/E), here are the key questions:• What is the expected growth in earnings?• What is the risk in the stock?• How efficiently does this company generate its growth?

29
A CFA Institute Productionwww.cfainstitute.orgSlides provided by speaker
Putting the Variables to the Test:1. Comparing P/E Ratios across Time
for the S&P 500

30
A CFA Institute Productionwww.cfainstitute.orgSlides provided by speaker
Is Low (High) P/E Cheap (Expensive)?
• A market strategist argues that stocks are expensive because the P/E ratio today is high relative to the average P/E ratio across time.
• Do you agree?Yes No
• If you do not agree, what factors might explain the P/E ratio today?

31
A CFA Institute Productionwww.cfainstitute.orgSlides provided by speaker
E/P Ratios, T.Bond Rates, and Term Structure

32
A CFA Institute Productionwww.cfainstitute.orgSlides provided by speaker
Regression Results
• There is a strong positive relationship between E/P ratios and T.Bond rates, as evidenced by the correlation of 0.69 between the two variables.
• In addition, there is evidence that the term structure also affects the P/E ratio. • In the following regression, using 1960–2009 data, we regress E/P ratios against the
level of T.Bond rates and a term structure variable (T.Bond – T.Bill rate)E/P = 2.66% + 0.675 T.Bond Rate – 0.313 (T.Bond Rate – T.Bill Rate)
(3.37) (6.41) (– 1.36)R squared = 47.59%
Given the treasury bond rate and treasury bill rate today, is the market under- or overvalued today?

33
A CFA Institute Productionwww.cfainstitute.orgSlides provided by speaker
Putting the Variables to the Test:2. Emerging Market P/E Ratios — February 2010
Latin America Asia Europe Africa
34
A CFA Institute Productionwww.cfainstitute.orgSlides provided by speaker
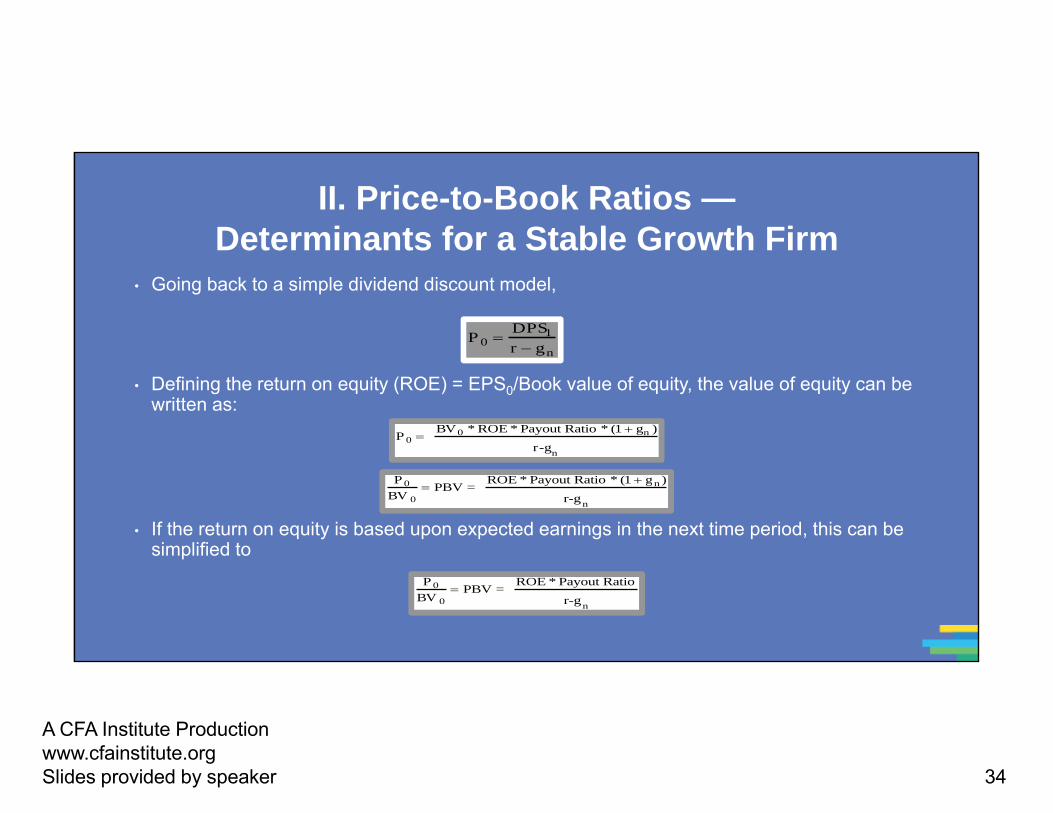
II. Price-to-Book Ratios —Determinants for a Stable Growth Firm
• Going back to a simple dividend discount model,
• Defining the return on equity (ROE) = EPS0/Book value of equity, the value of equity can be written as:
• If the return on equity is based upon expected earnings in the next time period, this can be simplified to
P 0 DPS1r gn
P 0 BV0 * ROE * Payout Ratio * (1 gn )
r-gn
P 0BV 0
PBV = ROE * Payout Ratio * (1 gn )
r-gn
P 0BV 0
PBV = ROE * Payout Ratio
r-gn
35
A CFA Institute Productionwww.cfainstitute.orgSlides provided by speaker
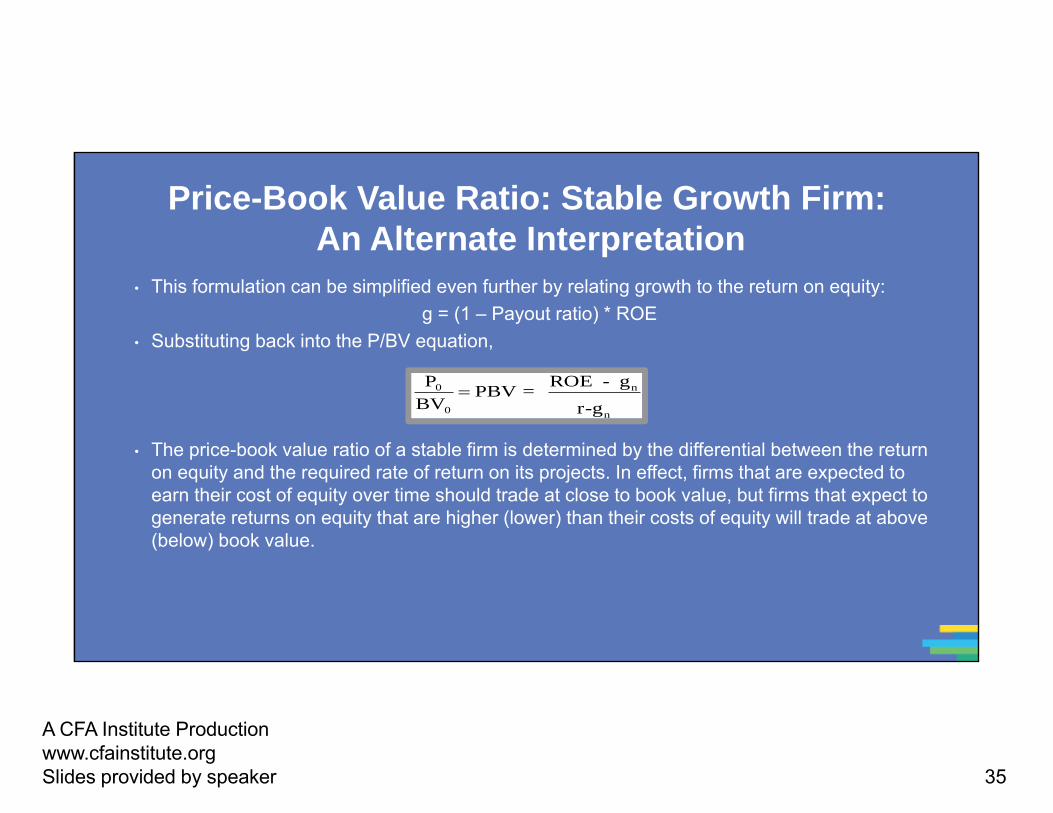
Price-Book Value Ratio: Stable Growth Firm: An Alternate Interpretation
• This formulation can be simplified even further by relating growth to the return on equity:g = (1 – Payout ratio) * ROE
• Substituting back into the P/BV equation,
• The price-book value ratio of a stable firm is determined by the differential between the return on equity and the required rate of return on its projects. In effect, firms that are expected to earn their cost of equity over time should trade at close to book value, but firms that expect to generate returns on equity that are higher (lower) than their costs of equity will trade at above (below) book value.
P0
BV0
PBV = ROE - gn
r-gn

36
A CFA Institute Productionwww.cfainstitute.orgSlides provided by speaker
It’s All about Finding Mismatches:Price-to-Book versus Return on Equity
MV/BV
ROE-r
High ROE High MV/BV
Low ROE Low MV/BV
Overvalued Low ROE High MV/BV
Undervalued High ROE Low MV/BV

37
A CFA Institute Productionwww.cfainstitute.orgSlides provided by speaker
Price-to-Book versus ROE: Largest Market Cap Firms in the United States, January 2010

38
A CFA Institute Productionwww.cfainstitute.orgSlides provided by speaker
Bringing Growth into the Picture . . .

39
A CFA Institute Productionwww.cfainstitute.orgSlides provided by speaker
Or Risk . . .
Cheapest

40
A CFA Institute Productionwww.cfainstitute.orgSlides provided by speaker
III. From Equity to Enterprise Value
• The value of the operating assets of a firm can be written as:
• The numerator can be written as follows:FCFF = EBIT (1 – t) – (Cex – Depr) – ∆ Working Capital
= (EBITDA – Depr) (1 – t) – (Cex – Depr) – ∆ Working Capital = EBITDA (1 – t) + Depr (t) – Cex – ∆ Working Capital
EV0 = FCFF1
WACC - g
on Depreciati and Taxes, Interest, before EarningsCash Debt of ValueMarket +Equity of ValueMarket
EBITDAValue Enterprise -

41
A CFA Institute Productionwww.cfainstitute.orgSlides provided by speaker
From Firm Value to EBITDA Multiples
• Now the value of the firm can be rewritten as:
• Dividing both sides of the equation by EBITDA,
• Because Reinvestment = (CEx – Depreciation + ∆ Working capital), the determinants of EV/EBITDA are:• The cost of capital• Expected growth rate• Tax rate• Reinvestment rate (or ROC)

42
A CFA Institute Productionwww.cfainstitute.orgSlides provided by speaker
A Simple Example
• Consider a firm with the following characteristics:• Tax rate = 36%• Capital expenditures/EBITDA = 30%• Depreciation/EBITDA = 20%• Cost of capital = 10%• No working capital requirements• In stable growth and expected to grow 5% a year forever

43
A CFA Institute Productionwww.cfainstitute.orgSlides provided by speaker
Calculating Value/EBITDA Multiple
• In this case, the Value/EBITDA multiple for this firm can be estimated as follows:
8.24 = .05.10
0 .05 .10
0.3 .05.10
(0.2)(.36) + .05.10
.36) (1 = EBITDA
Value-
--
---
-

44
A CFA Institute Productionwww.cfainstitute.orgSlides provided by speaker
The Determinants of EV/EBITDA
Tax Rates

45
A CFA Institute Productionwww.cfainstitute.orgSlides provided by speaker
The Determinants of EV/EBITDA (2)
Reinvestment Needs

46
A CFA Institute Productionwww.cfainstitute.orgSlides provided by speaker
The Determinants of EV/EBITDA (3)
Excess Returns
47
A CFA Institute Productionwww.cfainstitute.orgSlides provided by speaker
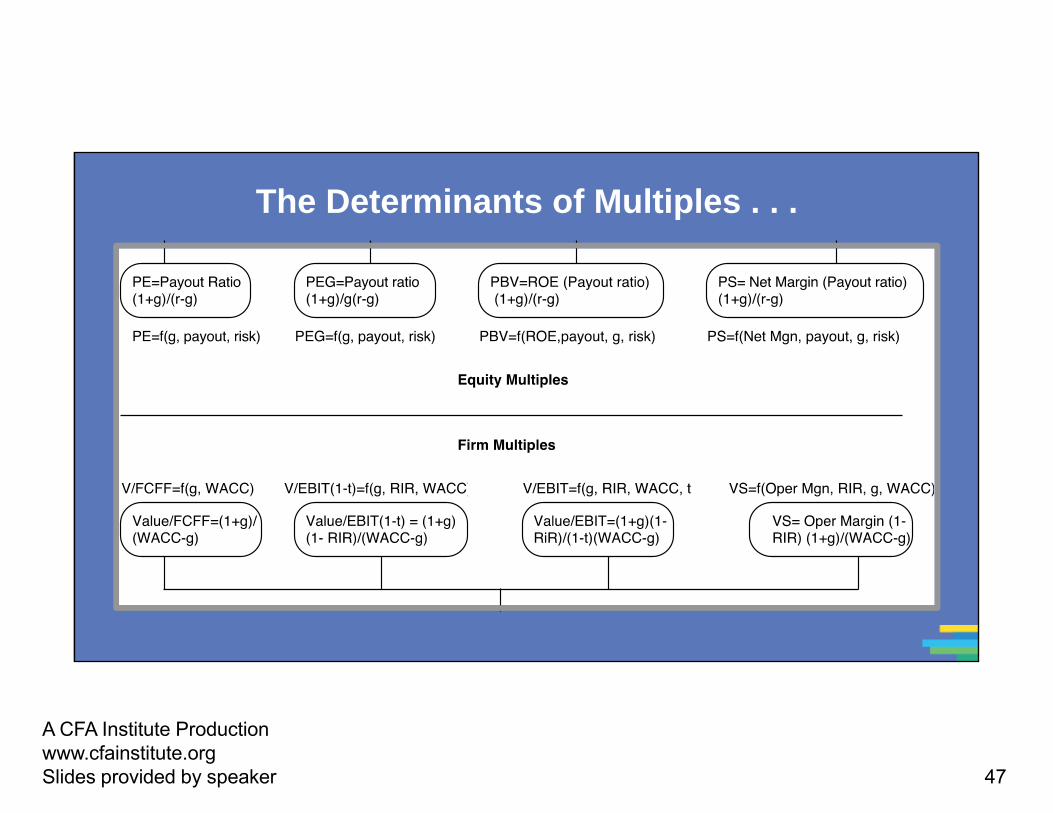
The Determinants of Multiples . . .

48
A CFA Institute Productionwww.cfainstitute.orgSlides provided by speaker
Application Tests
• Given the firm that we are valuing, what is a “comparable” firm?• Although traditional analysis is built on the premise that firms in the same sector are
comparable firms, valuation theory would suggest that a comparable firm is one that is similar to the one being analyzed in terms of fundamentals.
• Proposition 4: There is no reason why a firm cannot be compared with another firm in a very different business if the two firms have the same risk, growth, and cash flow characteristics.
• Given the comparable firms, how do we adjust for differences across firms on the fundamentals?• Proposition 5: It is impossible to find an exactly identical firm to the one you are valuing.

49
A CFA Institute Productionwww.cfainstitute.orgSlides provided by speaker
Comparable Firms: Approaches
• Ideally, you would like to find lots of publicly traded firms that look just like your firm in terms of fundamentals and compare the pricing of your firm to the pricing of these other publicly traded firms. Because they are all just like your firm, there will be no need to control for differences.
• In practice, it is very difficult (and perhaps impossible) to find firms that share the same risk, growth, and cash flow characteristics of your firm. Even if you are able to find such firms, they will be very few in number. The trade-off, then, becomes:

50
A CFA Institute Productionwww.cfainstitute.orgSlides provided by speaker
Techniques for Comparing across Firms
• Direct comparisons: If the comparable firms are “just like” your firm, you can compare multiples directly across the firms and conclude that your firm is expensive (cheap) if it trades at a multiple higher (lower) than the other firms.
• Storytelling: If there is a key dimension on which the firms vary, you can tell a story based upon your understanding of how value varies on that dimension.• An example: This company trades at 12 times earnings, but the rest of the sector trades at 10 times
earnings. I think it is cheap because it has a much higher growth rate than the rest of the sector.• Modified multiple: You can modify the multiple to incorporate the dimension on which there are
differences across firms.• An example: When comparing the P/E ratios of technology firms with different growth rates, you
can divide the P/E ratio by the expected growth rate to arrive at a PEG ratio.• Statistical techniques: If your firms vary on more than one dimension, you can try using multiple
regressions (or variants thereof) to arrive at a “controlled” estimate for your firm.

51
A CFA Institute Productionwww.cfainstitute.orgSlides provided by speaker
1. Direct Comparisons
• Assuming that you want to find firms that are exactly like your firm, which of the following variables would you try to make comparable?
a) Industry, sector, or subsectorb) Market capitalizationc) Expected growth rated) Return on invested capitale) Debt ratiof) Betag) Expected length of growth period

52
A CFA Institute Productionwww.cfainstitute.orgSlides provided by speaker
2. Storytelling
• Based upon the following information on two stocks, which one would you classify as cheap?
• Based upon the following information on two stocks, which one would you classify as cheap?

53
A CFA Institute Productionwww.cfainstitute.orgSlides provided by speaker
3. Modified MultiplesThe Case of PEG Ratios
• The PEG ratio is the ratio of price earnings to expected growth in earnings per share.
PEG = Price earnings / Expected growth rate in earnings• Proponents of this ratio argue that it controls for differences in growth and allows
you to therefore compare the pricing of companies with very different expected growth rates. For instance, assume that you are comparing the two stocks C and D from the last page:
The PEG ratio for D is much lower than the PEG ratio for C, leading to the conclusion that D is undervalued.
If we come to this conclusion, what is the implicit assumption we are making about the relationship between P/E and expected growth rates?

54
A CFA Institute Productionwww.cfainstitute.orgSlides provided by speaker
Example 4:PEG Ratios — The Beverage Sector
Company Name Trailing PE Growth Std Dev PEGCoca-Cola Bottling 29.18 9.50% 20.58% 3.07Molson Inc. Ltd. 'A' 43.65 15.50% 21.88% 2.82Anheuser-Busch 24.31 11.00% 22.92% 2.21Corby Distilleries Ltd. 16.24 7.50% 23.66% 2.16Chalone Wine Group Ltd. 21.76 14.00% 24.08% 1.55Andres Wines Ltd. 'A' 8.96 3.50% 24.70% 2.56Todhunter Int'l 8.94 3.00% 25.74% 2.98Brown-Forman 'B' 10.07 11.50% 29.43% 0.88Coors (Adolph) 'B' 23.02 10.00% 29.52% 2.30PepsiCo, Inc. 33.00 10.50% 31.35% 3.14Coca-Cola 44.33 19.00% 35.51% 2.33Boston Beer 'A' 10.59 17.13% 39.58% 0.62Whitman Corp. 25.19 11.50% 44.26% 2.19Mondavi (Robert) 'A' 16.47 14.00% 45.84% 1.18Coca-Cola Enterprises 37.14 27.00% 51.34% 1.38Hansen Natural Corp 9.70 17.00% 62.45% 0.57Average 22.66 0.13 0.33 2.00
Hansen looks really cheap on a PEG ratio basis . . . What might we be missing?
55
A CFA Institute Productionwww.cfainstitute.orgSlides provided by speaker
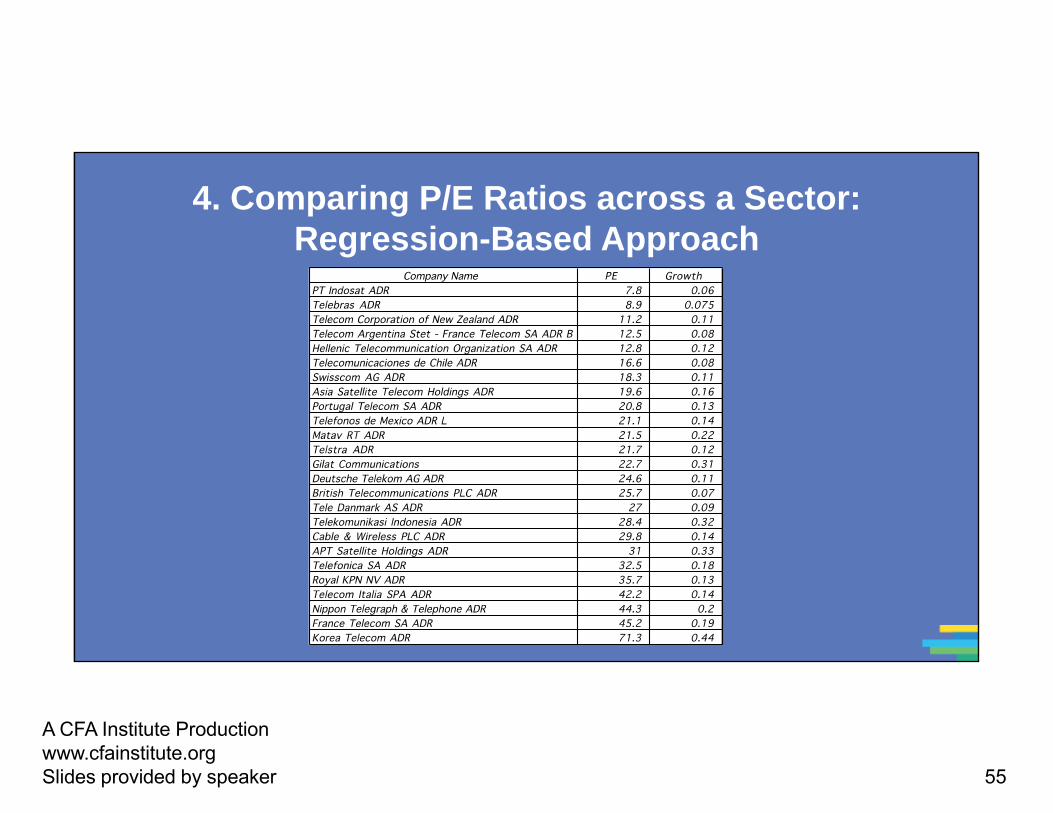
4. Comparing P/E Ratios across a Sector: Regression-Based Approach

56
A CFA Institute Productionwww.cfainstitute.orgSlides provided by speaker
P/E, Growth, and Risk
Dependent variable is: P/E
R squared = 66.2% R squared (adjusted) = 63.1%
Variable Coefficient SE t-ratio probConstant 13.1151 3.471 3.78 0.0010Growth rate 121.223 19.27 6.29 ≤ 0.0001Emerging Market –13.8531 3.606 – 3.84 0.0009Emerging Market is a dummy: 1 if emerging market
0 if not
57
A CFA Institute Productionwww.cfainstitute.orgSlides provided by speaker
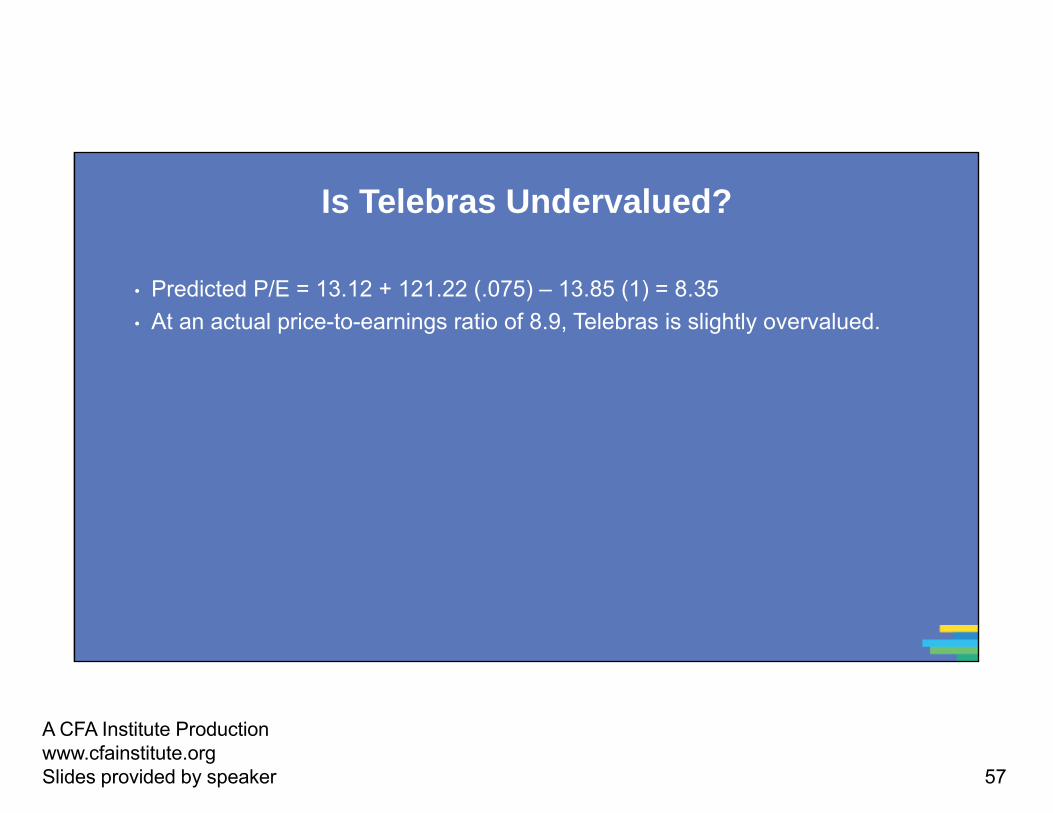
Is Telebras Undervalued?
• Predicted P/E = 13.12 + 121.22 (.075) – 13.85 (1) = 8.35• At an actual price-to-earnings ratio of 8.9, Telebras is slightly overvalued.

58
A CFA Institute Productionwww.cfainstitute.orgSlides provided by speaker
Return to Example 4: PEG Ratios —the Beverage Sector
Company Name Trailing PE Growth Std Dev PEGCoca-Cola Bottling 29.18 9.50% 20.58% 3.07Molson Inc. Ltd. 'A' 43.65 15.50% 21.88% 2.82Anheuser-Busch 24.31 11.00% 22.92% 2.21Corby Distilleries Ltd. 16.24 7.50% 23.66% 2.16Chalone Wine Group Ltd. 21.76 14.00% 24.08% 1.55Andres Wines Ltd. 'A' 8.96 3.50% 24.70% 2.56Todhunter Int'l 8.94 3.00% 25.74% 2.98Brown-Forman 'B' 10.07 11.50% 29.43% 0.88Coors (Adolph) 'B' 23.02 10.00% 29.52% 2.30PepsiCo, Inc. 33.00 10.50% 31.35% 3.14Coca-Cola 44.33 19.00% 35.51% 2.33Boston Beer 'A' 10.59 17.13% 39.58% 0.62Whitman Corp. 25.19 11.50% 44.26% 2.19Mondavi (Robert) 'A' 16.47 14.00% 45.84% 1.18Coca-Cola Enterprises 37.14 27.00% 51.34% 1.38Hansen Natural Corp 9.70 17.00% 62.45% 0.57Average 22.66 0.13 0.33 2.00

59
A CFA Institute Productionwww.cfainstitute.orgSlides provided by speaker
Analyzing PEG
• Given that the PEG ratio is still determined by the expected growth rates, risk, and cash flow patterns, it is necessary that we control for differences in these variables.
• Regressing PEG against risk and a measure of the growth dispersion, we get:PEG = 3.61 – .0286 (Expected Growth) – .0375 (Std Deviation in Prices)
R Squared = 44.75%• In other words,
• PEG ratios will be lower for high growth companies• PEG ratios will be lower for high risk companies
• We also ran the regression using the deviation of the actual growth rate from the industry-average growth rate as the independent variable, with mixed results.

60
A CFA Institute Productionwww.cfainstitute.orgSlides provided by speaker
Estimating the PEG Ratio for Hansen
• Applying this regression to Hansen, the predicted PEG ratio for the firm can be estimated using Hansen’s measures for the independent variables:• Expected Growth Rate = 17.00%• Standard Deviation in Stock Prices = 62.45%
• Plugging in,Expected PEG Ratio for Hansen = 3.61 – .0286 (17) – .0375 (62.45)
= 0.78• With its actual PEG ratio of 0.57, Hansen looks undervalued, notwithstanding
its high risk.

61
A CFA Institute Productionwww.cfainstitute.orgSlides provided by speaker
Example 5:PBV and ROE: European Banks — 2010
62
A CFA Institute Productionwww.cfainstitute.orgSlides provided by speaker
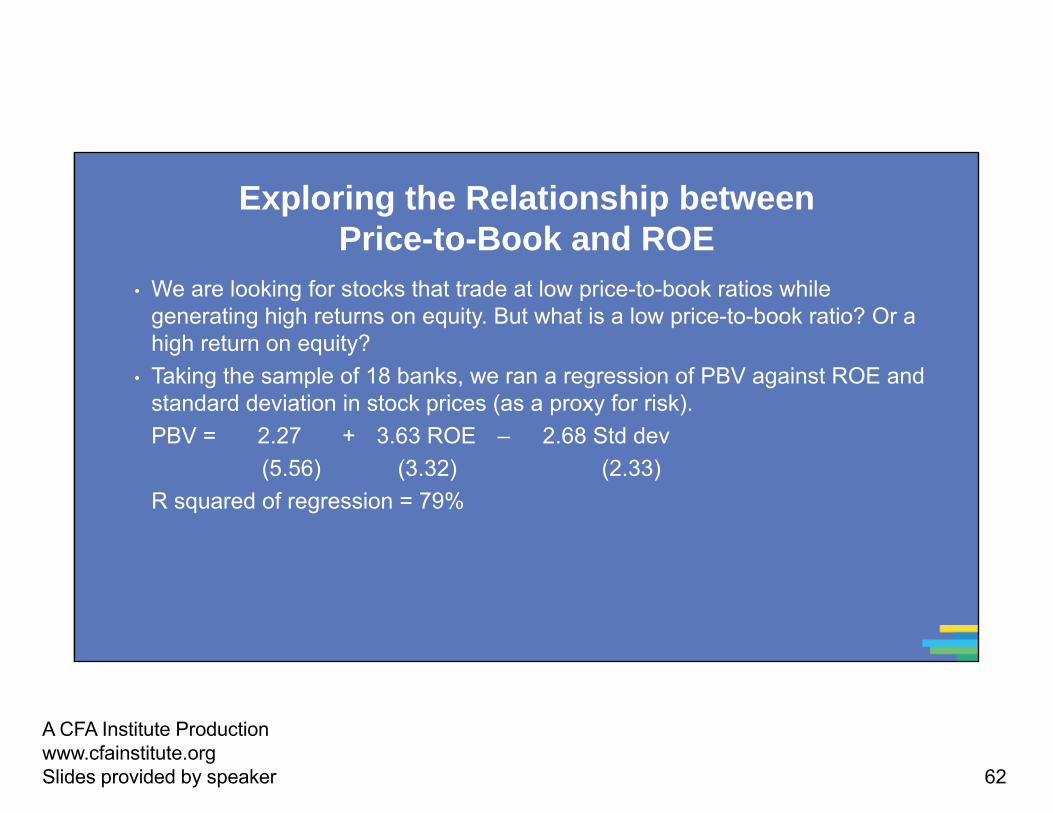
Exploring the Relationship between Price-to-Book and ROE
• We are looking for stocks that trade at low price-to-book ratios while generating high returns on equity. But what is a low price-to-book ratio? Or a high return on equity?
• Taking the sample of 18 banks, we ran a regression of PBV against ROE and standard deviation in stock prices (as a proxy for risk).PBV = 2.27 + 3.63 ROE – 2.68 Std dev
(5.56) (3.32) (2.33)R squared of regression = 79%

63
A CFA Institute Productionwww.cfainstitute.orgSlides provided by speaker
Estimating Predicted Price-to-Book Ratios

64
A CFA Institute Productionwww.cfainstitute.orgSlides provided by speaker
Example 6. Nothing’s Working!!! Internet Stocks in Early 2000

65
A CFA Institute Productionwww.cfainstitute.orgSlides provided by speaker
PS Ratios and Margins Are Not Highly Correlated
• Regressing PS ratios against current margins yields the followingPS = 81.36 – 7.54 (Net Margin) R squared = 0.04
(0.49)• This is not surprising. These firms are priced based upon expected margins,
rather than current margins.

66
A CFA Institute Productionwww.cfainstitute.orgSlides provided by speaker
Solution 1: Use Proxies for Survival and Growth — Amazon in Early 2000
• Hypothesizing that firms with higher revenue growth and higher cash balances should have a greater chance of surviving and becoming profitable, we ran the following regression: (The level of revenues was used to control for size)
PS = 30.61 – 2.77 ln(Rev) + 6.42 (Rev Growth) + 5.11 (Cash/Rev)(0.66) (2.63) (3.49)
R squared = 31.8%Predicted PS = 30.61 – 2.77(7.1039) + 6.42(1.9946) + 5.11 (.3069) = 30.42Actual PS = 25.63Stock is undervalued relative to other internet stocks.

67
A CFA Institute Productionwww.cfainstitute.orgSlides provided by speaker
Solution 2: Use Forward Multiples
• Global Crossing lost $1.9 billion in 2001 and is expected to continue to lose money for the next 3 years.In a discounted cash flow valuation (see notes on DCF valuation) of Global Crossing, we estimated anexpected EBITDA for Global Crossing in five years of $1,371 million.
• The average enterprise value/EBITDA multiple for healthy telecomm firms is currently 7.2.• Applying this multiple to Global Crossing’s EBITDA in year 5 yields a value in year 5 of
• Enterprise value in year 5 = 1371 * 7.2 = $9,871 million• Enterprise value today = $ 9,871 million/1.1385 = $5,172 million(The cost of capital for Global Crossing is 13.80%)• The probability that Global Crossing will not make it as a going concern is 77%.• Expected enterprise value today = 0.23 (5172) = $1,190 million

68
A CFA Institute Productionwww.cfainstitute.orgSlides provided by speaker
Can You Do This?
• Assume that you are valuing a private internet company with revenues of $10 million, a revenue growth rate of 40%, and a cash balance that is 5% of value for an initial public offering. Can you use the pricing of publicly traded stocks to value the internet companies?a) Yesb) No
• Would your answer be different if you were valuing the company for a venture capitalist?• Would your answer change if you were valuing the company for sale in a private transaction?

69
A CFA Institute Productionwww.cfainstitute.orgSlides provided by speaker
Relative Valuation with Private Businesses
• With private company valuations, you have two choices for comparables: • You can obtain private company transaction values and use them to estimate the value of
your firm. Thus, if private medical practices typically sell for three times overall billing revenues, your firm would be valued at roughly the same number.Advantage: Because these are private company transactions, the values already reflect the liquidity and lack of diversification concerns that tend to depress private company values.Disadvantage: The data on private company transactions have far more contamination from transactions not being arms length or timely. It is also far more difficult to obtain other relevant data from the transaction.
• You can obtain a value from public companies and then adjust that value for illiquidity and lack of diversification considerations, if necessary.Advantage: The data are likely to be cleaner and there is much more of it.Disadvantage: The “adjusting” of public multiples is often arbitrary and can lead to biased values.

70
A CFA Institute Productionwww.cfainstitute.orgSlides provided by speaker
How Much Is the Private Company Discount?
0 2 4 6 8 10 12 14 16 18
EV/EBIT
EV/EBITDA
EV/Revenues
EV/Book Value
EV/EBIT EV/EBITDA EV/Revenues EV/Book ValuePublicly traded companies 16.39 10.15 2.86 1.32Private companies 11.76 8.08 2.35 1.35
Private versus Public Acquisitions
Publicly traded companies Private companies

71
A CFA Institute Productionwww.cfainstitute.orgSlides provided by speaker
Comparisons to the Entire Market: Why Not?
• If you can control for differences in risk, growth, and cash flows, you can expand your list of comparable firms significantly. In fact, there is no reason why you cannot bring every firm in the market into your comparable firm list.
• The simplest way of controlling for differences is with a multiple regression, with the multiple (P/E, EV/EBITDA, etc.) as the dependent variable and proxies for risk, growth, and payout forming the independent variables.
• When you make this comparison, you are estimating the value of your company relative to the entire market (rather than just a sector).

72
A CFA Institute Productionwww.cfainstitute.orgSlides provided by speaker
P/E versus Expected EPS Growth: January 2010

73
A CFA Institute Productionwww.cfainstitute.orgSlides provided by speaker
P/E Ratio: Standard Regression for US Stocks — January 2010

74
A CFA Institute Productionwww.cfainstitute.orgSlides provided by speaker
The Value of Growth
Time Period P/E Value of Extra 1% of Growth Equity Risk PremiumJanuary 2010 0.550 4.36%January 2009 0.780 6.43%January 2008 1.427 4.37%January 2007 1.178 4.16%January 2006 1.131 4.07%January 2005 0.914 3.65%January 2004 0.812 3.69%July 2003 1.228 3.88%January 2003 2.621 4.10%July 2002 0.859 4.35%January 2002 1.003 3.62%July 2001 1.251 3.05%January 2001 1.457 2.75%July 2000 1.761 2.20%January 2000 2.105 2.05%The value of growth is in terms of additional P/E…

75
A CFA Institute Productionwww.cfainstitute.orgSlides provided by speaker
Fundamentals Hold in Every Market: P/E Regressions across Markets . . .
Region Regression – January 2010 R squared
Europe P/E = 14.52 + 1.25 Beta + 40.71 Expected growth rate
14.9%
Japan P/E = 15.02 + 4.36 Beta + 0.62 Payout + 35.23 Expected growth
17.5%
Emerging Markets
P/E = 20.07 – 2.09 Beta – 2.49 Payout + 37.91 Expected growth rate
12.8%

76
A CFA Institute Productionwww.cfainstitute.orgSlides provided by speaker
Relative Valuation: Some Closing Propositions
• Proposition 1: In a relative valuation, all that you are concluding is that a stock is under- or overvalued, relative to your comparable group. • Your relative valuation judgment can be right, and your stock can be hopelessly
overvalued at the same time.• Proposition 2: In asset valuation, there are no similar assets. Every asset is unique.
• If you don’t control for fundamental differences in risk, cash flows, and growth across firms when comparing how they are priced, your valuation conclusions will reflect your flawed judgments rather than market misvaluations.

77
A CFA Institute Productionwww.cfainstitute.orgSlides provided by speaker
Choosing between the Multiples
• As presented in this section, there are dozens of multiples that can be potentially used to value an individual firm.
• In addition, relative valuation can be relative to a sector (or comparable firms) or to the entire market (using the regressions, for instance)
• Because there can be only one final estimate of value, there are three choices at this stage:• Use a simple average of the valuations obtained using a number of different multiples• Use a weighted average of the valuations obtained using a number of different multiples• Choose one of the multiples and base your valuation on that multiple

78
A CFA Institute Productionwww.cfainstitute.orgSlides provided by speaker
Picking One Multiple
• This is usually the best way to approach this issue. Though a range of values can be obtained from a number of multiples, the “best estimate” value is obtained using one multiple.
• The multiple that is used can be chosen in one of three ways:• Use the multiple that best fits your objective. Thus, if you want the company to be
undervalued, you pick the multiple that yields the highest value.• Use the multiple that has the highest R squared in the sector when regressed against
fundamentals. Thus, if you have tried P/E, PBV, PS, etc. and run regressions of these multiples against fundamentals, use the multiple that works best at explaining differences across firms in that sector.
• Use the multiple that seems to make the most sense for that sector, given how value is measured and created.

79
A CFA Institute Productionwww.cfainstitute.orgSlides provided by speaker
A More Intuitive Approach
• Managers in every sector tend to focus on specific variables when analyzing strategy and performance. The multiple used will generally reflect this focus. Consider three examples:• In retailing: The focus is usually on same store sales (turnover) and profit margins. Not
surprisingly, the revenue multiple is most common in this sector.• In financial services: The emphasis is usually on return on equity. Book equity is often
viewed as a scarce resource, because capital ratios are based upon it. Price-to-book ratios dominate.
• In technology: Growth is usually the dominant theme. PEG ratios were invented in this sector.
80
A CFA Institute Productionwww.cfainstitute.orgSlides provided by speaker
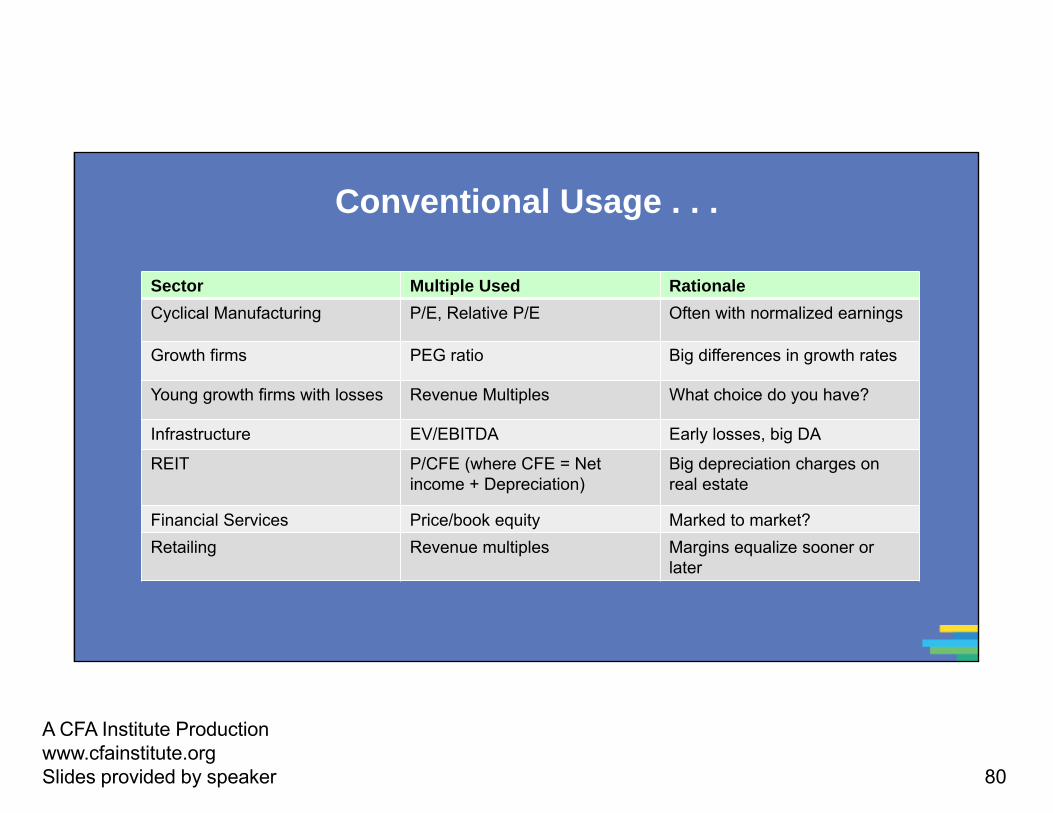
Conventional Usage . . .
Sector Multiple Used RationaleCyclical Manufacturing P/E, Relative P/E Often with normalized earnings
Growth firms PEG ratio Big differences in growth rates
Young growth firms with losses Revenue Multiples What choice do you have?
Infrastructure EV/EBITDA Early losses, big DA
REIT P/CFE (where CFE = Net income + Depreciation)
Big depreciation charges on real estate
Financial Services Price/book equity Marked to market?Retailing Revenue multiples Margins equalize sooner or
later

81
A CFA Institute Productionwww.cfainstitute.orgSlides provided by speaker
Relative versus Intrinsic Value
• If you do intrinsic value right, you will bring in a company’s risk, cash flow, and growth characteristics into the inputs, preserve internal consistency, and derive intrinsic value. If you do relative value right, you will find the right set of comparables and control well for differences in risk, cash flow, and growth characteristics. Assuming you value the same company doing both DCF and relative valuation correctly, should you get the same value?
a) Yesb) No
• If not, how would you explain the difference?• If the numbers are different, which value would you use?
a) Intrinsic valueb) Relative valuec) A composite of the two valuesd) The higher of the two valuese) The lower of the two valuesf) Depends on what my valuation “mission” is

82
A CFA Institute Productionwww.cfainstitute.orgSlides provided by speaker
Mission Effect: Intrinsic or Relative Value
If your valuation mission is Appropriate valueValuing a company (business) as a long-term investment for your portfolio
a) Intrinsic valueb) Relative value
Valuing a company (business) as a short-term investment for your portfolio
a) Intrinsic valueb) Relative value
Valuing a private company (business) for sale in a transaction
a) Intrinsic valueb) Relative value
Valuing a company (business) for an initial public offering
a) Intrinsic valueb) Relative value
Valuing a company for “tax” purposes a) Intrinsic valueb) Relative value
Estimating a fair value for an asset or company for accounting purposes
a) Intrinsic valueb) Relative value