Embed Size (px)
Citation preview
1
Relative solubility number RSN- an alternative measurement to logPow for determining the bioaccumulation potential Master of Science Thesis in the Master Degree Programme, Materials and Nanotechnology
JESSICA EDLER Department of Chemical and Biological Engineering Applied Surface Chemistry CHALMERS UNIVERSITY OF TECHNOLOGY Göteborg Sverige, 2011
2
Relative solubility number RSN- an alternative measurement to logPow for determining the
bioaccumulation potential
JESSICA EDLER
Master thesis in collaboration with Akzo Nobel
Department of Chemical and Biological Engineering Applied Surface Chemistry
Chalmers University of Technology SE-412 96 Göteborg
Sweden Telephone: +46 (0)31-772 10 00
Supervisor: Louis Schwarzmayr, Akzo Nobel Examiner: Krister Holmberg, Chalmers University of Technology Cover figure: Imaginary picture symbolizing a chemical cycle of surfactant and their possible potential to accumulate in the environment.
3
Abstract During the autumn of 2010 and part of 2011 a master thesis titled “Relative solubility number RSN- an alternative measurement to logPow for determining the bioaccumulation potential” was performed at Akzo Nobel in Stenungsund. The aim of this diploma work was to find a correlation between the current used method for determining bioaccumulation, logPow and the relative solubility number (RSN). RSN is a well known method where the hydrophobic-hydrophilic character for non-ionic surfactants is determined by titration of water into a solvent system consisting of dioxane acting as the polar solvent and toluene acting as the less polar solvent. The definition of the standard RSN value is empirically defined as the amount of distilled water necessary to be added to produce persistent turbidity. The desire to find a correlation between these two methods originates from the need to find an easier way of determining the bioaccumulation of surfactants. To determine LogPow is both expensive, time consuming and it is being debated and argued whether surfactants actually have a true partitioning coefficient. During the measurement of logPow the surfactant concentration is below the critical micelle concentration (CMC) ensuring that no micelles are formed. It has been debated if the surfactant in the mixture is present at the octanol/water interface or whether if adsorbed to the sample glass surface. Octanol is an alcohol and it has a logPow of 3, octanol is a surface active compound itself. The RSN values were determined for a series of non-ionic alcoholethoxylates where the alkylchain is dodecanol and ethylene oxide chain, EO, ranging from 2 moles up to 10 moles. The measured RSN values were increasing with increased ethoxylat degree as expected. Cationic surfactants such as primary amines were also studied since cations in general have high surface tension. Depending on the pH in the solution and the degree of protonisation the water solubility potential varied significantly. It was therefore favourable to tests alkyl glycoside since Akzo Nobel has ongoing research were alkyl glycosides are used as raw material. Even though a large amount of tests were performed, it seemed hard to find reliable RSN values for alkylglucosides.
4
ContentsContents .................................................................................................................................4 Theory ....................................................................................................................................6
Surfactants ..........................................................................................................................6 Anionic surfactant ...........................................................................................................7 Nonionic surfactant .........................................................................................................7 Cationic surfactant ..........................................................................................................8 Zwitterionic surfactant ....................................................................................................8
Surface tension ...................................................................................................................9 Behaviour at interface: ...................................................................................................... 10
Conductivity ................................................................................................................. 10 Turbidity ....................................................................................................................... 10
Krafft point ....................................................................................................................... 11 Polar and non-polar solvents ............................................................................................. 12 Hydrophilic- Lipophilic balance, HLB-value: ................................................................... 13 Log Pow- Octanol- water partition coefficient .................................................................. 14 Relative solubility number- RSN ...................................................................................... 14 Bioaccumulation potential of surfactants........................................................................... 16 Bioaccumulation ............................................................................................................... 17 Biomagnificaton ............................................................................................................... 17 Biodegradation ................................................................................................................. 18
Alkylphenol: ................................................................................................................. 19 Experimental part ................................................................................................................. 20
MPS- Scanalys instrument ................................................................................................ 20 Method description ........................................................................................................... 21
Measurement conditions ............................................................................................... 22 RSN method ..................................................................................................................... 22
Reference sample for MPS ............................................................................................ 23 Chemical structure for surfactants used and measured....................................................... 24 Preparation of alcoholethoxylates ..................................................................................... 24
Alcoholethoxylate ......................................................................................................... 24 Glycoside and glucopyranoside......................................................................................... 25
Cationic surfactant ........................................................................................................ 25 Result and discussion ........................................................................................................ 26 Alcoholethoxylate ............................................................................................................. 26
Nonylphenol ................................................................................................................. 31 Glycoside ......................................................................................................................... 36 Cationic surfactant ............................................................................................................ 46
Conclusions .......................................................................................................................... 51 Appendix 1 ........................................................................................................................... 53
NMR and C-13: ............................................................................................................. 53 Appendix 2 ........................................................................................................................... 54 Appendix 3 ........................................................................................................................... 55 Appendix 4 ........................................................................................................................... 56
Gas-Chromatography for C12-6EO: .............................................................................. 56 Appendix 5 ........................................................................................................................... 57 Appendix 6 ........................................................................................................................... 58 Appendix 7 ........................................................................................................................... 59 Acknowledgement ................................................................................................................ 60
5
Introduction Surfactants are surface active substances used within a wide range of applications. EU- legislation requires ecotoxicity data to be reported and registered. The 18th of December 2006, REACH was introduced by the European Union as a regulation for controlling and registration of all chemicals produced and imported into the European Union in greater volume then one ton per year to be classified and registered within this new system. There are well known ecotoxicity testing methods available and used for the evaluation of the environmental impact of chemicals. These methods allow understandings about physical properties like toxicity, biodegradation and bioaccumulation. The preferred technique used to predict bioaccumulation of chemicals and surfactants is to determine the logarithm of octanol/ water partitioning coefficient, logPow. Depending on which phase the surfactant favours this provides an indication of bioaccumulation for the individual surfactant tested. Surfactants which favour octanol and the organic phase are claimed to have a higher potential for bioaccumulation. The logPow coefficient could also be calculated by different programs that are available. Determination of logPow is experimentally time-consuming, difficult and expensive. The bioaccumulations tests are also performed on living organisms. The difficulties originate from surfactants and their properties as surface active molecules. Cation possesses a tendency to adsorb and cover negatively charged surfaces before the micelle formation begins. This electrostatic interaction is not reflected in the logPow-value which provides further doubt about the method. It is important to find an alternative method for measuring bioaccumulation of surfactants. This master thesis originates from the idea to somehow try to correlate logPow and bioaccumulation to RSN. The RSN, relative solubility number is a method where the hydrophobic-hydrophilic composition of a non- ionic surfactant is determined. The RSN value is the amount of water needed to produce persistent or permanent turbidity. In this master thesis MPS, a multi parameter-Scanning instrument was used to measure the RSN- value which was favourable since it is possible to have a constant temperature during the measurement but also measures added volume of water, conductivity, turbidity simultaneously at frequent intervals during the measurement. The RSN method was developed originally mainly for non-ionic surfactant so the idea behind this thesis is to correlate the water solubility of the surfactant, measured and calculated by RSN and to compare it to logPow.
6
Theory
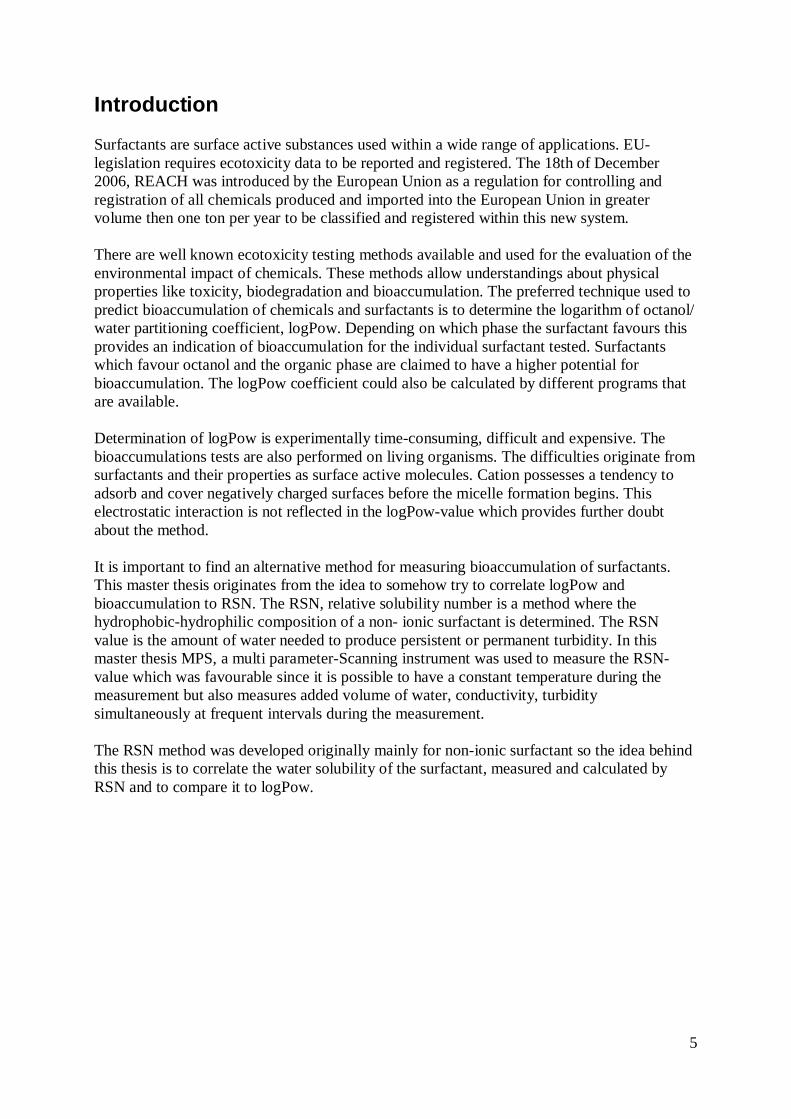
Surfactants General, surfactants are compounds that lower the surface tension at an interface, where the interface is a boundary between two phases. There are different types of phases, for example solid-vapour, solid-liquid and liquid- liquid interface. The ability to lower the free energy of the phase boundaries is the driving force of reducing the surface tension. Surfactants have a tendency to pack very densely at interfaces, larger packing results in a reduction of the surface tension. Surfactants are amphiphilic (Farn, 2006), referring to both the hydrophobic and hydrophilic character that a surfactant possesses. The headgroups of surfactants are hydrophilic by nature, while the tails of the surfactants are hydrophobic. Surfactants can be classified by the charge of their polar headgroup. The headgroup could be positively charged (cations), negatively charged (anions), both negatively and positively charged (zwitterions or amphoterics) or have no charge at all, non-ionics. Different composition that a surfactant can possess is seen in figure 1. These different types of surfactants will be further discussed in section 2.1.1-2.1.4. An important feature with surfactants is their potential to form micelles. Micelles or polar aggregates (Drew, 2006) have high water solubility and micellization is occurring already at very low surfactant concentration and the rate of exchange between bulk and micelle solution is dependent upon the size and the structure of the surfactant but temperature is also influencing this exchange. Temperature changes are influencing the micelle formation and the temperature at which micelles can form is dependent on the length of the hydrophobic chain. An increased hydrocarbon chainlength would increase the Van der Waals interactions/ forces between the hydrophobic tails, resulting in a lower solubility in water. This behaviour is known as the Krafft point or Krafft temperature. This will be discussed in section 2.2.4
Figure 1: Schematic illustrations of, from top to bottom, nonionic, anionic, cationic and zwitterionic surfactants
7
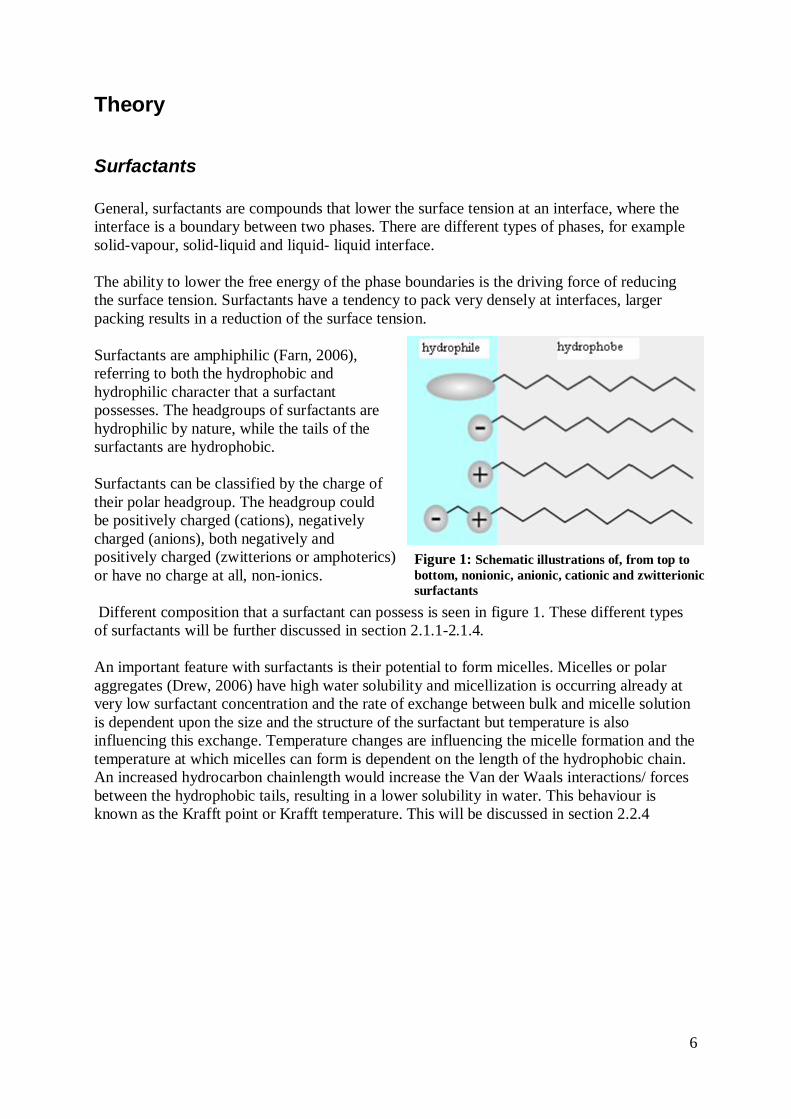
Anionic surfactant The polar headgroup of anionic surfactants is negatively charged and consists of carboxylate, sulfate, sulfonate and phosphates as headgroups. Anionic surfactants are commonly useas detergents. A good detergent has an alkyl chain within the range of C12-18, usually a straight alkyl chain. They are produced in big volumes as they are easy to manufacture and are low in price. An image of an anionic surfactant can be seen in figure 2. Counterions used are preferably sodium, potassium, ammonium, calcium and protonated alkyl amines (Krister Holmberg, 2003). A general feature is their sensitivity to hard water, though this sensitivity decreases regarding to character of the headgroup; carboxylate> phosphate sulfate~sulfonate.
Figure 2: Sodium dodecyl sulfate, SDS
Nonionic surfactant Nonionic surfactants can be produced by ethoxylating, putting a polyglycole chain on a hydrophobe like fatty alcohols, alkylphenols, fatty acids or fatty amines, see figure 3. Since the headgroup does not have any charge, the polarity is instead determined by the dipole moment of the headgroup. Some nonionic surfactants, mainly ethoxylates, are sensitive to temperature changes causing a change in configuration, a temperature increase results in decreased hydrophilicity (Krister Holmberg, 2003). One main advantage of non-ionic surfactants is their compatibility with all other surfactants. This property exist due to that the headgroup of a nonionic surfactant has no charge (Tadros, 2005).
Figure 3: Schematic picture of a typical alcoholethoxylate

8
Cationic surfactant The headgroup of cationic surfactants is positively charged and commonly cationic surfactants are amines or quaternary-ammonium based products. Amine surfactants are sensitive to pH changes due to that only cationic in their protonated stage while quaternary amines are cat-ionic surfactants at any pH. Figure 4 shows the structure of a commonly used cationic surfactant, CTAB. A disadvantage is the aquatic toxicity of the cationic surfactants and that they are not compatible with anionic surfactants.
Figure 4: Cetyltrimethylammonium bromide, CTAB
Zwitterionic surfactant Zwitterionic surfactants possess a unique character of containing two different charges. Characteristic for zwitterionic surfactant is that they could appear as amphoteric surfactants i.e. change the charge of their headgroup occurs when pH is changed. Due to this “amphoteric” appearance they have high compatibility and they are not sensitive to hard water. A typical image of zwitterionic surfactant can be seen in image 5. Typical cationic charges comes from ammonium in most cases, while it is more common that anionic charge differs more even though usually carboxylate is the most commonly used one.
Figure 5: 1-palitoyl-2-oleoylphosphatidylchloline
9
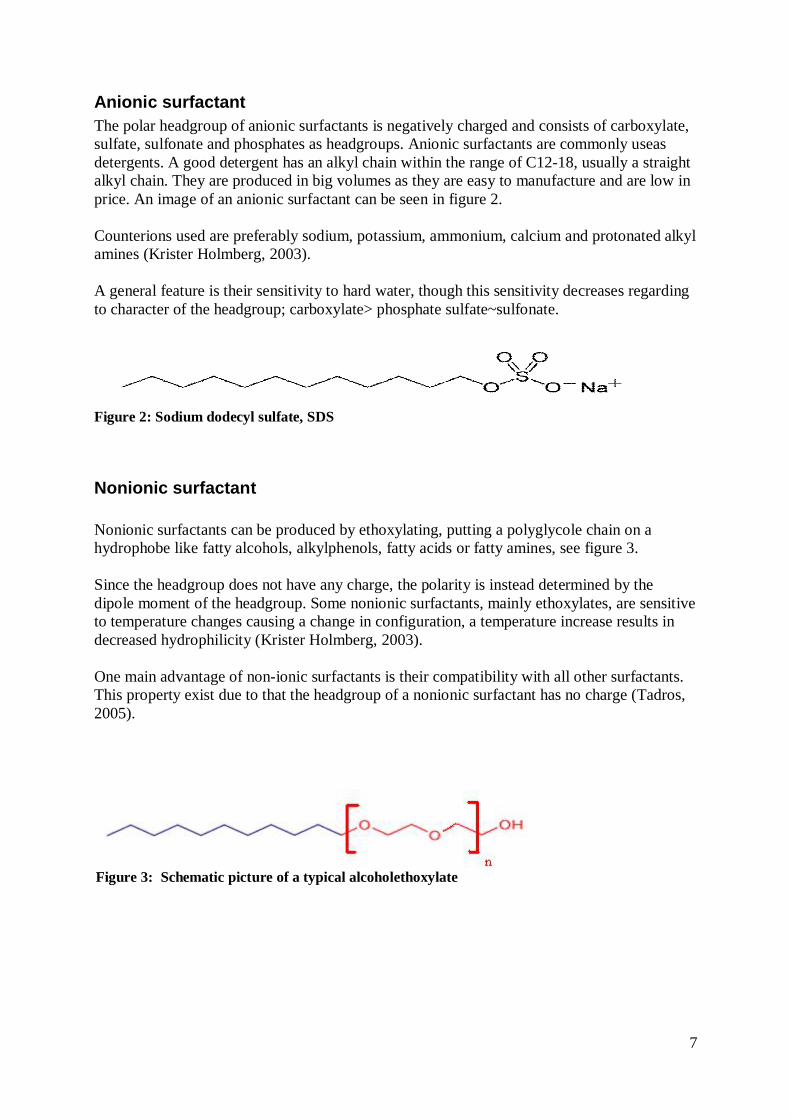
Surface tension Surfactant possesses a unique character; their ability to go to an interface between two phases and start to form micelles at a certain concentrations. In order to understand this, one needs to be clear on what causes surface tension in the first place, and why surfactants favour the interface and decrease this specific tension (Krister Holmberg, 2003). Surface tension is caused by cohesive forces between the liquid molecules. In the bulk these molecules are pulled in all directions, creating an equal force and a net force zero effect of energy. These attractive forces originate from dispersion, dipole-dipole and dipole-induced-dipole forces and also hydrogen bounding. In short terms it could be understood that surface tension is related to the attractive forces between the molecules, a reflection of the cohesive forces. It is known that imiscibility between two phases is caused by a large difference between the molecules in each phase. Addition of surfactants to a liquid containing two phases will reduce the surface free energy, due to that the hydrophobic part is removed from contact with water. After coverage of the whole interfacial surface, micelle formation will spontaneously start and larger emulsion aggregates can start to form. During addition of surfactants to a liquid, the surface tension is decreased rapidly as surfactant cover the surface of the interface. After a certain concentration the surfactants will start to aggregate into micelles, and the critical micelle concentration, CMC, has been reached. Further addition of surfactants will lead to micelle formation while the surface tension stays more or less constant (Rosen, 1989). The process of micellization is a dynamic process, referring to monomers constantly changing their position between being part of micelle, adsorbed at a surface and staying as a monomer in the solution. To characterize the differences between surfactants in respect to their hydrophobicity and lipophilic behaviour, the ability and tendency for surfactants to form emulsions are measured. There are two main type of emulsions, either the surfactants tend to form an oil-in-water emulsion, seen in figure 6, hydrophilic by nature, or the surfactants tend to form a water-in-oil emulsion which has a character as lipophilic by nature.
Figure 6: Schematic picture of an oil in water emulsion showing the hydrophilic head and the hydrophobic tail of the surfactant.
10
Behaviour at interface: The hydrophobic tails of the surfactants prefer to interact with each other rather than being surrounded by water. This typical behaviour originates from the hydrophobic effect which is the driving force behind surfactants association. It is possible to measure of this aggregation with turbidity. Depending on the strength of interaction between the hydrophilic units of a surfactant and the water the ability for surfactants to self-assemble is affected. The free energy for both the hydrophilic head and the hydrophobic tail of a surfactant depending upon the surrounding medium will determine the ability for micellization or solvation in either waterphase or oilphase.
Conductivity Conductivity is used as a measurement which indicates when changes in phase behaviour of the solvent system start. When the continuous phase is consisting of water, the conductivity is high but once the continuous phase changes into oil, conductivity drops. Due to this phenomenon it is possible to understand which type of emulsions that are formed. Addition of salt will increase the conductivity.
Turbidity The turbidity will increase when micelles are formed. Water molecules arrange themselves in a structured way around the hydrophobic part of the surfactant which results in a decrease in entropy. Loss in entropy makes it more beneficial from an energy point of view to form aggregate and the solution will become turbid or cloudy. In this master thesis the turbidity is measured with a nephelometer (NTU), where a light beam will be scattered by the particles inside of the solution. The smaller particle in the solution will scatter more light. Properties influencing turbidity and the ability to scatter light are determined by the shape; colour a reflectivity of the particle within the solution. The instrument used is a multi parameter scanning, MPS apparatus. The MPS is described further in section 3.1.

11
Krafft point The water solubility for non-ionic surfactants like fatty alcohol ethoxylates, are correlated with temperature, where solubility will increase with increasing temperature. Krafft point, or Krafft temperature, is known as the breaking point or temperature at which the solubility for surfactants rises sharply. This significant increase in solubility occurs at a relative narrow temperature range (Krister Holmberg, 2003). This relationship can be seen in figure 7. This phenomenon could be explained as the temperature dependence of surfactant monomer solubility and temperature dependence of the CMC. It is the relationship of energy between the solid crystalline state and the micellar solution that determines the Krafft temperature. The Krafft point is strongly influenced by the length of the alkyl chain. The headgroup of the surfactant and counterions has a strong influence on the Krafft point as well were salt addition increases the Krafft point. Packing parameter, which is also influenced by temperature, can change the Krafft point drastically. For cationic surfactant and counterions, bromide has the highest Krafft point, higher than for chloride and iodide.
Figure 7: The Krafft point or the Krafft temperature is a form of phase changes, a minimum temperature at which surfactants can form micelles i.e. below this temperature micelles cannot be formed.
12
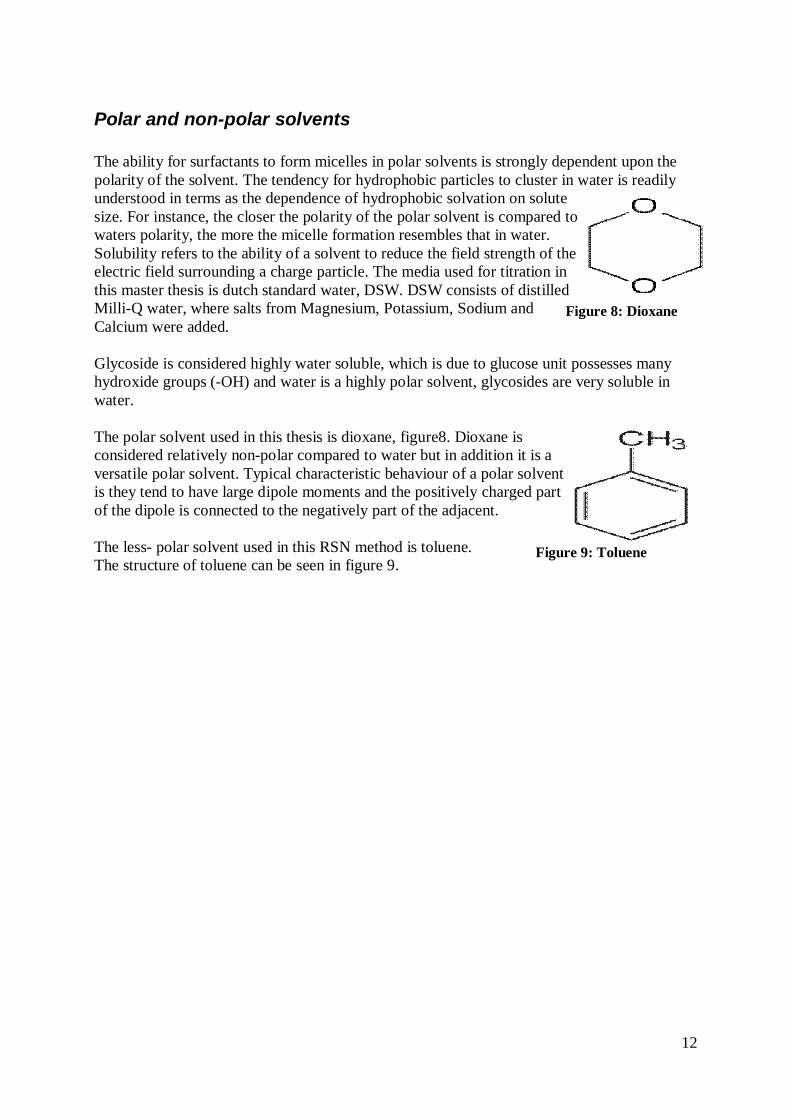
Polar and non-polar solvents The ability for surfactants to form micelles in polar solvents is strongly dependent upon the polarity of the solvent. The tendency for hydrophobic particles to cluster in water is readily understood in terms as the dependence of hydrophobic solvation on solute size. For instance, the closer the polarity of the polar solvent is compared to waters polarity, the more the micelle formation resembles that in water. Solubility refers to the ability of a solvent to reduce the field strength of the electric field surrounding a charge particle. The media used for titration in this master thesis is dutch standard water, DSW. DSW consists of distilled Milli-Q water, where salts from Magnesium, Potassium, Sodium and Calcium were added. Glycoside is considered highly water soluble, which is due to glucose unit possesses many hydroxide groups (-OH) and water is a highly polar solvent, glycosides are very soluble in water. The polar solvent used in this thesis is dioxane, figure8. Dioxane is considered relatively non-polar compared to water but in addition it is a versatile polar solvent. Typical characteristic behaviour of a polar solvent is they tend to have large dipole moments and the positively charged part of the dipole is connected to the negatively part of the adjacent. The less- polar solvent used in this RSN method is toluene. The structure of toluene can be seen in figure 9.
Figure 9: Toluene
Figure 8: Dioxane
13
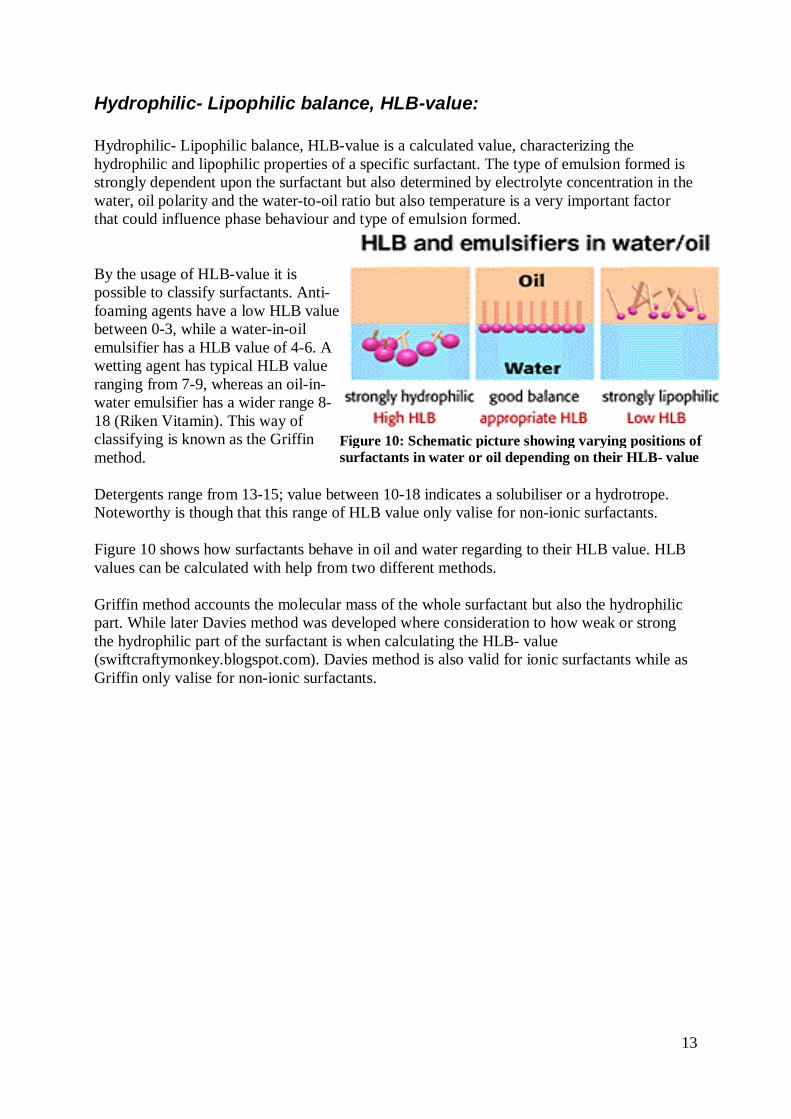
Hydrophilic- Lipophilic balance, HLB-value: Hydrophilic- Lipophilic balance, HLB-value is a calculated value, characterizing the hydrophilic and lipophilic properties of a specific surfactant. The type of emulsion formed is strongly dependent upon the surfactant but also determined by electrolyte concentration in the water, oil polarity and the water-to-oil ratio but also temperature is a very important factor that could influence phase behaviour and type of emulsion formed. By the usage of HLB-value it is possible to classify surfactants. Anti-foaming agents have a low HLB value between 0-3, while a water-in-oil emulsifier has a HLB value of 4-6. A wetting agent has typical HLB value ranging from 7-9, whereas an oil-in-water emulsifier has a wider range 8-18 (Riken Vitamin). This way of classifying is known as the Griffin method. Detergents range from 13-15; value between 10-18 indicates a solubiliser or a hydrotrope. Noteworthy is though that this range of HLB value only valise for non-ionic surfactants. Figure 10 shows how surfactants behave in oil and water regarding to their HLB value. HLB values can be calculated with help from two different methods. Griffin method accounts the molecular mass of the whole surfactant but also the hydrophilic part. While later Davies method was developed where consideration to how weak or strong the hydrophilic part of the surfactant is when calculating the HLB- value (swiftcraftymonkey.blogspot.com). Davies method is also valid for ionic surfactants while as Griffin only valise for non-ionic surfactants.
Figure 10: Schematic picture showing varying positions of surfactants in water or oil depending on their HLB- value
14
Log Pow- Octanol- water partition coefficient The OECD, organisation for economic Co-operation and Development, has three different standards to outline bioaccumulation of chemicals. The octanol- water partition coefficient method is accepted experimentally for measuring the bioaccumulation of chemicals. This method is a standard for legalisation when characterising the surfactants ability to accumulate within living organisms. There are three different methods used and most commonly for determination of the octanol- water partition coefficient is the shake-flask method, OECD 107 (Henry Wiggins). OECD 117, high performance liquid chromatography (HPLC), compares retention time of the specific chemical/ surfactant and the result is compared to a reference sample with known retention time and logPow. OECD 123 is the third used and approved method and is a slow-stir method. This method was mainly developed and used to support the shake-flask method. In this method it is possible for octanol droplets to form in the water phase. Since these methods have limitation when measuring the accumulation of surfactants due to their ability to self-associate, to stabilize emulsions, to foam and to concentrate at an oil-/ water interface it is desirable to investigate other possibilities to determine the bioaccumulation potential of surfactants.
Relative solubility number- RSN Relative solubility number, RSN, is contrary to the HLB- value an empirically determined value to characterize water solubility and the hydrophobic- hydrophilic character of a surfactant. It is commonly used to characterize emulsifier. The RSN value is defined as the amount of distilled water necessary to be added to a solvent system in order to produce persistent turbidity. Commonly a mixture of benzene/ dioxane was used as a solvent system. A laboratory test was conducted at Akzo Nobel showing that tetrahydrofuran and toluene also could be used for measure RSN we decided to use dioxane/ toluene, which is also commonly used, as a solvent system. The properties of these two phases and the composition of them together give understanding to the mechanism behind this RSN method. When water is started to be titrated into the solvent, consisting of dioxane and toluene, dioxane dissolves both water and toluene. At a certain point where the water percentage becomes high enough, dioxane can no longer hold the toluene and water together whereas water will separate out, forming a water rich phase. This is the point where the solution gets turbid. Addition of surfactants will influence the solvent system. A more hydrophobic surfactant will pronounce the hydrophobicity of the solvent system, while the hydrophilic headgroup are hydrated with water molecules. I.e.: the amount of water that the solvent system can handle is depending on the hydrophobic-hydrophilic characters of the surfactants.

15
When a hydrophobic surfactant is present in this solvent system, the hydrophobic character of the solvent system is pronounced and less water is needed to cause phase separation. On the other hand, if the surfactant is more hydrophilic, the headgroup of the surfactant binds to water because of hydration resulting in more water needed in order to cause phase separation and turbidity. To measure RSN the method uses 1 gram product and 30 ml solution consisting of 96 wt%- dioxane and 4 wt%- toluene. The RSN value is a number, where higher number indicates a more water soluble product while a more oil- soluble product has a lower number. Studies have been performed to find an even less toxic solvent systems resulting in an usage of toluene and ethylene glycol dimethylether (EGDE) instead of dioxane. The optimum analyse conditions, compared to the original method, seemed to be with 2.6 wt%- toluene. It is known that EGDE is miscible with water while toluene is immiscible in water (Jiangying Wu, 2003). A product with a RSN value < 13 is considered insoluble in water, while 13<RSN>17 are dispersible at low concentrations. Solubility in water is indicated by a RSN value > 17. Unfortunately, there is not that much available measured RSN- values in open literature, even though it is commonly used as characterising water solubility of surfactants. The surfactant concentration influences the RSN value while measuring. Studies show that RSN value greater than 20 with increased concentration of surfactant gives a more pronounced difference of the RSN value. While for a RSN value less than 20 would have the opposite effect if surfactant concentration would be increased. This characteristic behaviour could be explained from the chemical properties that surfactant possess. Greater RSN value indicates a more hydrophilic surfactant and to hydrate the polar headgroup, more water is needed before the solution becomes turbid. Both RSN and HLB determine similar properties of surfactants, where a higher value indicates higher water solubility, while a lower value refers to a less water soluble surfactant. Hence, to generalise all surfactants and find a universal correlation between RSN and HLB for all categories of surfactants has not yet been investigated and this task seems challenging. There is a good correlation within specific families of surfactants. RSN value is referred to as the amount of water needed to add to produce persistent turbidity.

16
Bioaccumulation potential of surfactants On December the 18th 2006, REACH a system handling registration, evaluation, authorisation and restriction of chemicals, was introduced as a regulation within the European Union (EU). The regulation requires all chemicals produced or imported within the EU in greater volume of one ton a year to be registered and classified with respect to this new system (Jon Arnot, 2010). REACH was introduced mainly to control the environmental and human impact of chemicals but also to phase out harmful chemicals. The concept of sustainability is a hot topic these days whereas research within this field is expanding. This knowledge is supporting the interest further to investigate possibilities to use RSN instead of logPow for determination of bioaccumulation potential of surfactants. Surfactants used in everyday life reaches our sewers and it is the rate of biodegradation there that determines the amount that actually reaches our environment. Hence, it is of great importance to evaluate these surfactants and to understand how they act when exposed to the nature but also determine whether biodegradation, bioaccumulation and biomagnifications of individual surfactant possess a risk to the environment. Anionic surfactant encounter for 60-70% of yearly production of all surfactants produced but it is nonionic surfactants that are most widely used. Even so, a big concern regarding degradation is focused on alkylphenol ethoxylates and there weak endocrine disruptor activity (Payne, 2001). Alkylphenols will be discussed further on in section 2.12.1. The current methods used today to determine bioaccumulation for surfactant is measured by logPow, the octanol- water partition coefficient. This partitioning measure seems slightly inappropriate, due to that surfactants and highly hydrophobic chemicals have a large tendency to adsorb at surfaces and to accumulate at interfaces. Surfactants are held below CMC level for each individual surfactant when logPow is determined. The logPow value is the accumulation factors of a monomer were no consideration to micellization or emulsion formation is taken into account. Generally, surfactants seem to have a high impact on aquatic organisms and their respiratory mechanism and structure. Effects are seen at both higher organisms, such as fishes but also on lower organisms such as algae. The epithelial membrane on fishes is extensively folded and provides a large surface area. Since surfactants have the tendency to accumulate on surfaces in first hand, their adsorption would lead to changes in the membrane permeability, cellular lysis and impairment of cellular respiration. Here the surfactants would cause destabilisation of these epithelial. Surface toxicity in lower organisms appears due to initial disruption of normal membrane function followed by physical disruption of the cellular membrane (Payne, 2001). Cationic and anionic surfactant possesses the ability to accumulate on oppositely charged surfaces to a higher extent than neutral surfactant due to the charged headgroup, resulting in a stronger adsorption to surfaces.
17
Bioaccumulation When assessing the environmental effect of surfactants it is important to consider the surfactants synergistic effects on migration, dispersion, and bioavailability. Guideline accepts a certain increase in bioavailability of other substances in preparation, but due to this issue when assessing bioaccumulation of surfactant it is important to consider as many factors as possible. Chemistry, metabolism, degradability and potential breakdown products of the chemical will influence the bioaccumulation to some extent. Bioaccumulation potential can be calculated by using bioconcentration factor, bioaccumulation factor and biomagnifications factor. Bioconcentration is the direct uptake thought a medium via skin, gills or lungs while biomagnifications is a consequence of dietary uptake. The potential of bioaccumulation for different surfactants can be characterized as the extent to which the concentration of a contaminant in an organism exceeds that of its environment. A study shows that assessment of surfactants and their bioaccumulation potential if strongly influenced by chainlength. An increase in the hydrophobic chain will increase bioaccumulation potential, contrary to if the hydrophilic chain of the surfactant (independent of non-, cat or anionic) will decrease the bioaccumulation potential.
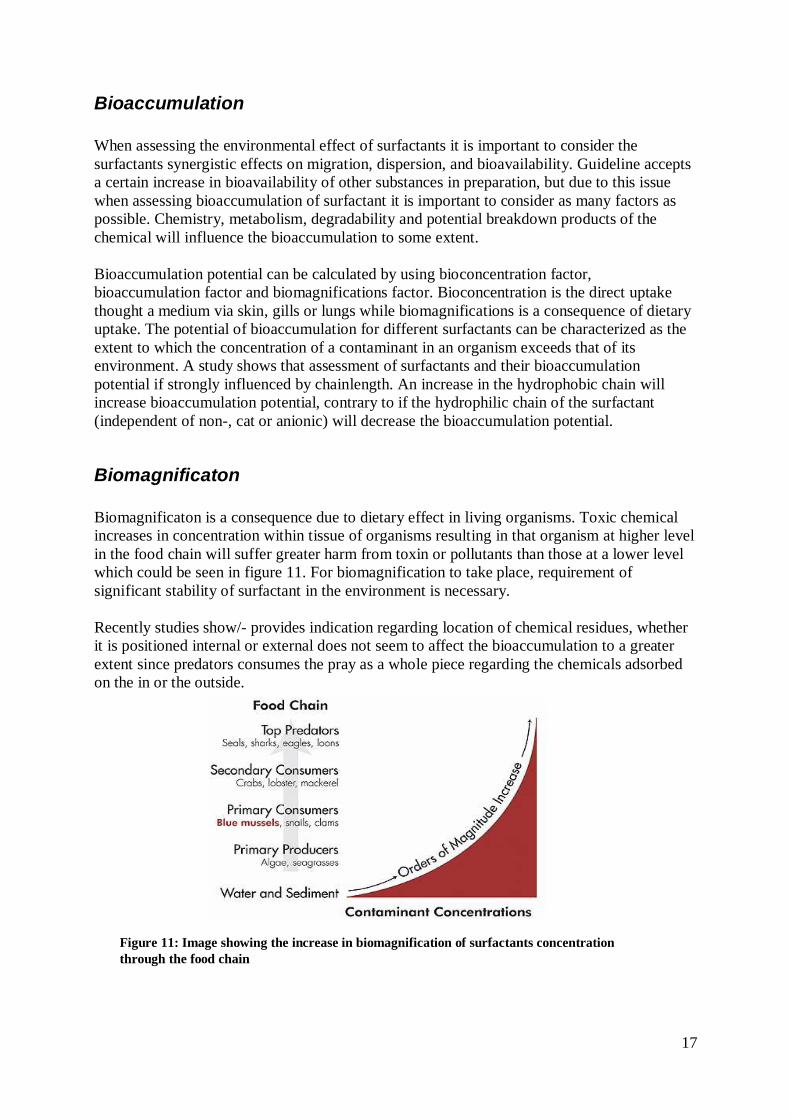
Biomagnificaton Biomagnificaton is a consequence due to dietary effect in living organisms. Toxic chemical increases in concentration within tissue of organisms resulting in that organism at higher level in the food chain will suffer greater harm from toxin or pollutants than those at a lower level which could be seen in figure 11. For biomagnification to take place, requirement of significant stability of surfactant in the environment is necessary. Recently studies show/- provides indication regarding location of chemical residues, whether it is positioned internal or external does not seem to affect the bioaccumulation to a greater extent since predators consumes the pray as a whole piece regarding the chemicals adsorbed on the in or the outside.
Figure 11: Image showing the increase in biomagnification of surfactants concentration through the food chain

18
Biodegradation Biodegradation is an enzymatic reaction occurring within the nature. If this reaction is not naturally occurring, then the surfactant is thought of as a pesticide in the environment. This type of reaction is influenced by both temperature and pH, but also the concentration of surfactant makes a difference. It is important to understand the parameters influencing biodegradability of surfactants. Most importantly, surfactant needs to have some tendency for water solubility due to bioavailability is greater as surfactants are mainly exposed to microorganism in the water phase. However, it is the initial degradation that might lead to intermediates with very limited water solubility. A well known example is the alkyl phenols ethoxylates. Enzymatic catalyst functions better if the surfactants contain bonds that are easily broken down. Commonly during manufacturing, weaker bond is introduced within the structure and usually they are inserted between the hydrophobic tail and the head group due to synthetic reasons. Branching also influences biodegradation; the trend is more branched, less biodegradable. It is the branching of the non-polar part of the surfactants causes steric hindrance of the side groups of the surfactant into the active site of the enzyme.
Biodegradability of different surfactants varies in rate, a fatty acid is usually degraded in 1-2 hours, while for a branched alkylbenzene sulfonate the rate could exceed months. Toxicity of surfactant varies between different classes of surfactant; variation with several orders of magnitude has been noted (Payne, 2001). Thought charged surfactants, especially cationic surfactants, have a greater denatureting effect than neutral chemicals and it seems as cations have the greatest effect regarding toxicity and bioconcentration factor, BCF, for organism. As stated earlier, the bioconcentration factor is the result of compound uptake from surrounding medium and elimination to the medium. The surfactant toxicity varies between the same categories of surfactant. For instance, the length of an alkyl chain for an alcohol ethoxylate will change the direct toxicity of the surfactant. For a non-ionic alcohol ethoxylate it is possible to increase water solubility and decrease toxicity by increasing the length of the ethoxylates chain. The potential of a surfactant to bioaccumulate regarding these different properties will result in an increase of BCF with increase in alkyl chain length (Payne, 2001).
19
Alkylphenol:
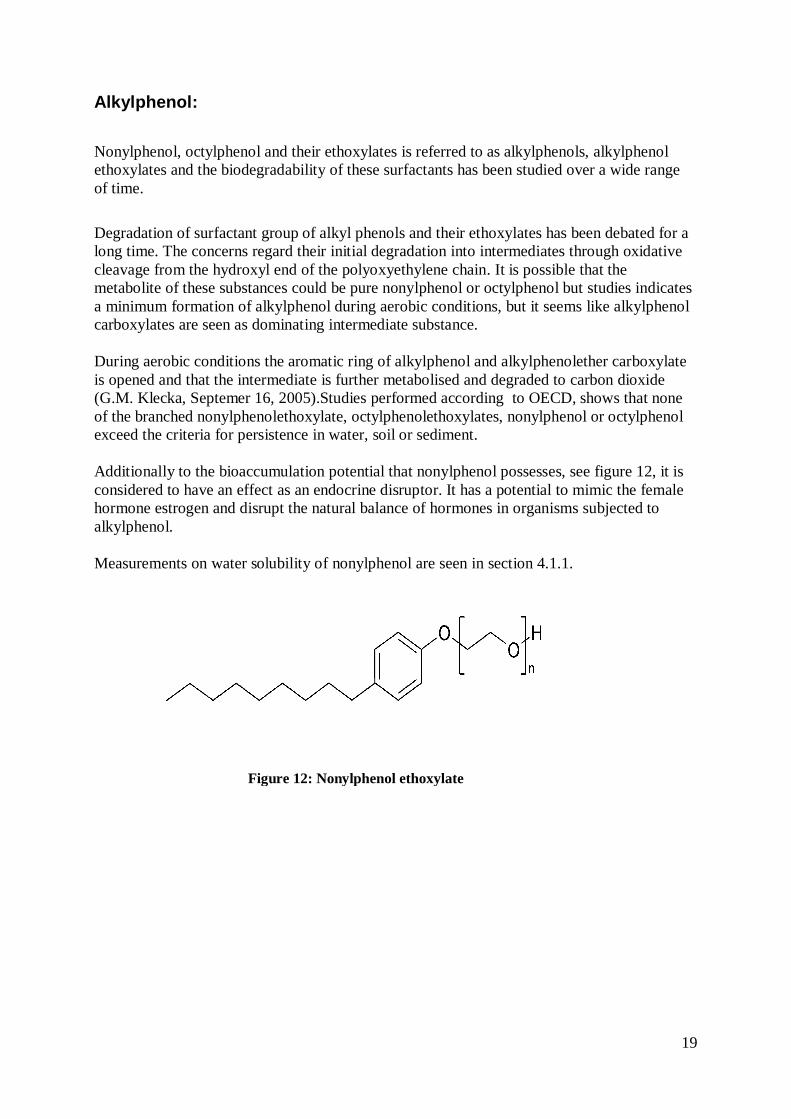
Nonylphenol, octylphenol and their ethoxylates is referred to as alkylphenols, alkylphenol ethoxylates and the biodegradability of these surfactants has been studied over a wide range of time. Degradation of surfactant group of alkyl phenols and their ethoxylates has been debated for a long time. The concerns regard their initial degradation into intermediates through oxidative cleavage from the hydroxyl end of the polyoxyethylene chain. It is possible that the metabolite of these substances could be pure nonylphenol or octylphenol but studies indicates a minimum formation of alkylphenol during aerobic conditions, but it seems like alkylphenol carboxylates are seen as dominating intermediate substance. During aerobic conditions the aromatic ring of alkylphenol and alkylphenolether carboxylate is opened and that the intermediate is further metabolised and degraded to carbon dioxide (G.M. Klecka, Septemer 16, 2005).Studies performed according to OECD, shows that none of the branched nonylphenolethoxylate, octylphenolethoxylates, nonylphenol or octylphenol exceed the criteria for persistence in water, soil or sediment. Additionally to the bioaccumulation potential that nonylphenol possesses, see figure 12, it is considered to have an effect as an endocrine disruptor. It has a potential to mimic the female hormone estrogen and disrupt the natural balance of hormones in organisms subjected to alkylphenol. Measurements on water solubility of nonylphenol are seen in section 4.1.1.
Figure 12: Nonylphenol ethoxylate

20
Experimental part This master thesis has its nature in finding a correlation between RSN, relative solubility number, and HLB, which later could be used for characterizing bioaccumulation potential of different surfactants. It is desirable to find this correlation and use this as an alternative to Log Pow. Log Pow is as described in previous sections, a complicated and time-consuming method used for determining the bioaccumulation of surfactants. The water solubility was measured with a Multi Parameter-Scanning instrument, MPS, and the result is presented in the Result part of this teases. To estimate the reliability of these values they were compared with calculated values taken from the evaluation program, EPI-suite. Notable is however that there are several calculation and evaluation programs to chose from but EPI-suite is considered a reliable one.
MPS- Scanalys instrument MPS is an instrument that has been developed by Scanalys. The benefit of this instrument is that it has capacity to measure many parameters at the same time, such as like turbidity, conductivity, pH and viscosity. The Scanalys instrument can be seen in figure 13. The sample liquid is placed in the sample cup which is visible if the viscosity meter is lifted up. Titration of liquid or a solvent is possible through the burette and on this model of MPS it is possible to titrate two liquids at the same time. Connected to this analysis instrument is a cooling system. This cooling system makes it possible to measure at set temperature, isothermal conditions. In order to understand the concept of MPS-1, method development is a necessary aspect. Original RSN method using dioxane and toluene as solvent system might not be the from an environmental point of view friendliest, but in order to understand the system and analysis result from MPS-1 it was decided to use these solvents. Obviously, with the demands of sustainability and environmental topics of today society it is desirable to investigate in newer, environmentally friendly solvents in order to meet the today demands of sustainability.
Figure 13: Image indicating the Multi Parameter Scanning, MPS instrument used in this master thesis for measuring the RSN values of the surfactants selected
21
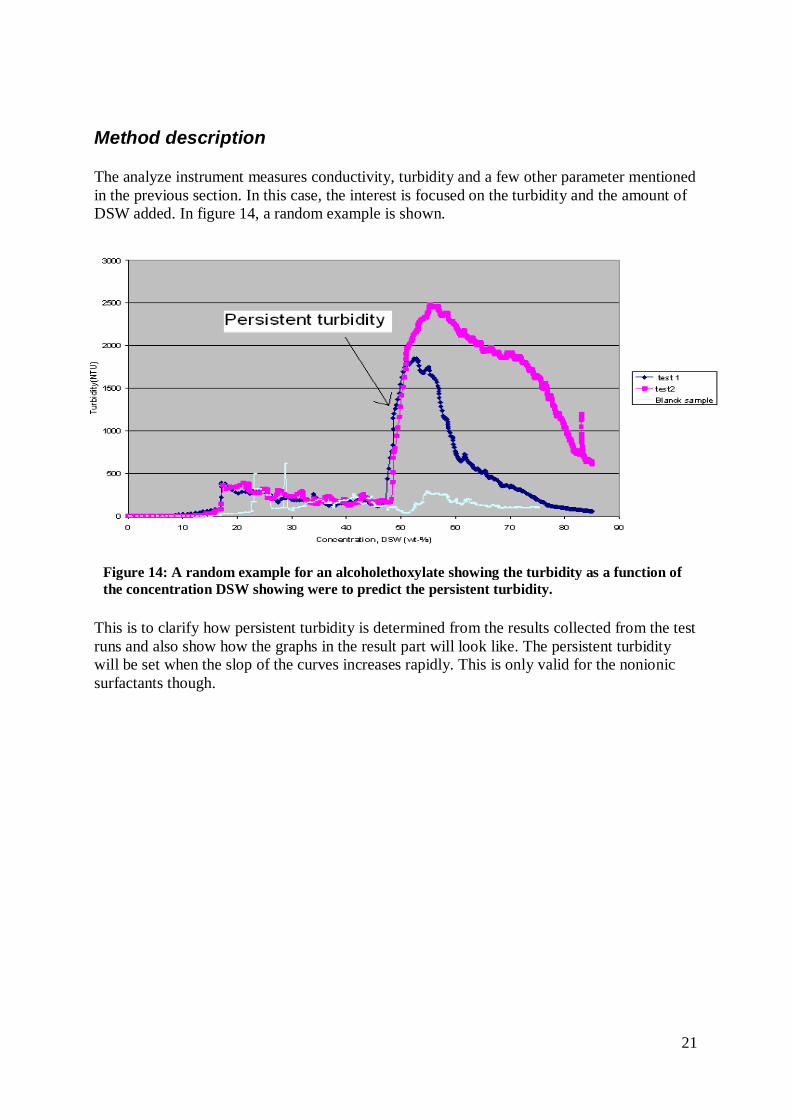
Method description The analyze instrument measures conductivity, turbidity and a few other parameter mentioned in the previous section. In this case, the interest is focused on the turbidity and the amount of DSW added. In figure 14, a random example is shown.
This is to clarify how persistent turbidity is determined from the results collected from the test runs and also show how the graphs in the result part will look like. The persistent turbidity will be set when the slop of the curves increases rapidly. This is only valid for the nonionic surfactants though.
Figure 14: A random example for an alcoholethoxylate showing the turbidity as a function of the concentration DSW showing were to predict the persistent turbidity.
22
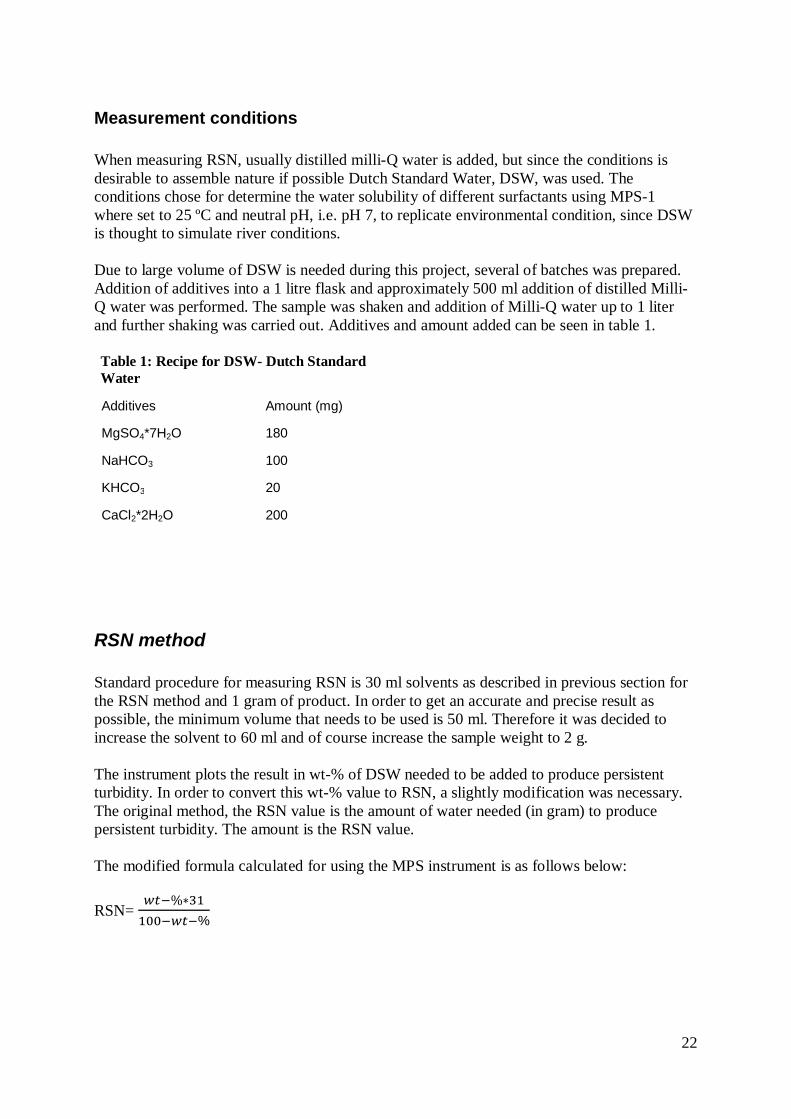
Measurement conditions When measuring RSN, usually distilled milli-Q water is added, but since the conditions is desirable to assemble nature if possible Dutch Standard Water, DSW, was used. The conditions chose for determine the water solubility of different surfactants using MPS-1 where set to 25 ºC and neutral pH, i.e. pH 7, to replicate environmental condition, since DSW is thought to simulate river conditions. Due to large volume of DSW is needed during this project, several of batches was prepared. Addition of additives into a 1 litre flask and approximately 500 ml addition of distilled Milli-Q water was performed. The sample was shaken and addition of Milli-Q water up to 1 liter and further shaking was carried out. Additives and amount added can be seen in table 1. Table 1: Recipe for DSW- Dutch Standard Water
Additives Amount (mg)
MgSO4*7H2O 180
NaHCO3 100
KHCO3 20
CaCl2*2H2O 200
RSN method Standard procedure for measuring RSN is 30 ml solvents as described in previous section for the RSN method and 1 gram of product. In order to get an accurate and precise result as possible, the minimum volume that needs to be used is 50 ml. Therefore it was decided to increase the solvent to 60 ml and of course increase the sample weight to 2 g. The instrument plots the result in wt-% of DSW needed to be added to produce persistent turbidity. In order to convert this wt-% value to RSN, a slightly modification was necessary. The original method, the RSN value is the amount of water needed (in gram) to produce persistent turbidity. The amount is the RSN value. The modified formula calculated for using the MPS instrument is as follows below: RSN=
%
23
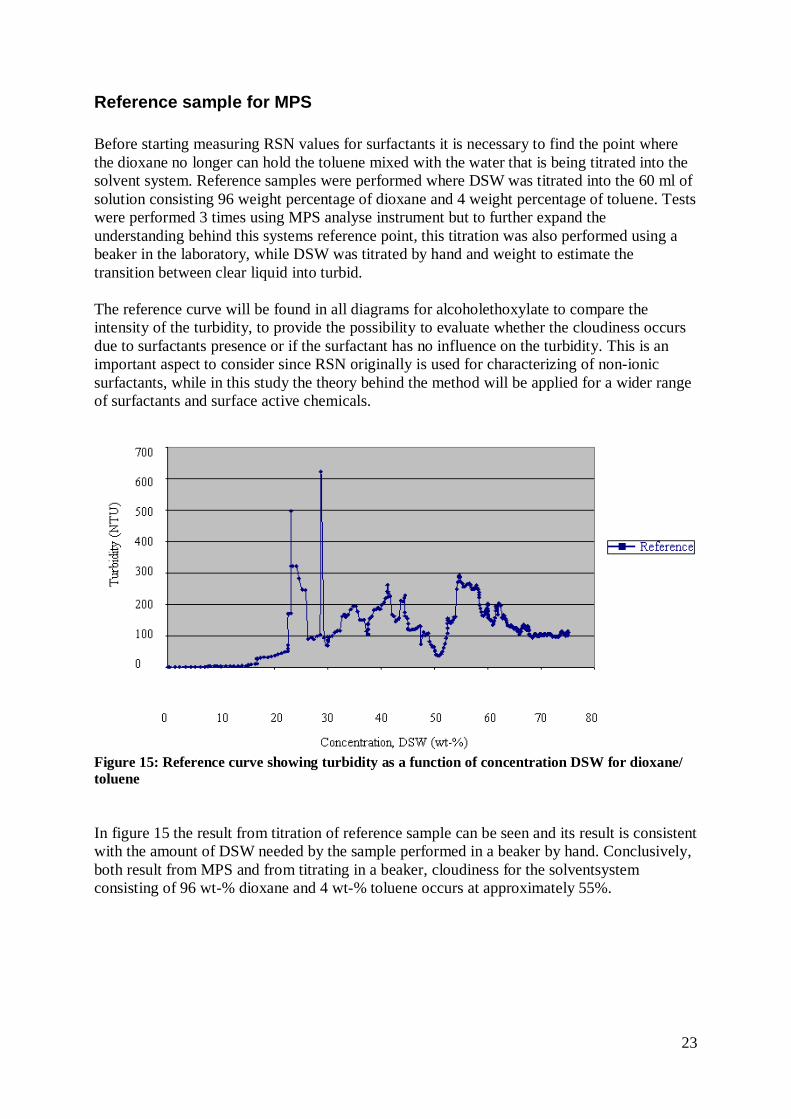
Reference sample for MPS Before starting measuring RSN values for surfactants it is necessary to find the point where the dioxane no longer can hold the toluene mixed with the water that is being titrated into the solvent system. Reference samples were performed where DSW was titrated into the 60 ml of solution consisting 96 weight percentage of dioxane and 4 weight percentage of toluene. Tests were performed 3 times using MPS analyse instrument but to further expand the understanding behind this systems reference point, this titration was also performed using a beaker in the laboratory, while DSW was titrated by hand and weight to estimate the transition between clear liquid into turbid. The reference curve will be found in all diagrams for alcoholethoxylate to compare the intensity of the turbidity, to provide the possibility to evaluate whether the cloudiness occurs due to surfactants presence or if the surfactant has no influence on the turbidity. This is an important aspect to consider since RSN originally is used for characterizing of non-ionic surfactants, while in this study the theory behind the method will be applied for a wider range of surfactants and surface active chemicals.
Figure 15: Reference curve showing turbidity as a function of concentration DSW for dioxane/ toluene In figure 15 the result from titration of reference sample can be seen and its result is consistent with the amount of DSW needed by the sample performed in a beaker by hand. Conclusively, both result from MPS and from titrating in a beaker, cloudiness for the solventsystem consisting of 96 wt-% dioxane and 4 wt-% toluene occurs at approximately 55%.

24
Chemical structure for surfactants used and measured The original RSN method is developed for nonionic surfactants and is widely used for characterising the specific properties that surfactants can possess. Therefore, the main focus in the experimental part is nonionic surfactant, especially alcohoethoxylate. In the sections below the chemical structure of all surfactant used in this study can be viewed.
Preparation of alcoholethoxylates Alcohol ethoxylated with different amount of mole EO was produced in laboratory scale at Akzo Nobel. The hydrophobic part consists of C12, dodecanol, and different mole of EO was reacted with the alcohol during alkaline conditions. Since Akzo Nobel produces alcohol ethoxylates it is of interest to see trend and correlation between the amount of mole EO and water solubility. In the first step an addition of 762.7 g of dodecanol into a reactor with a volume of 2 m3 together with KOH was carried out. The alcohol, dodecanol, was catalysed under vacuum. Before the EO was added the temperature was raised to 160 °C and the maximum pressure that was allowed during ethoxylation is 4.5 bar a. The structure of the alcohol ethoxylate serie produced will be seen further down in the report. The alcohol ethoxylate manufactured can be viewed in table 2 below.
n=8
Alcoholethoxylate
Table 2: Alcohol ethoxylates used in the study
C12-2EO C12-4EO n=2 C12-6EO n=4
C12-8EO n=6
C12-10EO
OOH
OO
OOH
n
OO
OOH
n
OO
OOH
n
OO
OOH
n
25
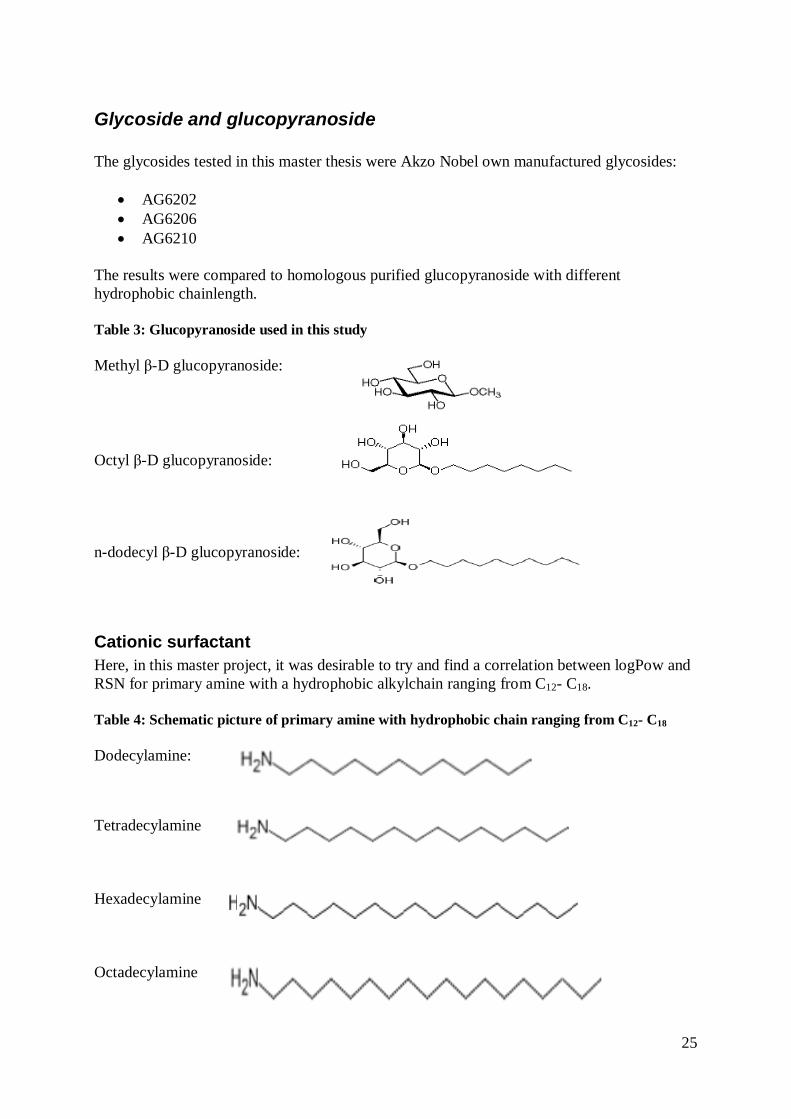
Glycoside and glucopyranoside The glycosides tested in this master thesis were Akzo Nobel own manufactured glycosides:
AG6202 AG6206 AG6210
The results were compared to homologous purified glucopyranoside with different hydrophobic chainlength. Table 3: Glucopyranoside used in this study Methyl -D glucopyranoside: Octyl -D glucopyranoside: n-dodecyl -D glucopyranoside:
Cationic surfactant Here, in this master project, it was desirable to try and find a correlation between logPow and RSN for primary amine with a hydrophobic alkylchain ranging from C12- C18.
Table 4: Schematic picture of primary amine with hydrophobic chain ranging from C12- C18 Dodecylamine: Tetradecylamine Hexadecylamine Octadecylamine
26
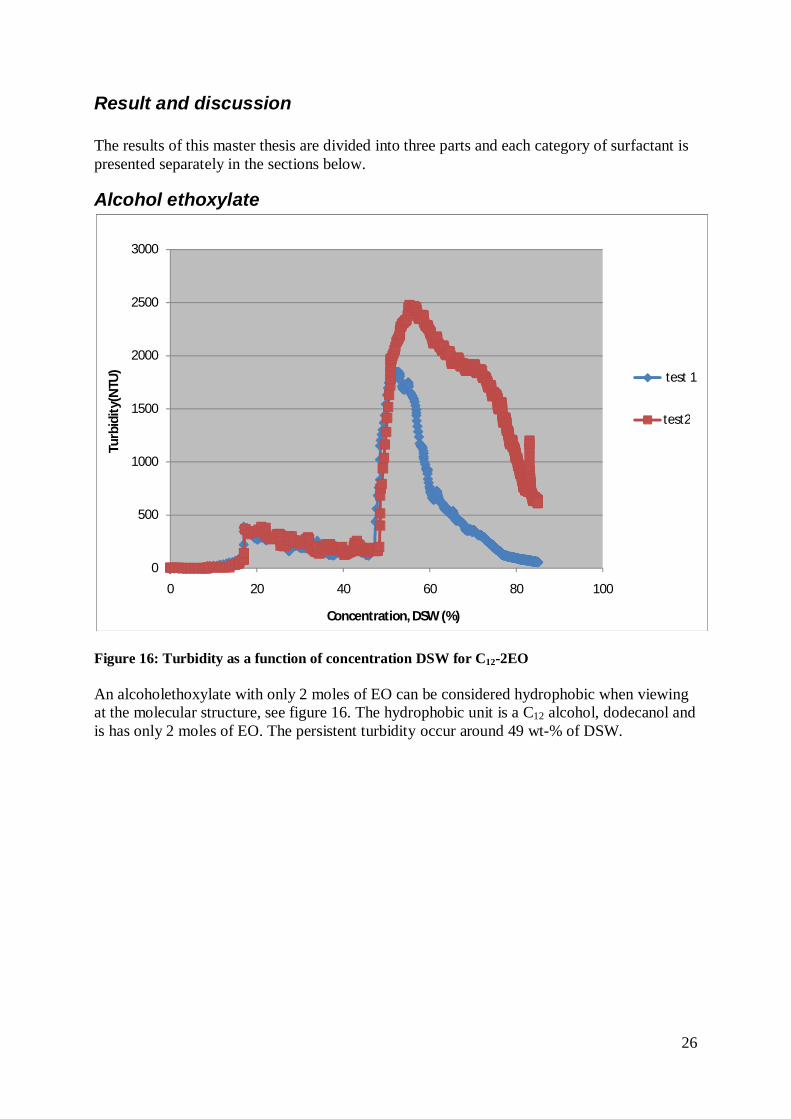
Result and discussion The results of this master thesis are divided into three parts and each category of surfactant is presented separately in the sections below.
Alcohol ethoxylate
Figure 16: Turbidity as a function of concentration DSW for C12-2EO An alcoholethoxylate with only 2 moles of EO can be considered hydrophobic when viewing at the molecular structure, see figure 16. The hydrophobic unit is a C12 alcohol, dodecanol and is has only 2 moles of EO. The persistent turbidity occur around 49 wt-% of DSW.
0
500
1000
1500
2000
2500
3000
0 20 40 60 80 100
Turb
idit
y(N
TU)
Concentration, DSW (%)
test 1
test2

27
Figure 17: Turbidity as a function of concentration DSW for C12-4EO
Figure 18: Turbidity as a function of concentration DSW of homologue pure C12-4EO For a dodecanol with 4 moles of EO, the turbidity should be pushed a little bit further. The hydrophilic part has become one EO unit longer, and the result is conclusive with the theory. Water solubility depends on the length of the hydrophilic part in this case since the hydrophobic chain of the ethoxylates is still the same. Persistent turbidity was set to 52 wt- %. Homologues pure C12 with 4 mole of EO was compared to the non-ionic ethoxylates manufactured at the laboratory to see the effect from EO distribution. Comparing figure 17 and 18 concludes that EO distribution does not influence water solubility for nonionic alcohol ethoxylates.
0
1000
2000
3000
4000
5000
6000
7000
0 10 20 30 40 50 60 70 80 90
Turb
idit
y (N
TU)
Concentration, DSW (%)
test 1
test 2
0
500
1000
1500
2000
2500
0 20 40 60 80 100
Turb
idit
y, (N
TU)
Concentration DSW, (%)
test 1
test 2
28
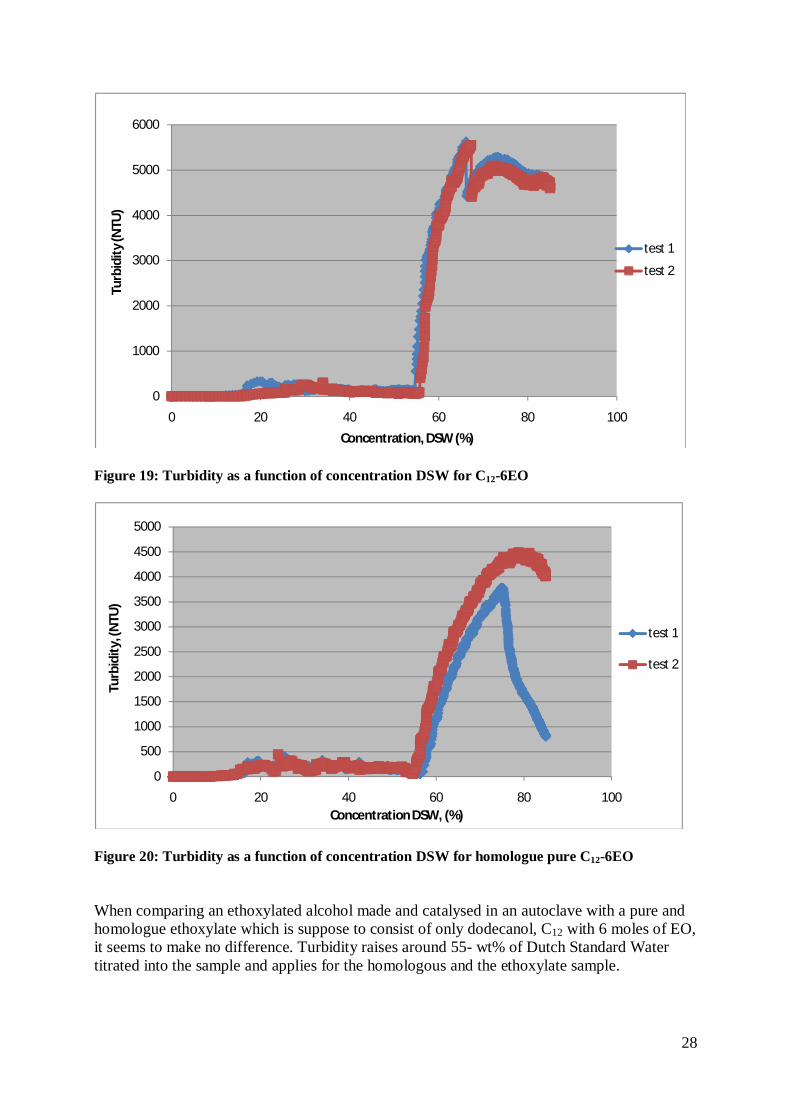
Figure 19: Turbidity as a function of concentration DSW for C12-6EO
Figure 20: Turbidity as a function of concentration DSW for homologue pure C12-6EO When comparing an ethoxylated alcohol made and catalysed in an autoclave with a pure and homologue ethoxylate which is suppose to consist of only dodecanol, C12 with 6 moles of EO, it seems to make no difference. Turbidity raises around 55- wt% of Dutch Standard Water titrated into the sample and applies for the homologous and the ethoxylate sample.
0
1000
2000
3000
4000
5000
6000
0 20 40 60 80 100
Turb
idit
y (N
TU)
Concentration, DSW (%)
test 1
test 2
0
500
1000
1500
2000
2500
3000
3500
4000
4500
5000
0 20 40 60 80 100
Turb
idit
y, (N
TU)
Concentration DSW, (%)
test 1
test 2

29
It seems like EO-distribution has a small impact on the water solubility potential. An easy way to conclude the distribution of EO is to run a GC, gas chromatography over the sample. The results from both NMR and GC concluding both EO distribution of an alcohol ethoxylate manufactured in an autoclave as well as for the homologue pure ethoxylate can be seen in appendix 5.
Figure 21: Turbidity as a function of concentration DSW for C12-8EO
Figure 22: Turbidity as a function of concentration DSW for homologue pure C12-6EO
0
1000
2000
3000
4000
5000
6000
7000
0 20 40 60 80 100
Turb
idit
y (N
TU)
Concentration, DSW (%)
test2
test3
0
1000
2000
3000
4000
5000
6000
7000
0 20 40 60 80 100
Turb
idit
y (N
TU)
Concentration CSW (%)
test1
test2

30
The reproducibility for C12 with 8 mole of EO as seen in figure 21 is quite poor. Although when the homologues pure C12 with 8 moles were tested (see figure 22) there was no indication of separate result curves. Therefore, the water solubility potential for the ethoxylate with the EO distribution the second test is thought to be the accurate one. Turbidity seems to increase around 58-59 wt-% of DSW.
Figure 23: Turbidity as a function of concentration DSW for C12-10EO
The molecular structure of a dodecanol with 10 moles of EO, see figure 23 has basically the same length on the hydrophobic part as on the hydrophilic part. Comparison between a dodecanol alcohol with 8 moles and 10 moles of EO concludes almost no difference in water solubility. The EO distribution for these two substances is not that big in difference. Perhaps the water solubility potential would be greater if the hydrophobic part were changed into a longer or a shorter alkylchain.
0
500
1000
1500
2000
2500
3000
3500
4000
4500
5000
0 10 20 30 40 50 60 70 80 90
Turb
idit
y(N
TU)
Concentration, DSW (%)
test 1
test 2
31
Nonylphenol
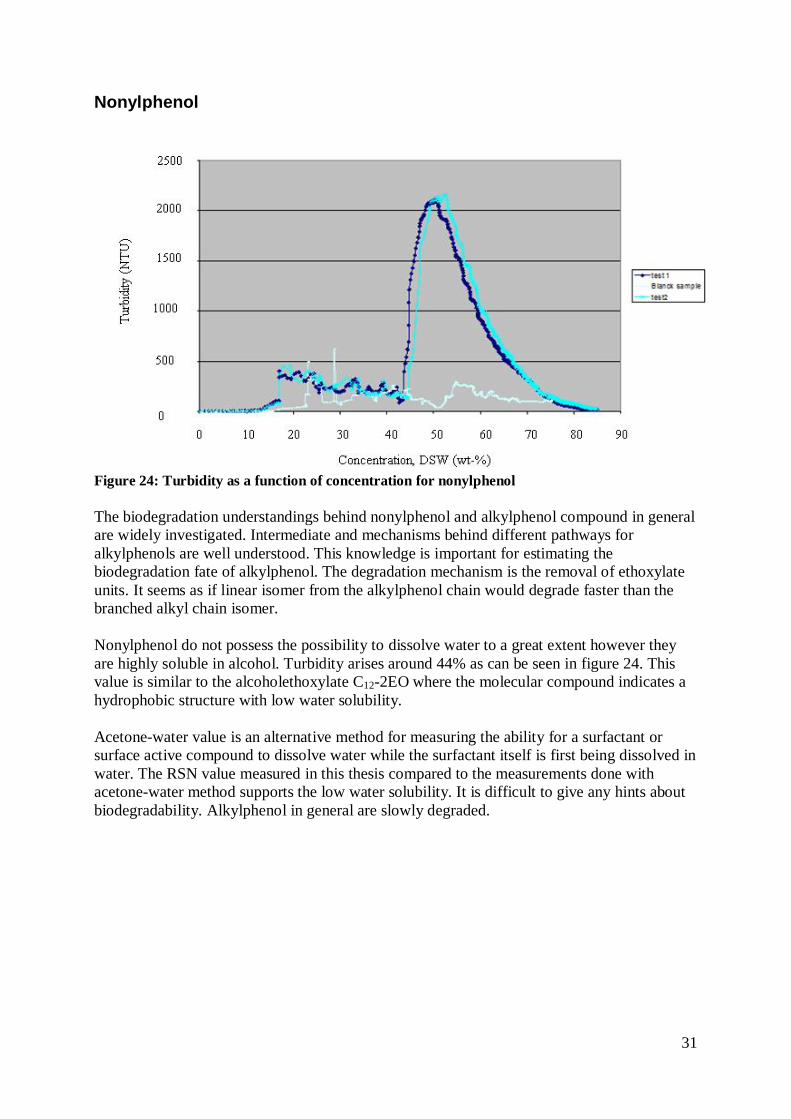
Figure 24: Turbidity as a function of concentration for nonylphenol The biodegradation understandings behind nonylphenol and alkylphenol compound in general are widely investigated. Intermediate and mechanisms behind different pathways for alkylphenols are well understood. This knowledge is important for estimating the biodegradation fate of alkylphenol. The degradation mechanism is the removal of ethoxylate units. It seems as if linear isomer from the alkylphenol chain would degrade faster than the branched alkyl chain isomer. Nonylphenol do not possess the possibility to dissolve water to a great extent however they are highly soluble in alcohol. Turbidity arises around 44% as can be seen in figure 24. This value is similar to the alcoholethoxylate C12-2EO where the molecular compound indicates a hydrophobic structure with low water solubility. Acetone-water value is an alternative method for measuring the ability for a surfactant or surface active compound to dissolve water while the surfactant itself is first being dissolved in water. The RSN value measured in this thesis compared to the measurements done with acetone-water method supports the low water solubility. It is difficult to give any hints about biodegradability. Alkylphenol in general are slowly degraded.
32
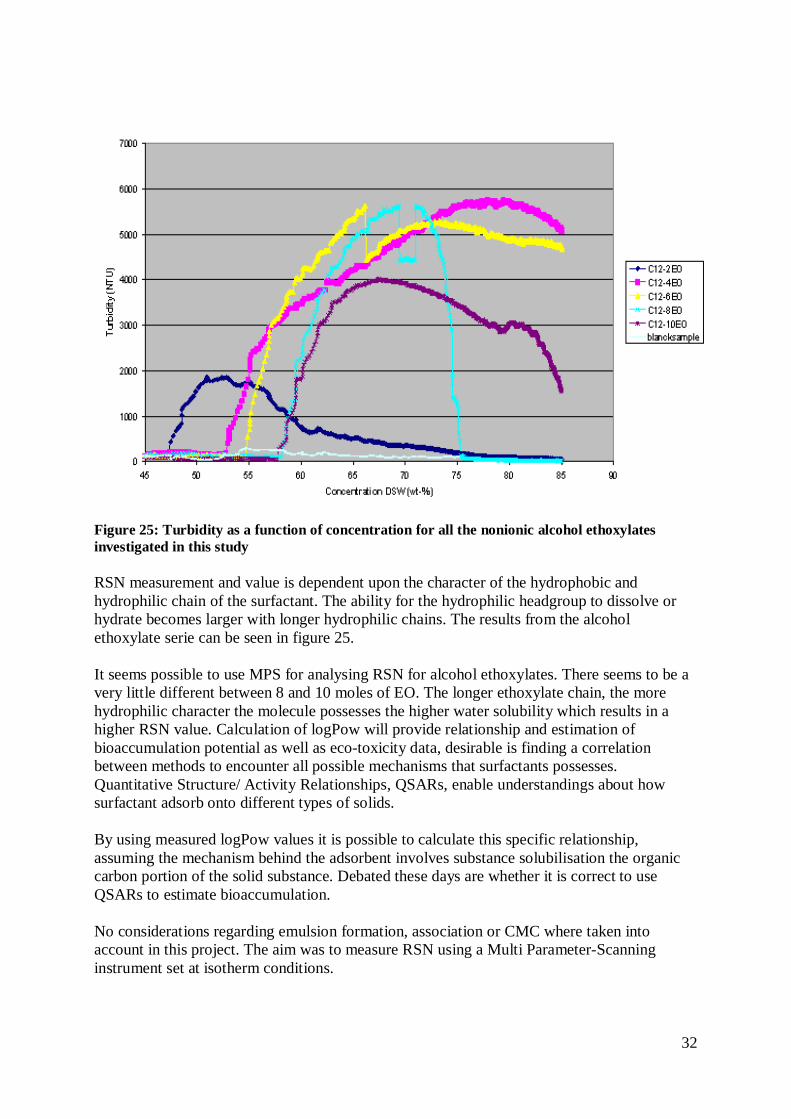
Figure 25: Turbidity as a function of concentration for all the nonionic alcohol ethoxylates investigated in this study RSN measurement and value is dependent upon the character of the hydrophobic and hydrophilic chain of the surfactant. The ability for the hydrophilic headgroup to dissolve or hydrate becomes larger with longer hydrophilic chains. The results from the alcohol ethoxylate serie can be seen in figure 25. It seems possible to use MPS for analysing RSN for alcohol ethoxylates. There seems to be a very little different between 8 and 10 moles of EO. The longer ethoxylate chain, the more hydrophilic character the molecule possesses the higher water solubility which results in a higher RSN value. Calculation of logPow will provide relationship and estimation of bioaccumulation potential as well as eco-toxicity data, desirable is finding a correlation between methods to encounter all possible mechanisms that surfactants possesses. Quantitative Structure/ Activity Relationships, QSARs, enable understandings about how surfactant adsorb onto different types of solids. By using measured logPow values it is possible to calculate this specific relationship, assuming the mechanism behind the adsorbent involves substance solubilisation the organic carbon portion of the solid substance. Debated these days are whether it is correct to use QSARs to estimate bioaccumulation. No considerations regarding emulsion formation, association or CMC where taken into account in this project. The aim was to measure RSN using a Multi Parameter-Scanning instrument set at isotherm conditions.
33
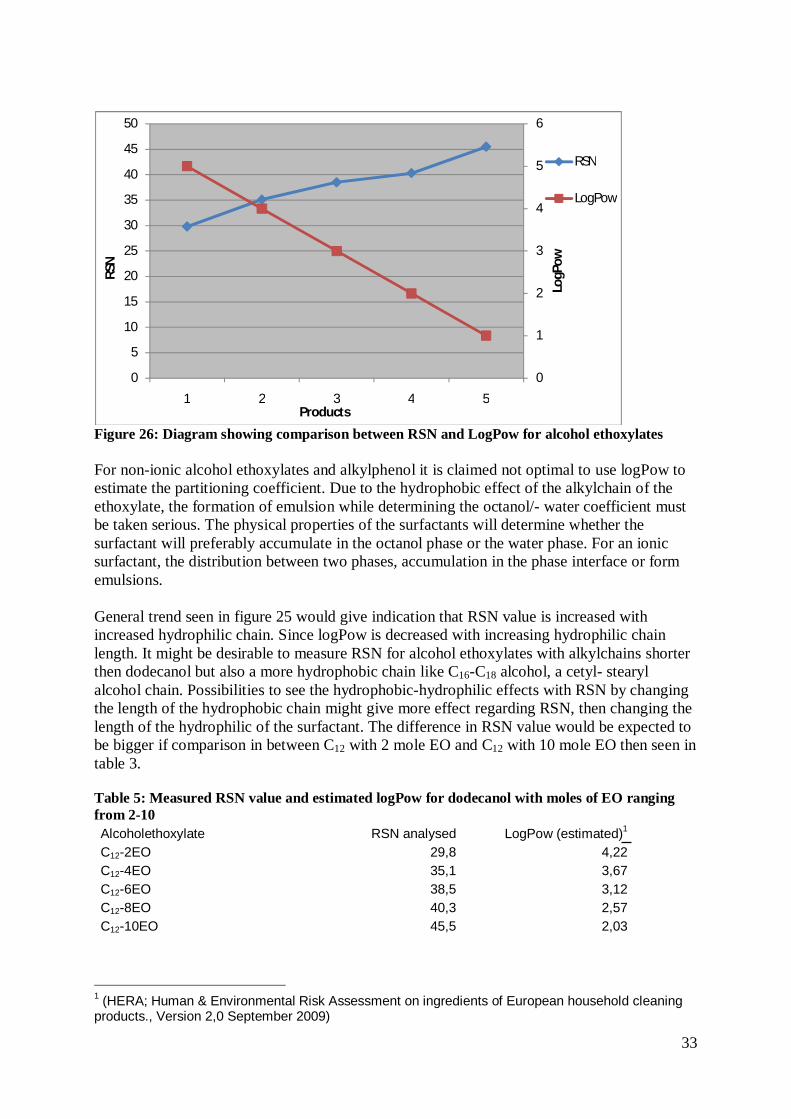
Figure 26: Diagram showing comparison between RSN and LogPow for alcohol ethoxylates For non-ionic alcohol ethoxylates and alkylphenol it is claimed not optimal to use logPow to estimate the partitioning coefficient. Due to the hydrophobic effect of the alkylchain of the ethoxylate, the formation of emulsion while determining the octanol/- water coefficient must be taken serious. The physical properties of the surfactants will determine whether the surfactant will preferably accumulate in the octanol phase or the water phase. For an ionic surfactant, the distribution between two phases, accumulation in the phase interface or form emulsions. General trend seen in figure 25 would give indication that RSN value is increased with increased hydrophilic chain. Since logPow is decreased with increasing hydrophilic chain length. It might be desirable to measure RSN for alcohol ethoxylates with alkylchains shorter then dodecanol but also a more hydrophobic chain like C16-C18 alcohol, a cetyl- stearyl alcohol chain. Possibilities to see the hydrophobic-hydrophilic effects with RSN by changing the length of the hydrophobic chain might give more effect regarding RSN, then changing the length of the hydrophilic of the surfactant. The difference in RSN value would be expected to be bigger if comparison in between C12 with 2 mole EO and C12 with 10 mole EO then seen in table 3. Table 5: Measured RSN value and estimated logPow for dodecanol with moles of EO ranging from 2-10 Alcoholethoxylate RSN analysed LogPow (estimated)1 C12-2EO 29,8 4,22 C12-4EO 35,1 3,67 C12-6EO 38,5 3,12 C12-8EO 40,3 2,57 C12-10EO 45,5 2,03
1 (HERA; Human & Environmental Risk Assessment on ingredients of European household cleaning products., Version 2,0 September 2009)
0
1
2
3
4
5
6
0
5
10
15
20
25
30
35
40
45
50
1 2 3 4 5
LogP
ow
RSN
Products
RSN
LogPow
34
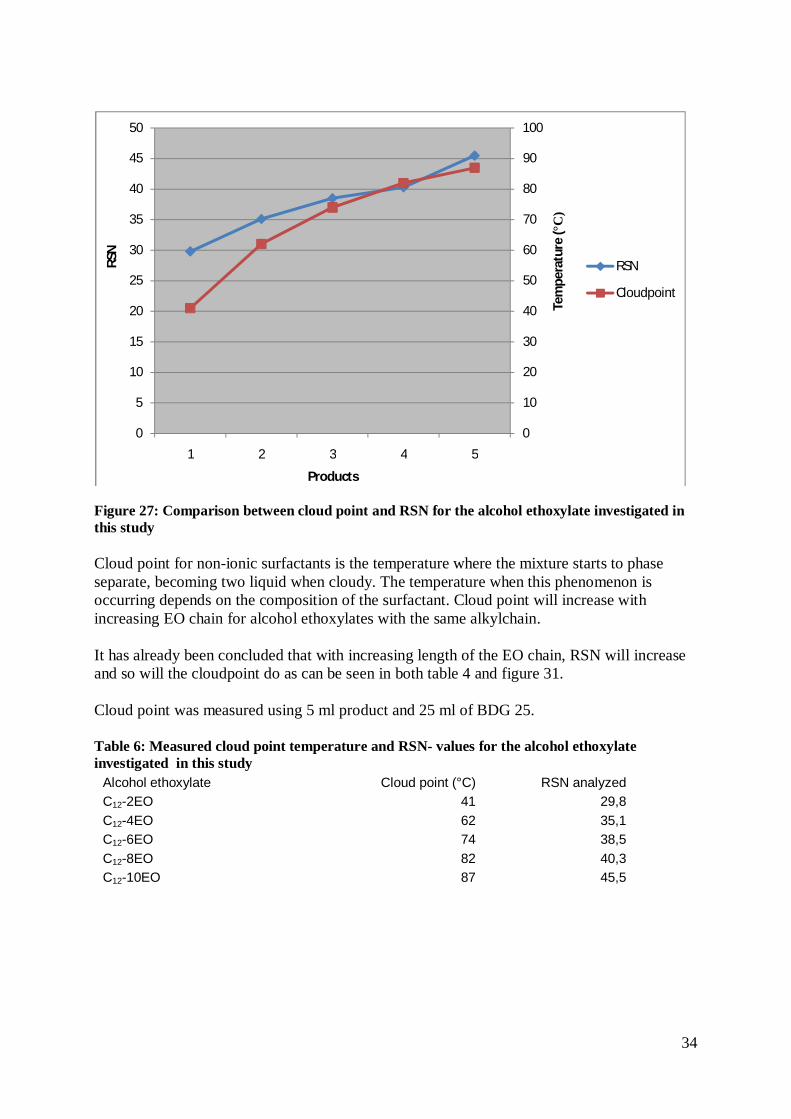
Figure 27: Comparison between cloud point and RSN for the alcohol ethoxylate investigated in this study Cloud point for non-ionic surfactants is the temperature where the mixture starts to phase separate, becoming two liquid when cloudy. The temperature when this phenomenon is occurring depends on the composition of the surfactant. Cloud point will increase with increasing EO chain for alcohol ethoxylates with the same alkylchain. It has already been concluded that with increasing length of the EO chain, RSN will increase and so will the cloudpoint do as can be seen in both table 4 and figure 31. Cloud point was measured using 5 ml product and 25 ml of BDG 25. Table 6: Measured cloud point temperature and RSN- values for the alcohol ethoxylate investigated in this study
Alcohol ethoxylate Cloud point (°C) RSN analyzed C12-2EO 41 29,8 C12-4EO 62 35,1 C12-6EO 74 38,5 C12-8EO 82 40,3 C12-10EO 87 45,5
0
10
20
30
40
50
60
70
80
90
100
0
5
10
15
20
25
30
35
40
45
50
1 2 3 4 5
Tem
pera
ture
(°C
)
RSN
Products
RSN
Cloudpoint
35
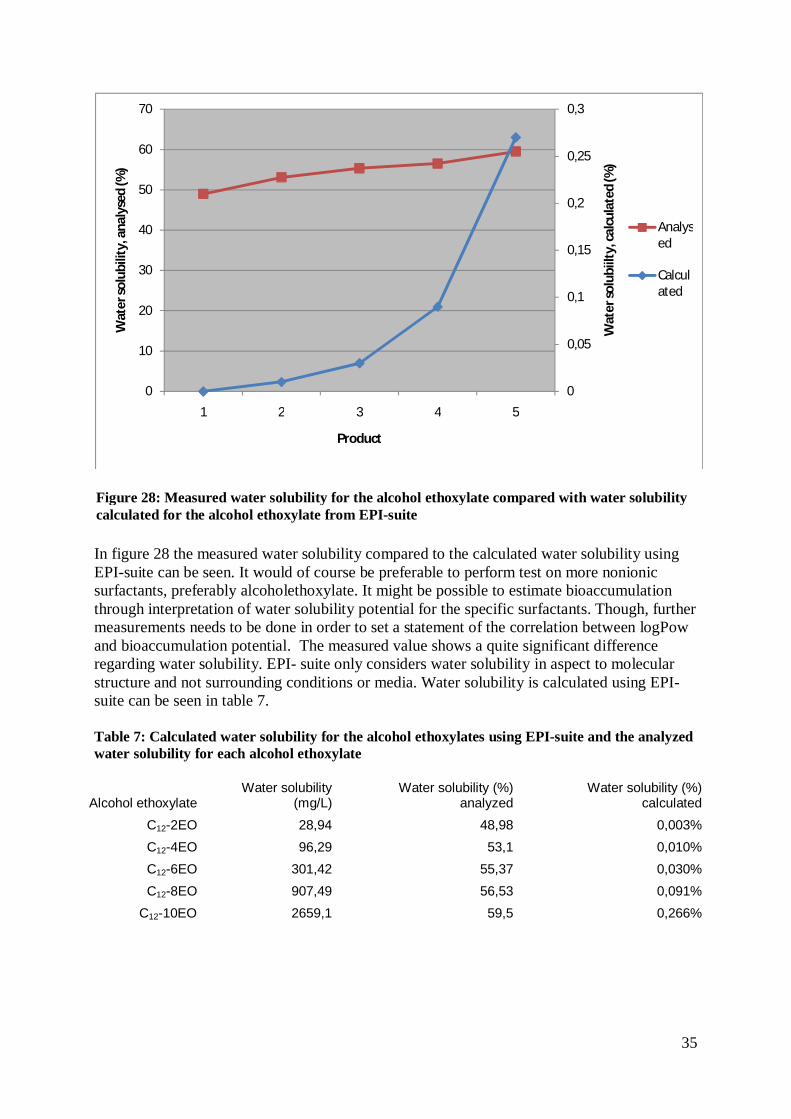
In figure 28 the measured water solubility compared to the calculated water solubility using EPI-suite can be seen. It would of course be preferable to perform test on more nonionic surfactants, preferably alcoholethoxylate. It might be possible to estimate bioaccumulation through interpretation of water solubility potential for the specific surfactants. Though, further measurements needs to be done in order to set a statement of the correlation between logPow and bioaccumulation potential. The measured value shows a quite significant difference regarding water solubility. EPI- suite only considers water solubility in aspect to molecular structure and not surrounding conditions or media. Water solubility is calculated using EPI-suite can be seen in table 7. Table 7: Calculated water solubility for the alcohol ethoxylates using EPI-suite and the analyzed water solubility for each alcohol ethoxylate
Alcohol ethoxylate
Water solubility (mg/L)
Water solubility (%) analyzed
Water solubility (%) calculated
C12-2EO 28,94 48,98 0,003% C12-4EO 96,29 53,1 0,010% C12-6EO 301,42 55,37 0,030% C12-8EO 907,49 56,53 0,091%
C12-10EO 2659,1 59,5 0,266%
0
0,05
0,1
0,15
0,2
0,25
0,3
0
10
20
30
40
50
60
70
1 2 3 4 5
Wat
er so
lubi
ilty,
cal
cula
ted
(%)
Wat
er so
lubi
lity,
ana
lyse
d (%
)
Product
Analysed
Calculated
Figure 28: Measured water solubility for the alcohol ethoxylate compared with water solubility calculated for the alcohol ethoxylate from EPI-suite
36
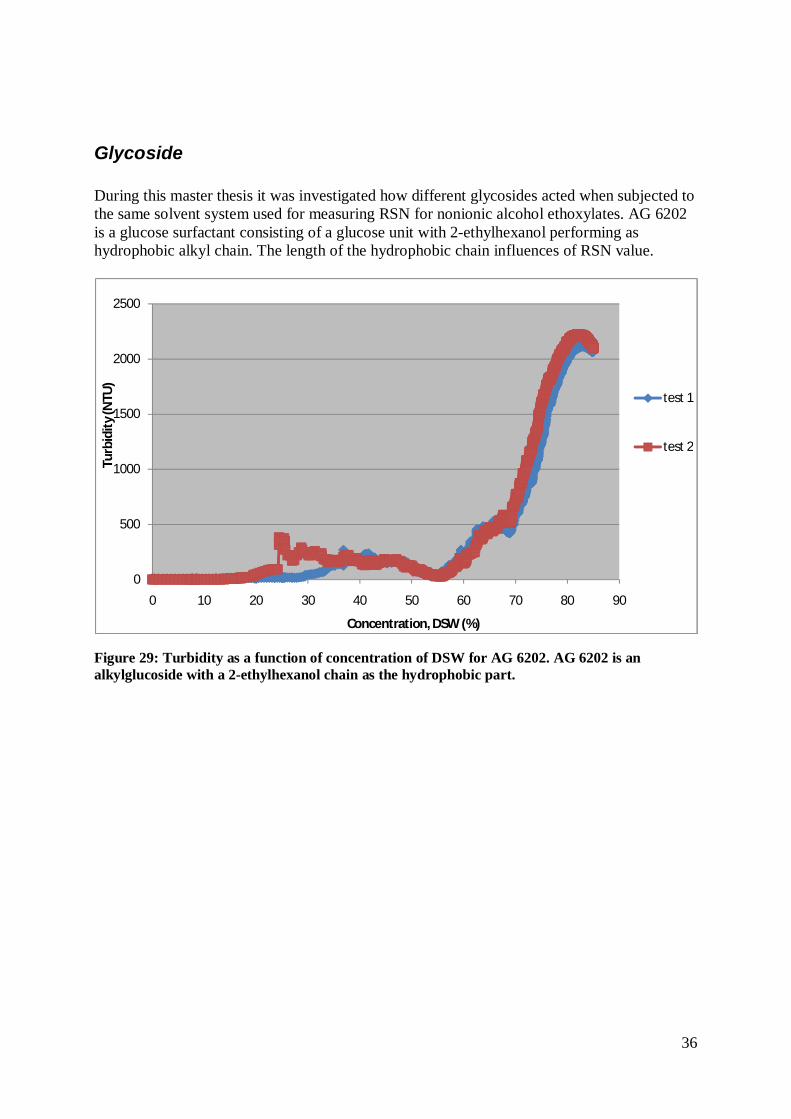
Glycoside During this master thesis it was investigated how different glycosides acted when subjected to the same solvent system used for measuring RSN for nonionic alcohol ethoxylates. AG 6202 is a glucose surfactant consisting of a glucose unit with 2-ethylhexanol performing as hydrophobic alkyl chain. The length of the hydrophobic chain influences of RSN value.
Figure 29: Turbidity as a function of concentration of DSW for AG 6202. AG 6202 is an alkylglucoside with a 2-ethylhexanol chain as the hydrophobic part.
0
500
1000
1500
2000
2500
0 10 20 30 40 50 60 70 80 90
Turb
idit
y (N
TU)
Concentration, DSW (%)
test 1
test 2
37
0,00
500,00
1000,00
1500,00
2000,00
2500,00
0,00 20,00 40,00 60,00 80,00 100,00
Turb
idit
y, (N
TU)
Concentration, DSW (%)
test 1
test 2
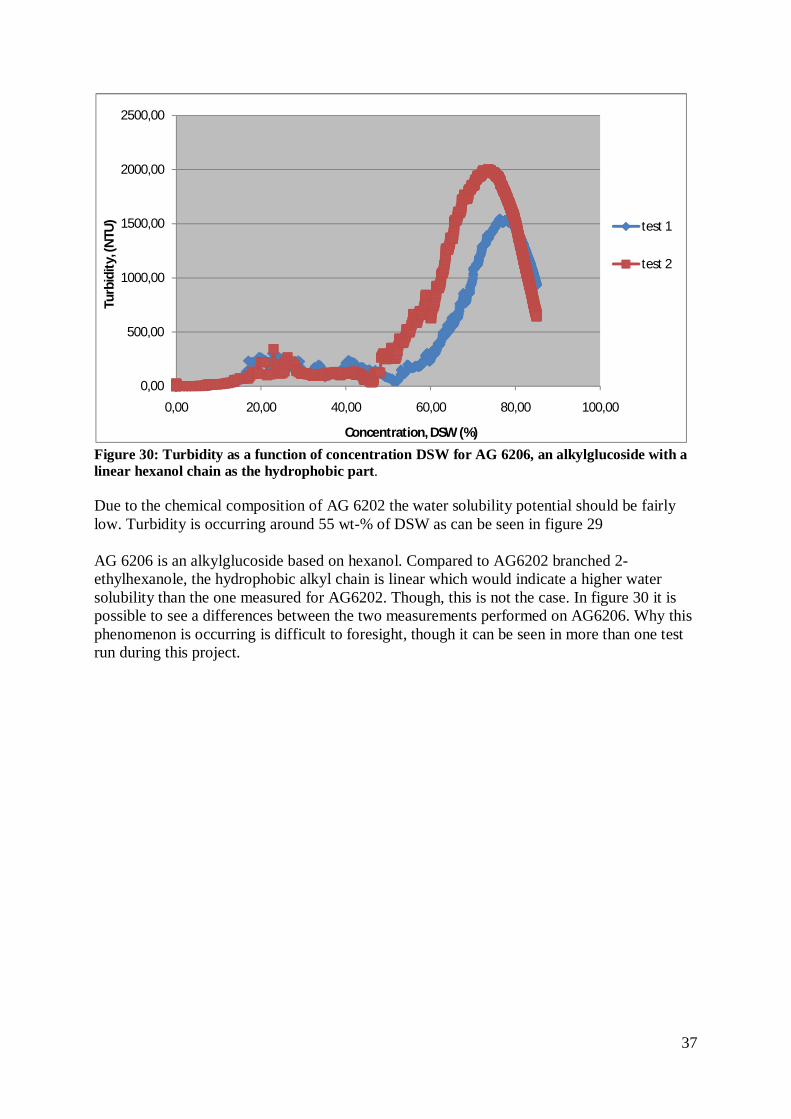
Figure 30: Turbidity as a function of concentration DSW for AG 6206, an alkylglucoside with a linear hexanol chain as the hydrophobic part. Due to the chemical composition of AG 6202 the water solubility potential should be fairly low. Turbidity is occurring around 55 wt-% of DSW as can be seen in figure 29 AG 6206 is an alkylglucoside based on hexanol. Compared to AG6202 branched 2-ethylhexanole, the hydrophobic alkyl chain is linear which would indicate a higher water solubility than the one measured for AG6202. Though, this is not the case. In figure 30 it is possible to see a differences between the two measurements performed on AG6206. Why this phenomenon is occurring is difficult to foresight, though it can be seen in more than one test run during this project.

38
Figure 31: Turbidity as a function of concentration DSW for AG 6210. The alkyl chain in AG 6210 is C8-C10. AG6210 has the longest alkyl chain of the glucosides tested in this master thesis. The hydrophobic chain is ranging from a C8 and varying to a C10. The water solubility potential should therefore be lower than for both AG6206 and AG6202 which both has a shorter hydrophobic chain. The reproducibility of the test runs is not accurate. The same phenomena occur during measurement of AG 6210 as seen in earlier glycoside measurements. It is possible that glycosides are sensitive to the cleaning procedure in between the tests. Between each test run, the sample holder is cleaned with propylene glycol at first and then milli-Q distilled water. It might be favourable to search for alternative washing methods in order to avoid this phenomenon. The alkylglucoside differs slightly in structure, both AG 6206 and 6210 are glucose units with straight alkyl chains, while AG 6202 has a 2- ethylhexanol chain which is a bit branched. If this structure difference influences on the sensitivity was not ruled out.
0,00
1000,00
2000,00
3000,00
4000,00
5000,00
6000,00
0,00 10,00 20,00 30,00 40,00 50,00 60,00 70,00 80,00 90,00
Turb
idit
y (N
TU)
Concentration, DSW (%)
test 1
test 2
39
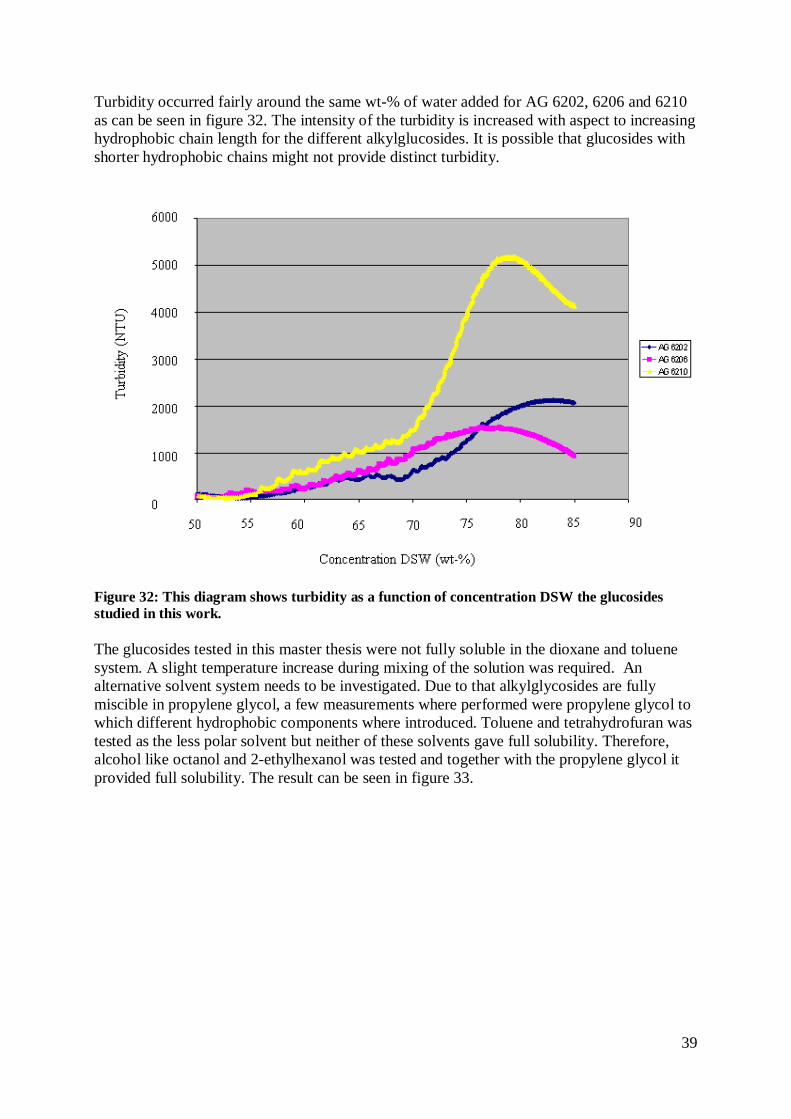
Turbidity occurred fairly around the same wt-% of water added for AG 6202, 6206 and 6210 as can be seen in figure 32. The intensity of the turbidity is increased with aspect to increasing hydrophobic chain length for the different alkylglucosides. It is possible that glucosides with shorter hydrophobic chains might not provide distinct turbidity.
Figure 32: This diagram shows turbidity as a function of concentration DSW the glucosides studied in this work. The glucosides tested in this master thesis were not fully soluble in the dioxane and toluene system. A slight temperature increase during mixing of the solution was required. An alternative solvent system needs to be investigated. Due to that alkylglycosides are fully miscible in propylene glycol, a few measurements where performed were propylene glycol to which different hydrophobic components where introduced. Toluene and tetrahydrofuran was tested as the less polar solvent but neither of these solvents gave full solubility. Therefore, alcohol like octanol and 2-ethylhexanol was tested and together with the propylene glycol it provided full solubility. The result can be seen in figure 33.

40
Figure 33: Turbidity as a function of concentration DSW for AG 6202 tested in alternative solvent system compared to the original RSN method. Propylene glycol together with either etylhexanol or n-octanol were tested Using propylene glycol as a polar solvent instead of dioxane is thought to be more beneficial from an environmental point of view since it is considered less harmful. Octanol is also thought to be favourable although this solvent system was only tested on the glucoside which showed good reproducibility when using the original solvent system, AG 6202. As stated before, the aim of this master thesis was to develop a robust method similar to conventional RSN method suitable to all types of surfactant to which logPow could be correlated. The original RSN method was developed for alcoholethoxylate and it is desirable to use one solvent system for all categories of surfactants. Glycosides showed to be much harder to dissolve in a dioxane/ toluene solvent. To overcome this problem tests were performed using a lower percentage of AG 6202. AG 6202 showed good reproducibility when measuring water solubility potential with original RSN method. According to theory behind RSN method, the amount of surfactants dissolved influences the water solubility. A hydrophilic surfactant has possibilities to hydrate to a greater extent if additionally more sample is used, compared to a hydrophobic surfactant where water solubility would decrease if more percentage of surfactant were added to the solution. This is due to the hydrophobic interaction between the alkyl chains are stronger and more pronounced.
0
100
200
300
400
500
600
0 20 40 60 80 100
Turb
idit
y (N
TU)
Concentration DSW (%)
PG+2-ethylhexanol
PG+octanol

41
Smaller amount were added to the solvent system, 10%, 50% and 100%, of the original 1g, were dissolved in the same amount of dioxane/ toluene. According to the diagram in figure 34 it seems like it could be possible to use a smaller amount of product. The intensity of turbidity is decreasing with a decrease in addition of surfactant. This could be expected since the solution will be more diluted from the beginning. Separately diagram for each different wt-% of AG 6202 used can be seen in appendix 6 and 7.
Figure 34: Turbidity as a function of concentration DSW for AG 6202 with different amount of product added to the original RSN method used in this study For future work it is desirable to investigate how non-ionic surfactant behaves with different amount of sample weight but also continue searching for alternative solvents and find optimal measurement conditions.
0
500
1000
1500
2000
2500
0 20 40 60 80 100
Turb
idit
y (N
TU)
Concentration, DSW (wt-%)
2g product
1g product
0,2g product
42
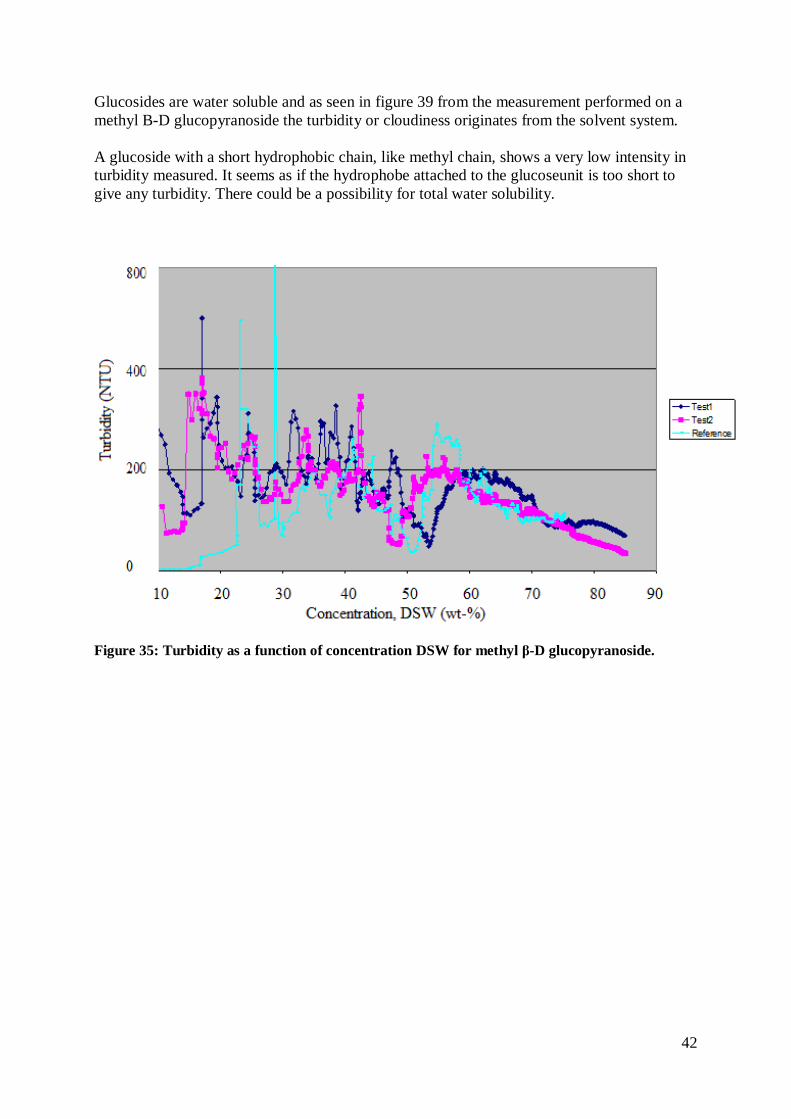
Glucosides are water soluble and as seen in figure 39 from the measurement performed on a methyl B-D glucopyranoside the turbidity or cloudiness originates from the solvent system. A glucoside with a short hydrophobic chain, like methyl chain, shows a very low intensity in turbidity measured. It seems as if the hydrophobe attached to the glucoseunit is too short to give any turbidity. There could be a possibility for total water solubility.
Figure 35: Turbidity as a function of concentration DSW for methyl -D glucopyranoside.
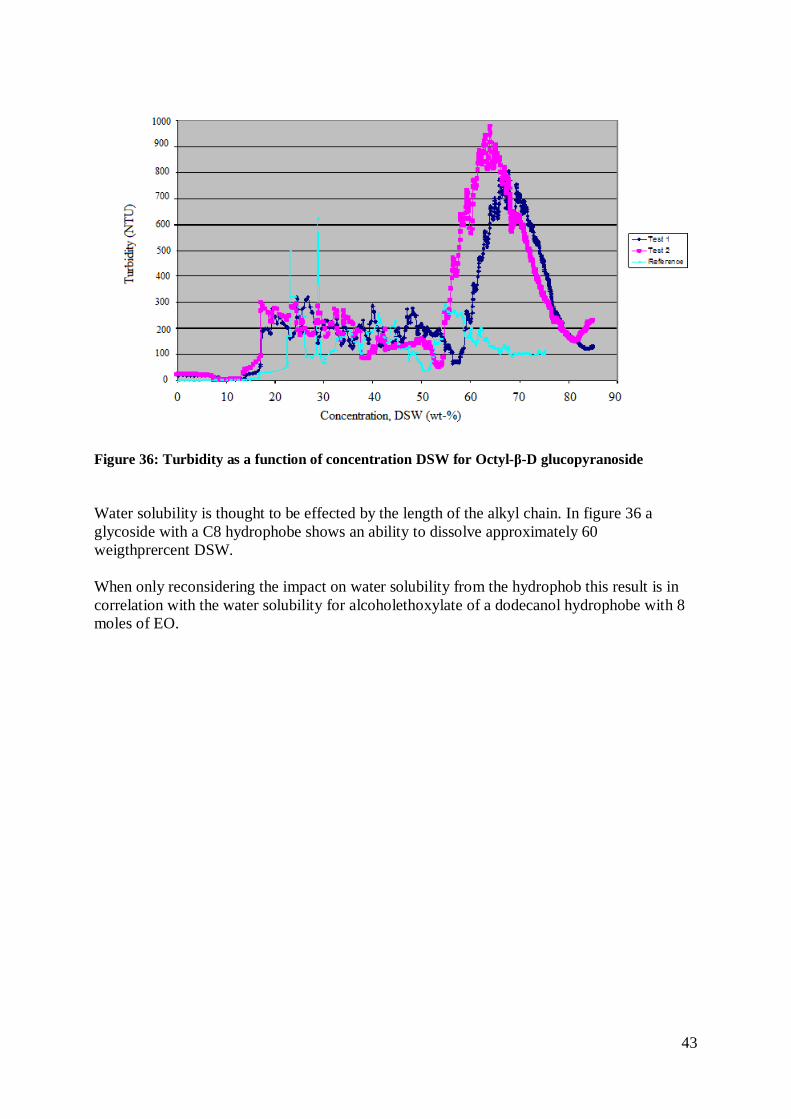
43
Figure 36: Turbidity as a function of concentration DSW for Octyl- -D glucopyranoside Water solubility is thought to be effected by the length of the alkyl chain. In figure 36 a glycoside with a C8 hydrophobe shows an ability to dissolve approximately 60 weigthprercent DSW. When only reconsidering the impact on water solubility from the hydrophob this result is in correlation with the water solubility for alcoholethoxylate of a dodecanol hydrophobe with 8 moles of EO.
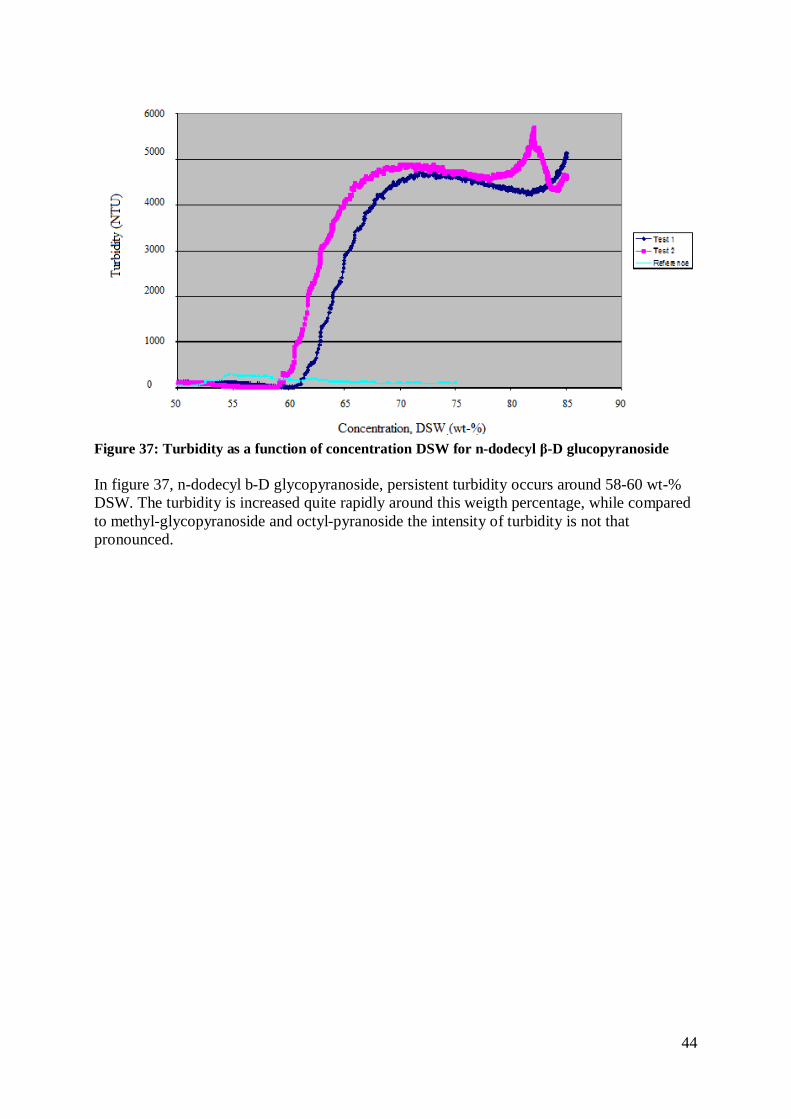
44
Figure 37: Turbidity as a function of concentration DSW for n-dodecyl -D glucopyranoside In figure 37, n-dodecyl b-D glycopyranoside, persistent turbidity occurs around 58-60 wt-% DSW. The turbidity is increased quite rapidly around this weigth percentage, while compared to methyl-glycopyranoside and octyl-pyranoside the intensity of turbidity is not that pronounced.
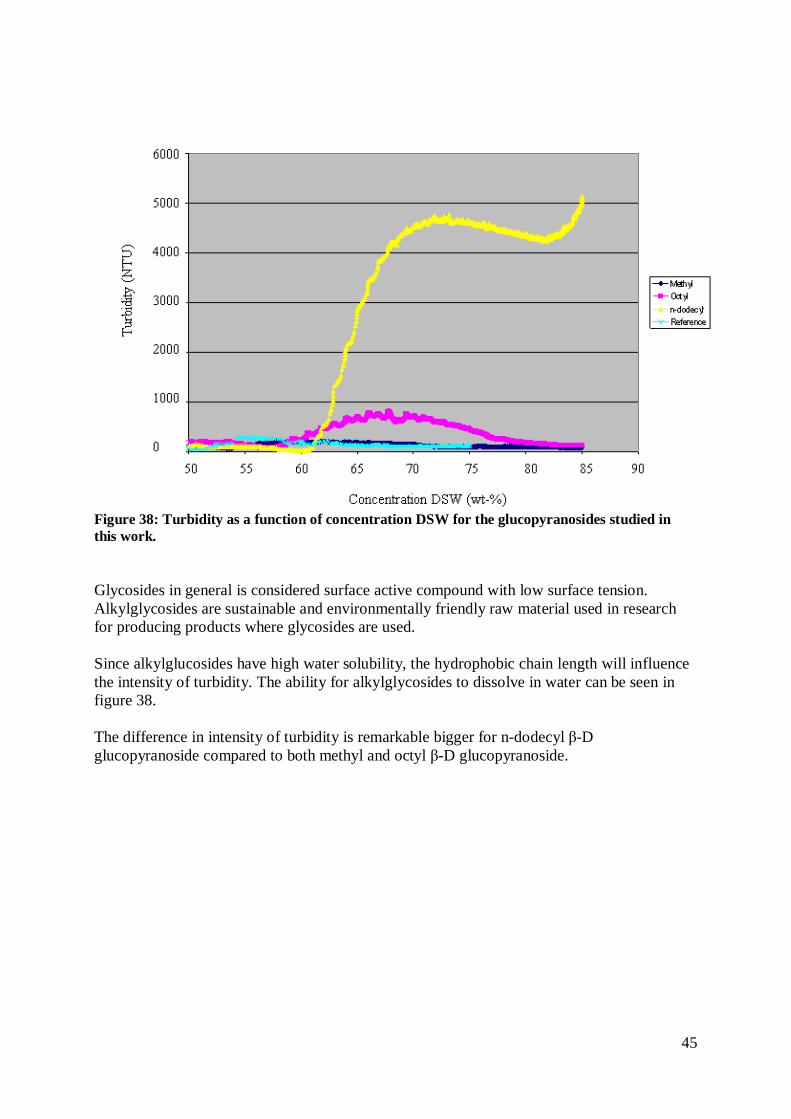
45
Figure 38: Turbidity as a function of concentration DSW for the glucopyranosides studied in this work. Glycosides in general is considered surface active compound with low surface tension. Alkylglycosides are sustainable and environmentally friendly raw material used in research for producing products where glycosides are used. Since alkylglucosides have high water solubility, the hydrophobic chain length will influence the intensity of turbidity. The ability for alkylglycosides to dissolve in water can be seen in figure 38. The difference in intensity of turbidity is remarkable bigger for n-dodecyl -D glucopyranoside compared to both methyl and octyl -D glucopyranoside.
46
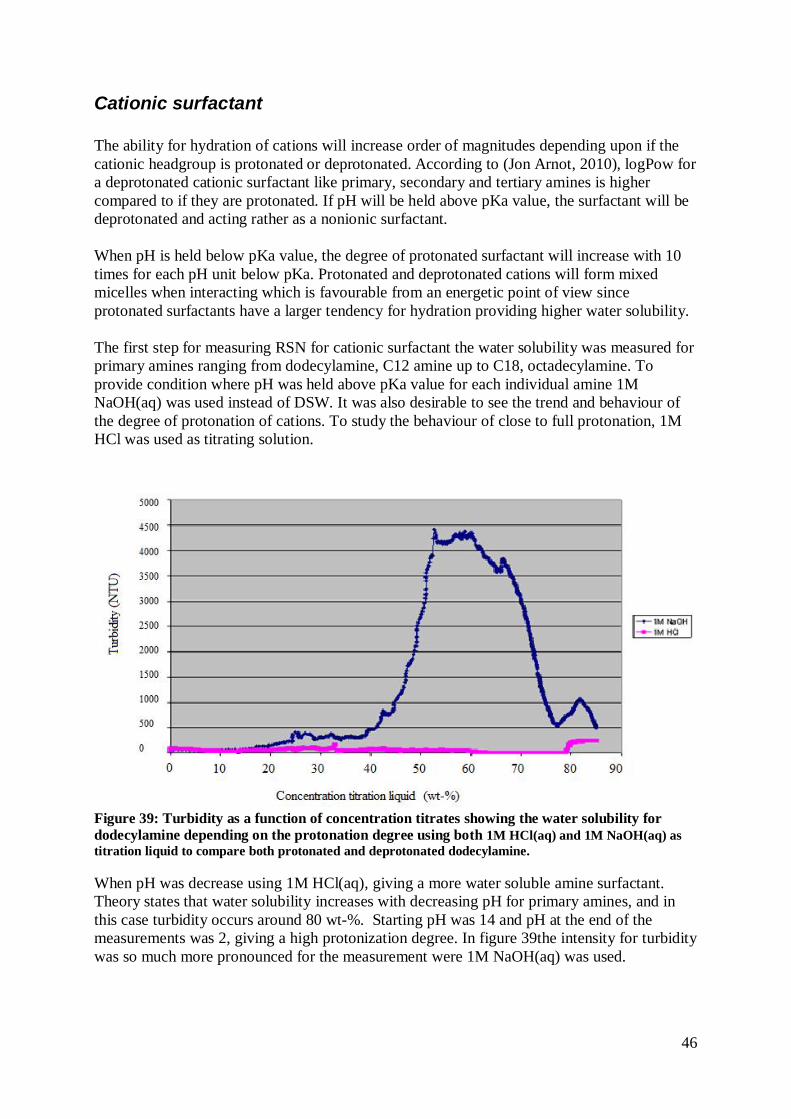
Cationic surfactant The ability for hydration of cations will increase order of magnitudes depending upon if the cationic headgroup is protonated or deprotonated. According to (Jon Arnot, 2010), logPow for a deprotonated cationic surfactant like primary, secondary and tertiary amines is higher compared to if they are protonated. If pH will be held above pKa value, the surfactant will be deprotonated and acting rather as a nonionic surfactant. When pH is held below pKa value, the degree of protonated surfactant will increase with 10 times for each pH unit below pKa. Protonated and deprotonated cations will form mixed micelles when interacting which is favourable from an energetic point of view since protonated surfactants have a larger tendency for hydration providing higher water solubility. The first step for measuring RSN for cationic surfactant the water solubility was measured for primary amines ranging from dodecylamine, C12 amine up to C18, octadecylamine. To provide condition where pH was held above pKa value for each individual amine 1M NaOH(aq) was used instead of DSW. It was also desirable to see the trend and behaviour of the degree of protonation of cations. To study the behaviour of close to full protonation, 1M HCl was used as titrating solution.
Figure 39: Turbidity as a function of concentration titrates showing the water solubility for dodecylamine depending on the protonation degree using both 1M HCl(aq) and 1M NaOH(aq) as titration liquid to compare both protonated and deprotonated dodecylamine. When pH was decrease using 1M HCl(aq), giving a more water soluble amine surfactant. Theory states that water solubility increases with decreasing pH for primary amines, and in this case turbidity occurs around 80 wt-%. Starting pH was 14 and pH at the end of the measurements was 2, giving a high protonization degree. In figure 39the intensity for turbidity was so much more pronounced for the measurement were 1M NaOH(aq) was used.

47
Figure 40: Turbidity as a function of concentration titrates showing the water solubility for tetradecylamine depending on the protonation degree using both 1M HCl(aq) and 1M NaOH(aq) as titration liquid to compare both protonated and deprotonated tetradecylamine. In figure 40 the difference in water solubility for deprotonated and protonated tetradecylamine can be seen. Deprotonated amines can be seen to the left in the figure symbolized by R-NH2. Once the pH gets below pKa value, protonization degree increases whereas R-NH3
+ is representing the protonated amines. The different stages are marked in the diagram. The hydrophobic chain is slightly longer here then for dodecylamine whereas a lower possibility to dissolve water is to be expected. The solubility potential is much higher for the protonated cationic primary amine, 72 wt-% while for the deprotonated primary amine, the water solubility potential seems to be the same as seen in figure 39.
48
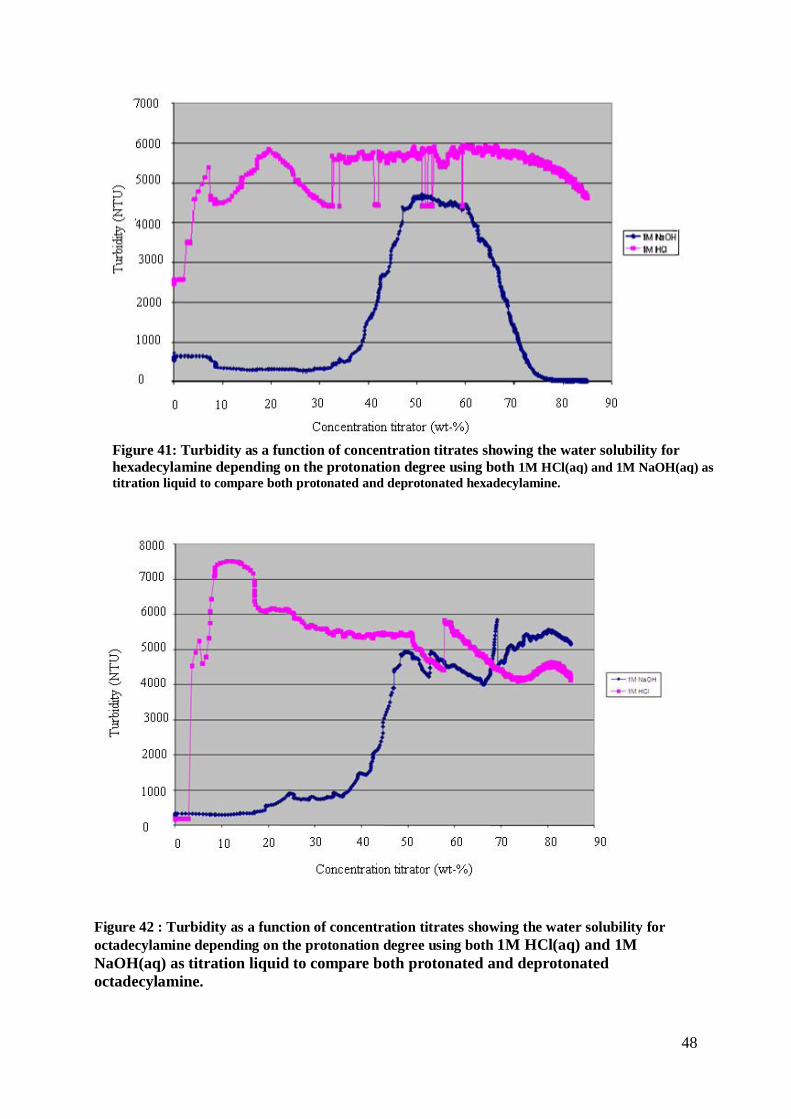
Figure 42 : Turbidity as a function of concentration titrates showing the water solubility for octadecylamine depending on the protonation degree using both 1M HCl(aq) and 1M NaOH(aq) as titration liquid to compare both protonated and deprotonated octadecylamine.
Figure 41: Turbidity as a function of concentration titrates showing the water solubility for hexadecylamine depending on the protonation degree using both 1M HCl(aq) and 1M NaOH(aq) as titration liquid to compare both protonated and deprotonated hexadecylamine.
49
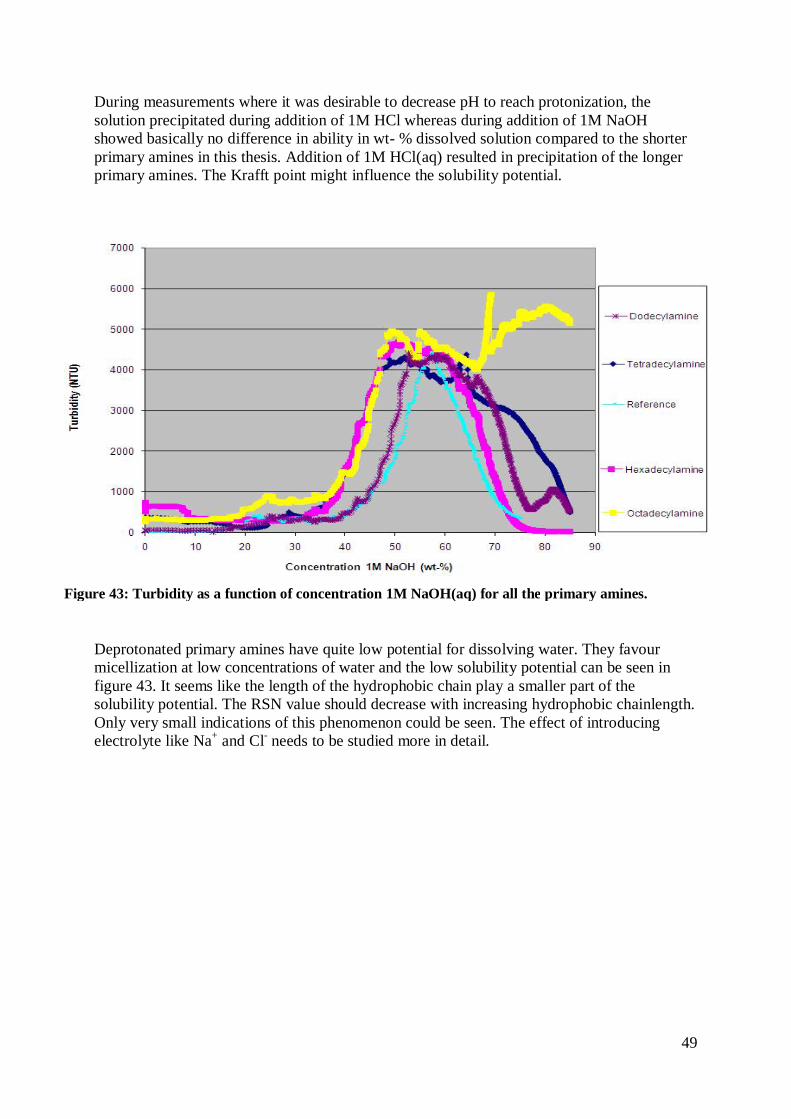
During measurements where it was desirable to decrease pH to reach protonization, the solution precipitated during addition of 1M HCl whereas during addition of 1M NaOH showed basically no difference in ability in wt- % dissolved solution compared to the shorter primary amines in this thesis. Addition of 1M HCl(aq) resulted in precipitation of the longer primary amines. The Krafft point might influence the solubility potential.
Deprotonated primary amines have quite low potential for dissolving water. They favour micellization at low concentrations of water and the low solubility potential can be seen in figure 43. It seems like the length of the hydrophobic chain play a smaller part of the solubility potential. The RSN value should decrease with increasing hydrophobic chainlength. Only very small indications of this phenomenon could be seen. The effect of introducing electrolyte like Na+ and Cl- needs to be studied more in detail.
Figure 43: Turbidity as a function of concentration 1M NaOH(aq) for all the primary amines.
50
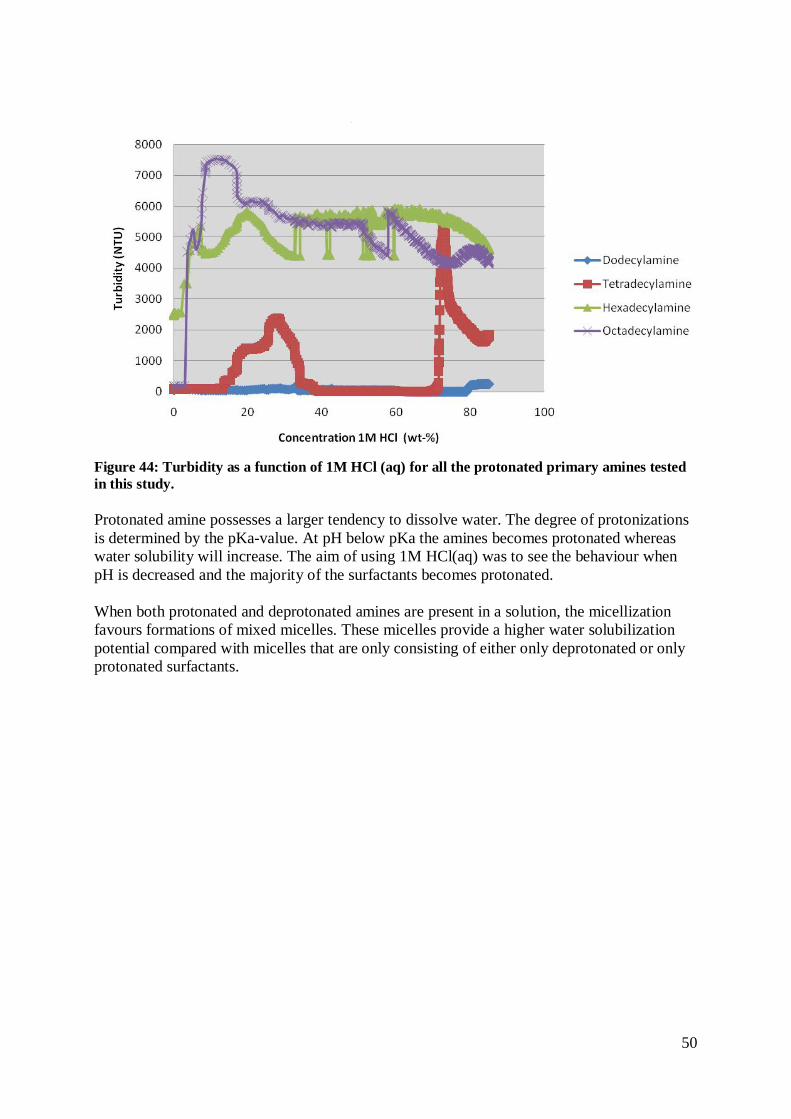
Figure 44: Turbidity as a function of 1M HCl (aq) for all the protonated primary amines tested in this study. Protonated amine possesses a larger tendency to dissolve water. The degree of protonizations is determined by the pKa-value. At pH below pKa the amines becomes protonated whereas water solubility will increase. The aim of using 1M HCl(aq) was to see the behaviour when pH is decreased and the majority of the surfactants becomes protonated. When both protonated and deprotonated amines are present in a solution, the micellization favours formations of mixed micelles. These micelles provide a higher water solubilization potential compared with micelles that are only consisting of either only deprotonated or only protonated surfactants.
51
Conclusions By using a Multi Parameter-Scanning instrument it was possible to measure the RSN value for alcoholethoxylates with varying composition of both the hydrophobic and hydrophilic part. Depending on this composition of the surfactants, the amount of water needed to be added to produce persistent turbidity varied. With increased length of the hydrophilic chain the potential to dissolve water was increased. For future work it might be possible to see greater trends if alcoholethoxylates with shorter and longer hydrophobic alkyl chains with same range of moles of EO would be tested. It could even be favourable to change the hydrophobic chain from an alcohol to a fatty amine for a greater trend and a deeper understanding. Glucosides are surface active compound where the glucose unit itself is considered to be very water soluble but with increasing alkylchain the potential to dissolve water should become less possible. The glucosides produced at Akzo Nobel were compared to glucopyranosides with alkylchains ranging from a methyl and up to a n- dodecyl chain. When measuring RSN values for glucosides using the standard solvent system the reproducibility was poor. This phenomenon only occurs for the glucoside with the straight hydrophobic chains. For AG 6202, which has a slightly branched alkyl chain the reproducibility seems to be very good. Alternative solvent systems were tested with potential attention in the future. Primary amines were tested as protonated cations and as deprotonated primary amines. The alkylchain was varying from dodecyl upto an octadecyl. The water solubility potential for the shorter primary amines when protonated was quite high, resulting in a high potential of dissolving water. Deprotonated primary amine possesses a low water solubility potential regardless of the length of their hydrophobic chain. The Krafft point is influencing on the primary amines with the longer alkylchains with addition of HCl. To find correlation between RSN and logPow far more tests needs to be performed showing more trends depending on molecular composition. It is not possible to draw conclusions from the tests performed for this master thesis regarding correlation, there was just too few tests performed. Even thought there are indications showing a potential correlation from the nonionic surfactants measured. The RSN value seems to be increasing with increased hydrophilic part. The results for the glucosides and the cationic surfactant tested in this master thesis used showed poor indication of potential correlations between logPow and bioaccumulation. It seems as the solventsystem needs to be further developed to match this type of surfactants better to find a potential correlation.
52
Reference Chandler David “Interfaces and the driving force of hydrophobic assembly” Nature, Vol 437, 29 September 2005:640-647 Myers Drew “Surfactant science and technology” Wiley, 2006 Farn, Richard. J. “Chemistry and technology of surfactants” Blackwell, 2006 Klecka G.M, Losey B.S, Staples C.A and Woodburn K.B, “Assessment of the persistence and bioaccumulation potential for nonylphenol, octylphenol and their ethoxylates for categorization and screening of the canadian domestic substance list (DSL”). Prepared for the Alkylphenol & ethoxylates research council, 16 September 2005: 1-40 Karcher Arron, Robb Ian, Wilson Michael J., and Wiggins Henry, Halliburton. “Determining Octanol/ water Partitioning Coefficients for industrial Surfactants” Halliburton, 2008 Hongyuan Cheng, G. M. “Correlation and prediction of environmental properties of alcoholethoxylate surfactants using the UNIFAC method” 2005 Wu Jiangying, Xu Yuming, Dabros Tadeusz and Hamza Hassan, “Development of a method for measurement of relative solubility of nonionic surfactants”. Colloids and Surfaces A: Physicochem. Eng. Aspects 232, 2004: 229-237. Armitage James and Arnot Jon, “Assessing the bioaccumulation potential of Long Chain Amines (Cationic surfactants) in fish” The APAG Companies, 9 august 2010: 1-86 Holmberg Krister, Jonsson Bo, Kronberg Bengt and Lindman Björn, “Surfactants and polymers in aqueous solution” . Wiley, 2003 Graham Payne and McWilliams Phil, “Bioaccumulation potential of surfactants: A review” Royal Society of Chemistry& EOSCA, November 2011 Riken Vitamin. http://www.rikenvitamin.jp/int/emulsifier/basic/property1.html. 2002 Rosen, Milton. J “Surfactants and interfacial phenomen” Wiley, 2004 Blogger.com,swiftcraftymonkey.blogspot.com http://swiftcraftymonkey.blogspot.com/2009/09/hlb-or-hydrophilic-lipophilic-balance.html. (accessed 26 September 2009) Tharwat F. Tadros “Applied surfactants, principle and applications” Wiley, 2005
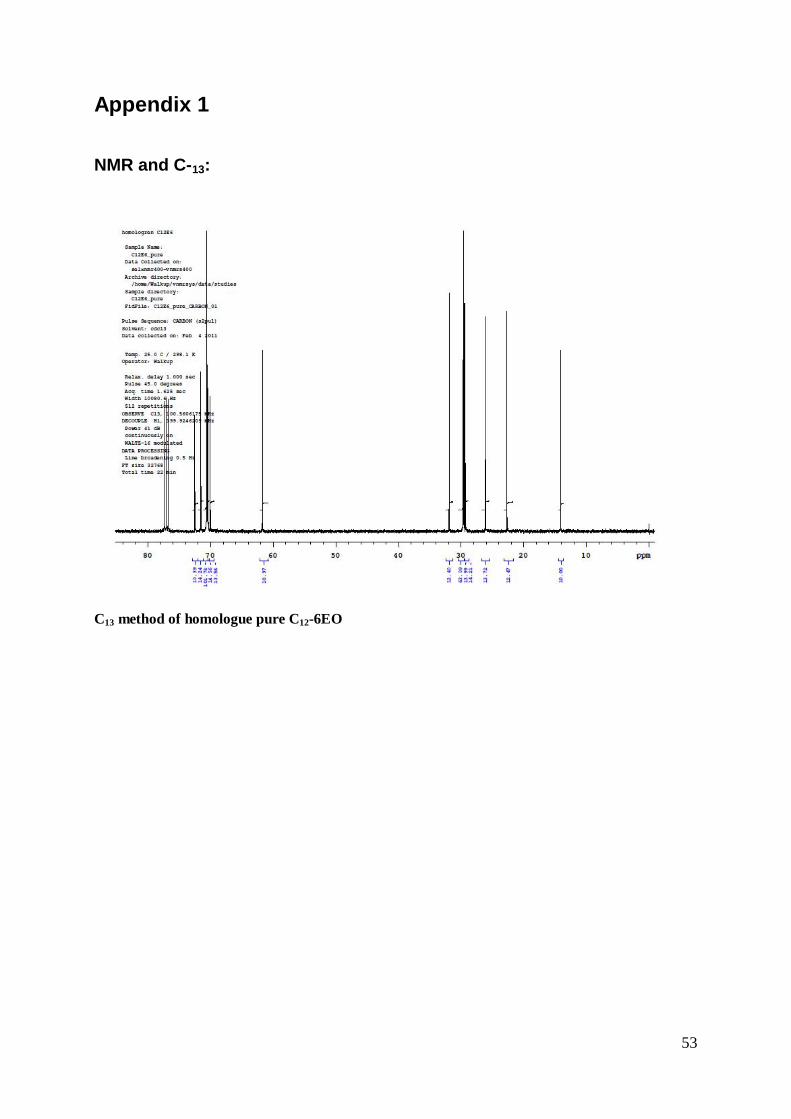
53
Appendix 1
NMR and C-13:
C13 method of homologue pure C12-6EO

54
Appendix 2
Proton spectra for homologue pure C12-6EO
C13 of alcoholetoxylated C12-6EO.
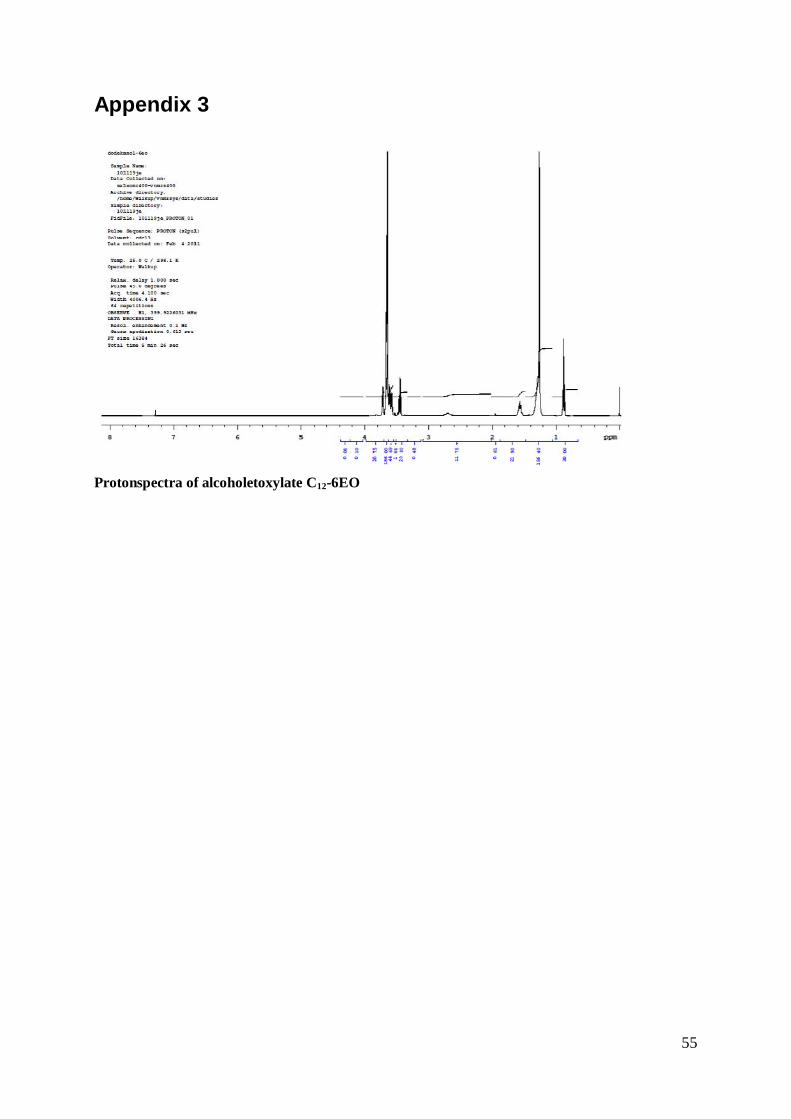
55
Appendix 3
Protonspectra of alcoholetoxylate C12-6EO
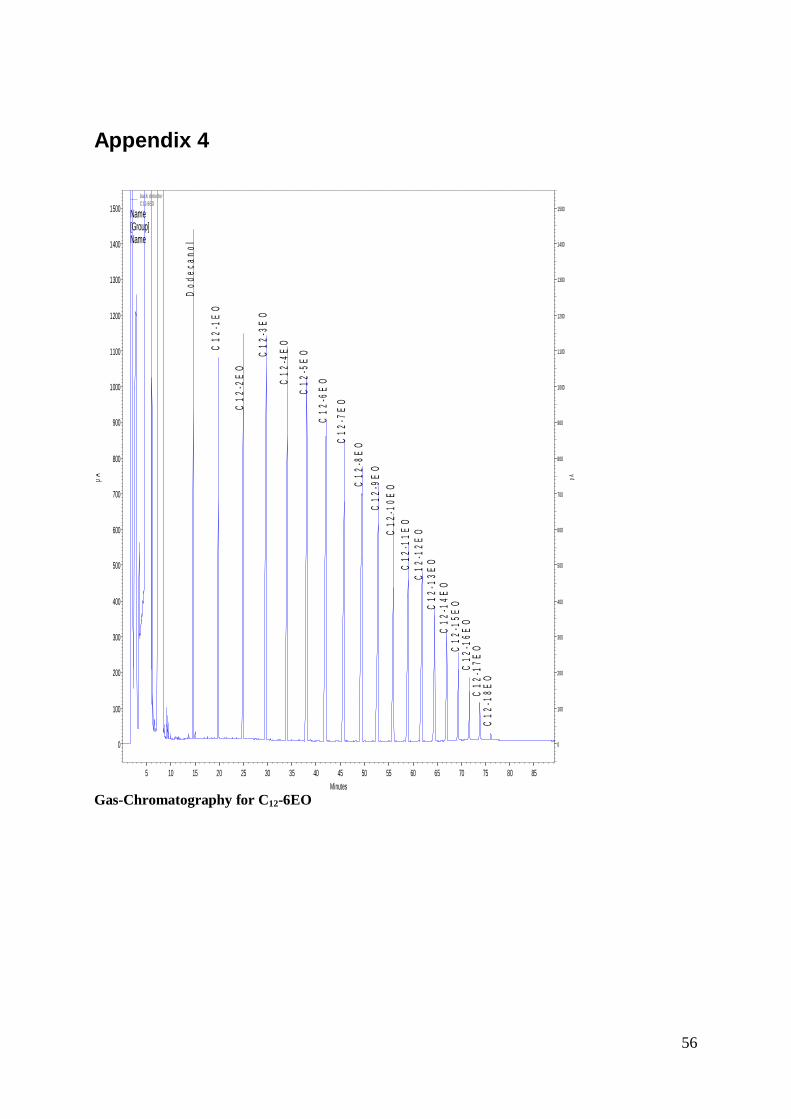
56
Appendix 4
Gas-Chromatography for C12-6EO
Minutes5 10 15 20 25 30 35 40 45 50 55 60 65 70 75 80 85
pA
0
100
200
300
400
500
600
700
800
900
1000
1100
1200
1300
1400
1500
pA
0
100
200
300
400
500
600
700
800
900
1000
1100
1200
1300
1400
1500
D
odec
anol
C
12-1
EO
C
12-2
EO
C
12-3
EO
C
12-4
EO
C
12-5
EO
C
12-6
EO
C
12-7
EO
C
12-8
EO
C
12-9
EO
C
12-1
0EO
C
12-1
1EO
C
12-1
2EO
C
12-1
3EO
C
12-1
4EO
C
12-1
5EO
C12
-16E
OC
12-1
7EO
C12
-18E
O
back detectorC12-6EO
Name[Group]Name
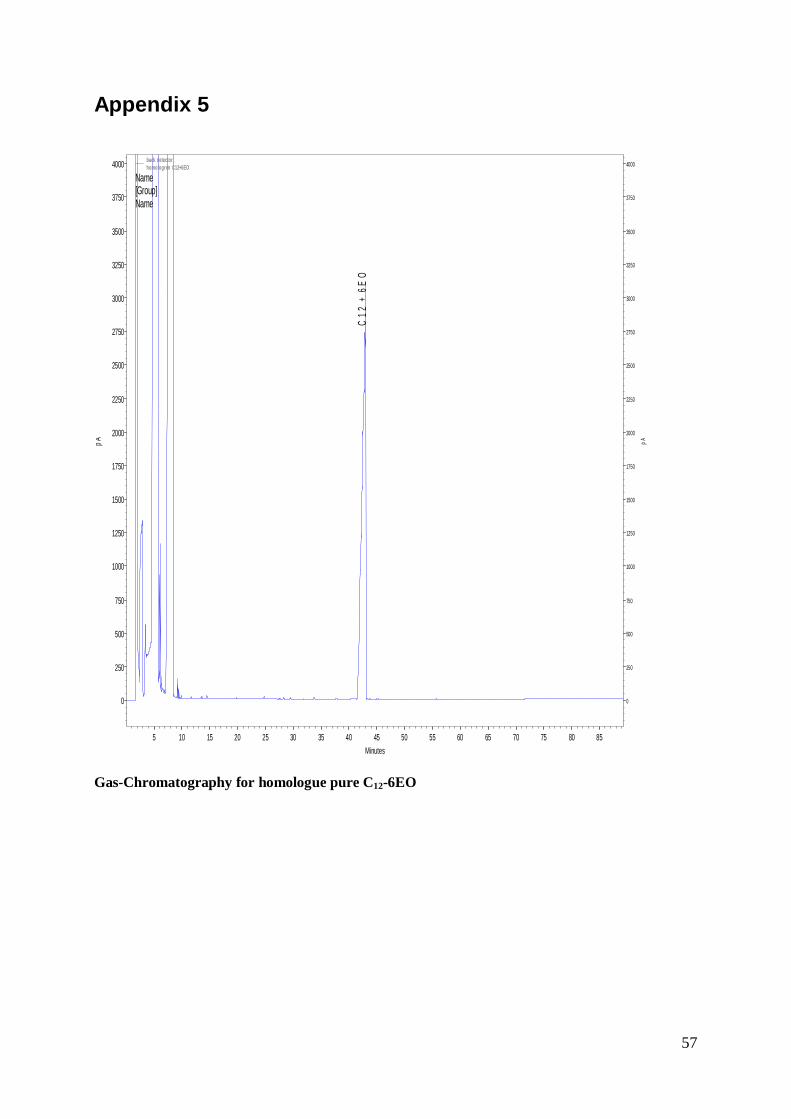
57
Appendix 5
Gas-Chromatography for homologue pure C12-6EO
Minutes5 10 15 20 25 30 35 40 45 50 55 60 65 70 75 80 85
pA
0
250
500
750
1000
1250
1500
1750
2000
2250
2500
2750
3000
3250
3500
3750
4000
pA
0
250
500
750
1000
1250
1500
1750
2000
2250
2500
2750
3000
3250
3500
3750
4000
C
12 +
6E
O
back detectorhomologren C12+6EO
Name[Group]Name
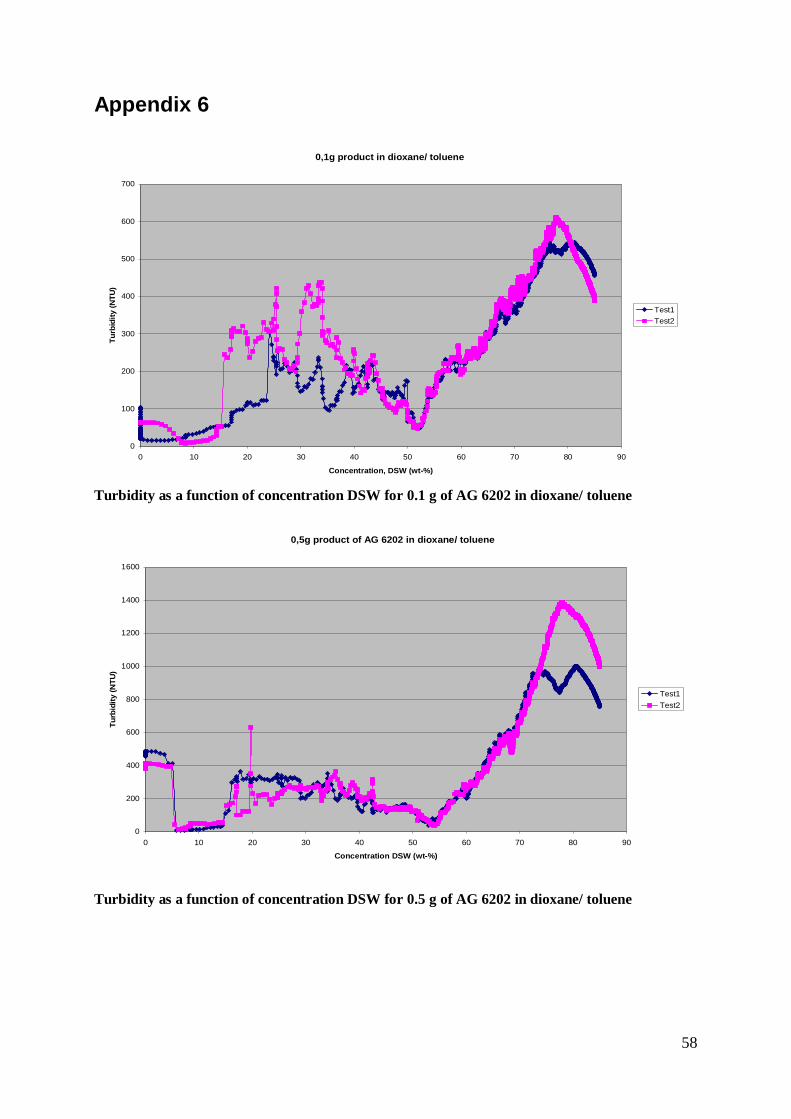
58
Appendix 6
Turbidity as a function of concentration DSW for 0.1 g of AG 6202 in dioxane/ toluene
Turbidity as a function of concentration DSW for 0.5 g of AG 6202 in dioxane/ toluene
0,1g product in dioxane/ toluene
0
100
200
300
400
500
600
700
0 10 20 30 40 50 60 70 80 90
Concentration, DSW (wt-%)
Turb
idity
(NTU
)
Test1Test2
0,5g product of AG 6202 in dioxane/ toluene
0
200
400
600
800
1000
1200
1400
1600
0 10 20 30 40 50 60 70 80 90
Concentration DSW (wt-%)
Turb
idity
(NTU
)
Test1Test2
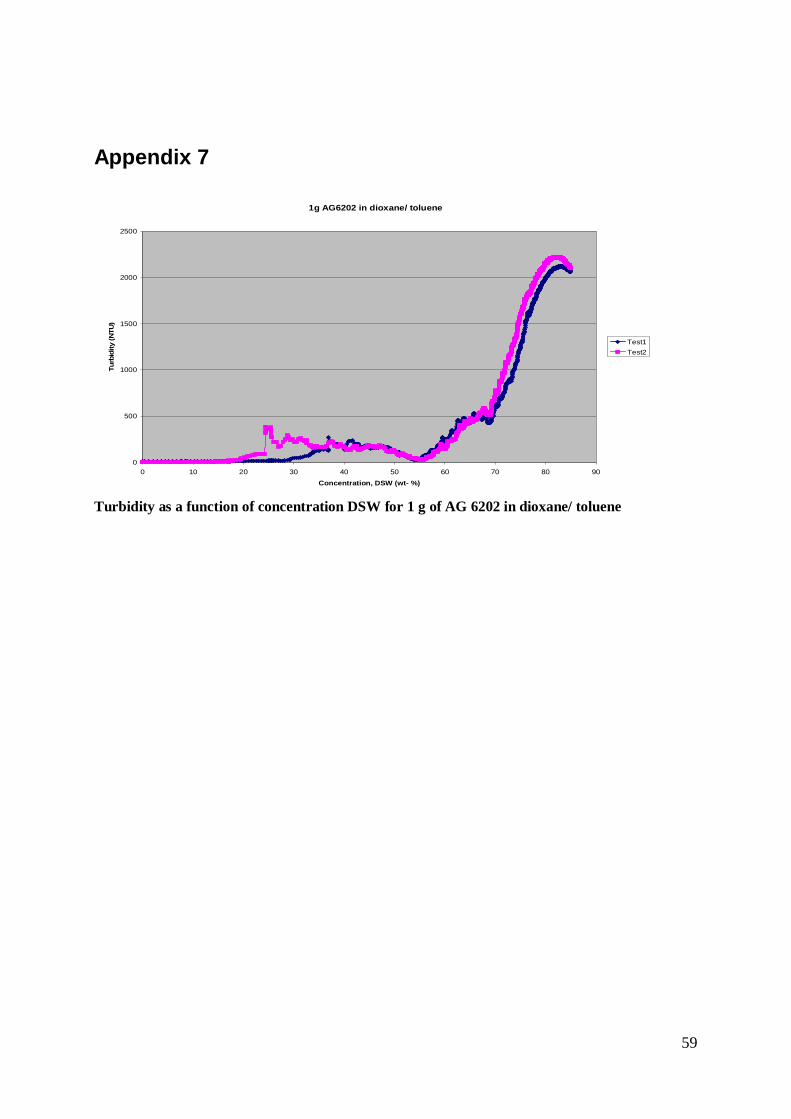
59
Appendix 7
Turbidity as a function of concentration DSW for 1 g of AG 6202 in dioxane/ toluene
1g AG6202 in dioxane/ toluene
0
500
1000
1500
2000
2500
0 10 20 30 40 50 60 70 80 90Concentration, DSW (wt- %)
Turb
idity
(NTU
)
Test1Test2

60
Acknowledgement First of all I would like to thank my supervisor here at Akzo Nobel Surface Chemistry; Louis Schwarzmayr for all guidance, support, for all discussion and problem solving. I would also like to thank my supervisor at Chalmers, professor Krister Holmberg. Especially thanks to Hans Oskarsson and Jeanette Ulama for theoretical discussions. A great thank you to Bengt Fjällborg and Anne Andersen from RA for supporting regarding bioaccumulation and providence of REACH information. Would also like to thank Helen Kleberger for helping me and teaching me about GC and GCMS. A big thank you to Bo Karlsson and Rolf Arvidsson for their support and to the rest of the gang up at the research department at “Berget”.


![Laboratory-Based Bioaccumulation Essay for Elements ... · in aquatic environment, including bioaccumulation [10]. Thus, this laboratory-based study assessed the bioaccumulation of](https://img.pdfslide.us/doc/110x75/5f0813d47e708231d42038a6/laboratory-based-bioaccumulation-essay-for-elements-in-aquatic-environment.jpg)