Embed Size (px)
Citation preview
©FUNPEC-RP www.funpecrp.com.brGenetics and Molecular Research 14 (2): 3481-3490 (2015)
Relative quantification of beta-casein expression in primary goat mammary epithelial cell lines
J. Ogorevc and P. Dovč
Department of Animal Science, Biotechnical Faculty, University of Ljubljana, Domzale, Slovenia
Corresponding author: P. DovčE-mail: [email protected]
Genet. Mol. Res. 14 (2): 3481-3490 (2015)Received May 8, 2014Accepted October 23, 2014Published April 15, 2015DOI http://dx.doi.org/10.4238/2015.April.15.12
ABSTRACT. Primary mammary epithelial cell cultures were established from mammary tissue of lactating and non-lactating goats to assess the expression of beta-casein (CSN2) in vitro. Primary cell cultures were established by enzymatic digestion of mammary tissue and characterized using antibodies against cytokeratin 14, cytokeratin 18, and vimentin. The established primary cell lines in the second passage were grown in basal medium on plastic and in hormone-supplemented (lactogenic) medium on plastic and on an extracellular matrix-covered surface, respectively. CSN2 gene expression was evaluated using quantitative reverse transcription PCR. The presence of CSN2 transcripts was detected in all samples, including cells originating from non-lactating goat, grown in basal medium. The presence of CSN2 protein was confirmed using immunofluorescence. Response to the hormonal treatment and cell morphology differed between the cell lines and treatments. In 2 cell lines supplemented with lactogenic hormones in the medium, CSN2 expression was increased, while CSN2 levels in one of the cell lines remained constant, regardless of the treatment. Addition of extracellular matrix showed positive effects on CSN2 transcription activity in 1 of the cell lines, while in the other
3482
©FUNPEC-RP www.funpecrp.com.brGenetics and Molecular Research 14 (2): 3481-3490 (2015)
J. Ogorevc and P. Dovč
2 showed no statistically significant effects. CSN2 expression appeared to depend on subtle differences in physiological state of the starting tissue material, growth conditions, cell types present in the culture, and methods used for cell culture establishment. Further studies are necessary to identify factors that determine hormone-responsiveness and transcriptional activity of milk protein genes in goat primary mammary cell cultures.
Key words: Beta-casein; Epithelial cell culture; Gene expression; Mammary gland
INTRODUCTION
Regulation of milk expression in ruminants is important for the dairy industry. Ad-ditionally, a short gestation period, early maturation, smaller body size compared to bovine, and relatively high production of milk makes goats very suitable for biopharming by targeting protein expression in their mammary glands (Niemann and Kues, 2003; Nowak-Imialek et al., 2011). Milk protein promoters are often used to express gene constructs in the mammary gland. For example, the first marketed human recombinant protein produced in transgenic animal, antithrombin III, was synthesized in the goat mammary gland under control of the beta-casein promoter (Edmunds et al., 1998; Nowak-Imialek et al., 2011).
Cell-based models are very useful for studying the physiological and immunological functions of different cell types, without raising ethical issues associated with experimentation on live animals. Several immortalized ruminant mammary epithelial cell lines exist, including bovine MAC-T (Huynh et al., 1991) and BME-UV (Zavizion et al., 1996). However, transformed mammary cells contain genetic modifications that result in low responsiveness to lactogenic hor-mones (German and Barash, 2002) and show very low to no milk protein expression (Huynh et al., 1991). Therefore, the use of a primary mammary cell line is much more representative of the in vivo system (Pantschenko et al., 2000). Such primary mammary cell culture models can be used for lactation studies, in vitro expression of recombinant proteins, or to evaluate expression of gene constructs in mammary cells, prior to generating transgenic animals.
Beta-casein (CSN2) is the most abundant protein in goat milk. It was previously shown to be expressed under in vitro conditions in different species, such as in mice immortalized HC11 cells (Ball et al., 1988), several bovine mammary cell lines (Huynh et al., 1991; Ahn et al., 1995; Rose et al., 2002; Zhao et al., 2010; Jedrzejczak and Szatkowska, 2013), and goat primary mammary cells (Pantschenko et al., 2000; Ogorevc et al., 2009; Tong et al., 2012). Growth of mouse primary mammary cells on a plastic surface typically results in the loss of tissue specific functions (Blum et al., 1989). In contrast, it has been shown that growth of mammary epithelial cells (MECs) on pre-formed extracellular matrices induces morphologi-cal differentiation as well as milk component synthesis (Rose et al., 2002; Katz and Streuli, 2007). Kabotyanski et al. (2009) studied transcription of CSN2 in mouse HC11 cells and found that its expression is induced synergistically by lactogenic hormones, local growth factors, and cell-cell and cell-substratum interactions.
In this study, we quantified CSN2 expression in primary cell lines established from mammary tissue of 2 lactating and 1 nulliparous pubertal goat. We evaluated how the addition of hormones (insulin, hydrocortisone, and prolactin) to the growth medium and growth on a
3483
©FUNPEC-RP www.funpecrp.com.brGenetics and Molecular Research 14 (2): 3481-3490 (2015)
Beta-casein expression in goat mammary cells
commercially prepared extracellular basement membrane matrix affected the relative expres-sion of beta-casein in primary goat MEC (pgMEC) lines.
MATERIAL AND METHODS
Cell culture
Mammary tissue was obtained from slaughter animals. Tissue from 2 lactating Saanen (designated as LG1 and LG2) and 1 nulliparous pubertal Boer goat (designated as NLG) was used in the study. Both lactating Saanen goats were approximately 3 years old at the peak of lac-tation. The non-lactating pubertal Boer goat was non-pregnant and approximately 8 months old.
The removed mammary tissue was cut into pieces and washed in Hank’s Balanced Salt Solution (Sigma-Aldrich, St. Louis, MO, USA) containing 200 µg/mL penicillin, 200 µg/mL streptomycin, and 200 µg/mL ampicillin (Sigma-Aldrich). Tissue was mechanically disin-tegrated and enzymatically digested at 37°C in 400 U/mL collagenase (Biochrom AG, Berlin, Germany) and 400 U/mL hyaluronidase (Sigma-Aldrich) solution, prepared in Hank’s Bal-anced Salt Solution containing 4-(2-hydroxyethyl)-1-piperazine-ethanesulfonic acid (Sigma-Aldrich). The digested products were collected at 60, 120, and 180 min, washed with Hank’s Balanced Salt Solution, and sieved through a series of steel meshes of decreasing pore size, and finally through a 40-µm cell strainer. The filtrates were centrifuged at 300 g for 5 min and resuspended in growth or freezing medium. Aliquots of cell suspensions were plated on plas-tic or Geltrex (Gibco, Grand Island, NY, USA) covered plastic flasks in RPMI-1640 growth medium (Sigma-Aldrich), supplemented with 0.1 mM l-methionine, 0.4 mM l-lysine, 2 g/L NaHCO3, 1 mM Na-pyruvate, 2 mM glutamine, and 10% fetal bovine serum (Sigma-Aldrich), with or without the addition of lactogenic hormones. The cells were incubated at 37°C with 5% CO2 and saturated humidity. The medium was changed every 2-3 days.
Luminal, myoepithelial, and fibroblast cells were identified using antibodies against cytokeratin 18 (sc-51582, Santa Cruz Biotechnology, Santa Cruz, CA, USA), cytokeratin 14 (PRB-155P, Covance, Princeton, NJ, USA), and vimentin (sc-73262, Santa Cruz Biotechnol-ogy), respectively. Selective trypsinization was used to remove fibroblasts and to enrich the epithelial fraction in the cell cultures.
Three different treatments were applied to the cells; the first group (control group) was grown on plastic without the addition of lactogenic hormones to the medium. The 2 treatments included the addition of lactogenic hormones [1 µg/mL insulin, 1 µg/mL prolactin, and 1 µg/mL hydrocortisone (Sigma-Aldrich)] to the lactogenic medium and were grown either on plas-tic or on a thin-layer of basement membrane matrix, respectively. Dilution of 1% Geltrex (Life Technologies, Carlsbad, CA, USA) was used to cover the flasks according to the manufacturer protocol. The cells were grown for 3 weeks in T25 flasks to allow cells to cover the surface, establish proper cell-cell and cell-surface interactions, and to undergo terminal differentia-tion. Every treatment was performed in triplicate and the cells of the technical replicates were pooled prior to RNA isolation.
RNA isolation
Cells were lysed directly in 1.5 mL Qiazol (Qiagen, Hilden, Germany) in growth flasks. Total RNA was extracted using the miRNeasy kit (Qiagen) according to the manufac-
3484
©FUNPEC-RP www.funpecrp.com.brGenetics and Molecular Research 14 (2): 3481-3490 (2015)
J. Ogorevc and P. Dovč
turer protocol. RNA quantity and purity was measured using a NanoVue spectrophotometer (GE Healthcare, Little Chalfont, UK). Isolated RNA was treated with DNase I (Fermentas, Vilnius, Lithuania) and copied into cDNA, using a High-Capacity Reverse Transcription cDNA kit (Applied Biosystems, Foster City, CA, USA). All samples were diluted to a final concentration of approximately 100 ng/µL cDNA.
Reverse transcription quantitative polymerase chain reaction (PCR)
The relative expression of CSN2 was determined using reverse transcription quan-titative PCR (RT-qPCR). The primers used for the CSN2 detection were as follows: forward 5'-ACAGCCTCCCACAAAACATC-3', and reverse 5'-AGGAAGGTGCAGCTTTTCAA-3'. Glyceraldehyde 3-phosphate dehydrogenase (GAPDH) expression was used as an endogenous control. The primers used for GAPDH amplification were as follows: forward 5'-CATGTTTGTGATGGGCGTGAACCA-3', and reverse 5'-TAAGTCCCTCCACGATGCCAAAGT-3'. Ex-pression analysis was conducted in a Viia7 real-time PCR system (Applied Biosystems) in 3 technical replicates for each sample. The amplification reactions contained 2X SYBR Green PCR master mix (Applied Biosystems), water, and 0.5 µM of each primer in a total volume of 20 µL. The cycles were as follows: 2 min at 50°C, 10 min at 95°C, and 40 cycles at 95°C for 15 s and 60°C for 1 min. A melting curve was determined at 15 s for 95°C, 1 min at 58°C, and 15 s at 95°C. Relative quantification with efficiency correction was used to determine the relative expression of CSN2 (Pfaffl 2001). The primer efficiency for CSN2 and GADPH was determined using 7 serial dilutions of a sample cDNA. The reaction efficiency for GAPDH was 0.92 and for CSN2 was 1.04. Student t-test was applied to determine whether differences in expression of CSN2 between the groups were statistically significant (P ≤ 0.05).
Immunofluorescence
For immunofluorescence, the cells were washed with phosphate-buffered saline (PBS) and fixed in 4% paraformaldehyde. Permeabilization was conducted using 0.1% Triton X-100. Goat serum diluted to 10% was used to block the cells for 1 h. Next, the cells were incubated with primary antibodies at 8°C overnight and in phosphate-buffered saline-BSA alone as a nonspecific binding control. For beta-casein detection, a rabbit polyclonal antibody against sheep beta-casein (dilution 1:200 in phosphate-buffered saline containing 3% BSA) was used. The signal was visualized using secondary goat anti-rabbit Alexa Fluor-conjugated antibodies (A11008, Invitrogen, Carlsbad, CA, USA). Nuclei were counterstained with 4',6-diamidino-2-phenylindole.
RESULTS AND DISCUSSION
Establishment and characterization of pgMECs
Digestion of mammary tissue resulted in a heterogeneous mixture of cells consisting mainly of epithelial and mesenchymal cells (Figure 1-A). As described previously (Ogorevc et al., 2009; Prpar et al., 2012), goat mammary cells can be successfully characterized using antibodies against cytokeratin 14 to recognize myoepithelial cells, cytokeratin 18 for luminal cells, and vimentin for fibroblasts. Established primary cultures consisted of a mixture of all
3485
©FUNPEC-RP www.funpecrp.com.brGenetics and Molecular Research 14 (2): 3481-3490 (2015)
Beta-casein expression in goat mammary cells
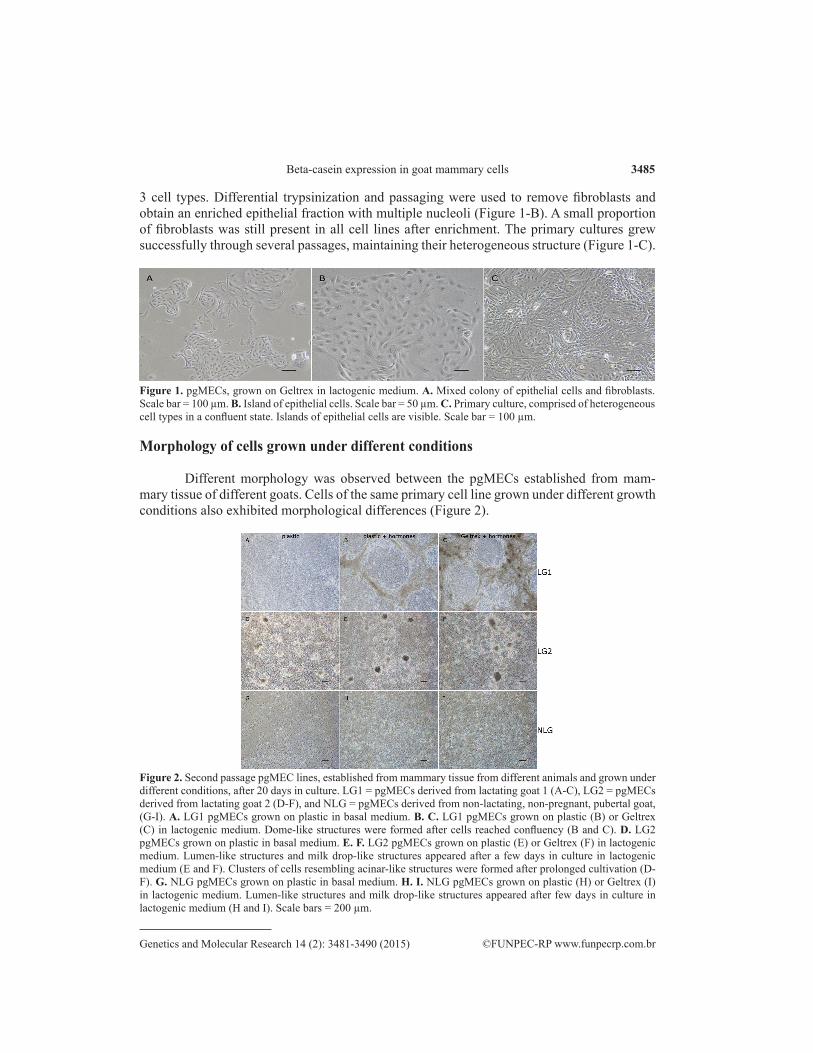
3 cell types. Differential trypsinization and passaging were used to remove fibroblasts and obtain an enriched epithelial fraction with multiple nucleoli (Figure 1-B). A small proportion of fibroblasts was still present in all cell lines after enrichment. The primary cultures grew successfully through several passages, maintaining their heterogeneous structure (Figure 1-C).
Figure 1. pgMECs, grown on Geltrex in lactogenic medium. A. Mixed colony of epithelial cells and fibroblasts. Scale bar = 100 µm. B. Island of epithelial cells. Scale bar = 50 µm. C. Primary culture, comprised of heterogeneous cell types in a confluent state. Islands of epithelial cells are visible. Scale bar = 100 µm.
Morphology of cells grown under different conditions
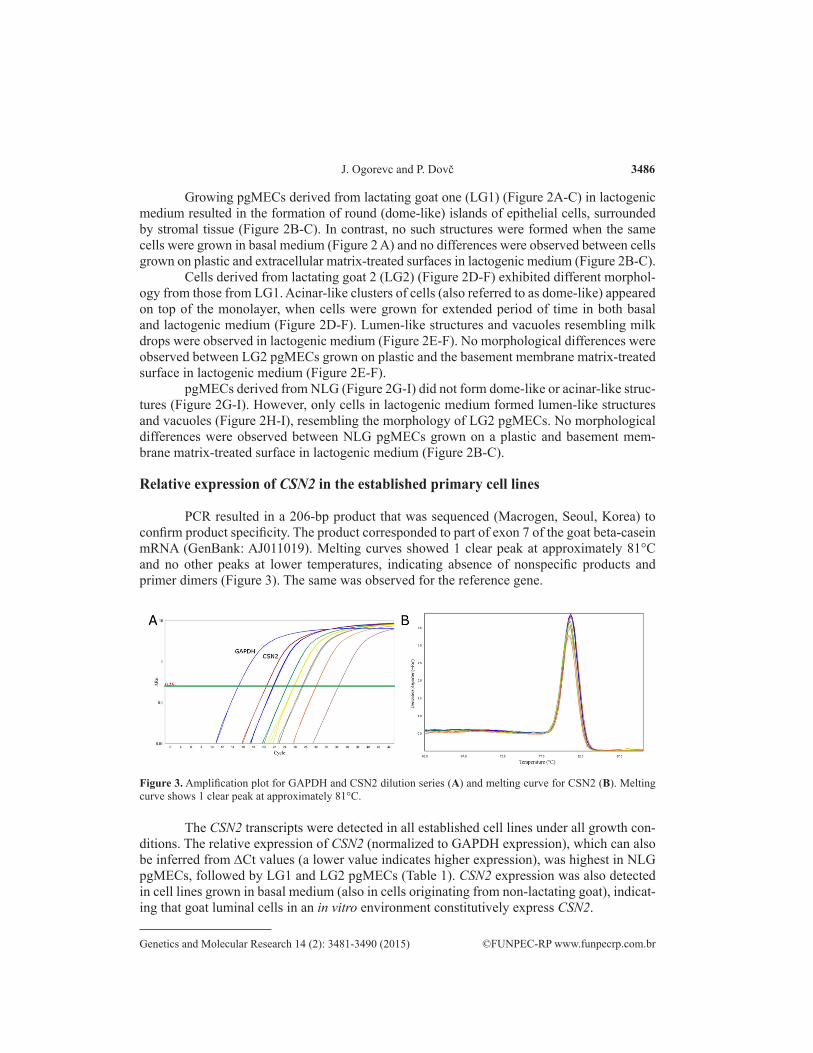
Different morphology was observed between the pgMECs established from mam-mary tissue of different goats. Cells of the same primary cell line grown under different growth conditions also exhibited morphological differences (Figure 2).
Figure 2. Second passage pgMEC lines, established from mammary tissue from different animals and grown under different conditions, after 20 days in culture. LG1 = pgMECs derived from lactating goat 1 (A-C), LG2 = pgMECs derived from lactating goat 2 (D-F), and NLG = pgMECs derived from non-lactating, non-pregnant, pubertal goat, (G-I). A. LG1 pgMECs grown on plastic in basal medium. B. C. LG1 pgMECs grown on plastic (B) or Geltrex (C) in lactogenic medium. Dome-like structures were formed after cells reached confluency (B and C). D. LG2 pgMECs grown on plastic in basal medium. E. F. LG2 pgMECs grown on plastic (E) or Geltrex (F) in lactogenic medium. Lumen-like structures and milk drop-like structures appeared after a few days in culture in lactogenic medium (E and F). Clusters of cells resembling acinar-like structures were formed after prolonged cultivation (D-F). G. NLG pgMECs grown on plastic in basal medium. H. I. NLG pgMECs grown on plastic (H) or Geltrex (I) in lactogenic medium. Lumen-like structures and milk drop-like structures appeared after few days in culture in lactogenic medium (H and I). Scale bars = 200 µm.
3486
©FUNPEC-RP www.funpecrp.com.brGenetics and Molecular Research 14 (2): 3481-3490 (2015)
J. Ogorevc and P. Dovč
Growing pgMECs derived from lactating goat one (LG1) (Figure 2A-C) in lactogenic medium resulted in the formation of round (dome-like) islands of epithelial cells, surrounded by stromal tissue (Figure 2B-C). In contrast, no such structures were formed when the same cells were grown in basal medium (Figure 2 A) and no differences were observed between cells grown on plastic and extracellular matrix-treated surfaces in lactogenic medium (Figure 2B-C).
Cells derived from lactating goat 2 (LG2) (Figure 2D-F) exhibited different morphol-ogy from those from LG1. Acinar-like clusters of cells (also referred to as dome-like) appeared on top of the monolayer, when cells were grown for extended period of time in both basal and lactogenic medium (Figure 2D-F). Lumen-like structures and vacuoles resembling milk drops were observed in lactogenic medium (Figure 2E-F). No morphological differences were observed between LG2 pgMECs grown on plastic and the basement membrane matrix-treated surface in lactogenic medium (Figure 2E-F).
pgMECs derived from NLG (Figure 2G-I) did not form dome-like or acinar-like struc-tures (Figure 2G-I). However, only cells in lactogenic medium formed lumen-like structures and vacuoles (Figure 2H-I), resembling the morphology of LG2 pgMECs. No morphological differences were observed between NLG pgMECs grown on a plastic and basement mem-brane matrix-treated surface in lactogenic medium (Figure 2B-C).
Relative expression of CSN2 in the established primary cell lines
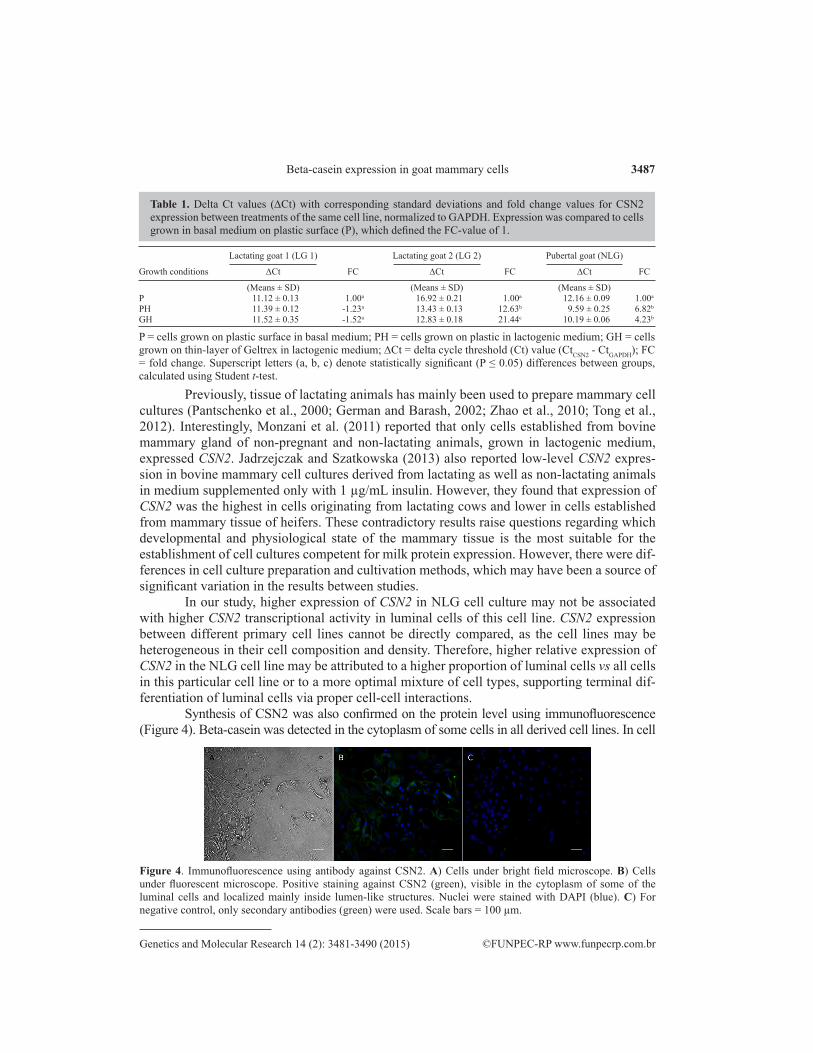
PCR resulted in a 206-bp product that was sequenced (Macrogen, Seoul, Korea) to confirm product specificity. The product corresponded to part of exon 7 of the goat beta-casein mRNA (GenBank: AJ011019). Melting curves showed 1 clear peak at approximately 81°C and no other peaks at lower temperatures, indicating absence of nonspecific products and primer dimers (Figure 3). The same was observed for the reference gene.
Figure 3. Amplification plot for GAPDH and CSN2 dilution series (A) and melting curve for CSN2 (B). Melting curve shows 1 clear peak at approximately 81°C.
The CSN2 transcripts were detected in all established cell lines under all growth con-ditions. The relative expression of CSN2 (normalized to GAPDH expression), which can also be inferred from DCt values (a lower value indicates higher expression), was highest in NLG pgMECs, followed by LG1 and LG2 pgMECs (Table 1). CSN2 expression was also detected in cell lines grown in basal medium (also in cells originating from non-lactating goat), indicat-ing that goat luminal cells in an in vitro environment constitutively express CSN2.
3487
©FUNPEC-RP www.funpecrp.com.brGenetics and Molecular Research 14 (2): 3481-3490 (2015)
Beta-casein expression in goat mammary cells
Previously, tissue of lactating animals has mainly been used to prepare mammary cell cultures (Pantschenko et al., 2000; German and Barash, 2002; Zhao et al., 2010; Tong et al., 2012). Interestingly, Monzani et al. (2011) reported that only cells established from bovine mammary gland of non-pregnant and non-lactating animals, grown in lactogenic medium, expressed CSN2. Jadrzejczak and Szatkowska (2013) also reported low-level CSN2 expres-sion in bovine mammary cell cultures derived from lactating as well as non-lactating animals in medium supplemented only with 1 µg/mL insulin. However, they found that expression of CSN2 was the highest in cells originating from lactating cows and lower in cells established from mammary tissue of heifers. These contradictory results raise questions regarding which developmental and physiological state of the mammary tissue is the most suitable for the establishment of cell cultures competent for milk protein expression. However, there were dif-ferences in cell culture preparation and cultivation methods, which may have been a source of significant variation in the results between studies.
In our study, higher expression of CSN2 in NLG cell culture may not be associated with higher CSN2 transcriptional activity in luminal cells of this cell line. CSN2 expression between different primary cell lines cannot be directly compared, as the cell lines may be heterogeneous in their cell composition and density. Therefore, higher relative expression of CSN2 in the NLG cell line may be attributed to a higher proportion of luminal cells vs all cells in this particular cell line or to a more optimal mixture of cell types, supporting terminal dif-ferentiation of luminal cells via proper cell-cell interactions.
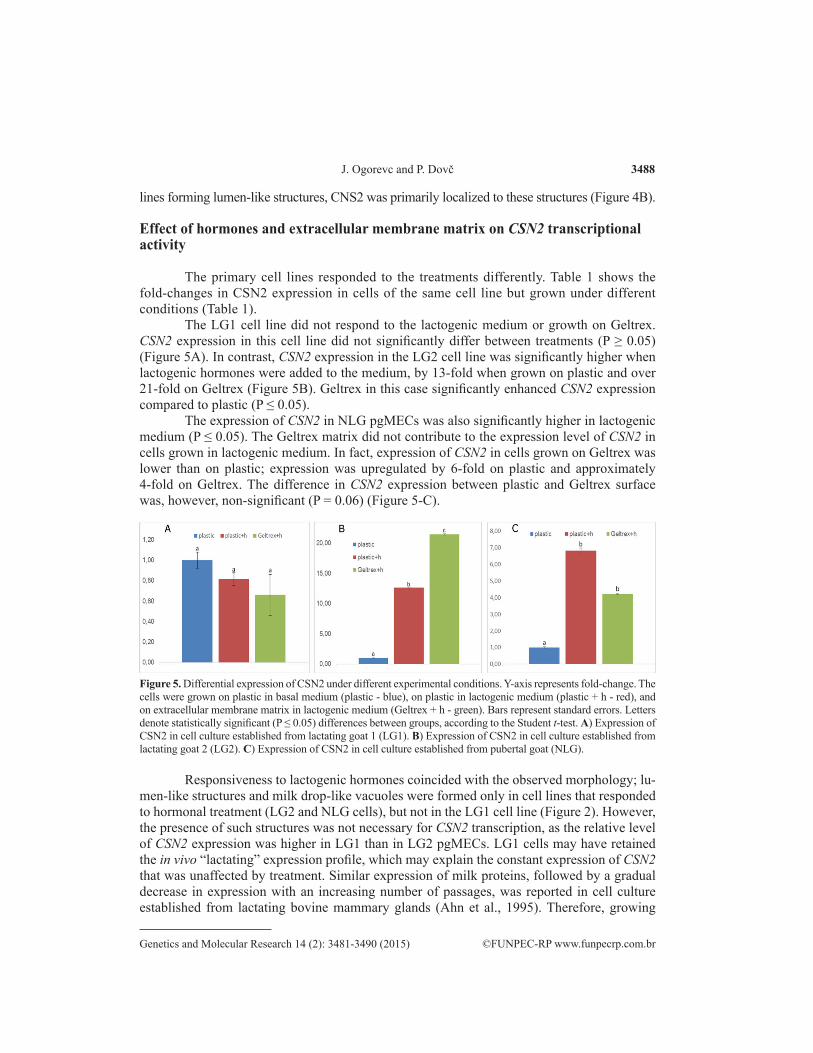
Synthesis of CSN2 was also confirmed on the protein level using immunofluorescence (Figure 4). Beta-casein was detected in the cytoplasm of some cells in all derived cell lines. In cell
Table 1. Delta Ct values (DCt) with corresponding standard deviations and fold change values for CSN2 expression between treatments of the same cell line, normalized to GAPDH. Expression was compared to cells grown in basal medium on plastic surface (P), which defined the FC-value of 1.
Lactating goat 1 (LG 1) Lactating goat 2 (LG 2) Pubertal goat (NLG)
Growth conditions DCt FC DCt FC DCt FC
(Means ± SD) (Means ± SD) (Means ± SD) P 11.12 ± 0.13 1.00a 16.92 ± 0.21 1.00a 12.16 ± 0.09 1.00a
PH 11.39 ± 0.12 -1.23a 13.43 ± 0.13 12.63b 9.59 ± 0.25 6.82b
GH 11.52 ± 0.35 -1.52a 12.83 ± 0.18 21.44c 10.19 ± 0.06 4.23b
P = cells grown on plastic surface in basal medium; PH = cells grown on plastic in lactogenic medium; GH = cells grown on thin-layer of Geltrex in lactogenic medium; DCt = delta cycle threshold (Ct) value (CtCSN2 - CtGAPDH); FC = fold change. Superscript letters (a, b, c) denote statistically significant (P ≤ 0.05) differences between groups, calculated using Student t-test.
Figure 4. Immunofluorescence using antibody against CSN2. A) Cells under bright field microscope. B) Cells under fluorescent microscope. Positive staining against CSN2 (green), visible in the cytoplasm of some of the luminal cells and localized mainly inside lumen-like structures. Nuclei were stained with DAPI (blue). C) For negative control, only secondary antibodies (green) were used. Scale bars = 100 µm.
3488
©FUNPEC-RP www.funpecrp.com.brGenetics and Molecular Research 14 (2): 3481-3490 (2015)
J. Ogorevc and P. Dovč
lines forming lumen-like structures, CNS2 was primarily localized to these structures (Figure 4B).
Effect of hormones and extracellular membrane matrix on CSN2 transcriptional activity
The primary cell lines responded to the treatments differently. Table 1 shows the fold-changes in CSN2 expression in cells of the same cell line but grown under different conditions (Table 1).
The LG1 cell line did not respond to the lactogenic medium or growth on Geltrex. CSN2 expression in this cell line did not significantly differ between treatments (P ≥ 0.05) (Figure 5A). In contrast, CSN2 expression in the LG2 cell line was significantly higher when lactogenic hormones were added to the medium, by 13-fold when grown on plastic and over 21-fold on Geltrex (Figure 5B). Geltrex in this case significantly enhanced CSN2 expression compared to plastic (P ≤ 0.05).
The expression of CSN2 in NLG pgMECs was also significantly higher in lactogenic medium (P ≤ 0.05). The Geltrex matrix did not contribute to the expression level of CSN2 in cells grown in lactogenic medium. In fact, expression of CSN2 in cells grown on Geltrex was lower than on plastic; expression was upregulated by 6-fold on plastic and approximately 4-fold on Geltrex. The difference in CSN2 expression between plastic and Geltrex surface was, however, non-significant (P = 0.06) (Figure 5-C).
Figure 5. Differential expression of CSN2 under different experimental conditions. Y-axis represents fold-change. The cells were grown on plastic in basal medium (plastic - blue), on plastic in lactogenic medium (plastic + h - red), and on extracellular membrane matrix in lactogenic medium (Geltrex + h - green). Bars represent standard errors. Letters denote statistically significant (P ≤ 0.05) differences between groups, according to the Student t-test. A) Expression of CSN2 in cell culture established from lactating goat 1 (LG1). B) Expression of CSN2 in cell culture established from lactating goat 2 (LG2). C) Expression of CSN2 in cell culture established from pubertal goat (NLG).
Responsiveness to lactogenic hormones coincided with the observed morphology; lu-men-like structures and milk drop-like vacuoles were formed only in cell lines that responded to hormonal treatment (LG2 and NLG cells), but not in the LG1 cell line (Figure 2). However, the presence of such structures was not necessary for CSN2 transcription, as the relative level of CSN2 expression was higher in LG1 than in LG2 pgMECs. LG1 cells may have retained the in vivo “lactating” expression profile, which may explain the constant expression of CSN2 that was unaffected by treatment. Similar expression of milk proteins, followed by a gradual decrease in expression with an increasing number of passages, was reported in cell culture established from lactating bovine mammary glands (Ahn et al., 1995). Therefore, growing
3489
©FUNPEC-RP www.funpecrp.com.brGenetics and Molecular Research 14 (2): 3481-3490 (2015)
Beta-casein expression in goat mammary cells
LG1 cells for several more passages in non-lactogenic medium may change the physiological state of the cells and result in an eventual loss of CSN2 expression. Additionally, relatively low concentrations of lactogenic hormones were used in the study (1 µg/mL). Using higher concentrations of the lactogenesis induction hormones may increase the differences in CSN2 expression between hormone-treated and untreated cells.
Growth on the Geltrex matrix resulted in upregulation of CSN2 in the LG2 cell line, while LG1 and NLG showed no statistically significant effect. Adjusting the concentration of Geltrex and/or growth methods may be necessary for the other 2 cell lines to show statistically significant effects in CSN2 expression. Another probable explanation is that some cell types present in a heterogeneous mixture of pgMECs can produce endogenous extracellular matrix, which is sufficient for luminal cells to become competent. Mouse HC11 cells can produce the matrix (Chammas et al., 1994) and do not require additional matrix for CSN2 expression (Ball et al., 1988). Therefore, we can speculate that the established cell lines, heterogeneous in their cell composition, contained extracellular matrix-producing cells that were present mainly in the LG1 and NLG cell lines, but not in the LG2 cell line.
Several studies assessing the expression of milk proteins in ruminant mammary cell cultures have been conducted in bovines (Ahn et al., 1995; Rose et al., 2002; Jedrzejczak and Szatkowska, 2013). In goats, however, this is one of the first studies examining beta-casein expression in in vitro conditions. Compared to bovine MECs, pgMECs appear to be less sensi-tive to culture conditions to express CSN2.
Interestingly, cell lines originating from mammary tissue in a similar physiological state (LG1 and LG2) responded differently to hormonal treatment and exhibited different mor-phology. Therefore, only subtle differences appearing in the starting tissue material may be of significant importance for latter CSN2 transcriptional activity in vitro. Tissue from young non-lactating goats may be more suitable for preparing competent cell cultures than tissue from lactating or involuting animals, which is also because of the higher efficiency of maintaining the derived cell culture (Jedrzejczak and Szatkowska, 2013).
The extracellular membrane matrix was not indispensable for expression of CSN2 in pgMECs. The need for exogenous extracellular matrix may depend on the cell types present in the primary cell culture. Production of endogenous extracellular matrix is sometimes suf-ficient for producing competent luminal cells.
Mammary tissue, originating from animals in different developmental stages (e.g. ju-venile, pubertal, lactating, and involuting) should be further compared under different growth conditions using standardized preparation and cultivation methods. Such approach may reveal factors affecting the transcriptional activity of milk protein genes.
ACKNOWLEDGMENTS
Research supported by the Slovenian Research Agency (ARRS) (research program #P4-0220 and research project #Z4-5523).
REFERENCES
Ahn JY, Aoki N, Adachi T, Mizuno Y, et al. (1995). Isolation and culture of bovine mammary epithelial cells and establishment of gene transfection conditions in the cells. Biosci. Biotechnol. Biochem. 59: 59-64.
Ball RK, Friis RR, Schoenenberger CA, Doppler W, et al. (1988). Prolactin regulation of beta-casein gene expression and
3490
©FUNPEC-RP www.funpecrp.com.brGenetics and Molecular Research 14 (2): 3481-3490 (2015)
J. Ogorevc and P. Dovč
of a cytosolic 120-kd protein in a cloned mouse mammary epithelial cell line. EMBO J. 7: 2089-2095.Blum JL, Zeigler ME and Wicha MS (1989). Regulation of mammary differentiation by the extracellular matrix. Environ.
Health Perspect. 80: 71-83.Chammas R, Taverna D, Cella N, Santos C et al. (1994). Laminin and tenascin assembly and expression regulate HC11
mouse mammary cell differentiation. J. Cell Sci. 107: 1031-1040.Edmunds T, Van Patten SM, Pollock J, Hanson E, et al. (1998). Transgenically produced human antithrombin: structural
and functional comparison to human plasma-derived antithrombin. Blood 91: 4561-4571.German T and Barash I (2002). Characterization of an epithelial cell line from bovine mammary gland. In Vitro Cell. Dev.
Biol. Anim. 38: 282-292.Huynh HT, Robitaille G and Turner JD (1991). Establishment of bovine mammary epithelial cells (MAC-T): an in vitro
model for bovine lactation. Exp. Cell Res. 197: 191-199.Jedrzejczak M and Szatkowska I (2013). Bovine mammary epithelial cell cultures for the study of mammary gland
functions. In Vitro Cell. Dev. Biol. Anim. Epub ahead of print.Kabotyanski EB, Rijnkels M, Freeman-Zadrowski C, Buser AC et al. (2009). Lactogenic hormonal induction of long
distance interactions between beta-casein gene regulatory elements. J. Biol. Chem. 284: 22815-22824.Katz E and Streuli CH (2007). The extracellular matrix as an adhesion checkpoint for mammary epithelial function. Int.
J. Biochem. Cell Biol. 39: 715-726.Monzani PS, Bressan FF, Mesquita LG, Sangalli JR et al. (2011). b-casein gene expression by in vitro cultured bovine
mammary epithelial cells derived from developing mammary glands. Genet. Mol. Res. 10: 604-614.Niemann H and Kues WA (2003). Application of transgenesis in livestock for agriculture and biomedicine. Anim. Reprod.
Sci. 79: 291-317.Nowak-Imialek M, Kues W, Carnwath JW and Niemann H (2011). Pluripotent stem cells and reprogrammed cells in farm
animals. Microsc. Microanal. 17: 474-497.Ogorevc J, Prpar S and Dovč P (2009). In vitro mammary gland model: Establishment and characterization of a caprine
mammary epithelial cell line. Acta Agriculturae Slovenica 94: 133-138.Pantschenko AG, Woodcock-Mitchell J, Bushmich SL and Yang TJ (2000). Establishment and characterization of a
caprine mammary epithelial cell line (CMEC). In Vitro Cell. Dev. Biol. Anim. 36: 26-37.Pfaffl MW (2001). A new mathematical model for relative quantification in real-time RT-PCR. Nucleic Acids Res. 29: e45.Prpar S, Martignani E, Dovc P and Baratta M (2012). Identification of goat mammary stem/progenitor cells. Biol. Reprod.
86: e117.Rose MT, Aso H, Yonekura S, Komatsu T et al. (2002). In vitro differentiation of a cloned bovine mammary epithelial
cell. J. Dairy Res. 69: 345-355.Tong HL, Li QZ, Gao XJ and Yin DY (2012). Establishment and characterization of a lactating dairy goat mammary gland
epithelial cell line. In Vitro Cell. Dev. Biol. Anim. 48: 149-155.Zavizion B, van Duffelen M, Schaeffer W and Politis I (1996). Establishment and characterization of a bovine mammary
epithelial cell line with unique properties. In Vitro Cell. Dev. Biol. Anim. 32: 138-148.Zhao K, Liu HY, Zhou MM and Liu JX (2010). Establishment and characterization of a lactating bovine mammary
epithelial cell model for the study of milk synthesis. Cell Biol. Int. 34: 717-721.


![Alpha-Casein as a Molecular Chaperone · The major protein constituent of casein micelles, accounting for 65% of protein is S-casein [4]. The function of -casein, present at the surface](https://img.pdfslide.us/doc/110x75/5fd57079b24729154a34f060/alpha-casein-as-a-molecular-chaperone-the-major-protein-constituent-of-casein-micelles.jpg)