Embed Size (px)
Citation preview
RELATIVE CHIRAL ABUNDANCES OF CARBON NANOTUBES DETERMINED BY RELATIVE CHIRAL ABUNDANCES OF CARBON NANOTUBES DETERMINED BY RELATIVE CHIRAL ABUNDANCES OF CARBON NANOTUBES DETERMINED BY RELATIVE CHIRAL ABUNDANCES OF CARBON NANOTUBES DETERMINED BY
RESONANT RAMAN SPECTROSCOPY USING A TUNABLE DYE LASERRESONANT RAMAN SPECTROSCOPY USING A TUNABLE DYE LASERRESONANT RAMAN SPECTROSCOPY USING A TUNABLE DYE LASERRESONANT RAMAN SPECTROSCOPY USING A TUNABLE DYE LASER
H. Sugahara,1 A. Jeng,2 P. Yu,3 C. Kittrell,4 E. H. Haroz,5 and J. Kono5
1NanoJapan Program, Rice University and Graduate school of Engineering, Hokkaido
University
2Department of Chemical, Biological, and Materials Engineering, University of
Oklahoma
3North Texas University
4 Department of Chemistry, Rice University
5 Department of Electrical and Computer Engineering, Rice University
Current single-walled carbon nanotube (SWNT) synthesis methods can produce only a
mixture of both metallic and semiconducting chiralities. One common method for
measuring the relative abundance of each chirality is through the use of optical
absorption spectroscopy. However, since the optical transition energies of SWNTs are
highly dependent on diameter, chiral angle, and electronic type; and as-produced
samples typically contain many different (n,m) species, absorption spectra appear
highly congested due to overlap in between multiple optical features. As a result,
relative abundance is difficult to extract from such measurements. The use of
resonant Raman spectroscopy, however, over a wide excitation wavelength range can
avoid such difficulties and is one of the most effective methods to clearly identify
chirality. We have set up a high resolution, CW resonant Raman scattering spectroscopy
system with a tunable dye laser excitation to quantitatively determine the relative
population of different (n,m) species in SWNT samples. Using a Rhodamine 6G dye
laser pumped with a Nd:YAG laser, we have clearly identified members of the (8,8) and
(9,9) metallic families as well as various small-diameter semiconductor chiralities. By
combining the diameter-dependent radial breathing mode (RBM) frequency with the
at-resonance Raman intensity and electronic linewidth as measured from the excitation
profile for said RBM, clear identification of not only chirality but also relative
abundance was performed.
Acknowledgements
Single-walled carbon nanotube
Purpose
Raman Spectroscopy system
Results
Conclusion
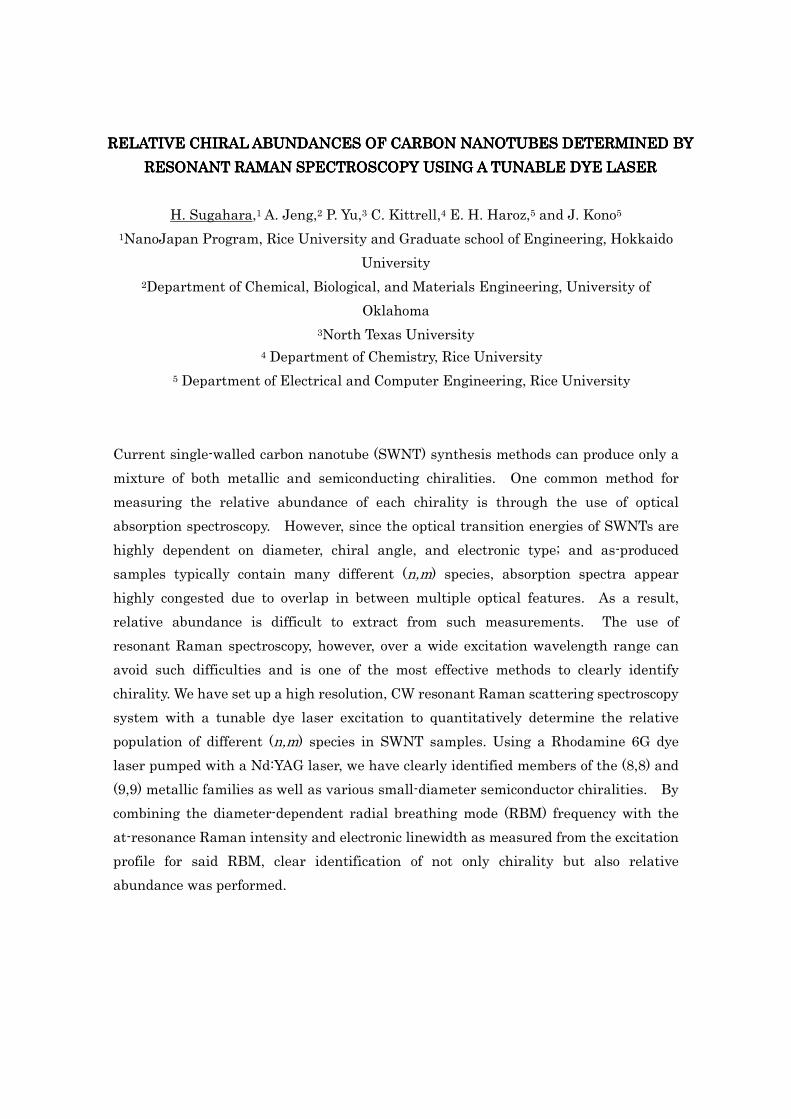
Current SWNT synthesis methods can produce only a mixture of both metallic and semiconducting chiralities.
Our aim is to quantitatively determine the relative population of different (n,m) species in SWNT samples.
Single-walled carbon nanotubes (SWNTs) can be metallic or semiconducting according to their chiralities or (n,m ) species.
Sample
We have set up a high resolution, continuous wave(CW) resonant Raman scattering spectroscopy system with a tunable dye laser excitation.
Nd:YAG Dye
Laser Sample
Spectrometer
Power : 5.0 W Wavelength : 518 nm
Dye : Rhodamine 6G Wavelength : 584-616 nm
Optical Setup
CCD Camera
Slit width :100 um
a2
a1 (n,m) = (4,2)
Ch = na1 + ma2 Chiral vector: 1) M = θ = 0
2) M ≠0, θ = 0
3) M ≠0, θ = ±1
Metal (Armchair)
Narrow Gap Semiconductor
Wide Gap Semiconductor
Metallic Semiconducting
Wavelength (nm)
Abs
orba
nce As-produced SWNT
RELATIVE CHIRAL ABUNDANCES OF CARBON NANOTUBES DETERMINED BY RESONANT RAMAN SPECTROSCOPY USING A TUNABLE DYE LASER
H. Sugahara1, A. Jeng2, P. Yu3, C. Kittrell4, E. H. Haroz5, and J. Kono5 1NanoJapan Program, Rice University and Graduate school of Engineering, Hokkaido University
2Department of Chemical, Biological, and Materials Engineering, University of Oklahoma 3North Texas University, 4Department of Chemistry, Rice University
5Department of Electrical and Computer Engineering, Rice University
Raman experiments were performed on HiPco-produced SWNTs. The samples were excited by tunable dye laser with powers of 100mW focused in to the nanotube solution.
n – m = 3M + θ
Radial Breathing Mode (RBM)
• RBM was used to determine the tube diameter of a specific (n,m) species and the diameter distribution of a nanotube sample.
• When combined with excitation energy information, RBM can give (n,m) species identification
Raman Excitation Profile (REP)
Raman spectrum
Excita0on profile
• Vertical slice Raman map. • When combined with RBM frequency (i.e. diameter) we can uniquely identify (n,m)
Absorption spectrum of As-produced SWNT
Cylindrical lens Resonant Raman scattering map
Exci
tatio
n w
avel
engt
h (n
m)
Raman Shift (cm-1)
Raman Shift (cm-1)
Inte
nsity
(arb
. uni
ts)
Raman spectrum
596 nm
(10,7)
(9,9)
(11,5) (12,3)
Energy(eV)
Rel
ativ
e In
tens
ity
(12,3) (11,5)
(9,9)
REP
• Identification of different chiralities in As-produced SWNT with a tunable dye laser
• Making a dark field spectroscopy system
I would like to thank Prof. Kono who provided feedback and valuable comments. I also want to thank Carter and Dr. Erik whose opinions and information have helped me very much throughout the production of this study.


![Arkema Graphistrength Multi-Walled Carbon Nanotubes · Zig-zag and chiral structures are semiconductive. Arm-chair structure is metallic. [1] Because of larger diameters, and thus](https://img.pdfslide.us/doc/110x75/602b48b13234590f0f5cf302/arkema-graphistrength-multi-walled-carbon-nanotubes-zig-zag-and-chiral-structures.jpg)