Embed Size (px)
Citation preview
Retrospective Theses and Dissertations Iowa State University Capstones, Theses andDissertations
1989
Relationships of water stress and abscisic acid onphotosynthesis of soybean and sunflower leavesXiaoyue LiIowa State University
Follow this and additional works at: https://lib.dr.iastate.edu/rtd
Part of the Agricultural Science Commons, Agriculture Commons, and the Agronomy and CropSciences Commons
This Dissertation is brought to you for free and open access by the Iowa State University Capstones, Theses and Dissertations at Iowa State UniversityDigital Repository. It has been accepted for inclusion in Retrospective Theses and Dissertations by an authorized administrator of Iowa State UniversityDigital Repository. For more information, please contact [email protected].
Recommended CitationLi, Xiaoyue, "Relationships of water stress and abscisic acid on photosynthesis of soybean and sunflower leaves " (1989). RetrospectiveTheses and Dissertations. 9067.https://lib.dr.iastate.edu/rtd/9067
INFORMATION TO USERS
The most advanced technology has been used to photograph and reproduce this manuscript from the microfilm master. UMI films the text directly from the original or copy submitted. Thus, some thesis and dissertation copies are in typewriter face, while others may be from any type of computer printer.
The quality of this reproduction is dependent upon the quality of the copy submitted. Broken or indistinct print, colored or poor quality illustrations and photographs, print bleedthrough, substandard margins, and improper alignment can adversely affect reproduction.
In the unlikely event that the author did not send UMI a complete manuscript and there are missing pages, these will be noted. Also, if unauthorized copyright material had to be removed, a note will indicate the deletion.
Oversize materials (e.g., maps, drawings, charts) are reproduced by sectioning the original, beginning at the upper left-hand corner and continuing from left to right in equal sections with small overlaps. Each original is also photographed in one exposure and is included in reduced form at the back of the book. These are also available as one exposure on a standard 35mm slide or as a 17" x 23" black and white photographic print for an additional charge.
Photographs included in the original manuscript have been reproduced xerographically in this copy. Higher quality 6" x 9" black and white photographic prints are available for any photographs or illustrations appearing in this copy for an additional charge. Contact UMI directly to order.
University Microfilms International A Bell & Howell Information Company
300 North Zeeb Road, Ann Arbor, Ml 48106-1346 USA 313/761-4700 800/521-0600
Order Number 9003547
Relationships of water stress and abscisic acid on photosynthesis of soybean and sunflower leaves
Li, Xiaoyue, Ph.D.
Iowa State University, 1989
U'M'I SOON.ZeebRd. Ann Arbor, MI 48106
Relationships of water stress and abscisic acid
on photosynthesis of soybean and sunflower leaves
by
Xiaoyue Li
A Dissertation Submitted to the
Graduate Faculty in Partial Fulfillment of the
Requirements for the Degree of
DOCTOR OF PHILOSOPHY
Department: Agronomy
Major: Crop Production and Physiology
Approved:
In Charge of Major Work
r the Major Department
For the Graduate College
Iowa State University
Ames, Iowa
1989
Signature was redacted for privacy.
Signature was redacted for privacy.
Signature was redacted for privacy.
ii
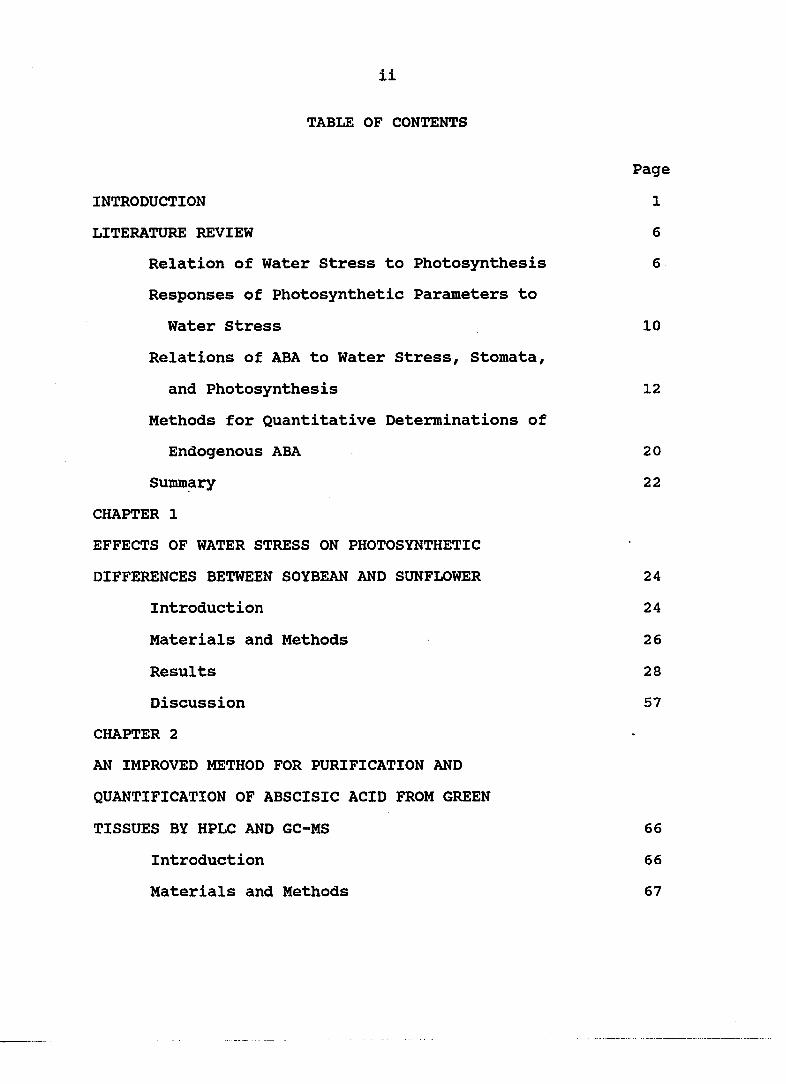
TABLE OF CONTENTS
Page
INTRODUCTION 1
LITERATURE REVIEW 6
Relation of Water Stress to Photosynthesis 6
Responses of Photosynthetic Parameters to
Water Stress 10
Relations of ABA to Water Stress, Stomata,
and Photosynthesis 12
Methods for Quantitative Determinations of
Endogenous ABA 20
Summary 22
CHAPTER 1
EFFECTS OF WATER STRESS ON PHOTOSYNTHETIC
DIFFERENCES BETWEEN SOYBEAN AND SUNFLOWER 24
Introduction 24
Materials and Methods 26
Results 28
Discussion 57
CHAPTER 2
AN IMPROVED METHOD FOR PURIFICATION AND
QUANTIFICATION OF ABSCISIC ACID FROM GREEN
TISSUES BY HPLC AND GC-MS 66
Introduction 66
Materials and Methods 67
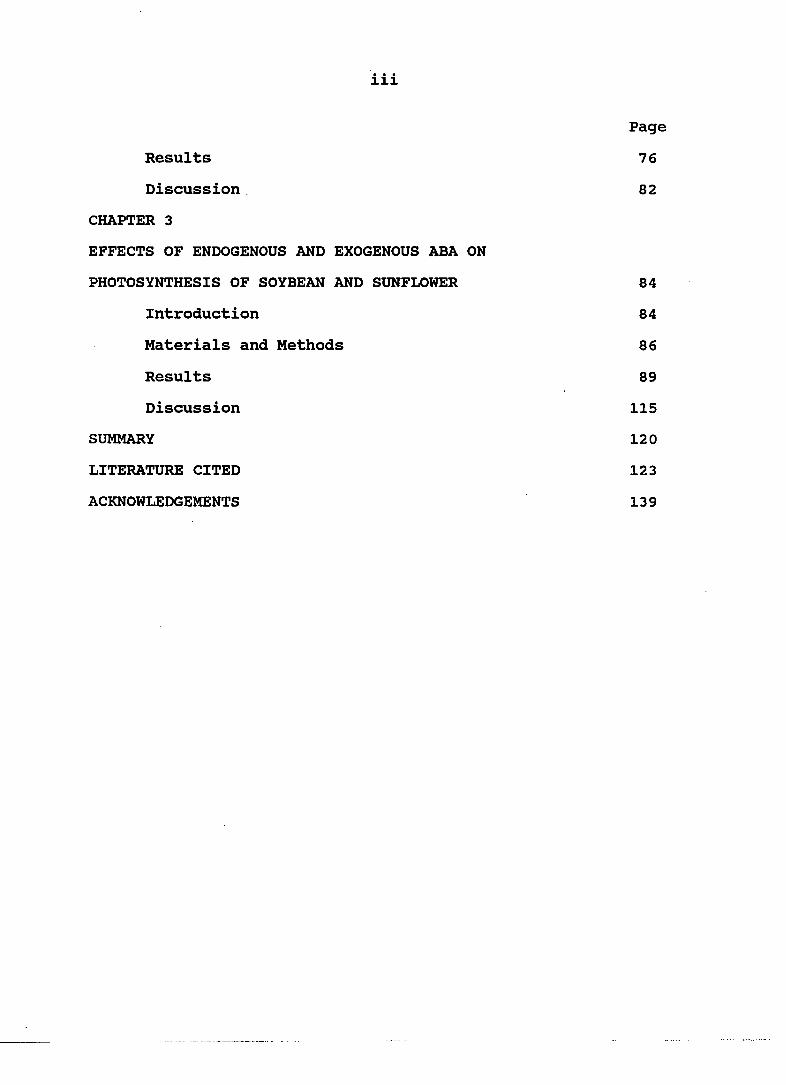
iii
Page
Results 76
Discussion 82
CHAPTER 3
EFFECTS OF ENDOGENOUS AND EXOGENOUS ABA ON
PHOTOSYNTHESIS OF SOYBEAN AND SUNFLOWER 84
Introduction 84
Materials and Methods 86
Results 89
Discussion 115
SUMMARY 120
LITERATURE CITED 123
ACKNOWLEDGEMENTS 139
iv
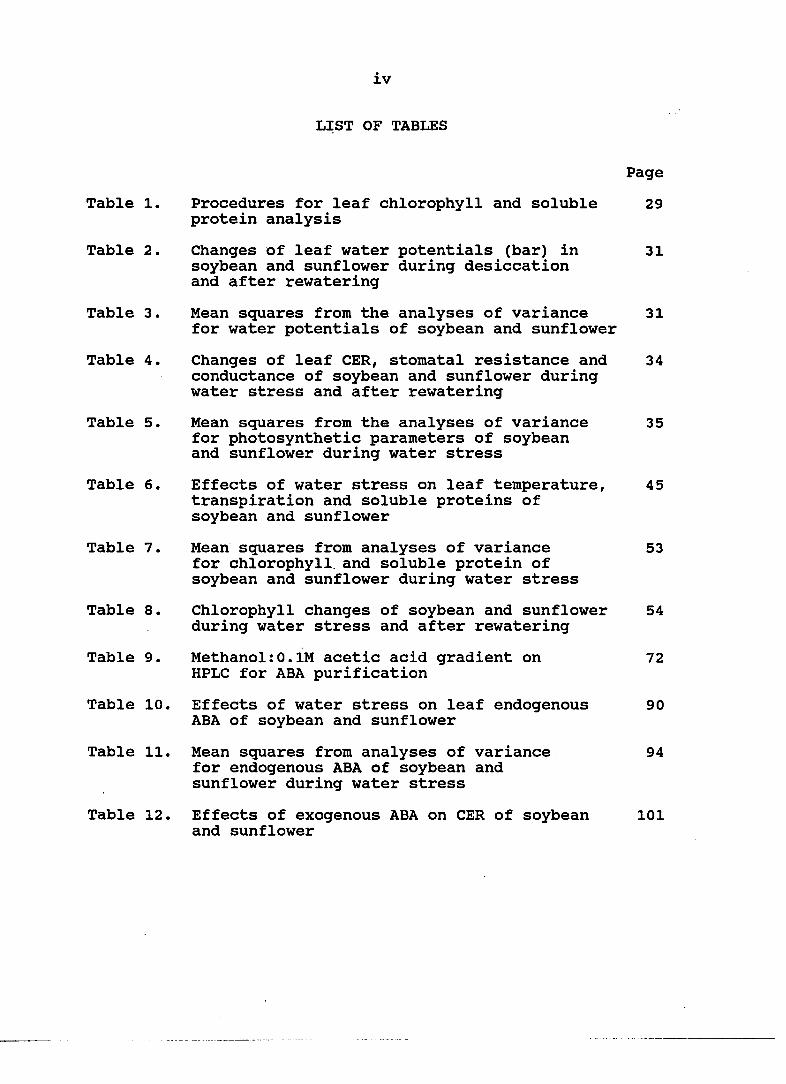
LIST OF TABLES
Table 1. Procedures for leaf chlorophyll and soluble protein analysis
Table 2. Changes of leaf water potentials (bar) in soybean and sunflower during desiccation and after rewatering
Table 3. Mean squares from the analyses of variance for water potentials of soybean and sunflower
Table 4. Changes of leaf CER, stomatal resistance and conductance of soybean and sunflower during water stress and after rewatering
Table 5. Mean squares from the analyses of variance for photosynthetic parameters of soybean and sunflower during water stress
Table 6. Effects of water stress on leaf temperature, transpiration and soluble proteins of soybean and sunflower
Table 7. Mean squares from analyses of variance for chlorophyll and soluble protein of soybean and sunflower during water stress
Table 8. Chlorophyll changes of soybean and sunflower during water stress and after rewatering
Table 9. Methanol: 0.IM acetic acid gradient on HPLC for ABA purification
Table 10. Effects of water stress on leaf endogenous ABA of soybean and sunflower
Table 11. Mean squares from analyses of variance for endogenous ABA of soybean and sunflower during water stress
Table 12. Effects of exogenous ABA on CER of soybean and sunflower
Page
29
31
31
34
35
45
53
54
72
90
94
101
V
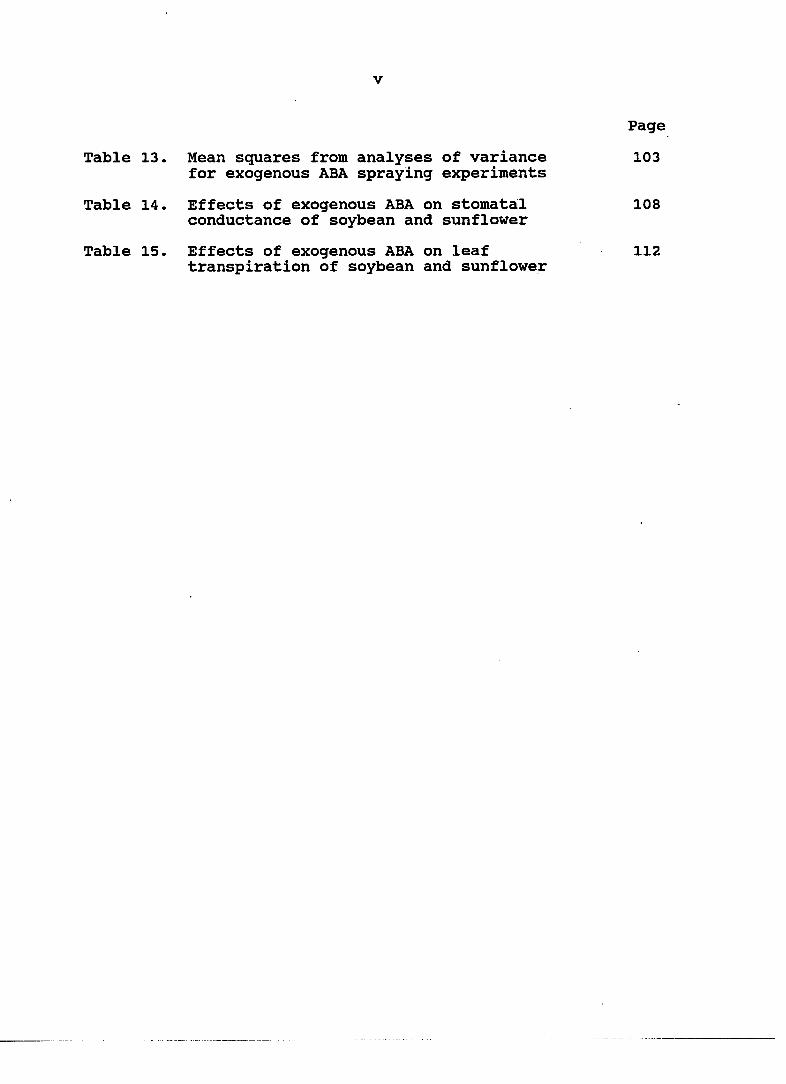
Table 13.
Table 14.
Table 15.
Mean squares from analyses of variance for exogenous ABA spraying experiments
Effects of exogenous ABA on stomatal conductance of soybean and sunflower
Effects of exogenous ABA on leaf transpiration of soybean and sunflower
Page
103
108
112
vi
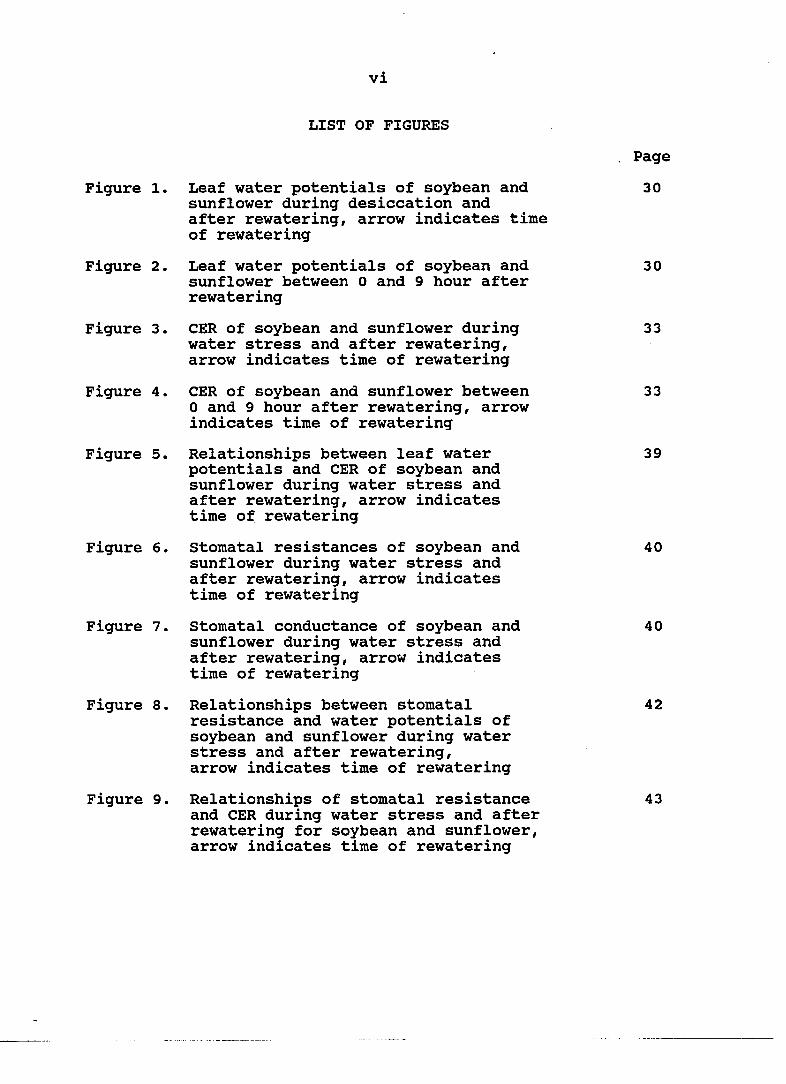
LIST OF FIGURES
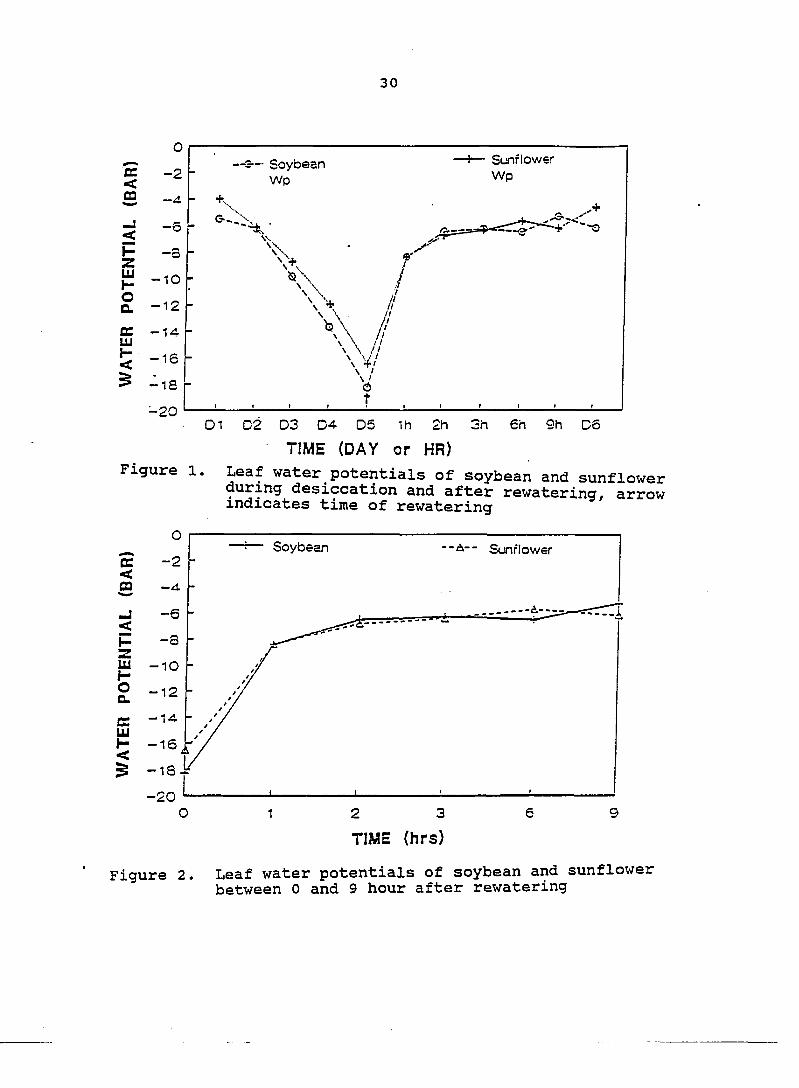
Figure 1. Leaf water potentials of soybean and sunflower during desiccation and after rewatering, arrow indicates time of rewatering
Figure 2. Leaf water potentials of soybean and sunflower between 0 and 9 hour after rewatering
Figure 3. CER of soybean and sunflower during water stress and after rewatering, arrow indicates time of rewatering
Figure 4. CER of soybean and sunflower between 0 and 9 hour after rewatering, arrow indicates time of rewatering
Figure 5. Relationships between leaf water potentials and CER of soybean and sunflower during water stress and after rewatering, arrow indicates time of rewatering
Figure 6. Stomatal resistances of soybean and sunflower during water stress and after rewatering, arrow indicates time of rewatering
Figure 7. Stomatal conductance of soybean and sunflower during water stress and after rewatering, arrow indicates time of rewatering
Figure 8. Relationships between stomatal resistance and water potentials of soybean and sunflower during water stress and after rewatering, arrow indicates time of rewatering
Figure 9. Relationships of stomatal resistance and CER during water stress and after rewatering for soybean and sunflower, arrow indicates time of rewatering
Page
30
30
33
33
39
40
40
42
43
vii
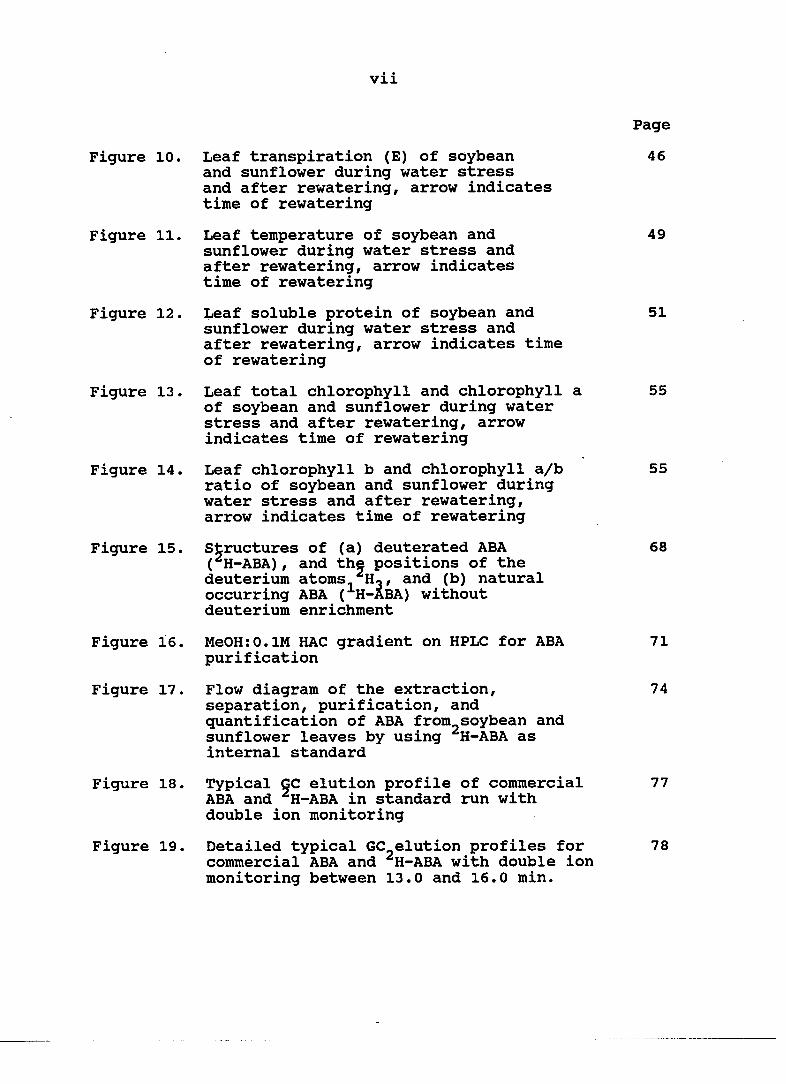
Figure 10.
Figure 11.
Figure 12.
Figure 13.
Figure 14,
Figure 15.
Figure 16.
Figure 17.
Figure 18.
Figure 19.
Leaf transpiration (E) of soybean and sunflower during water stress and after rewatering, arrow indicates time of rewatering
Leaf temperature of soybean and sunflower during water stress and after rewatering, arrow indicates time of rewatering
Leaf soluble protein of soybean and sunflower during water stress and after rewatering, arrow indicates time of rewatering
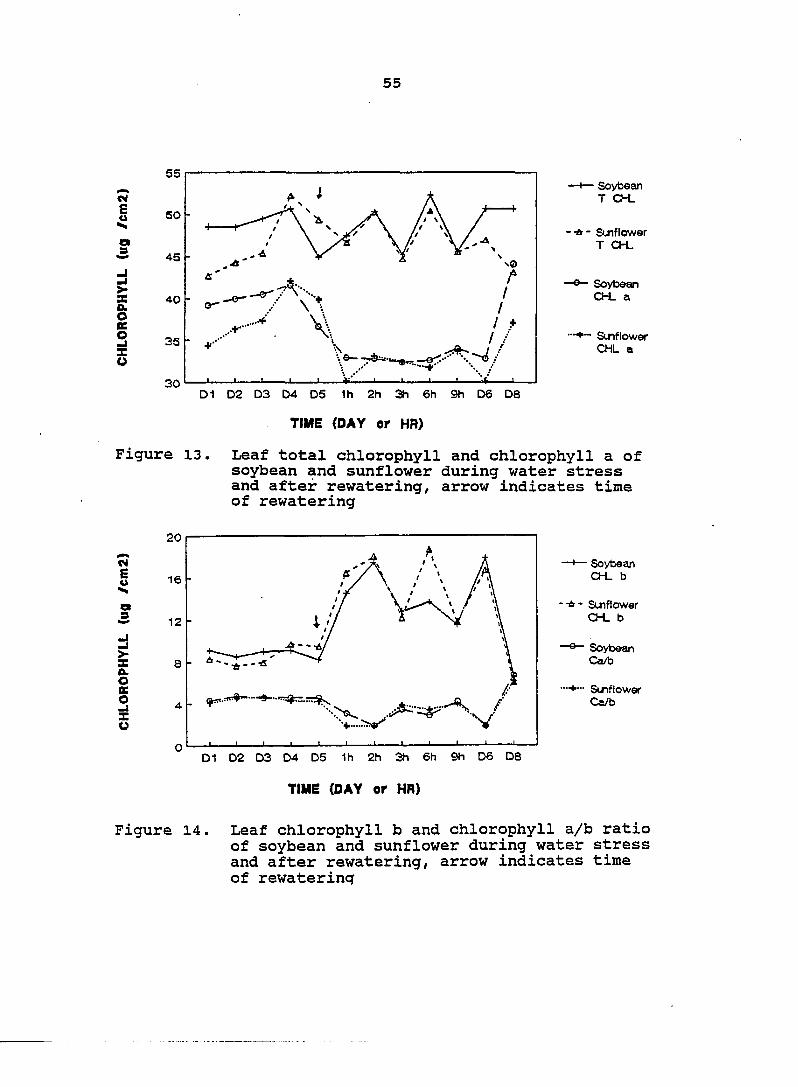
Leaf total chlorophyll and chlorophyll a of soybean and sunflower during water stress and after rewatering, arrow indicates time of rewatering
Leaf chlorophyll b and chlorophyll a/b ratio of soybean and sunflower during water stress and after rewatering, arrow indicates time of rewatering
Structures of (a) deuterated ABA ( H-ABA), and the positions of the deuterium atoms Hg, and (b) natural occurring ABA (H-ABA) without deuterium enrichment
MeOHrO.lM HAC gradient on HPLC for ABA purification
Flow diagram of the extraction, separation, purification, and quantification of ABA from soybean and sunflower leaves by using H-ABA as internal standard
Typical GC elution profile of commercial ABA and H-ABA in standard run with double ion monitoring
Detailed typical GC elution profiles for commercial ABA and H-ABA with double ion monitoring between 13.0 and 16.0 min.
Page
46
49
51
55
55
68
71
74
77
78
viii
Figure 20.
Figure 21.
Figure 22.
Figure 23.
Figure 24.
Figure 25.
Figure 26.
Figure 27.
Figure 28.
Figure 29.
Mass spectrum of soybean and sunflower leaf sample compared with that of reference ABA with scanning run at 50-300 AMU range, with a reliability of 99%
Typical GC elution profile by double ion monitoring for ABA used H-ABA as internal standard in soybean and sunflower leaves
Detailed typical GC elution profiles for ABA with double ion monitoring between 13.0 and 16.0 min., using H-ABA as internal standard, in samples from soybean and sunflower leaves
Changes of endogenous ABA in soybean and sunflower on leaf fresh weight basis during water stress and after rewatering, arrow indicates time of rewatering (line graph)
Changes of endogenous ABA in soybean and sunflower on leaf fresh weight basis during water stress and after rewatering, arrow indicates time of rewatering (bar Graph)
Changes of endogenous ABA in soybean and sunflower on leaf dry weight basis during water stress and after rewatering, arrow indicates time of rewatering
Changes of endogenous ABA on both leaf fresh and dry weight basis after rewatering in soybean and sunflower
Changes of endogenous ABA in soybean and sunflower on leaf area basis during water stress and after rewatering, arrow indicates time of rewatering
Relationships of leaf ABA and water potential during water stress and after rewatering in soybean and sunflower, arrow indicates time of rewatering
Relationships of leaf ABA and CER during water stress and after rewatering in soybean and sunflower, arrow indicates time of rewatering
Page
79
80
81
91
92
92
93
93
97
98
ix
Figure 30.
Figure 31.
Figure 32.
Figure 33.
Figure 34.
Figure 35.
Figure 36.
Figure 37.
Figure 38.
Figure 39.
Relationships of leaf ABA and stomatal resistance during water stress and after rewatering in soybean and sunflower, arrow indicates time of rewatering
Effects of exogenous ABA on CER of soybean
Effects of exogenous ABA on CER of sunflower
Effects of exogenous ABA on CER of soybean and sunflower at concentrations of 100 and 500 uM ABA
Effects of exogenous ABA on stomatal conductance of soybean
Effects of exogenous ABA on stomatal conductance of sunflower
Effects of exogenous ABA on stomatal conductance of soybean and sunflower at concentrations of 100 and 500 uM ABA
Effects of exogenous ABA on leaf transpiration of soybean
Effects of exogenous ABA on leaf transpiration of sunflower
Effects of exogenous ABA on leaf transpiration of soybean and sunflower at concentrations of 100 and 500 uM ABA
Page
99
102
102
105
107
107
110
113
113
114
1
INTRODUCTION
Soybean (Glycine max (L.) Merr.) and sunflower
fHelianthus annuus L.) are among the two most important
economic crops in the world. This is not only because of
their high oil contents, the oilseed cultivars containing
about 38 to 50% and 20% oil for sunflower and soybean,
respectively, but also because of their high protein contents,
about 20% and 40% protein for sunflower and soybean seeds,
respectively. Especially with the estimated world population
projection of 6.5 billion by the year 2000, a dramatically
increased protein, fat, and oil consumption to meet the
demands for calories and nutrition indicates a need for
increasing production of the two crops.
Photosynthesis is a major factor determing crop yield.
An understanding of biochemical and physiological processes in
photosynthesis is vital to improve soybean and sunflower
production.
Environmental factors such as water, COg, and air
temperature affect photosynthesis and finally affect yield of
crop. Soybean and sunflower usually suffer some drought
stress during their growing seasons. Water deficit affects
vegetative growth as well as seed yield and quality. However,
how water deficit affects the physiological and biochemical
processes of photosynthesis in soybean and sunflower are not
clear. So, the understanding of water deficit effects on
2
these processes will greatly help to identify the critical
problem area in soybean and sunflower production.
Air temperature affects leaf transpiration and soil
evaporation, which alters physical and chemical conditions of
soybean and sunflower. High air temperature, which is usually
accompanied by drought stress, may cause yield reduction.
Since COg is the only carbon source in photosynthesis, its
concentration, especially internal COg concentration at the
photosynthetic site in the leaf, also affects photosynthesis
and may respond differently to environmental stress in soybean
and sunflower. Understanding of the effects of environmental
factors on photosynthesis and yield will provide important
information for developing soybean and sunflower production
strategies and also for identifying and developing new soybean
and sunflower cultivars more tolerant to environmental stress
and highly efficient in water use.
Differences in photosynthetic rates between soybean and
sunflower are well documented. Sunflower has a higher
photosynthetic rate than soybean. A number of factors could
be responsible for the differences. However, information
obtained under water stress conditions is limited. So,
understanding the relationship between water deficit and
photosynthesis becomes my main goal. Understanding of water
deficit effects on photosynthesis, as well as associated
changes in photosynthetic parameters in leaves of both soybean
3
and sunflower, will be important to fully understanding the
physiological differences in response to water deficit between
soybean and sunflower, and important to improving the
photosynthetic efficiency, productivity, and yield for both
soybean and sunflower.
Abscisic acid (ABA), a plant hormone, has been found to
have both negative (inhibitory) and positive effects on many
species. Although it is present in very low concentration in
plant tissues, it, however, causes a number of physiological
changes in plants, such as induction of dormancy, increased
senescence and altered water transport capacity. In recent
years, especially, many efforts have dealt with the relations
between ABA, water stress, and stomatal action on
photosynthesis. Although considerable information shows that
ABA affects water transport, stomatal closure, and
photosynthesis, the effects of ABA on theses is controversial.
Therefore, more studies are needed to fully understand the
effects of ABA on photosynthesis. In addition, comparative
information regarding ABA changes during water stress in
soybean and sunflower is very limited.
Methods for extraction, purification, and quantification
of ABA from plant tissues have developed rapidly in recent
decades, especially with the use of high performance liquid
chromatography (HPLC) and of gas chromatography linked with a
mass spectrometry (GCMS). These make quantitation of plant
4
hormones more efficient and accurate. However, many of these
methods were developed for non-green tissues such as seeds and
fruits. Although some methods are used for green tissues,
these methods take a long time, usually more than 24 hours,
for the extraction, purification, and quantification of ABA.
So, it is apparent that a simple, quick, efficient, and
accurate method should be developed for extraction,
purification, and quantification of ABA from plant tissues,
especially from highly pigmented plant tissues, such as
soybean and sunflower leaves.
Therefore, the objectives of this study are the
following:
1) To determine the effects of water stress on
photosynthesis and related parameters in leaves of soybean and
sunflower and to see if, at equal water deficiency, the reason
for greater photosynthesis by sunflower than by soybean is due
to water relations in the leaf.
2) To relate endogenous ABA to plant water status and
photosynthesis and to compare the effects of water stress on
ABA levels in soybean and sunflower leaves.
5
3) To determine the effects of exogenous ABA
application on photosynthesis and related parameters of
soybean and sunflower.
4) To develop a simple, quick, efficient, and accurate
method for extraction, purification, and quantification of ABA
from soybean and sunflower leaves.
5) To relate water potential, ABA, and photosynthesis
in both soybean and sunflower.
6
LITERATURE REVIEW
Relation of Water Stress to Photosynthesis
Plants usually suffer water deficiency during growth and
development periods. Water deficit causes many effects on
plants, such as decreased shoot growth (Cavalieri and Boyer,
1982), increased root resistance to water transport to the
leaf (Boyer, 1971a), increased stomatal closure (Fischer et
al., 1970), and decreased photosynthetic capacity (Boyer and
Bowen, 1970; Cox and Jolliff, 1987). Presently, there are two
explainations for the relation between water deficit and
photosynthesis. They are:
Nonstomatal effects on photosynthesis
In recent years, many researchers have been interested
in understanding how water deficit limits photosynthesis by
nonstomatal effects, although the mechanisms controlling
photosynthetic reduction are not clear. However, much
information has been established, particularly, the effects
the on photosynthetic photosystem. Mohanty and Boyer (1976)
and Mooney et al. (1977) reported that quantum yield of
photosynthesis was decreased at low water potential.
Photorespiratory COg evolution was also shown to decrease at
low water potential in wheat and sunflower (Lawlor and Fock,
1975; Lawlor, 1976; Mohanty and Boyer, 1976). In addition,
photosynthetic electron transport chain activity was inhibited
7
in plants subjected to water stress (Nir and Mayber, 1967;
Boyer and Bowen, 1970; Fry, 1972; Keck and Boyer, 1974).
Sharp and Boyer (1986) showed that the quantum yield for COg
fixation as well as the rate of light- and COg- saturated
photosynthesis were strongly inhibited at low leaf water
potential. Newton et al. (1981) reported a decrease in
chlorophyll a fluorescence emission of leaves as the water
potential decreased. Lawlor (1976) found that water stress
increased photorespiration and dark respiration as a
proportion of net photosynthesis.
On the other hand, recent studies by Berkowitz and Gibbs
(1982) and Kaiser et al. (1981) showed that in isolated intact
chloroplasts, osmotic dehydration did not significantly affect
electron transport. Therefore, they suggested that the data
obtained in vivo resulted from indirect effects of drought on
photosynthetic electron transport. The loss in chloroplast
capacity to fix COg was the result of water unavailability on
chloroplast function and not on photoinhibition (Sharp and
Boyer, 1986). In addition, Genty et al. (1987) reported that
proton collection, their distribution between the
photosystems, and PS II photochemistry are unaffected by water
stress, and water stress did not induce sensitization to
photoinhibition in cotton fGossvpium hirsutum L.).
Furthermore, water stress-induced inhibition of the dark
reactions of photosynthesis also has been reported. Jones
8
(1973) and O'Toole et al. (1976) showed an alteration of the
carboxylation capacity by reduction in activity or levels of
chloroplast enzymes during water stress of several days
duration. Ribulose 1,5 bisphosphate (RuBP) regeneration may
also be inhibited under water stress (Kaiser ahd Heber, 1981;
Von Caemmerer, 1981). Farquhar and Sharkey (1982) also showed
that the initial effect of water stress appeared to be
reduction in the capacity for RuBP regeneration because the
"RuBP saturated" region of the COg assimilation rate vs
initial COg concentration curve was unaffected. In addition,
water stress can cause xylem embolism (Sperry and Tyree,
1988), which inhibits water transport from root to shoot.
Stomatal effects on photosynthesis during water stress
Stomatal movements provide the leaf with opportunity to
change the COg both between atmosphere and at the site of
carboxylation, and the rate of transpiration (Farquhar and
Sharkey, 1982). Control of stomatal opening and closure is
important to photosynthesis and its response to environmental
stress. However, many factors affect stomatal movement and
stomata responsed to many internal and external signals. Boyer
(1976) reported that at low leaf water potential,
photosynthesis can be reduced by stomatal closure, which
increases the diffusive resistance to the entry of COg into
the leaf. In addition, water stress-induced abscisic acid is
the primary agent causing stomatal closure (Raschke, 1975;
9
Walton, 1980; Radin and Ackerson, 1982). But, Gollan et al.
(1986) reported that stomatal conductance can depend directly
on soil water status, because stomata of sunflower started to
close as the soil water content decreased even though the leaf
water status was maintained at a high level. The decrease in
stomatal conductance can occur without a change in leaf water
potential (Bates and Hall, 1981; Blackman and Davies, 1985).
So, Munns and King (1988) concluded that a message from roots
controls stomatal conductance. Furthermore, movement of K"*",
Cl~, and organic solutes also affect stomata during water
stress (Raschke, 1977; Schnabl, 1978). In addition, light and
COg also affect stomatal movement. Guard cells respond to
both light quality and flux density. Fischer (1968), Travis
and Mansfield (1981) reported flux density-dependent increases
in stomatal aperture in epidermal peels exposed to light in
COj-free air. Sharkey and Raschke (1981) showed changes in
stomatal conductance as a function of light quality and
intercellular COg concentration. It is apparent that stomatal
movement in response to water stress is complicated. However,
it is clear that stomata impose a large limitation on
photosynthesis, especially under water stress.
Responses of Photosynthetic Parameters to Water Stress
Changes in photosynthetic components under water stress
are well documented. Vu et al. (1987) reported that moderate
10
to severe drought stress reduced the in vivo activation state
of ribulose 1,5 bisphosphate carboxylase/oxygenase (rubisco),
as well as lowered the total activity. They suggested that in
soybean leaves, the rapid decline in canopy CER under drought
stress conditions appears to be due, in part, to a reduction
in the in vivo activation of rubisco, since the carboxylation
step of photosynthesis is one of the major biochemical
processes of carbon assimilation. Furthermore, working with
orange (Citrus sinensis L.), Vu and Yelenosky (1988) also
reported that water stress reduced leaf photosynthesis and
rubisco activation and concentration.
Since about 50% of leaf soluble protein is believed to
be rubisco (Kawashima and Wildam, 1970; Kung et al., 1980),
its relation to photosynthesis is well established (Hesketh et
al., 1981; Secor et al., 1984). However, declines in leaf
soluble protein has been shown during water stress (Vu and
Yelenosky, 1988). In contrast to rubisco, some specific
proteins are synthesized in response to water stress, because
many mRNAs, polypeptides and in vivo translation products are
synthesized in tomato leaves during drought stress (Bray,
1988).
11
Optimum leaf temperature is important for
photosynthesis. Low leaf temperature reduced assimilate rate
by reducing activity of rubisco and the capacity for electron
transport, while high leaf temperature also reduced
photosynthetic rate by reduce electron transport capacity and
increasing the rate of COg evolution from photorespiration
(Farquhar and Sharkey, 1982). Scott et al. (1981) showed a
linear relationship between leaf temperature and water
potential. Leaf temperature of soybean increased linearly as
water potential decreased. In addition, air temperature,
relative humidity and wind speed also affect leaf temperature
(Jackson, 1982).
Leaf transpiration has large effects on leaf temperature
because of its high cooling effects. However, transpiration
is controlled by stomatal movements. Stomatal closure due to
water stress decreased leaf transpiration, which in turn,
increased leaf temperature and decreased photosynthesis
(Beardsell et al., 1973; Ehrler et al., 1978; Teare and
Kanemsu, 1972).
Hesketh (1963) showed that species can vary greatly in
rate of photosynthesis, but this variation is not related to
variation of chlorophyll content. Kariya and Tsunoda (1972)
also reported that the rate of photosynthesis was not
necessarily related to chlorophyll contents, at least under
high light. In addition. Vu and Yelenosky (1988) showed a
12
relative constant chlorophyll content during water stress. In
orange leaves, the chlorophyll contents were 5.7, 5.9, 5.5,
and 6.4 mg.g"^ leaf wt for stressed leaves and 5.9, 6.0, 5.8,
and 5.9 mg.g~^ leaf wt in controls. Although there are
controversial reports about the relation between chlorophyll
content and photosynthesis, a positive relation is well
documented. Nevins and Loomis (1970) showed that gross
photosynthesis of sugarbeet (Beta vulgaris L.) was correlated
positively with chlorophyll concentration. Bear and Schrader
(1985) reported that CER was correlated with chlorophyll
concentration. A rather good correlation between chlorophyll
content and uptake in 48 field-grown soybean cultivars
has been reported (Buttery and Buzzell, 1977). They showed
that 44% of the variability in photosynthesis was due to
variation in chlorophyll contents.
Relations of ABA to Water Stress, Stomata, and Photosynthesis
Origin of ABA
Abscisic acid, since it was isolated in the 1960s, has
been investigated extensively as to its origin, biosynthesis,
metabolism, action model, and biochemical and physiological
functions in plants. Considerable information has been
accumulated over the past two decades. However, there are
many questions related to ABA which are still unclear. For
the origin and biosynthesis of ABA, much evidence indicated
13
that ABA is both synthesized and localized in chloroplasts.
Loveys (1977) reported that 95% of plant ABA was in turgid
leaf chloroplasts, although only 15% of the ABA was in wilted
leaf chloroplasts. Heilmann et al. (1980) also showed that
75-80% of the ABA in unstressed spinach leaves is in the
chloroplasts. ABA appeared to be distributed between the
chloroplast and the cytoplasmic fluids and its distribution
depended on the pH differences between the two compartments.
They concluded that the chloroplast membrane is permeable to
undissociated ABA but highly impermeable to the anionic
species. In addition, experiments showed that mevalonic acid
(MVA) moved across the chloroplast membrane very poorly
(Goodwin, 1965) and is poorly incorporated into ABA by plant
tissues (Milborrow and Noddle, 1970; Milborrow and Robinson,
1973). So, ABA was believed to be formed in the chloroplast
(Railton et al., 1974). Moreover, evidence by others
(Hartung et al., 1980; Hartung et al., 1981; Cowan and
Railton, 1986) indicated that chloroplasts are not the site of
ABA synthesis or catabolism, although a high percentage of ABA
is trapped in the chloroplasts.
Roots have been reported to be another place for ABA
synthesis. An experiment by Zhang et al. (1987) showed that
roots can synthesize ABA, which may be a signal involved in
stomatal closure. Creelman et al. (1987) reported that ABA
was synthesized in both leaves and roots of Xanthium
14
strumarium. The ABA formed in stressed roots of Xanthium
incubated in showed a labeling pattern similar to that of
ABA in stressed leaves. In addition, studies on ABA transport
in xylem sap showed that ABA concentration in the sap
increased in sunflower (Hoad, 1975) and in Ricinus and
Xanthium (Zeevaart and Boyer, 1984) as soil dried. The ABA
concentrations in the xylem sap was increased by about 50
times to 5 X lO""® molar in wheat fTriticum aestivum L. ) plants
when soil was dried (Munns and King, 1988). Hubick et al.
(1986) also found that drought increased the ABA level in
shoots and roots of intact sunflower and in root tips isolated
from the same species (Robertson et al., 1985). It is
apparent that ABA can be synthesized either in leaves or in
roots, but, in unstressed conditions, most of the ABA is
compartmented in leaf chloroplasts.
Relations of ABA to Water Stress
Water deficit often results in bulk increases in leaf
ABA and the increases of ABA in response to water deficit are
well documented (Henson, 1981; Raschke, 1982; Cornish and
Zeevaart, 1985; Davies et al., 1986). Beardsell and Cohen
(1975) reported that the critical water potential for
increased ABA contents in excised leaves of corn (Zea mavs L.)
and sorghum (Sorahum bicolor L.) is between -8 and -10 bars
and between -10 and -12 bars in Ambrosia artemisifolia and
Amborosia trifida leaves (Zabadal, 1974). Wright (1978)
15
showed that water deficit promoted the accumulation of ABA in
many plant species and ABA levels in water-stressed tissues
are usually 10 to 40 times greater than those found in turgid
tissues. ABA accumulation is dependent on leaf water
potential declining below a certain "threshold" level, usually
around -10 to -12 bars (Hemphill and Turkey, 1975; Blake and
Ferrell, 1977). In addition, studies with several plant
species, led Pierce and Raschke (1978) to suggest that the
critical component for the rise in ABA contents appeared to be
turgor pressure. ABA level increased rapidly as zero turgor
pressure was approached in Xanthium strumarium leaves. This
agrees with Beardsell and Cohen's finding that the water
potentials at which ABA begins to accumulate in corn and
sorghum may correspond to zero turgor. Furthermore, Pierce
and Raschke (1980) concluded that turgor is the critical
component of plant cell water that controls ABA levels, i.e.,
loss of turgor is the signal that causes ABA accumulation.
Relations of ABA to Photosvnthesis
In recent years, understanding of the relation of ABA to
photosynthesis has interested many researchers. There is
considerable evidence that ABA can reduce the photosynthetic
capacity of a leaf, which is independent of stomatal effects
(Raschke, 1982; Cornic and Miginiac, 1983; Raschke and
Hedrich, 1985; Sharkey, 1985; Bunce, 1987). However, as to
whether ABA directly affects photosynthetic capacity of
16
mesophyll cells is still controversial. Gas exchange studies
of intact leaves show depression of assimilation rate after
the application of ABA. Terashima et al. (1988) reported that
after ABA treatment, photosynthetic COg assimilation rate was
markedly depressed in sunflower leaves at calculated
intercellular partial pressure of COg, and the apparent non-
stomatal inhibition of photosynthesis by ABA can be attributed
to the nonuniform distribution of transpiration and
photosynthesis over the leaf. In addition, carboxylation of
RuBP is inhibited (Fischer et al., 1986). Furthermore, ABA
simultaneously decreases carboxylation efficiency and quantum
yield in attached soybean leaves (Ward and Bunce, 1987).
Leaves of ABA-treated plants have lower activity of rubisco in
barley (Hordeum vulaare L.) and PEPCase (phosphoenolpyruvate
carboxylase) in maize (Zea mavs L.) (Popova et al., 1982;
Popova and Vaklinova, 1983), and the rate of photorespiration
was increased twofold by ABA treatment at lO"® molar while COg
compensation point increased 46% in barley (Popova et al.,
1987). Seemann and Sharkey (1987) also reported that ABA
reduced the photosynthetic capacity of common bean (Phaseolus
vulgaris L.) leaf through an apparent inhibition of rubisco
activity, as well as promoted stomatal closure. They
suggested that a common link between environmental stress and
reductions in photosynthetic capacity may be ABA and
hypothesized that ABA may affect plasma membrane function and
17
indirectly reduce rubisco activity through altered ion flux.
On the other hand, some in vitro studies with isolated
chloroplasts (Keck and Boyer, 1974) and with isolated
mesophyll cells (Mawson et al., 1981) failed to show any
effects of ABA on photosynthesis. Furthermore, Raschke and
Patzke (1988) found that the effect of ABA on photosynthesis
in Xanthium resulted from non-uniform distribution of stomatal
pore size, and that ABA had no direct effects on the
photosynthetic machinery in this species.
Model of ABA action and control of stomata during water stress
It is well established that ABA can cause stomatal
closure and that there is a relationship between endogenous
ABA and stomata in response to water stress (Walton, 1980;
Mansfield et al., 1978; Milborrow, 1981; Radin and Ackerson,
1982). There are two main hypotheses that attempt to explain
how ABA moves into stomata. Firstly, is the ABA
redistribution hypothesis, which is based on the evidence that
protonated ABA freely permeates membranes, whereas the
dissociated anion form of ABA does not. The distribution of
ABA in different compartments depends on the pH difference
between compartments. The greater the difference, the greater
the amount of ABA that will accumulate in the more alkaline
compartment (Zeevaart and Creelman, 1988). Mansfield et al.
(1978) and Milborrow (1979) suggested that water stress causes
an increase in the permeability of the chloroplast membrane to
18
ABA, which results in a leakage of ABA from the chloroplast,
where ABA is localized in the unstressed condition. Since
guard cells do not have plasmodesmata (Weyers and Hillman,
1979), ABA originating in the mesophyll can only arrive at
the guard cells via the apoplast (Zeevaart and Creelman,
1988). Hartung et al. (1988) showed that ABA moved into the
apoplastic solution of water-stressed cotton (Gossvpium
hirsutum L. ) leaves because the pH and the ABA content of the
apoplastic fluid both increased greatly with pressure-induced
dehydration. They concluded that dehydration causes large
changes in apoplastic pH; the altered pH then enhances the
release of ABA from mesophyll cells into the apoplastic fluid.
In addition, the increase in apoplastic ABA was also found in
Xanthium (Cornish and Zeevaart, 1985) and in Valericanella
leaves (Hartung et al., 1983). The amounts of ABA that were
released from the symplast into the apoplast were estimated to
be adequate for stomatal closure (Cornish and Zeevaart, 1985;
Radin and Hendrix, 1987).
For the second hypothesis, Zhang et al. (1987) reported
that ABA originating in roots of plants in dry soil could
control stomatal behavior. Root ABA controls the water status
of plants not only by regulating stomatal transpiration, but
19
also by regulating the hydraulic conductivity of the roots
(Ludewig et al., 1988). So, a root message hypothesis was
suggested.
For the model of ABA action in controlling stomatal
apertures, Morton and Moran (1972), and Mansfield and Jones
(1971) reported that ABA brings about closure of the stomata
by inhibiting influx and initiating efflux of potassium from
the guard cells, and the effect has been confirmed by recent
studies with isolated guard cell protoplasts (MacRobbie,
1981). Marre (1979) also showed that ABA inhibited both
potassium uptake and proton release in a variety of other
tissues. Turgor changes within the guard cells regulate
stomatal aperture. Theses are caused by movements of H^,
Cl" and the synthesis, metabolism, and movement of organic
anions, primarily malate. Therefore, the operation of an
active H*/K* exchange process is thought to be one important
element in regulating guard cell turgor and stomatal movement
(Raschke, 1975; Raschke, 1977). In addition, Van Kirk and
Raschke (1978) showed that ABA caused the loss of a
considerable portion of total malate to the incubation medium
from V.faba and C.cormmunis epidermal peels during stonatal
closure. They concluded that the release of malate which
might occur together with would reduce turgor more quickly
than if the malate were removed solely by metabolic means. So
ABA would inhibited the H^/K* exchange and promote the
20
specific leakage of malate, thus, inhibiting opening and
promoting closure of stomata (Schnabl, 1978),
Methods for Quantitative Determination of Endogenous ABA
Since the discovery of ABA, a number of methods have
been developed for the identification and quantitative
analysis of ABA, and the development of such methods is
closely connected with advances in understanding of the
physiological roles of this plant hormone.
The methods used early were bioassays. However,
although many bioassays are rather sensitive and simple in
their performance, only a few bioassays have received much use
because a great disadvantage of them is their insufficient
specificity (Milborrow, 1978; Dorffling and Tietz, 1983).
In recent years, many physical methods have been
developed for quantitation of ABA, such as high performance
liquid chromatography (HPLC), gas chromatography (GC), and
mass spectrometry (MS). HPLC has been increasingly used to
purify ABA in recent years because it offers the advantage
that ABA need not be derivatized and can be easily collected
after detection. Special high efficiency columns have been
used in HPLC, all with microparticulate silica packing
material having a reverse-phase coating, which gave great
satisfaction (Sweetser and Vatuars, 1976; Ciha et al., 1977;
Durley et al., 1978; Arteca et al., 1980). In addition, HPLC
21
combined with a UV detector has also been used for measuring
ABA levels. However, the major limitation of HPLC for
quantitation is the lower selectivity and sensitivity of the
UV detector in comparison to the electron capture detector,
although the use of a UV detector enables 2 to 5 ng of ABA to
be detected (Walton, 1980; Dorffling and Tietz, 1983).
Gas chromatography (GC), especially when connected to a
mass spectrometer (MS) with selected ion monitoring, provides
a powerful analytical tool for identification and quantitation
of ABA. GCMS currently becomes the most specific method used
for ABA analysis because the identity of chromatographic peaks
can be determined from their characteristic mass spectra (Gray
et al., 1974; Michler et al., 1986; Vine et aï., 1987; Funada
et al., 1988).
In addition, other methods, such as radioimmunoassay
(RIA), have been used to guantitate ABA. These are sensitive
and enable large numbers of samples to be processed in a
relatively short time (Walton et al., 1979; Weiler, 1979).
Currently many researchers use HPLC and GCMS for ABA
identification and quantitation. Because ABA is easily
soluble in several polar and less polar solvents, such as
aqueous methanol, acetone, ethyl acetate, chloroform, ether
etc., the exact procedures of isolation, purification and
quantitation usually differ from one worker to the another.
(Rivier et al., 1977; Hubick and Reid, 1980; Knox and Wareing,
22
1984; Michler et al., 1986; Subbaiah and Powell, 1987; Funada
et al., 1988). In addition, many of these methods take a long
time, i.e more than 24 h for extraction and purification of
ABA. Furthermore, the material used in many of these methods
is non-green tissue. It is apparent that additional simple,
rapid, and highly efficient methods for extraction,
purification and quantitation of ABA from green tissues, such
as soybean and sunflower leaves, would be welcome.
Summary
Water stress induces many physiological responses in
plants. It is clear that the reduction of photosynthesis
related to water deficit may be due to both nonstomatal
effects and stomatal effects. The former reduce
photosynthesis by such indirect effects as increased root
resistance to water transport and induced xylem embolism and
by direct effects such as reduced photochemical capacity and
RuBP regeneration, while the latter reduce photosynthesis by
closing stomata, which decreases internal COg concentration.
Many factors are related to the stomatal closure. Water
deficit-induced ABA, however, may be one of the major causes
because ABA either inhibits the H"^ and K"*" exchanges and
promotes the specific leakage of malate or has a direct effect
on stomatal closure or on photosynthetic capacity, although
the latter effect is controversial. Photosynthetic parameters
23
also respond to water stress. Rubisco, soluble protein and
chlorophyll are reduced under water stress conditions.
Decreased leaf transpiration, which is caused by stomatal
closure due to water deficit, results in leaf temperature
increases, and it, in turn, affects photosynthesis. Although
many methods have been used for identification and
quantitation of endogenous ABA a more simple, quick, and
accurate method should be developed for ABA analysis from
plant tissues, especially from highly pigmented green tissues.
Therefore, comparison and measurements of photosynthetic
parameters during water stress and the effects of endogenous
and exogenous ABA on photosynthesis are our objectives in
order to understand how and why species, such as soybean and
sunflower, respond to water stress differently, as well as
develop an improved method for isolation, identification and
quantitation of ABA from green tissues.
24
CHAPTER 1
EFFECTS OF WATER STRESS ON PHOTOSYNTHETIC
DIFFERENCES BETWEEN SOYBEAN AND SUNFLOWER
Introduction
Crop production is based on photosynthesis. Improvement
of the crop photosynthetic mechanism has become one of the
major research interests of recent decades. Soybean and
sunflower are both C3 species; however, different
photosynthetic rates are well documented. Sunflower shows
higher photosynthetic rates than soybean, 31.6-41.0 vs 15.8-
25.3 uM COg m~^ s""^ (El-Sharkawy and Hesketh, 1965; Warren,
1967; Tagari et al., 1969). My previous experiment (Li, 1986)
showed similar results. In addition, many environmental
factors, such as photosynthetic active radiation (PAR), COg
concentration, and water status of plants, affect
photosynthesis as reported by many researchers. It has been
shown that water stress reduced the rate of COg assimilation
and leaf conductance in corn during a period of 14 days when
leaf water potential decreased from -0.5 to 8.0 bars (Wong et
al., 1985). Huber et al. (1984) reported that water stress
reduced carbon exchange rate (CER) of soybean, and the
reduction was greater in non-COg enriched plants than in COg
enriched plants. As CER declined, stomatal resistance
increased, but this was not the primary cause of decrease in
25
assimilation because COg concentration remained relatively
constant. Under field conditions it has been proposed that
sunflower may tolerate more severe drought than soybean due to
the deeper tap root system of sunflower (Robinson, 1978).
Sunflower may tolerate more water stress than soybean under
the same field conditions (Li, 1986), e.g., on middle summer
days when air temperature was above 30 C, the soybean leaves
were usually 2 C higher than air temperature, and stomatal
resistance was also high, whereas sunflower leaves were 2 C
lower than the air temperature, and stomatal resistance was
low. This difference in temperature may reflect the water
status of the leaf in response to water-stress conditions, and
this difference may be one of the photosynthetic differences
between the two species. Therefore, sunflower may tolerate
water stress better than soybean. This allows sunflower to
always keep a high photosynthetic rate on sunny summer days,
when conditions are stressful. So, the objective of this
study was to determine the effects of water stress on
photosynthesis in controlled environmental conditions to
better understand the difference between the two species.
26
Materials and Methods
This study was conducted in the Agronomy Greenhouses at
Iowa State University during the years of 1986-1988.
Sunflower (Helianthus annus L. 'S-1888') and soybean (Glycine
max (L.) Merr. 'Amsoy 71') seeds were planted together in the
same 12 L size of black plastic pots which was filled with a
sterilized soil mixture of soil;peat:perlite in proportions of
20:40:40. A total of 16 pots were used for each trail. Two
seeds for each species were planted about 10 cm apart in the
same pot, and soybean seeds were planted 5 days earlier than
sunflower in order to obtain a similar plant size at the time
water stress treatments were begun. When soybean plants were
in the VI growth stage (Fehr and Caviness, 1977), pots were
thinned to one plant of each species. Plants were grown in
the greenhouse until water stress was initiated. Stress was
imposed in a growth chamber (Conviron PGW 36, Conviron Product
Co., Winnipeg, Manitoba, Canada). In the greenhouse, the
plants were well watered and fertilized twice a week with
Peters professional water-soluble fertilizer (Peters
Fertilizer Product, WR Grace Co. P.0.X.789, Fogelsville,
Pennsylvania 18051). Disease and insects were controlled when
necessary. Thirty days after planting, when plants were about
50 cm tall with 12 and 9 fully expanded leaves for sunflower
and soybean, respectively, they were moved into the growth
chamber for water stress treatment. In the growth chamber the
27
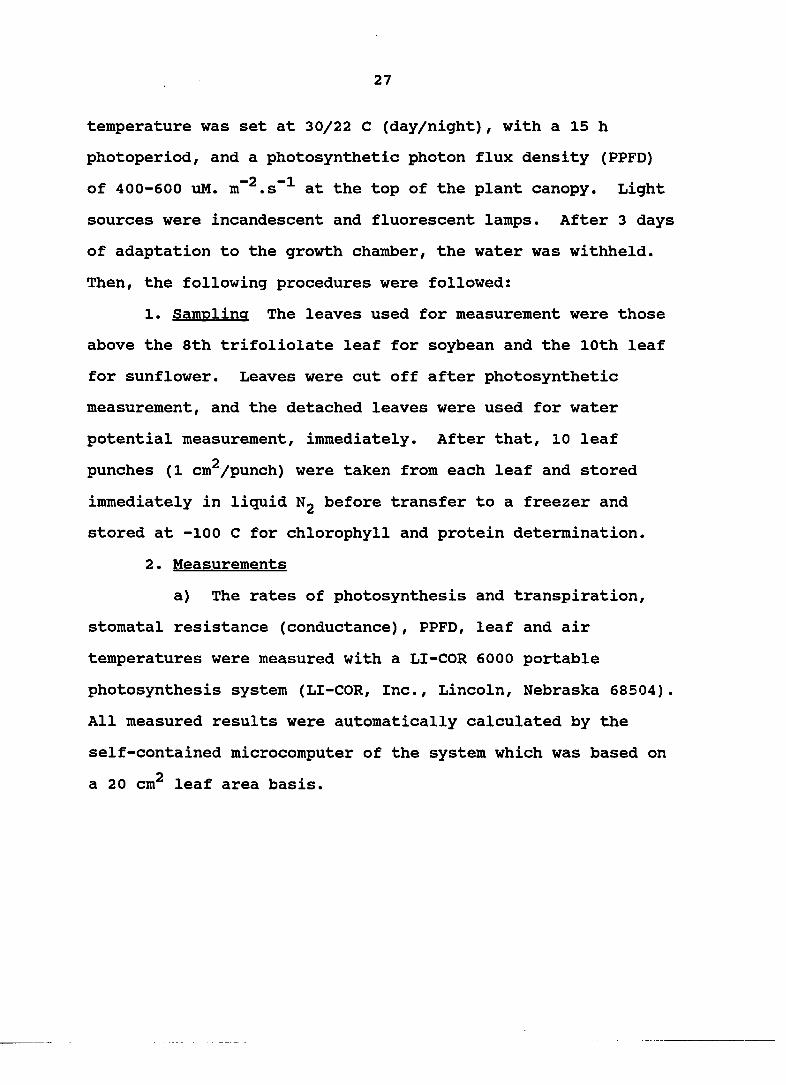
temperature was set at 30/22 C (day/night), with a 15 h
photoperiod, and a photosynthetic photon flux density (PPFD)
of 400-600 uM. m~^.s~^ at the top of the plant canopy. Light
sources were incandescent and fluorescent lamps. After 3 days
of adaptation to the growth chamber, the water was withheld.
Then, the following procedures were followed:
1. Sampling The leaves used for measurement were those
above the 8th trifoliolate leaf for soybean and the 10th leaf
for sunflower. Leaves were cut off after photosynthetic
measurement, and the detached leaves were used for water
potential measurement, immediately. After that, 10 leaf
punches (1 cm^/punch) were taken from each leaf and stored
immediately in liquid Ng before transfer to a freezer and
stored at -100 C for chlorophyll and protein determination.
2. Measurements
a) The rates of photosynthesis and transpiration,
stomatal resistance (conductance), PPFD, leaf and air
temperatures were measured with a LI-COR 6000 portable
photosynthesis system (LI-COR, Inc., Lincoln, Nebraska 68504).
All measured results were automatically calculated by the
self-contained microcomputer of the system which was based on
a 20 cm^ leaf area basis.
28
b) Leaf water potential was measured by a pressure
chamber with a model 3000 plant water status console (Soil
Moisture Equipment Corp., Santa Barbara, CA 93105).
c) Chlorophyll per unit leaf area was determined by
the method of Wintermans and De Mots (1965) using light of 665
and 649 nm.
d) Leaf protein was determined by the Bradford
method (1976) at 595 nm, and the detailed procedures for
chlorophyll and protein analysis are shown in Table 1.
This experiment was a completely randomized block design
with four blocks and four pots in each block. Because the
time of measurement could not be randomized, it was regarded
as a split-plot in time, i.e., as repeated measurements.
Results
Leaf Water Potential
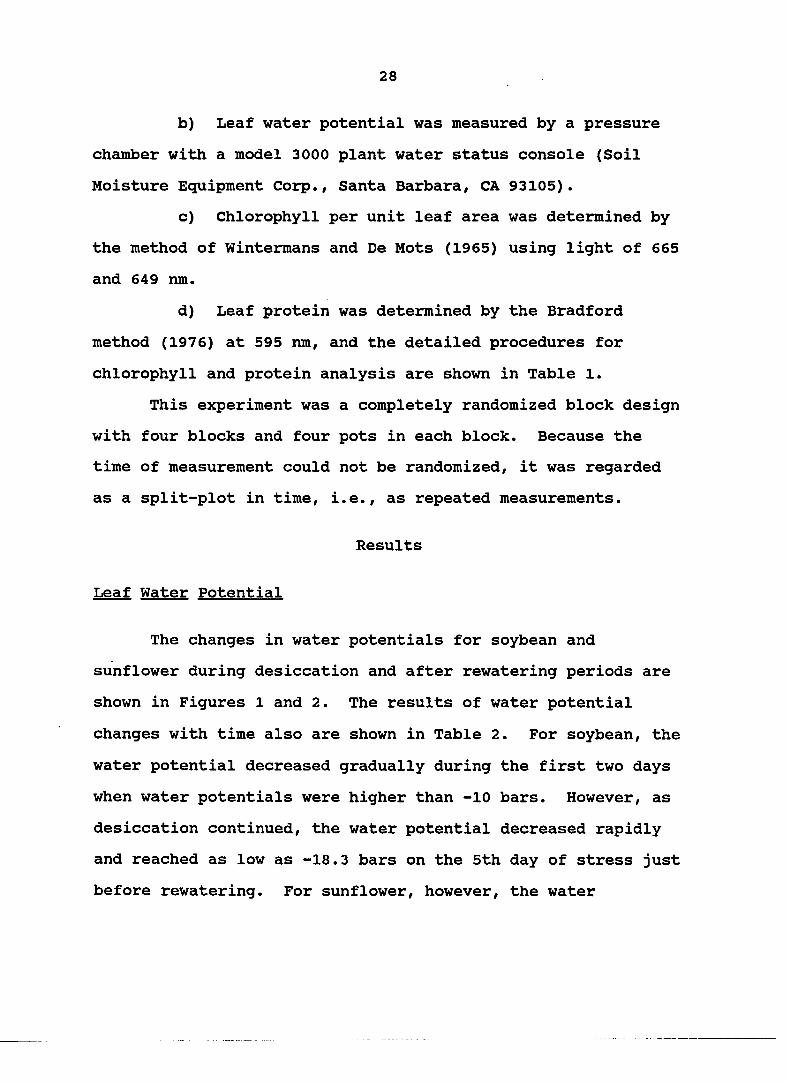
The changes in water potentials for soybean and
sunflower during desiccation and after rewatering periods are
shown in Figures 1 and 2. The results of water potential
changes with time also are shown in Table 2. For soybean, the
water potential decreased gradually during the first two days
when water potentials were higher than -10 bars. However, as
desiccation continued, the water potential decreased rapidly
and reached as low as -18.3 bars on the 5th day of stress just
before rewatering. For sunflower, however, the water
29
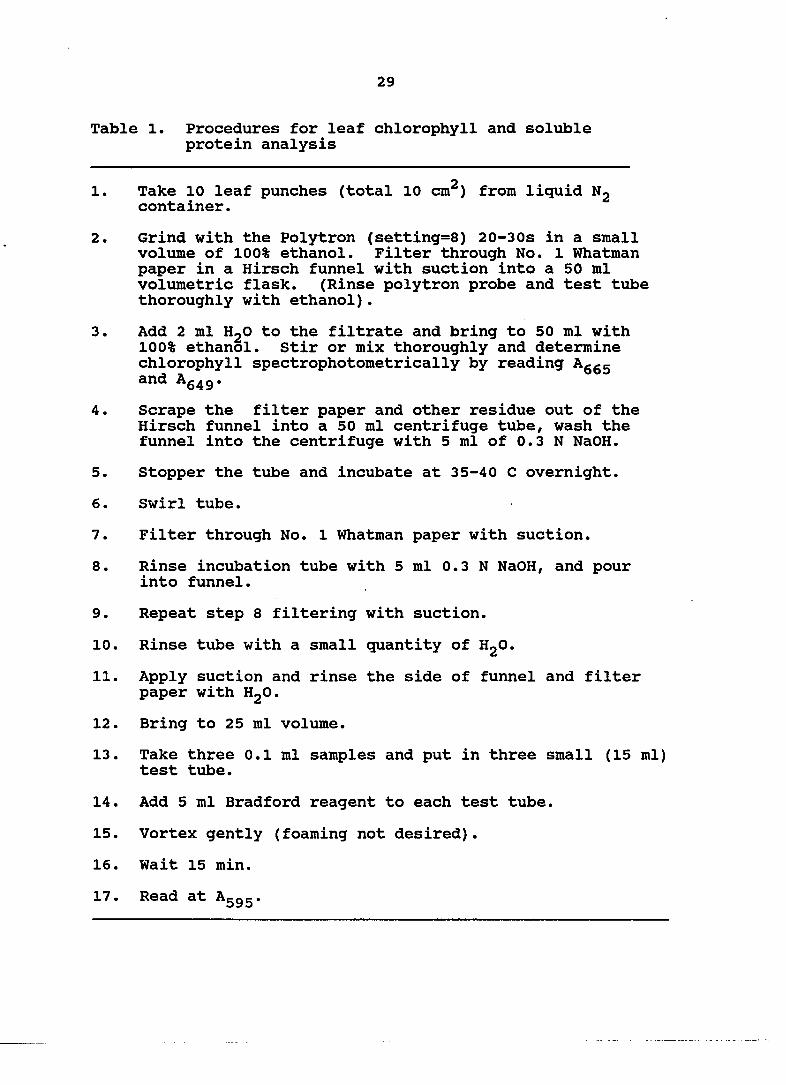
Table 1. Procedures for leaf chlorophyll and soluble protein analysis
1. Take 10 leaf punches (total 10 cm^) from liquid Ng container.
2. Grind with the Polytron (setting=8) 20-30s in a small volume of 100% ethanol. Filter through No. 1 Whatman paper in a Hirsch funnel with suction into a 50 ml volumetric flask. (Rinse polytron probe and test tube thoroughly with ethanol).
3. Add 2 ml HgO to the filtrate and bring to 50 ml with 100% ethanol. Stir or mix thoroughly and determine chlorophyll spectrophotometrically by reading Aggg and Ag^g.
4. Scrape the filter paper and other residue out of the Hirsch funnel into a 50 ml centrifuge tube, wash the funnel into the centrifuge with 5 ml of 0.3 N NaOH.
5. Stopper the tube and incubate at 35-40 C overnight.
6. Swirl tube.
7. Filter through No. 1 Whatman paper with suction.
8. Rinse incubation tube with 5 ml 0.3 N NaOH, and pour into funnel.
9. Repeat step 8 filtering with suction.
10. Rinse tube with a small quantity of HgO.
11. Apply suction and rinse the side of funnel and filter paper with HgO.
12. Bring to 25 ml volume.
13. Take three 0.1 ml samples and put in three small (15 ml) test tube.
14. Add 5 ml Bradford reagent to each test tube.
15. Vortex gently (foaming not desired).
16. Wait 15 min.
17. Read at A^gg.
30
CC < m
< H Z lu H o CL
cc UJ k-<
-3— Soybean W p
Sunflower W p
-20 D 3 D 4 D 5 1 h 2 h 3 h
TIME (DAY or HR)
Figure 1. Leaf water potentials of soybean and sunflower desiccation and after rewatering, arrow
indicates time of rewatering
cr < a
< I— z LU i-o o. CC LU H <
" " A " " S u n f l o w e r
-20 0 1 2 3 6 9
TIME (hrs)
Figure 2. Leaf water potentials of soybean and sunflower between 0 and 9 hour after rewatering

Table 2. Changes of leaf water potentials (bar) in soybean and sunflower during desiccation and after rewatering
crop D1 D2 D3 D4 D5 Ih 2h 3h 6h 9h 24h
Soybean -5.5 -6.3 -9.9 -13.7 -18.3 —8.4 -6.5 —6.3 —6.5 —5.3 —6.2
Sunflower -4.0 -6.2 —8.8 —12.0 —16.5 —8.4 —6.8 -6.4 —5.7 -6.2 -4.6
D1 to D5 = water stress day 1 to day 5 y
Ih to 24h = 1 to 24 h after rewatering
Table 3. Mean squares from the analyses i of variance for water potentials of soybean and sunflower
source of variation df MS
Time 10 118.16** Replication 3 6.14 Error a 30 1.04 Crop 1 10.25* Crop*Time 10 1.78 Error b 33 1.57
*,** indicate significance at the 5%, and 1% probability level, respectively. Rep = replication
32
potential was decreased continuously from about -4 bars on the
1st day of stress to -16.5 bars on the 5th day of stress.
But, it is clear that sunflower had a higher water potential
than soybean at all times during the desiccation period with
statistically significant differences between the two (Table
3). However, after rewatering, the recovery trends of water
potential were similar for both species, especially during the
1st hour when the water potentials for both species recovered
to -8 bars from -18 and -16 bars for soybean and sunflower,
respectively. After that, the water potential recovery
continued at a much slower pace than during the 1st hour, and
returned to almost the predesiccation levels in 3 hours after
rewatering of both species. The more detailed recovery of
water potential for both species can be seen in Figure 2. In
addition, it is clear that water potential had returned to
about -6 bars and about -5 bars for soybean and sunflower
respectively, 3 hours after rewatering. These values were
close to predesiccation levels.
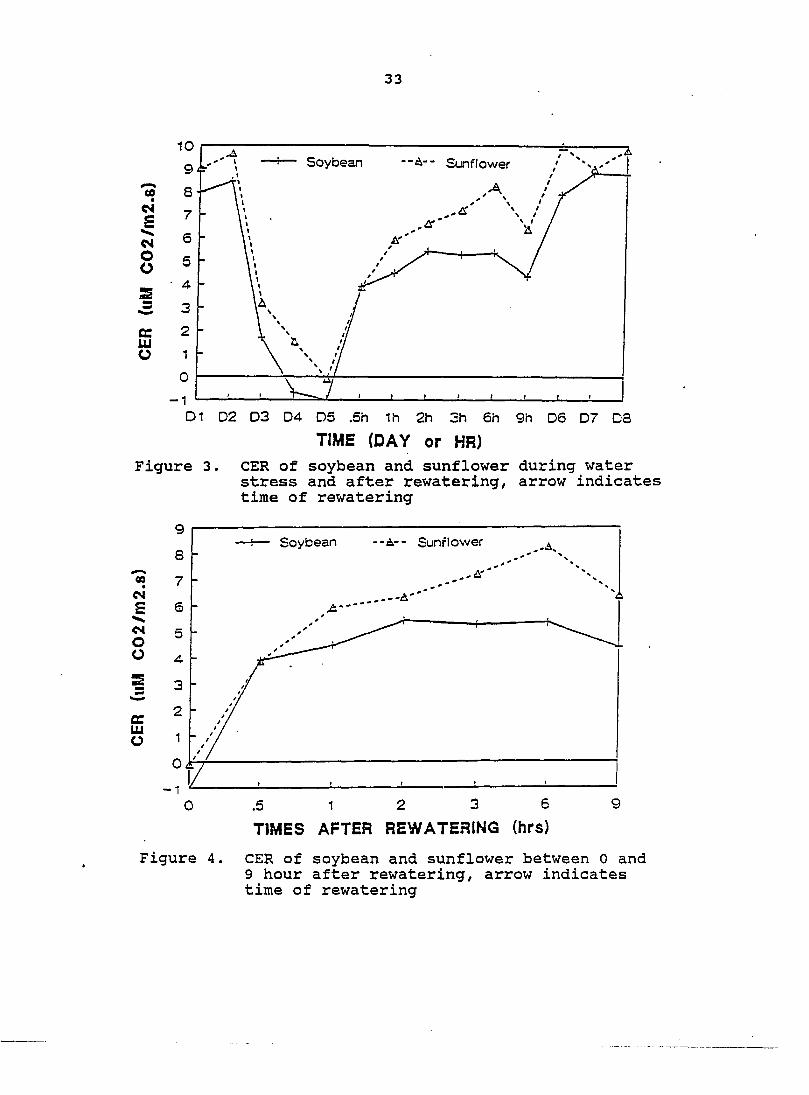
COg Exchange Rate
The changing trends of COg exchange rate (CER) during
water stress and after rewatering for soybean and sunflower
are shown in Figures 3 and 4. CER values and the analyses of
variance are given in Tables 4 and 5,
33
09 ci S C4 O O
ec LU O
--a-- Sunflower
D1 02 03 04 05 .5h 1h 2h 3h 6h 9h 06 07 08
TIME (DAY or HR)
Figure 3. CER of soybean and sunflower during water stress and after rewatering, arrow indicates time of rewatering
M S <N O o
fiC UJ o
--A-- Sunrlower
0 .5 12 3 6
TIMES AFTER REWATERING (hrs)
Figure 4. CER of soybean and sunflower between 0 and 9 hour after rewatering, arrow indicates time of rewatering
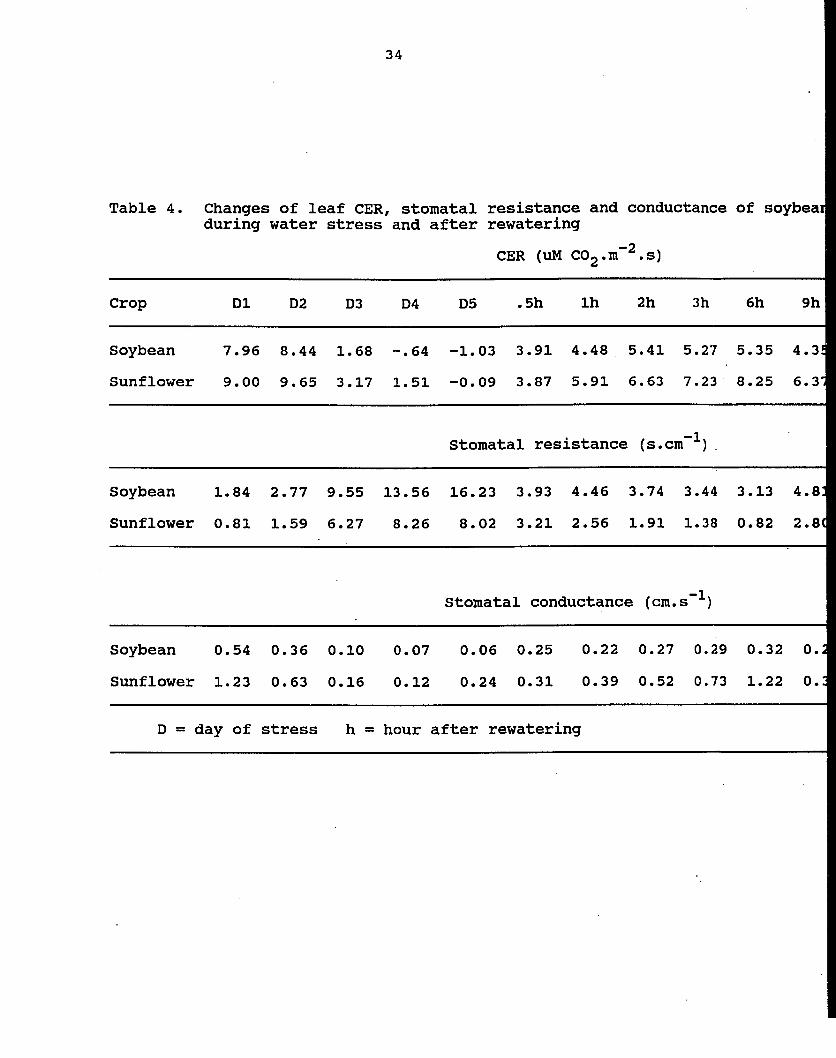
34
Table 4. Changes of leaf CER, stomatal resistance and conductance of soybeai during water stress and after rewatering
CER (uM COg.m'Z.s)
Crop D1 D2 D3 D4 D5 . 5h Ih 2h 3h 6h 9h
Soybean 7.96 8.44 1.68 -.64 -1.03 3.91 4.48 5.41 5.27 5.35 4.3!
Sunflower 9.00 9.65 3.17 1.51 -0.09 3.87 5.91 6.63 7.23 8.25 6.3'
Stomatal resistance (s.cm~^)
Soybean 1.84 2.77 9.55 13.56 16.23 3.93 4.46 3.74 3.44 3.13 4.8:
Sunflower 0.81 1.59 6.27 8.26 8.02 3.21 2.56 1.91 1.38 0.82 2.8(
Stomatal conductance (cm.s~^)
Soybean 0.54 0.36 0.10 0.07 0.06 0.25 0.22 0.27 0.29 0.32 0.
Sunflower 1.23 0.63 0.16 0.12 0.24 0.31 0.39 0.52 0.73 1.22 0.
D = day of stress h = hour after rewatering
stance and conductance of soybean and sunflower :ering
(uM COg.m'Z.s)
)h Ih 2h 3h 6h 9h 24h 48h 72h
.91 4.48 5.41 5.27 5.35 4.35 7.89 8.83 8.76
,87 5.91 6.63 7.23 8.25 6.37 10.05 9.03 9.83
resistance (s.cm"^)
.93 4.46 3.74 3.44 3.13 4.81 1.27 1.20 0.92
.21 2.56 1.91 1.38 0.82 2.80 0.43 0.80 0.44
conductance (cm.s ~ )
.25 0.22 0.27 0.29 0.32 0.21 0.79 0.83 1.09
.31 0.39 0.52 0.73 1.22 0.36 1.27 1.25 2.27
bering


Table 5. Mean squres from the analyses of variance for photosynthetic parameters of soybean and sunflower during water stress
Source of variation df CER Rs CD E T°
Rep 3 5
o
00
0. 55 0 .074 1 .969 1 .396
Time 13 82 . 94** 109 .3** 2 .319** 31 .646** 14 .451**
Errob b 39 1 .54 1 .62 0 .060 0 .845 0 .458
Crop 1 56 .49** 141 .55** 5 .993** 75 .110** 48 .431**
Crop*Time 13 1 .22 9 .15** 0 .432** 1 .726** 1 .982**
Error b 42 1. 18 1. ,70 0. 075 0. 754 0. 460
CER = COg exchange rate, Rs = stomatal resistance, CD = Stomatal conductance, E = leaf transpiration, T = leaf temperature ( C)
** indicate significance at the 5% and 1% probability level, respectively.
36
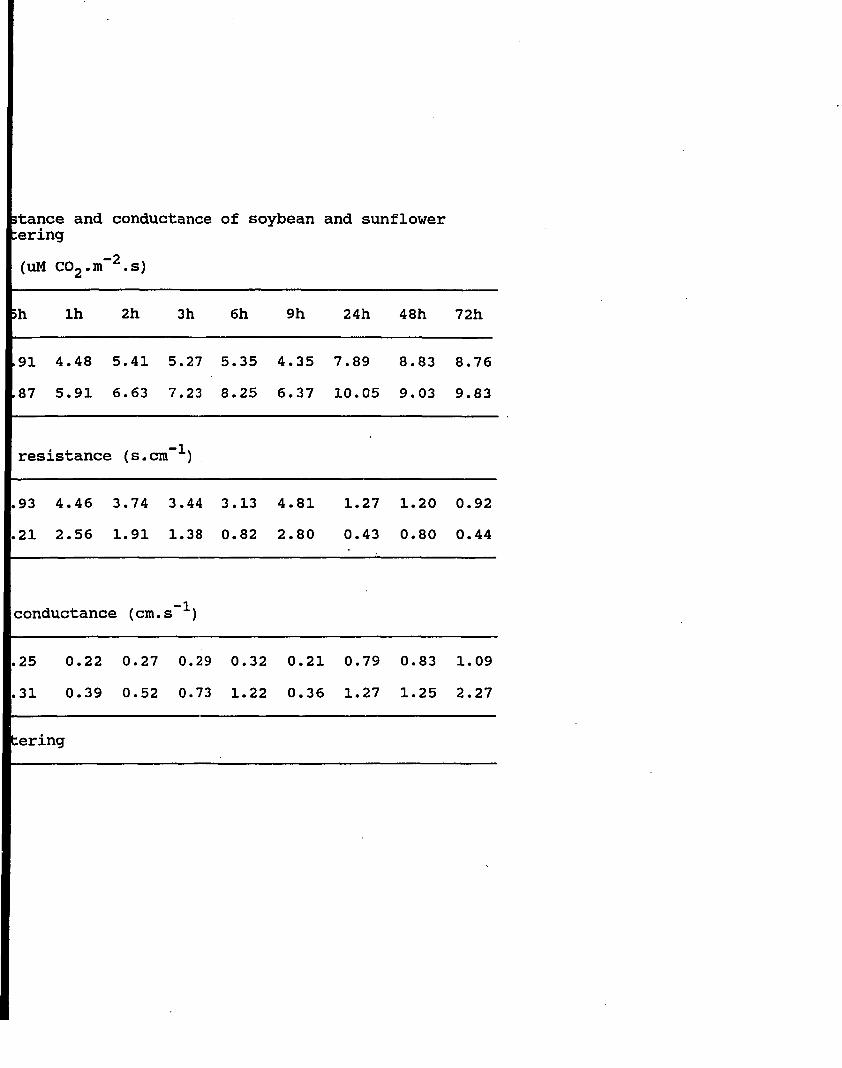
respectively. Like water potentials, the CER of both species
showed a similar pattern, but there was a significant
difference between soybean and sunflower in CER. For soybean,
photosynthetic rate was not affected during the first two days
after desiccation had begun. CER was constant at about 8 uM
COg. whereas water potential was slightly decreased
during the same period (Fig. 1). However, as water stress
continued, CER decreased rapidly to only about 2 uM CO^. m~^.
s~^. on the 3rd day of stress, which was a 75% reduction in
photosynthesis. More seriously, photosynthesis was stopped
when water potential dropped below -15 bars on the 4th and the
5th day of stress. On the other hand, for sunflower, although
photosynthesis showed a similar trend, however, CER was
consistently higher than that of soybean and the significant
statistically difference results were shown in Table 5.
During the first two days of stress, CER of sunflower was
about 10 uM COg.m'^.s"^, which was 2 uM COg.mT^.s"^ higher
than that of soybean, and even on the 3^ day, sunflower still
had about 3.5 uM COj.m'^.s"^ which was 1.5 uM COg.mT^.s"^
greater than that of soybean. Sunflower CER like soybean,
reached zero at severe water stress when water potential
dropped below -15 bars (5th day).
The recovery trends of photosynthesis after rewatering
were similar for both species, but, the recovery rates were
different between soybean and sunflower. From Figure 3, it is
37
clear that sunflower had constantly higher CER recovery rates
than that of soybean after 1 hour rewatering, i.e., the CER of
sunflower were 5.9, 6.6, 7.2, 8.3 and 10.0 uM COj.m'^.s"^ for
1, 2, 3, 6, and 24 hours after rewatering, respectively, while
soybean were only 4.5, 5.4, 5.3, 5.4 and 7.9 uM COj.xn'^.s"^
for those times, respectively. The more detailed
relationships of CER recovery after rewatering for both
species was shown in Figure 4. From these figures, it is also
clear that sunflower had a higher photosynthetic recovery rate
than that of soybean. The CER recovery rates were 61.3 vs
52.9%, 68.5 vs 64.1%, 74.7 vs 62.8%, 85.6 VS 64.0%, and 66.0
VS 51.4% for sunflower and soybean at 1, 2, 3, 6, and 9 hours
after rewatering, respectively. At 24 hours after rewatering,
CER had almost recovered for sunflower, but had only a 93%
recovery for soybean.
In addition, from Figures 1 to 4, It can be seen clearly
that photosynthesis recovery was slower than that of water
potential for both species. For example, at 6 hour after
rewatering, water potentials were -6.5 and -5.7 bars for
soybean and sunflower, respectively, which were close to
predesiccation levels, while CER recoveries were only 64.0 and
85.6% for soybean and sunflower, respectively. This indicates
that, in stressed conditions, photosynthesis approximately
paralleled changes of water potential, especially when water
potentials dropped below -10 bars for both species. However,
38
after rewatering, photosynthesis recovery was slower than that
of water potential. It was surmised that photosynthetic
apparatus components such as enzymes had been damaged during
severe water stress, and time was needed to restore the
photosynthetic apparatus to full function after rewatering
although water potentials had returned to predesiccation
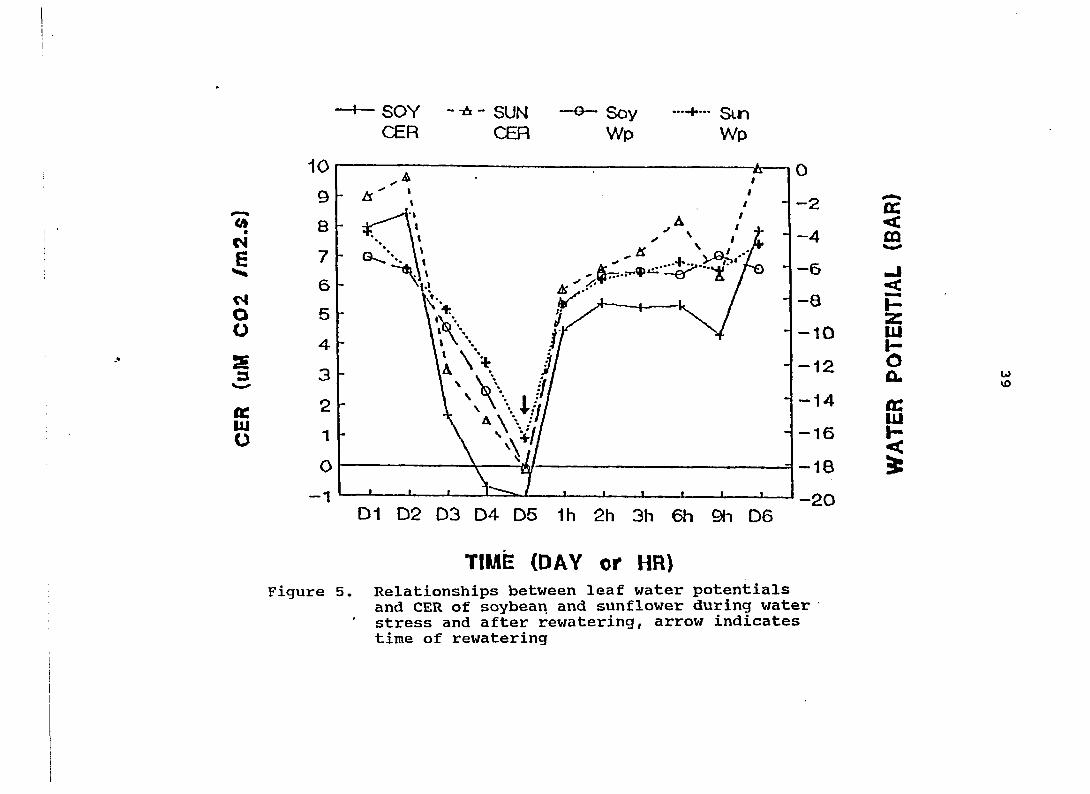
levels. The relationships between water potential and CER can
be seen in Figure 5. It shows that the water potential and
CER are highly related. The correlation coefficient of the
two were 0.88 and 0.92 for soybean and sunflower,
respectively.
Stomatal Resistance for Conductance)
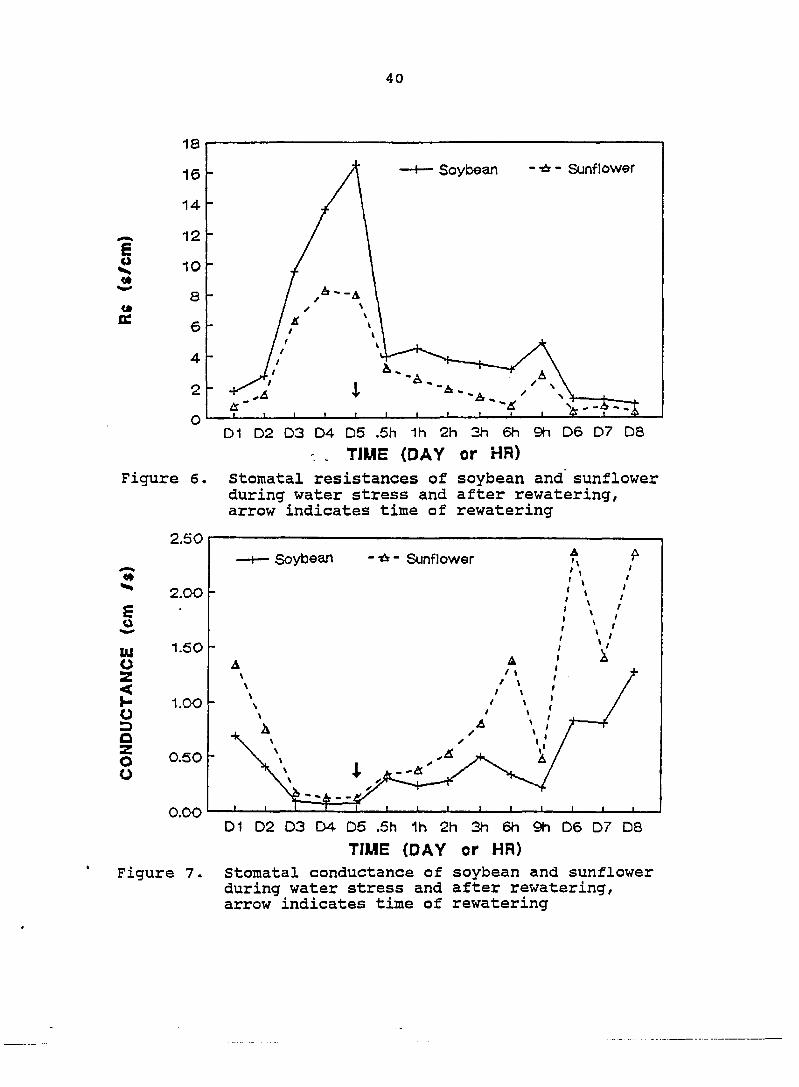
Changes in stomatal resistance (Rs) with water stress
for both species are shown in Figure 6, and conductances are
shown in Figure 7. The results of Rs and conductance can be
seen in Table 4. It is apparent that the changes of Rs are
similar to changes of water potential and CER. But, a
significant difference in Rs between soybean and sunflower
also can be seen in Table 5, although as desiccation developed
during water stress, the Rs increased for both species. For
soybean, a sharp increase of Rs, a rate of 9.5 s/cm, occurred
on 3rd day of stress when water potential dropped below -10
bars, and Rs reached as high as 16.2 s/cm on 5th day of stress
when water potential was as low as -18.3 bars before
4— SOY - -A - SUN CER CER
Soy Wp
•-*•••• Sin Wp
<A
E »»*
O o
s 3
te lu o
D1 D2 D3 D4 D5 1h 2h 3h 6h D6
TIMË (DAY or HR) Figure 5. Relationships between leaf water potentials
and CER of soybean and sunflower during water stress and after rewatering, arrow indicates time of rewatering
0
-2 tc <
-4 m
-6 <
-8 H Z
-10 lU -10
-12 O CL
-14 K lU
-16 1-<
-18
-20
w vo
40
£ o «•
t£
"A - Sunflower
Figure 6.
2.50
E o
w o z
2 O 3 a z o o
D1 D2 D3 D4 D5 .5h 1h 2h 3h 6h 9h D6 07 D8
. TIME {DAY or HR) stomatal resistances of soybean and sunflower during water stress and after rewatering, arrow indicates time of rewatering
Soybean - -A- Sunflower
2.00 -
1.50
1.00 -
0.50
O.OO
Figure 7.
D1 D2 D3 D4 05 .5h 1h 2h 3h 6h 9h D6 D7 DS
TIME (DAY or HR) stomatal conductance of soybean and sunflower during water stress and after rewatering, arrow indicates time of rewatering
41
rewatering. For sunflower, Rs also Increased rapidly from on
the 3rd day of stress when water potential was below -10 bars,
however, Rs was much lower than that of soybean. Comparisons
of 6.3 vs 9.5, 8.3 vs 13.6, and 8.1 vs 16.2 s/cm for sunflower
and soybean at 3rd, 4th. and 5th days of stress, respectively,
large Rs values indicated that stomata were closed due to
water loss and resulted in negative CER rates on the 4th and
5th days of stress for soybean and the 5th day for sunflower.
The changes of Rs after rewatering showed that reopening
of the stomata occurred earlier in sunflower than in soybean.
Sunflower had much lower Rs while soybean had constantly
higher Rs after rewatering. Rs value were 3.93, 4.58,
3.74,3.43, 3.13, and 4.81 for soybean and 3.21, 2.56, 1.93,
1.38, 0.82, and 2.80 s/cm for sunflower at 0.5, 1, 2, 3, 6,
and 9 hour after rewatering, respectively. The stomata of
sunflower were nearly fully open 6 hours after rewatering as
shown by an value of 0.82 s/cm, was similar to prestress
conditions whereas soybean had Rs of 3.13 s/cm at 6 hour after
rewatering, which was almost two times higher than prestress
conditions.
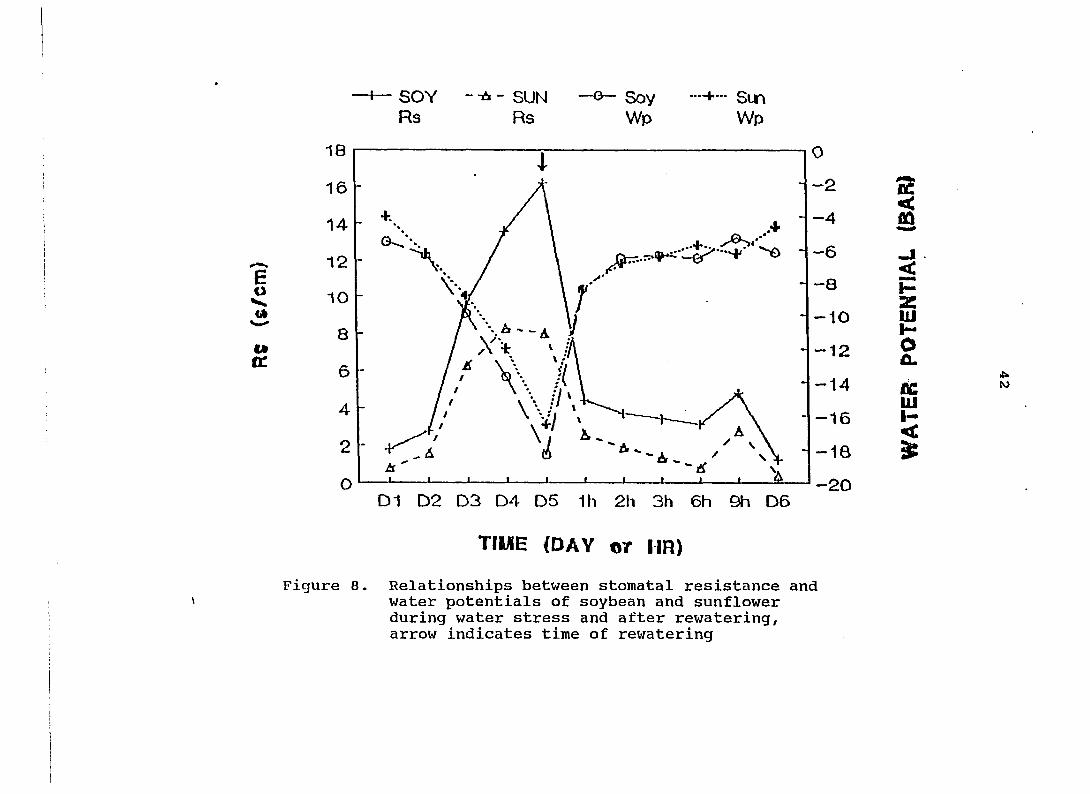
Stomatal resistance has a strong negtive relatioship
with CER and water potential (Figs. 8 and 9). The correlation
coefficients between Rs and water potential were r = -0.96,
and -0.89 for soybean and sunflower, respectively.
SOY --6- SUN Rs Rs
Soy Wp
Sun Wp
£ o V. <*
M fC
o
s
S < h-Z UJ I-o Û.
he m I-<
4^ to
D1 D2 D3 D4 D5 1h 2h 3h 6h 9h D6
TïME (DAY or MR)
Figure 8. Relationships between stomatal resistance and water potentials of soybean and sunflower during water stress and after rewatering, arrow indicates time of rewatering
4— SOY - -A - SUN CER CER
Soy Rs
Sun Rs
«4 E
o o
a: lU O
/ t \
i\
E o
m cc w
D1 D2 D3 D4 D5 .5h 1h 2h 3h 4h 9h D6 D7 D8
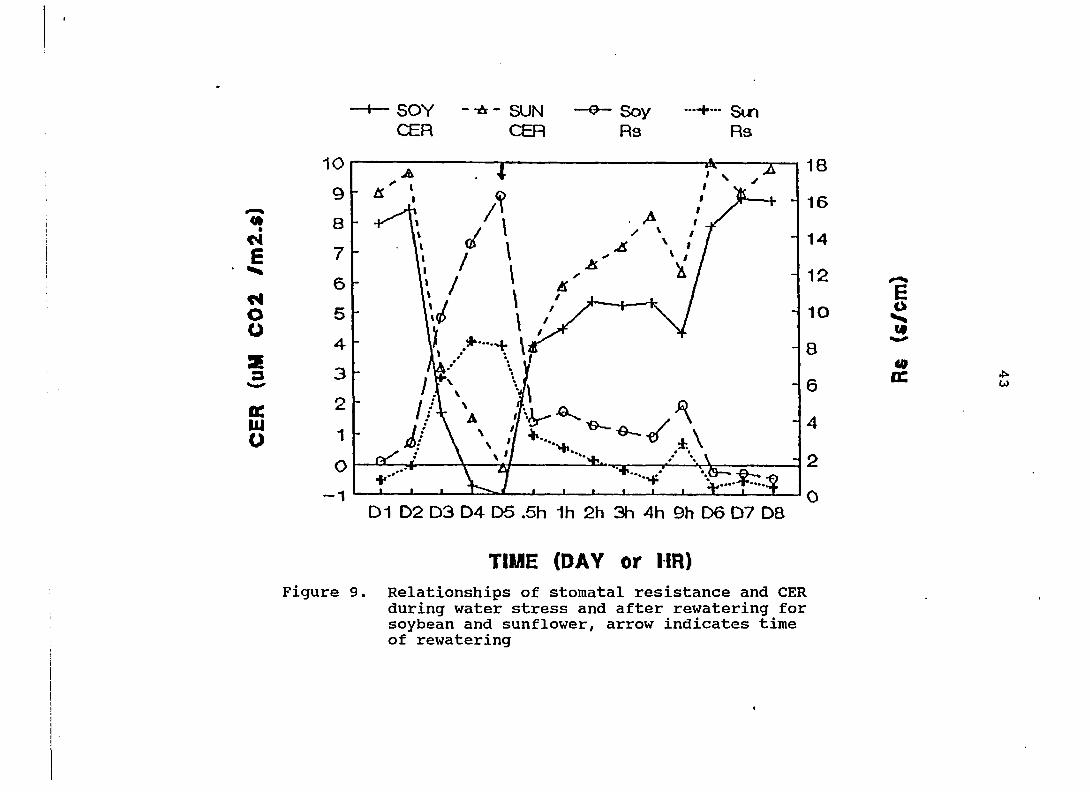
TIME (DAY or HR) Figure 9. Relationships of stomatal resistance and CER
during water stress and after rewatering for soybean and sunflower, arrow indicates time of rewatering
44
The relations between Rs and CER were r = -0.93, and -0.54 for
soybean and sunflower, respectively. It is clear that Rs was
very different between soybean and sunflower, both during and
after water stress. The consistently lower Rs of sunflower
may be one of the reasons why CER recovery of sunflower was
faster than for soybean, although water potential were
similar for both species after rewatering.
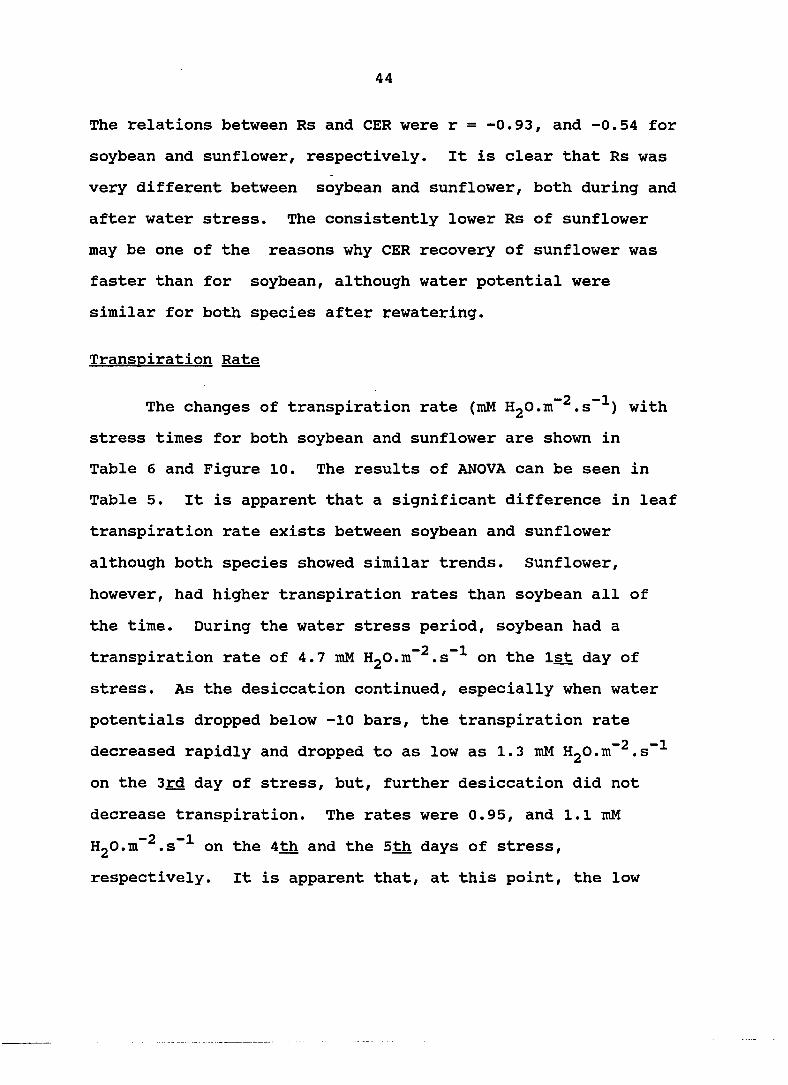
Transpiration Rate
The changes of transpiration rate (mM HgO.m"^.s~^) with
stress times for both soybean and sunflower are shown in
Table 6 and Figure 10. The results of ANOVA can be seen in
Table 5. It is apparent that a significant difference in leaf
transpiration rate exists between soybean and sunflower
although both species showed similar trends. Sunflower,
however, had higher transpiration rates than soybean all of
the time. During the water stress period, soybean had a
transpiration rate of 4.7 mM HgO.mT^.s"^ on the 1st day of
stress. As the desiccation continued, especially when water
potentials dropped below -10 bars, the transpiration rate
decreased rapidly and dropped to as low as 1.3 mM HjO.m'^.s"^
on the 3rd day of stress, but, further desiccation did not
decrease transpiration. The rates were 0.95, and 1.1 mM
HgO.m^^.s"^ on the 4th and the 5th days of stress,
respectively. It is apparent that, at this point, the low
45
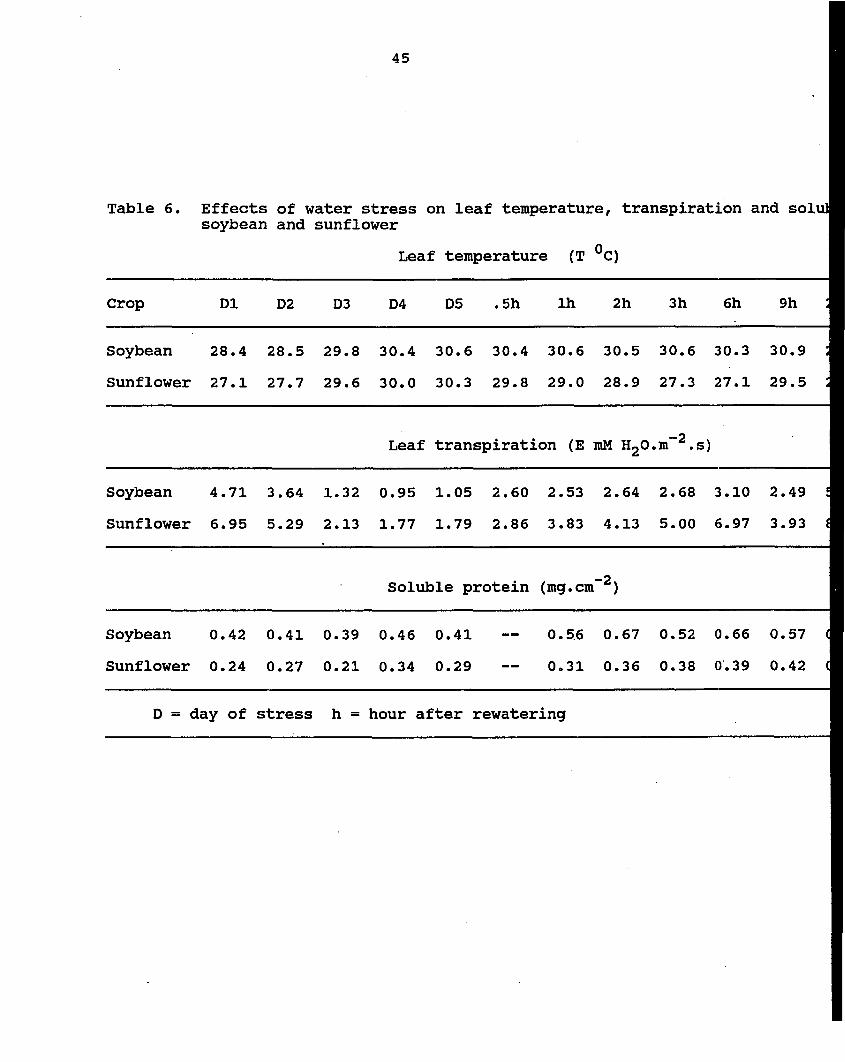
Table 6. Effects of water stress on leaf temperature, transpiration and sol soybean and sunflower
Leaf temperature (T °C)
Crop D1 D2 D3 D4 D5 . 5h Ih 2h 3h 6h 9h
Soybean 28.4 28.5 29.8 30.4 30.6 30.4 30.6 30.5 30.6 30.3 30.9
Sunflower 27.1 27.7 29.6 30.0 30.3 29.8 29.0 28.9 27.3 27.1 29.5
Leaf transpiration (E mM HgO.mT^.s)
Soybean 4.71 3.64 1.32 0.95 1.05 2.60 2.53 2.64 2.68 3.10 2.49
Sunflower 6.95 5.29 2.13 1.77 1.79 2.86 3.83 4.13 5.00 6.97 3.93
Soluble protein (mg.cm"^)
Soybean 0.42 0.41 0.39 0.46 0.41 — 0.5.6 0.67 0.52 0.66 0.57
Sunflower 0.24 0.27 0.21 0.34 0.29 — 0.31 0.36 0.38 0.39 0.42
D = day of stress h = hour after rewatering

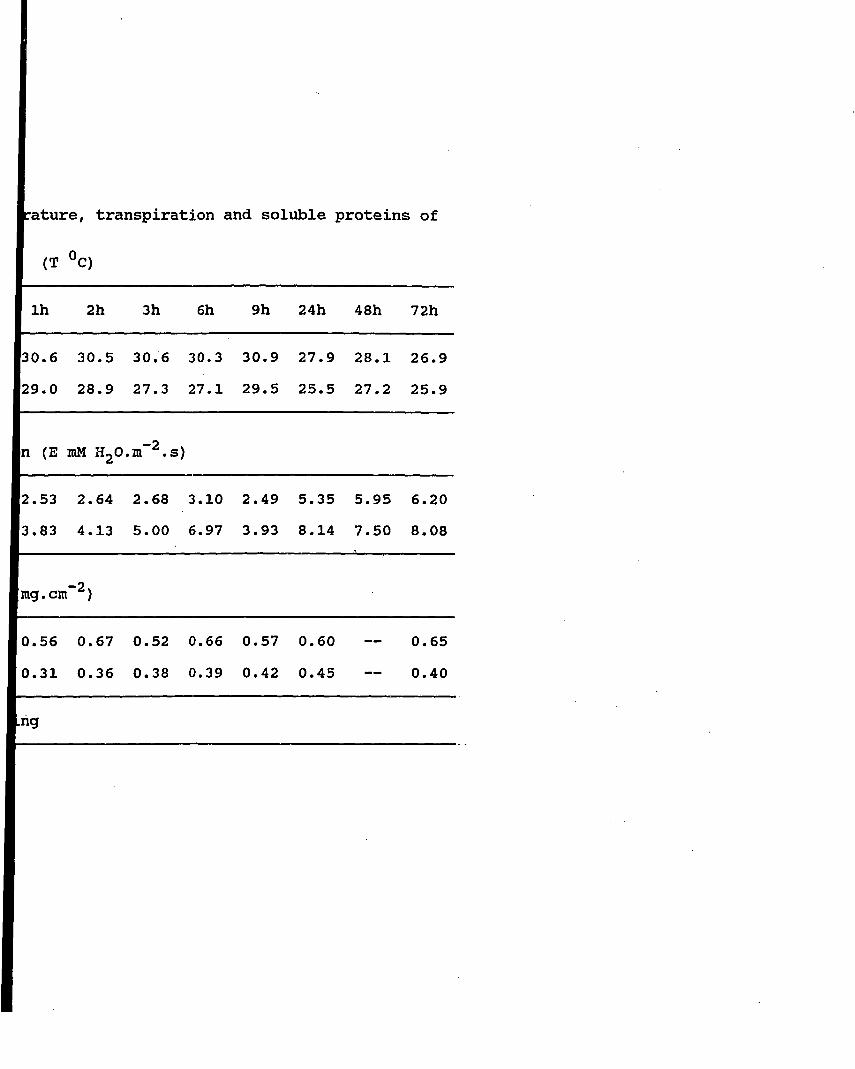
rature, transpiration and soluble proteins of
(T °C)
Ih 2h 3h 6h 9h 24h 48h 72h
30.6 30.5 30.6 30.3 30.9 27.9 28.1 26.9
29.0 28.9 27.3 27.1 29.5 25.5 27.2 25.9
-2 In (E mM HgO.m .s)
2.53 2.64 2.68 3.10 2.49 5.35 5.95 6.20
3.83 4.13 5.00 6.97 3.93 8.14 7.50 8.08
[mg.cm~^)
0.56 0.67 0.52 0.66 0.57 0.60
0.31 0.36 0.38 0.39 0.42 0.45
0.65
0.40
rig

46
10
9
8
7
6
5
4
3
2
1
0
_ —t— SOYBEAN --A-- SUNFLOWER
r / - \ / N. \
- \ * No % / \ \ :
I 1 1 1 f f f f f 1 1 f
pi D2 D3 D4 D5 .5h 1h 2h 3h 6h 9h D6 D7 D8
TIME (DAY or HR)
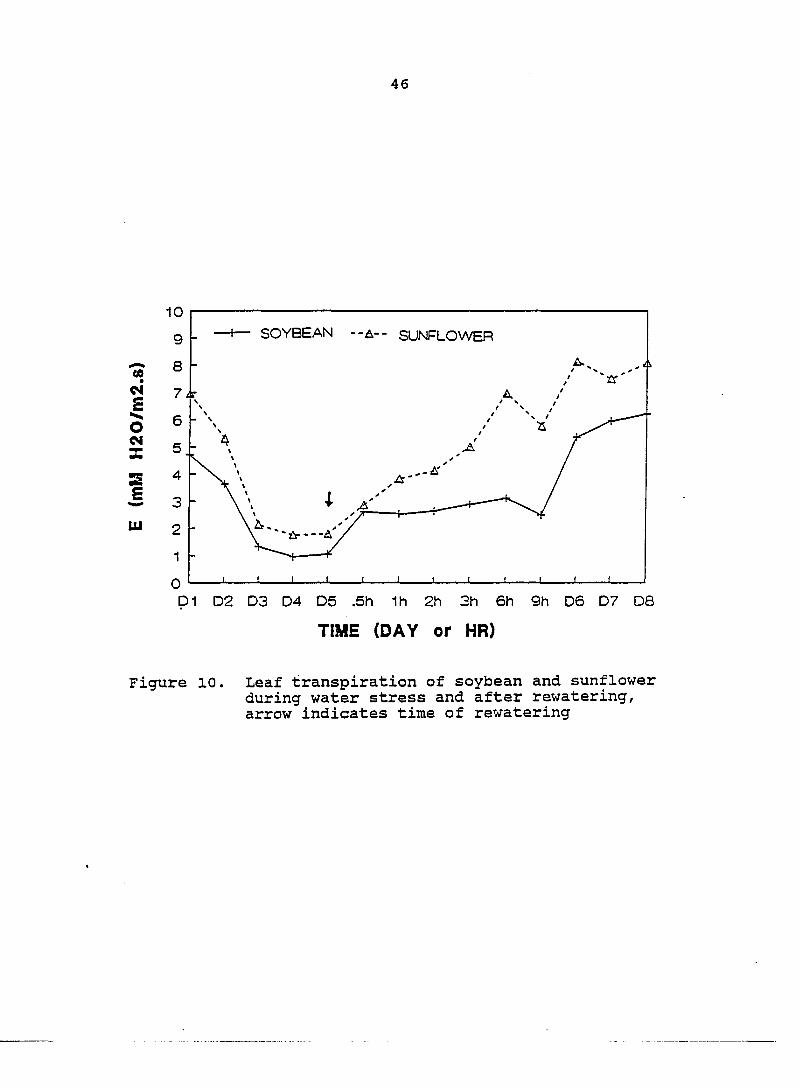
Figure 10. Leaf transpiration of soybean and sunflower during water stress and after rewatering, arrow indicates time of rewatering
47
transpiration rates on 3rd, 4th and 5th days of stress were
due to stomata closure. This tendency shows clearly in
Figures 3, 6, 7, 8, and 9. For sunflower, however, on the 1st
day it had a transpiration rate of 6.9 mM .s~^, which
was 2 mM HgO.m^^.s"^ greater than that of soybean on the 1st
day of stress. Although transpiration decreased rapidly with
stress time, it still had transpiration rates of 2.1, 1.8, and
1.8 mM HjO.m'^.s"^ on the 3rd, 4th. and 5th days of stress,
almost two times greater than that of soybean, respectively.
After rewatering, in 1st half hour both species increased
transpiration to about the same rate, 2.6 and 2.8 mM HgO.m"^
.s"^ for soybean and sunflower, respectively. After that,
however, recovery rates for the two species were different.
Sunflower possessed higher transpiration rates which returned
to predesiccation levels about 6 hour after rewatering,
whereas soybean had only a 66% recovery with a rate of 3.1 mM
HgO m"^.s"l, much lower than its 4.7 mM HgO m~^.s~^ On 1st day
of stress.
When comparing with photosynthesis in Figure 3 and
transpiration in Figure 10, it is clear that when
transpiration was less than 5 and 3 mM HgO m~^.s~^ for
sunflower and soybean, respectively, the CER of both species
decreased rapidly. Furthermore, it is also clear that the
recovery of transpiration was accompanied with the recovery of
water potential (Figs. 1 and 2), and the decrease of stomatal
48
resistance (Figs. 6 and 7). It is apparent that, water
potential influenced the stomata, which in turn, controlled
transpiration.
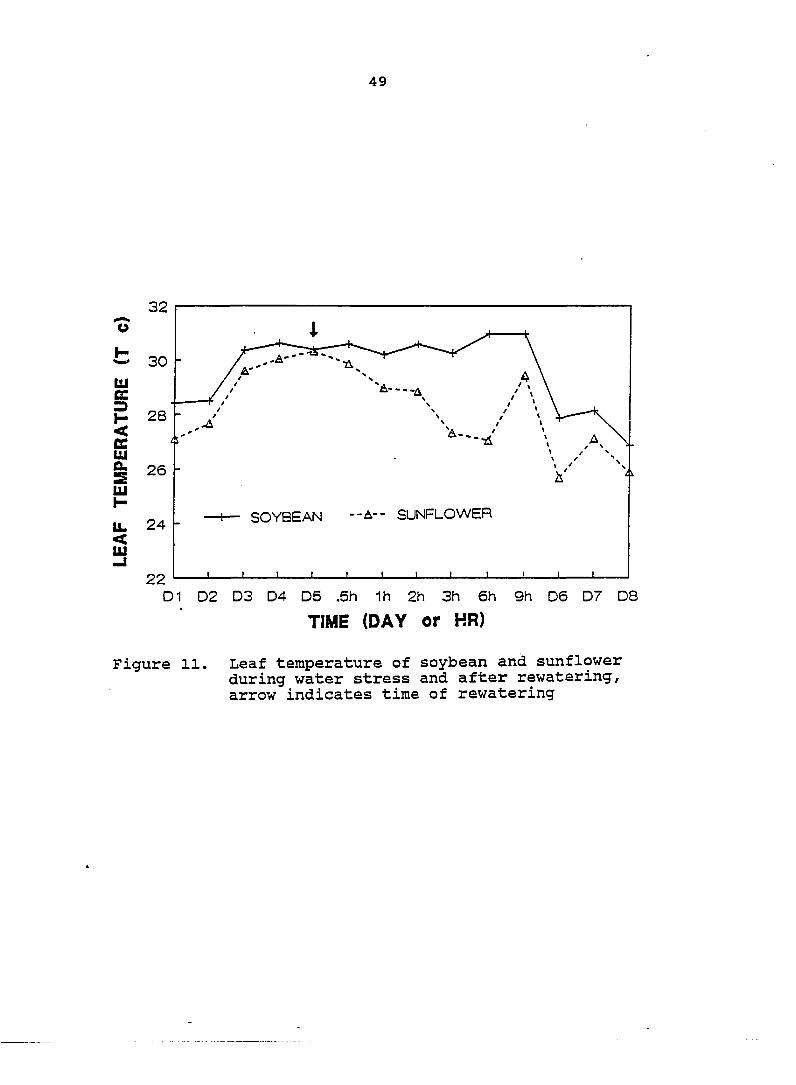
Leaf Temperature
The changes of leaf temperature (C) with time of water
stress for both soybean and sunflower are shown in Figure 11.
The results of leaf temperature and of the ANOVA are given in
Tables 6 and 5. In my earlier field experiment (LI, 1986),
leaf temperatures had been shown to be different between
soybean and sunflower, especially when air temperature was
above 30 C. In this study, this trend was also evident under
controlled environmental conditions. It is clear in Figure 11
that sunflower had lower leaf temperatures at all the times of
the measurements. Soybean had leaf temperatures of 28.4 and
28.5 C on the 1st and 2nd day of stress, respectively. As
desiccation development, leaf temperature increased to 29.8,
30.4, and 30.6 on the 3rd, 4th and 5th days of stress,
respectively. Sunflower had leaf temperatures of only 27.1
and 27.7 C on the first two days of stress, but leaf
temperatures also increased to 30 C on the 4th and 5th days of
stress, similar to that of soybean. The high leaf
temperatures on the 4th and 5th days under severe water stress
for both species probably was due to stomatal closure which
resulted in litter transpirational cooling (Figs. 1 to 10).
49
SOYBEAN --A-- SUNFLOWER
D1 D2 D3 D4 D5 .5h 1h 2h 3h 6h 9h D6 D7 D8
TIME (DAY or KR)
Figure 11. Leaf temperature of soybean and sunflower during water stress and after rewatering, arrow indicates time of rewatering
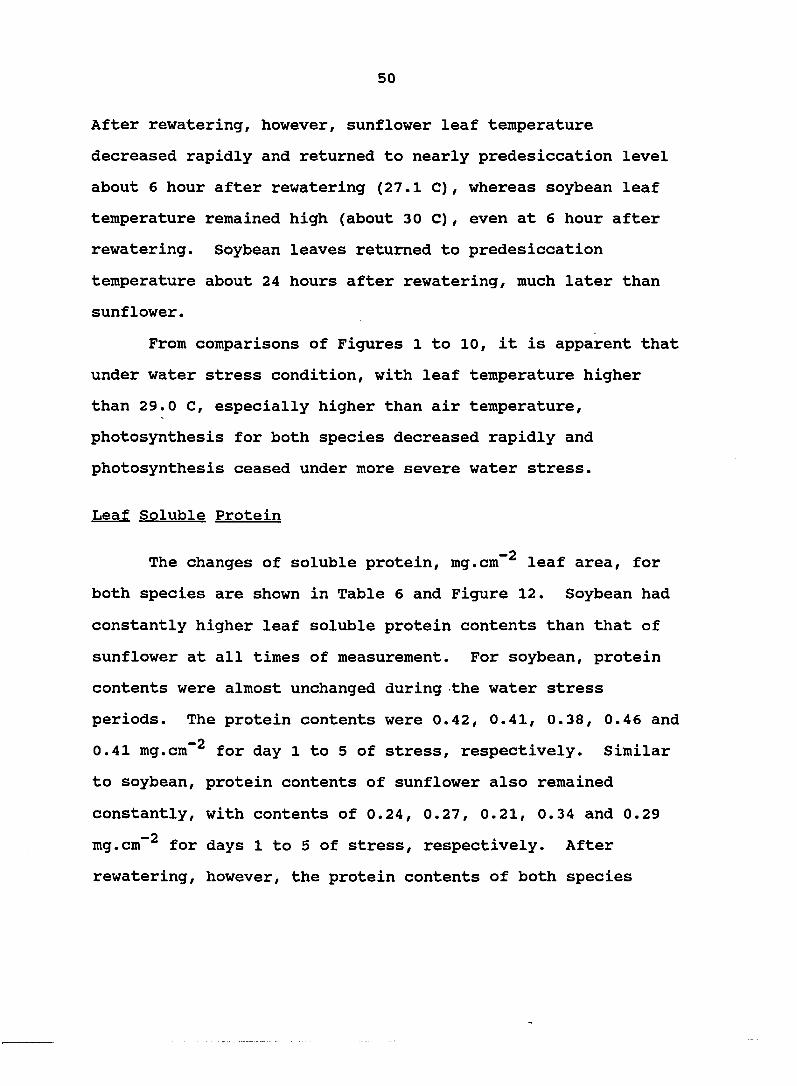
50
After rewatering, however, sunflower leaf temperature
decreased rapidly and returned to nearly predesiccation level
about 6 hour after rewatering (27.1 C), whereas soybean leaf
temperature remained high (about 30 C), even at 6 hour after
rewatering. Soybean leaves returned to predesiccation
temperature about 24 hours after rewatering, much later than
sunflower.
From comparisons of Figures 1 to 10, it is apparent that
under water stress condition, with leaf temperature higher
than 29.0 C, especially higher than air temperature,
photosynthesis for both species decreased rapidly and
photosynthesis ceased under more severe water stress.
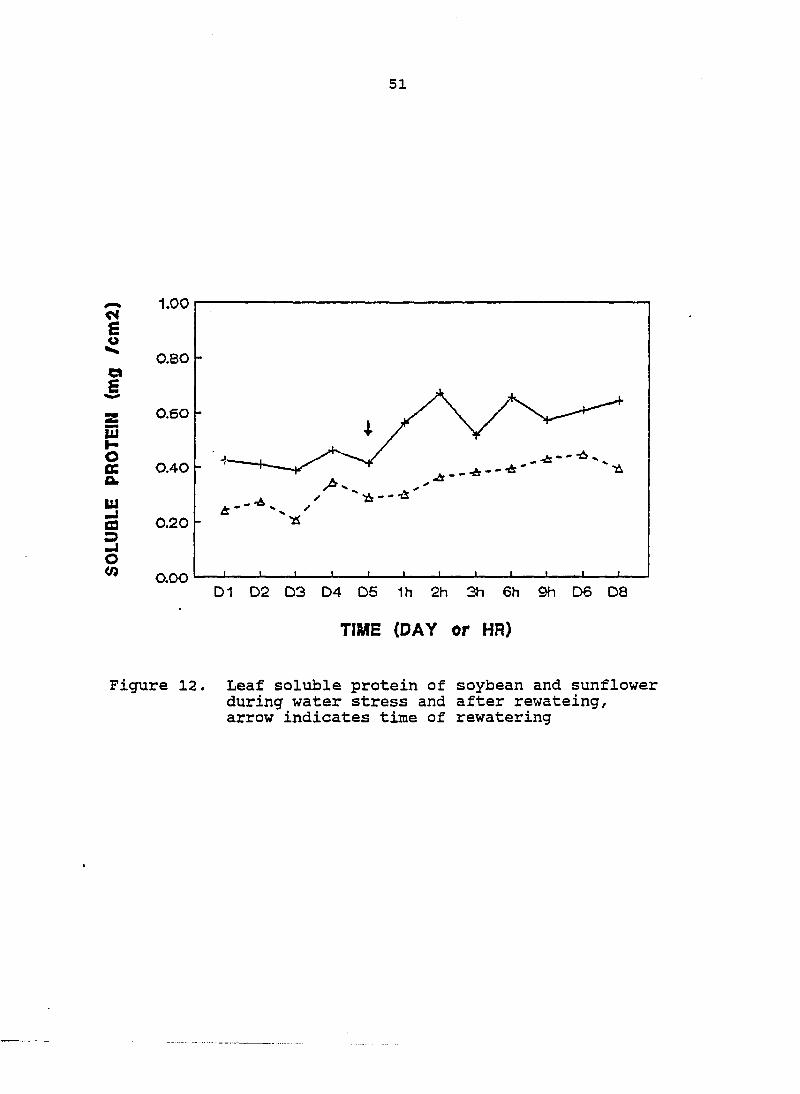
Leaf Soluble Protein
The changes of soluble protein, mg.cm~^ leaf area, for
both species are shown in Table 6 and Figure 12. Soybean had
constantly higher leaf soluble protein contents than that of
sunflower at all times of measurement. For soybean, protein
contents were almost unchanged during the water stress
periods. The protein contents were 0.42, 0.41, 0.38, 0.46 and
0.41 mg.cm~^ for day 1 to 5 of stress, respectively. Similar
to soybean, protein contents of sunflower also remained
constantly, with contents of 0.24, 0.27, 0.21, 0.34 and 0.29
mg.cm"^ for days 1 to 5 of stress, respectively. After
rewatering, however, the protein contents of both species
51
1.00
0.80
0.60
0.40
0.20
0.00 J I 1 1 L _1 I I I I L. D1 D2 D3 D4 D5 1h 2h 3h 6h 9h D6 08
TÏME (DAY or HR)
Figure 12. Leaf soluble protein of soybean and sunflower during water stress and after rewateing, arrow indicates time of rewatering
52
increased. The protein contents of soybean were 0.56, 0.67,
0.52, 0.65, and 0.57 mg.cm"^ at 1, 2, 3, 6, and 9 hour after
rewatering, respectively. While sunflower had only 0.31,
0.36, 0.38, 0.39, and 0.43 mg.cm"^ at those time,
respectively. It is clear that protein contents were
different between the two species (Table 7).
Chlorophyll
The changes of total chlorophyll (Chi a+b), chlorophyll
a (Chi a), chlorophyll b (Chi b) ug.cm""^, and chlorophyll a/b
ratio for both species are shown in Table 8, Figures 13 and
14, with Chi a+b and Chi a value in Figure 13, and Chi b and
Chi a/b ratio in Figure 14. The results of the ANOVA is given
in Table 7.
It is apparent in Figure 13 and Table 7 that there were
differences in total chlorophyll content between soybean and
sunflower. For soybean, the amounts of total chlorophyll were
48.5, 48.5, 49.5, 50.7, and 44.9 ug.cm"^ for days 1 to 5 of
stress, respectively, and sunflower had 42.7, 44.2, 45.3,
52.2, and 49.4 um.cm"^ for those days, respectively. After
rewatering, the total chlorophyll of soybean remained between
44.9 to 50.7 ug.cm~^ from 0.5 hour to 72 hour (day 8) after
rewatering. Sunflower had contents of total chlorophyll
between 49.4 to 43.1 ug.cm""^ at those times.
Figure 13 and Table 7 show a significant difference in
Chi a content between soybean and sunflower although
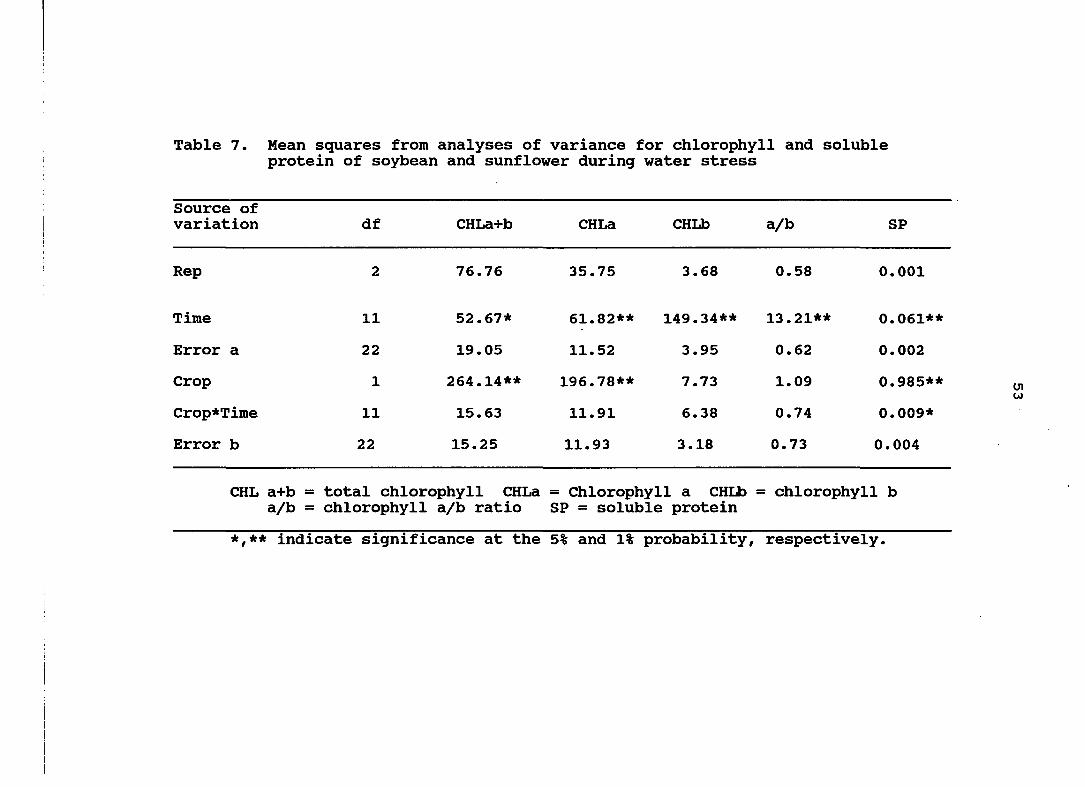
Table 7. Mean squares from analyses of variance for chlorophyll and soluble protein of soybean and sunflower during water stress
Source of variation df CHLa+b CHLa CHLb a/b SP
Rep 2 76.76 35.75 3.68 0.58 0.001
Time 11 52.67* 61.82** 149.34** 13.21** 0.061**
Error a 22 19.05 11.52 3.95 0.62 0.002
Crop 1 264.14** 196.78** 7.73 1.09 0.985**
Crop*Time 11 15.63 11.91 6.38 0.74 0.009*
Error b 22 15.25 11.93 3.18 0.73 0.004
CHL a+b = total chlorophyll CHLa = Chlorophyll a CHLb = chlorophyll b a/b = chlorophyll a/b ratio SP = soluble protein
*,** indicate significance at the 5% and 1% probability, respectively.
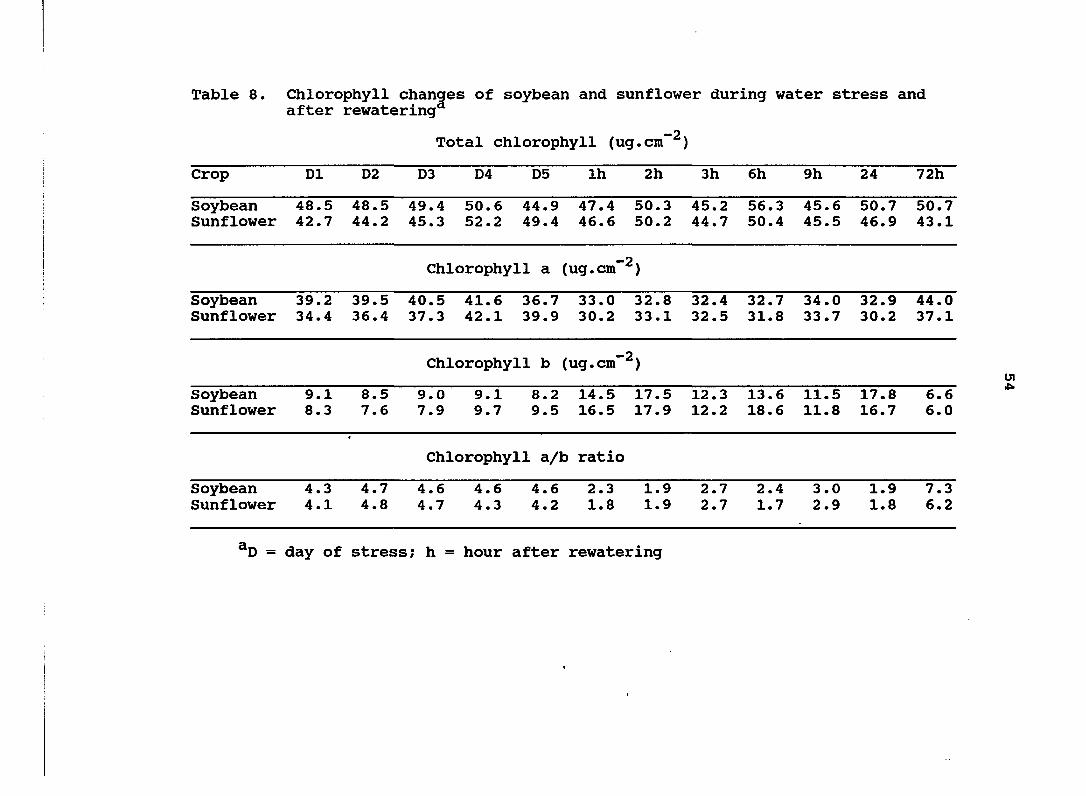
Table 8. Chlorophyll changes of soybean and sunflower during water stress and after rewatering
Total chlorophyll (ug.cm"^)
Crop D1 D2 D3 D4 D5 Ih 2h 3h 6h 9h 24 72h
Soybean Sunflower
48.5 42.7
48.5 44.2
49.4 50.6 44.9 47.4 45.3 52.2 49.4 46.6
50.3 50.2
45.2 44.7
56.3 50.4
45. 45.
6 5
50. 46.
7 9
50.7 43.1
Chlorophyll a (ug.cm"
Soybean Sunflower
39.2 34.4
39.5 36.4
40.5 41.6 36.7 33.0 37.3 42.1 39.9 30.2
32.8 33.1
32.4 32.5
32.7 31.8
34. 33.
0 7
32. 30.
9 2
44.0 37.1
Chlorophyll b (ug.cm"
Soybean Sunflower
9.1 8.3
8.5 7.6
9.0 9.1 8.2 14.5 7.9 9.7 9.5 16.5
17.5 17.9
12.3 12.2
13.6 18.6
11. 11.
5 8
17. 16.
8 7
6.6 6.0
Chlorophyll a/b ratio
Soybean Sunflower
4.3 4.1
4.7 4.8
4.6 4.6 4.6 2.3 4.7 4.3 4.2 1.8
1.9 1.9
2.7 2.7
2.4 1.7
3. 2. 0 9
1. 1. 9 8
7.3 6.2
= day of stress; h = hour after rewatering
55
C4 E u
X
0 flC
1
55
50
«5 45
40
35 -
30 I I I L
Soybean T CH_
- Sunflower T CK.
Soybean CH_ a
Sunflower CHL a
D1 D2 D3 D4 D5 1h 2h 3h 6h 9h D6 D8
TIME (DAY or HH)
Figure 13. Leaf total chlorophyll and chlorophyll a of soybean and sunflower during water stress and after rewatering, arrow indicates time of rewatering
«
e
X Ol 0
1
20
16 -
12 -
a -
D1 D2 03 04 D5 1h 2h 3h 6h 9h 06 08
TIME (DAY or HR)
—I— Soybean CH_ b
-•A - Sunflower OL b
— S o y b e a n Ca/b
••••*"• Sunflower Ca/b
Figure 14. Leaf chlorophyll b and chlorophyll a/b ratio of soybean and sunflower during water stress and after rewatering, arrow indicates time of rewatering
56
the pattern of changes in Chi a was similar in the two
species. The amounts were 39.2, 39.9, 40.5, 41.6, and 36.7
ug.cm"^ from days 1 to 5 of stress, respectively for
soybean. Sunflower had 34.4, 36.4, 37.3, 42.1, and 39.9
ug.cmT^ for those days, respectively. The Chi a content for
both species decreased after rewatering and maintained low
values for about 24 hour after rewatering and then returned
to predesiccation level. Chi a content of soybean decreased
from an average of 39.6 ug.cm"^ during water stress to 32.9
ug.cm"^ at 1 hour rewatering, and remained at this low
content for at least 24 hours, and for sunflower Chi a
dropped from an average of 38.0 ug.cm"^ to 30.2 ug.cm""^ at
those time, respectively.
On the other hand, Chi b content responded opposite to
that of Chi a content after rewatering. Chi b content was
not significantly different between the two species and
remained consent during the water stress period. For
soybean, Chi b content changed from 8.2 ug.cm"^ at day 5 to
14.5 ug.cm"^ at 1 hour after rewatering and then, had
contents of 17.5, 12.3, 13.7 and 11.5 ug.cm"^ for 2, 3, 6,
and 9 hours after rewatering, respectively. For sunflower,
Chi b increased from 9.5 to 16.5 ug.cm"^ at day 5 to 1 hour
after rewatering, and had contents of 17.9, 12.2, 18.6, and
11.8 ug.cm"^ for 2, 3, 6, and 9 hours after rewatering,
respectively. Due to relative changes of Chi a and Chi b
57
after rewatering, the Chi a/b ratio decreased during the
early rewatering period (Fig. 14), but did not show a
significant difference between the two species
(Table 7).
Discussion
One of the objectives of this study was to study the
relationships between water stress and photosynthesis and to
determine if soybean and sunflower responded differently to
water stress. The results showed that sunflower showed
constantly higher water potentials than soybean during the
water stress period although both species had similar trends
during both the stress period or recovery period. The
higher water potentials may be due to the resistance to
water transport in whole sunflower plants was only one half
that of soybean due to the higher resistance in soybean
caused by higher resistance in the root tissue external to
the root vascular tissue (Boyer, 1971a).
For water potential during the recovery period, Boyer
(1971b) showed that the leaf water potential to which leaves
returned after rewatering was dependent on the severity of
desiccation and evaporative conditions. Under moderately
evaporative conditions, leaf water potentials returned to
predesiccation levels after 3 to 5 hours when desiccation
was slight, e.g. the recovery of water potential of
58
water potentials as low as -13 bars. He also reported that
leaf water potential showed no sign of recovery when leaf
water potentials decreased to -20 bars or below during
desiccation. In this study, water potential recovery trends
were similar for both species and returned to near the
predesiccation levels in 10 hours after rewatering although
water potentials were -18.3 and -16.5 bars for soybean and
sunflower, respectively. Robinson (1978), Cox and Jolliff
(1987) reported sunflower depleted soil water to a depth of
more than 1.8 m, whereas soybean roots were less than that.
So, sunflower can absorb more water than soybean when water
stress occurred under field conditions, and in their studies
soybean depleted 45% less soil water than that of sunflower.
However, in potted conditions, the root system development may
be limited, especially for sunflower root. This may be one
reason for the similar water potential changes in my study.
Changes in photosynthesis for soybean and sunflower
during water stress were clearly shown in this experiment.
Boyer (1970) reported that the photosynthetic rate of soybean
was unaffected by desiccation until water potentials were
below -11.0 bars, whereas the photosynthetic rate of sunflower
began to decrease when water potential dropped to below -8.0
bars in growth chamber condition. My results, however, showed
that CER decreased rapidly when water potentials dropped to
below -8 bars for both species (Fig. 3). The decreases of
59
photosynthesis during water stress can be due to either non-
stomatal or stomatal effects (Cox and Jolliff, 1987; Wong et
al., 1985; Berkowitz and Whalen, 1985; Ackerson, 1980; Boyer
and Bowen, 1970). Cox and Jolliff (1987) reported that
although stomatal resistance increased during water stress,
the CER of sunflower was reduced only 15% whereas soybean CER
was reduced 50%, and a significant negative correlation
(r = -0.80) was observed between CER and Rs of soybean. They
suggested that non-stomatal effects were most responsible for
the reduced CER in dryland sunflower, and that stomatal
closure was responsible for the reduced CER in dryland
soybean. This agrees with my results in Figures 5 to 9 which
showed that sunflower had greater CER and much lower stomatal
resistance than soybean. In addition, the decreases of
photosynthesis during water stress may also be due to a
decrease in leaf concentration which enhances the
dehydration inhibition of photosynthesis because endogenous
extra chloroplastic K"^ may modulate dehydration inhibition of
photosynthesis, possibly by facilitating stromal
alkalinization (Berkowitz and Whalen, 1985). Furthermore, the
inhibition of oxygen evolution is another non-stomatal effect
on photosynthesis during water stress. Boyer and Bowen (1970)
showed that oxygen evolution was inhibited when leaf water
potentials were below -12 bars in pea and -8.0 bars in
sunflower, and the inhibition was proportional to leaf water
60
potential below this limit. They concluded that low leaf
water potential affects photosynthesis in at least two ways,
first, through an inhibition of oxygen evolution by
chloroplast and second, by closure of stomata in intact
leaves. It is apparent that the rapid reduction of CER for
both species when leaf water potential dropped below -8 bars
in this experiment may be partly due to the above factors as
well as other reasons.
The slower recovery of photosynthesis than that of water
potential for both species, especially for soybean, was
clearly shown in this experiment. Two factors may inhibit the
recovery of photosynthesis, one is incomplete recovery of leaf
water potential, and the another is in incomplete return to
full stomatal opening (Boyer, 1971b). In this study, recovery
of water potential does not appear to be a limiting factor for
recovery of photosynthesis because water potential almost
returned to predesiccation levels in 10 hours after rewatering
whereas photosynthetic rates did not completely recovery for
either species, especially for soybean. However, the lack of
full opening of stomata may be one of reasons for slower
recovery of photosynthesis, e.g., even 9 hours after
rewatering, stomatal resistances were still higher than
predesiccation levels (4.8 and 1.8 s.cm~^ for soybean and
sunflower, respectively). Rawson et al. (1980) reported that
water stress increased stomata frequencies of sunflower, but
61
reduced the area of individual stomata, so that stomatal area
per unit leaf area was unchanged. This may could explain why
stomatal resistances of sunflower were constantly lower than
that of soybean during water stress (Figs. 6 and 7), however,
these changes in stomata may not have had time to occur during
the short period of water stress used.
The slower recovery of photosynthesis may also be due to
impairment of the photosynthetic apparatus itself during water
stress. Potter and Boyer (1973) reported a reduction in
electron transport in PSII of chloroplasts isolated from
desiccated sunflower leaves. Water stress caused an
inactivation of the primary photochemistry of PSII reaction
center complex (Powles and Bjorkman, 1982). There was also a
reduction in quantum yield of COg fixation (Mohanty and Boyer,
1976), and the ribulose bisphosphate regeneration capacity was
affected in some way during water stress (Caemmerer and
Farguhar, 1984). Since about 50% of leaf soluble protein is
ribulose bisphosphate carboxylase/oxygenase (rubisco), one of
the major enzymes in photosynthesis (Kawashima and Wildam,
1970; Jensen and Bear, 1977; and Kung et al., 1980), it seems
that the lower content of leaf soluble protein contents for
both species indicate rubisco may be damaged during water
stress. It takes time to restore the enzyme, therefore a
slower recovery of photosynthesis. Although soybean showed
higher protein content, other factors such as stomatal
62
resistance may be dominant to cause its slower photosynthesis
recovery than that of sunflower.
In addition, the low light level in the growth chamber
may be another reason for slower recovery of photosynthesis.
The PPFD in growth chamber was much' lower than that of in the
field, an average of 500 vs 2000 uE m~^.s~^ for growth chamber
and field, respectively. Under low light the photochemical
reactions are limiting (Kok, 1965; Rabinnowitch and Govindjee,
1969). Furthermore, in low light, intact sunflower required
more light per unit of COg fixed when leaf water potentials
were low than when they were high (Boyer and Bowen, 1970), and
at low light intensities, the photochemical activity of the
sunflower leaves limits photosynthesis (Boyer, 1971b).
Gamble and Burke (1984) reported that although changes
in chlorophyll content were observed in response to water
stress, the changes were not associated with a change in
chlorophyll quality as evidenced by an average Chi a/b ratio
of 3.23 in field grown winter wheat (Triticum aestivum L.).
My results in Figures 13 and 14 were similar to theirs during
the water stress period. In my study, the Chi a/b ratios for
both species were about 4.0, and were constant during the
water stress period because chlorophyll a and b showed a
similar trends during water stress, with an average Chi a of
39.6 vs 38.0 ug.cm"^ and Chi b of 8.8 vs 8.6 ug.cm"^ for
soybean and sunflower, respectively. However, the Chi a/b
63
ratio for both species were decreased after rewatering. An
average Chi a/b ratio of 2.8 vs 2.7 for soybean and sunflower,
respectively, at 9 hour after rewatering. This indicated that
the change to lower Chi a/b ratios after rewatering may be
partially responsible for slower recovery of photosynthesis
for both species.
Leaf transpiration and leaf temperature also affect
photosynthesis. This is clear by comparisons of Figures 3, 4,
10, and 11. However, both leaf transpiration and temperature
are closely related to leaf water potential (Fig. 1). Scott
et al. (1981) found a linear relationship between leaf
temperature and leaf water potential. My results showed a
similar relations. As desiccation continued, transpiration
decreased rapidly from 4.7 to 1.0, and 6.9 to 1.8 mM HgO.m"
^.s~^ at days 1 and 5 of stress for soybean and sunflower,
respectively, while the water potential dropped from -5.5 to -
18.3 bars and -4.0 to -16.5 bars, for soybean and sunflower at
those days, respectively. It is apparent that water deficit
lead to lowered leaf water potentials and consequently to
partial stomatal closure (Brady et al., 1975; Sionit and
Kramer, 1977; Wien et al., 1979; Carlson et al., 1979; and
Jung and Scott, 1980). In Figures 6 and 7, the stomatal
resistance increased rapidly for both species during water
stress, which indicated that stomata was partially or fully
closed as the stress continued. The partial stomatal closure
64
in turn, lowered photosynthesis, transpiration, growth and
yield (Beardsell et al., 1973). Furthermore, stomatal closure
of leaves in sunlight is also reported to result in increased
leaf temperature if other influences, such as wind speed and
vapor pressure remain relatively constant (Ehrler et al.,
1978; Teare and Kanemsu, 1972). In addition, working with
wheat (Jackson et al., 1977), and soybean (Jung and Scott,
1980; Reicosky et al., 1980) showed that midday canopy
temperature of well watered plants remains 2 to 7 C below air
temperatures. However, as the water supply became limiting,
canopy temperatures of stressed plants were similar to or
greater than air temperatures during the middle of the day.
Figure 11 showed clearly that leaf temperatures were 2 to 3 C
lower than air temperature for both species. As desiccation
developed, leaf temperatures increased rapidly, and soybean
leaf temperatures were higher than air temperature, whereas
sunflower leaf temperatures were similar to air temperature.
The leaf temperature increases were accompanied by decreases
of water potential (Fig. 1), transpiration (Fig. 10), and
increased stomatal resistance (Figs. 6 and 7). The lesser
leaf temperatures of sunflower than that of soybean were due
to the differences in the above factors. Due to greater rates
of transpiration and therefore greater cooling the leaf
temperature of sunflower without stress was always about 26 to
65
28 C when air temperature was at 30 C and CER of sunflower is
at a maximum at about 28 C (Robinson, 1967).
66
CHAPTER 2
AN IMPROVED METHOD FOR PURIFICATION AND QUANTIFICATION
OF ABSCISIC ACID FROM GREEN TISSUES BY HPLC AND GC-MS
Introduction
Many papers on methods for determining ABA have been
published in recent years (Anderson et al., 1978; Archbold
and Dennis, 1984; Vaughan and Milborrow, 1984; Neill and
Horgan, 1985; Guerrero and Mullet, 1986; Vine et al., 1987;
Funada et al., 1988). However, most of these papers deal with
either seeds (Subbaiah and Powell, 1987; Neill et al., 1986),
or roots (Rivier et al., 1977; Watts et al., 1987), or fruits
(Bangerth, 1982) but not highly pigmented green tissues. In
addition. The procedures for extraction, purification,
internal standard methods and instruments such as HPLC or GCMS
have varied by different workers. A very few GCMS methods for
highly pigmented green foliar tissues have been described.
The objective of this study was to provide an improved
purification, rapid, and sensitive method for quantifying ABA
from highly pigmented green tissues such as soybean and
sunflower leaves.
67
Materials and Methods
Plant materials
Seeds of soybean (Glycine max (L.) Merr. 'Amsoy 71') and
sunflower (Helianthus annuus L. 'S-1888') were planted in the
same 3 gallon pot with 20:40:40 of soil:moss:perlite mixture,
with about 10 cm distance between soybean and sunflower seeds
and with soybean seed planted 5 d earlier than sunflower in
order to obtain a similar plant size before water stressing
began. Thirty days after planting in greenhouse plants were
moved into growth chamber (PGW 36 Conviron Product Co.,
Winnipeg, Manitoba, Canada) with 30/22°C day/night
temperature, 16 h photoperiod and 500 ^E/mf PPFD. Water
stress was employed after 3 days adaptation in growth chamber.
Leaves of both species were removed by cutting and 5 grams of
fresh leaves were immediately put into liquid nitrogen after
water potential measurement. Later, the leaves were
transferred to freezer and stored at -100 until analyzed.
Chemical and working conditions
Trideuterated ABA (^H-ABA) as shown in Figure 15 was
obtained from Dr. Morgan (Dept. of Botany and Microbiology,
University College of Wales, Wales, U.K.). Organic solvents
used were HPLC grade. Deionized water was filtered through a
0.45 /xm filter (Gelman Science Inc., Ann Arbor, MI). All the
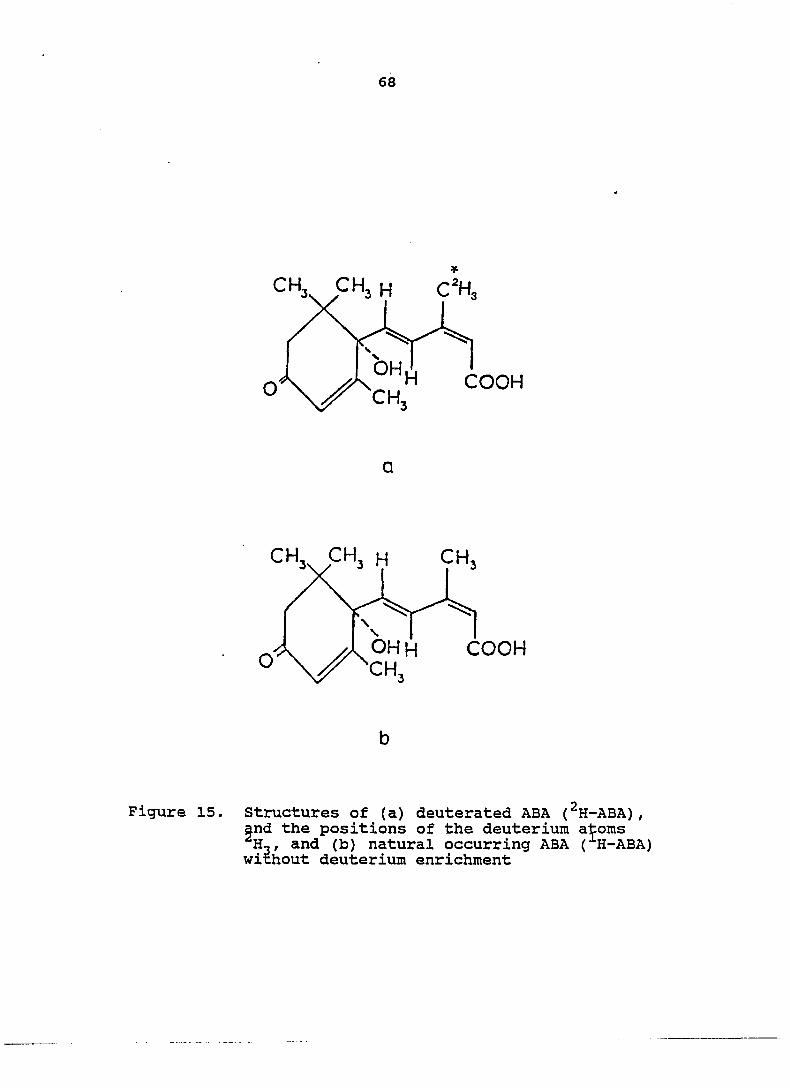
68
CH, CH, H cH
H COOH
a
CH. CH3 H CH
OH H CH,
COOH
b
Figure 15. Structures of (a) deuterated ABA (H-ABA), and the positions of the deuterium atoms H3, and (b) natural occurring ABA (H-ABA) without deuterium enrichment
69
extraction and purification procedures were performed under
dim light.
ABA extraction and purification
Leaf samples of each species were removed from the
freezer and placed into a pre-chilled mortar with liquid
nitrogen, approximately 3 g of washed sea sand (Fisher
Scientific) was added to the mortar. The leaf sample was
first ground to fine powder with liquid nitrogen. Then
extracted in 80% (v/v) acetoneiHgO three times with 20 min
each time, and a known quantity of ^H-ABA, as an internal
standard, was added to the extract at first extraction. A
total of 25 ml of 80% acetone was used for each one gram fresh
tissues. The extract was filtered through two layers of
Whatman #1 filter paper and pooled into a 250 ml pear-shaped
flask, then reduced to the aqueous phase by a Buchi rotary
evaporator under vacuum at 35°C. The aqueous phase was
adjusted to pH 9.5 with NaOH and partitioned with hexane three
times using about 5 ml per gram fresh weight in a 125 ml
separatory funnel. The aqueous phases were pooled again while
discard the hexane phase, and the aqueous phase adjusted to pH
2.5 with HCl. Then the aqueous phase was partitioned against
ethyl acetate three times using about 25 ml per 5 g fresh
weight. The organic phase (ethyl acetate) was collected while
discarding the aqueous phase. Then organic phase was taken to
near dryness at 35°C in the rotary flask evaporator under
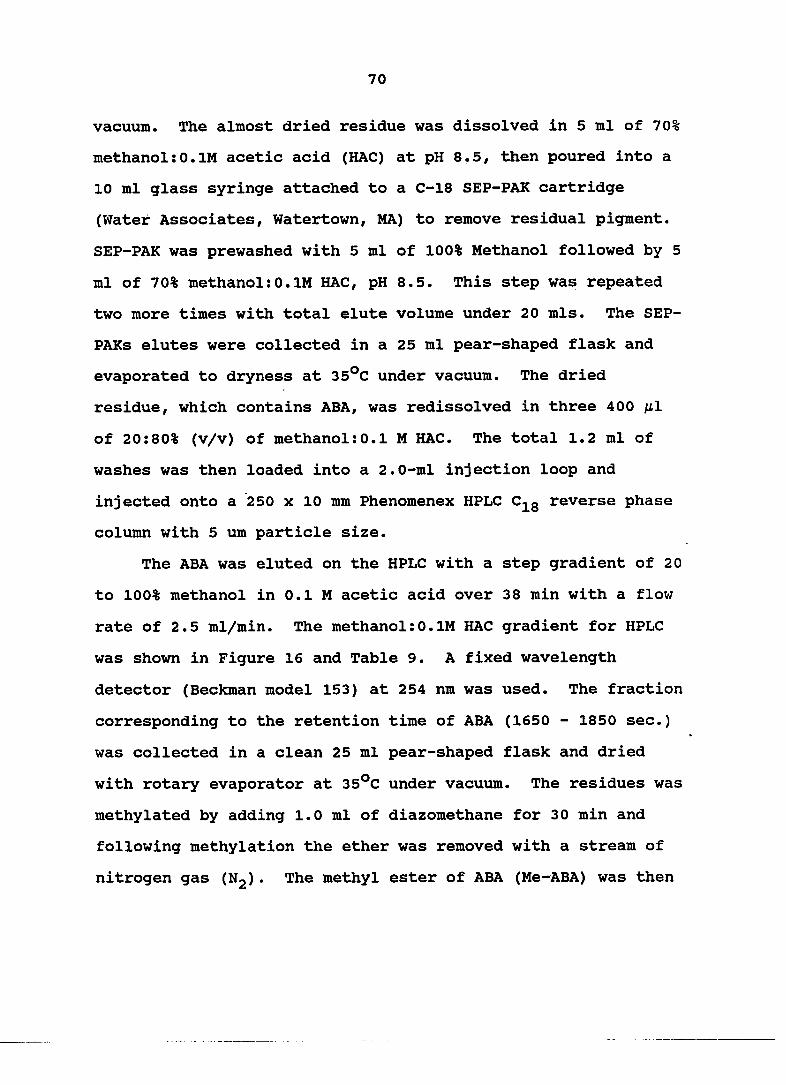
70
vacuum. The almost dried residue was dissolved in 5 ml of 70%
methanol:0.IM acetic acid (HAC) at pH 8,5, then poured into a
10 ml glass syringe attached to a C-18 SEP-PAK cartridge
(Water Associates, Watertown, MA) to remove residual pigment.
SEP-PAK was prewashed with 5 ml of 100% Methanol followed by 5
ml of 70% methanol:0.IM HAC, pH 8.5. This step was repeated
two more times with total elute volume under 20 mis. The SEP-
PAKs elutes were collected in a 25 ml pear-shaped flask and
evaporated to dryness at 35°C under vacuum. The dried
residue, which contains ABA, was redissolved in three 400 fj.1
of 20:80% (v/v) of methanol:0.1 M HAC. The total 1.2 ml of
washes was then loaded into a 2.0-ml injection loop and
injected onto a 250 x 10 mm Phenomenex HPLC C^g reverse phase
column with 5 um particle size.
The ABA was eluted on the HPLC with a step gradient of 20
to 100% methanol in 0.1 M acetic acid over 38 min with a flow
rate of 2.5 ml/min. The methanol:0.IM HAC gradient for HPLC
was shown in Figure 16 and Table 9. A fixed wavelength
detector (Beckman model 153) at 254 nm was used. The fraction
corresponding to the retention time of ABA (1650 - 1850 sec.)
was collected in a clean 25 ml pear-shaped flask and dried
with rotary evaporator at 35°C under vacuum. The residues was
methylated by adding 1.0 ml of diazomethane for 30 min and
following methylation the ether was removed with a stream of
nitrogen gas (Ng)• The methyl ester of ABA (Me-ABA) was then
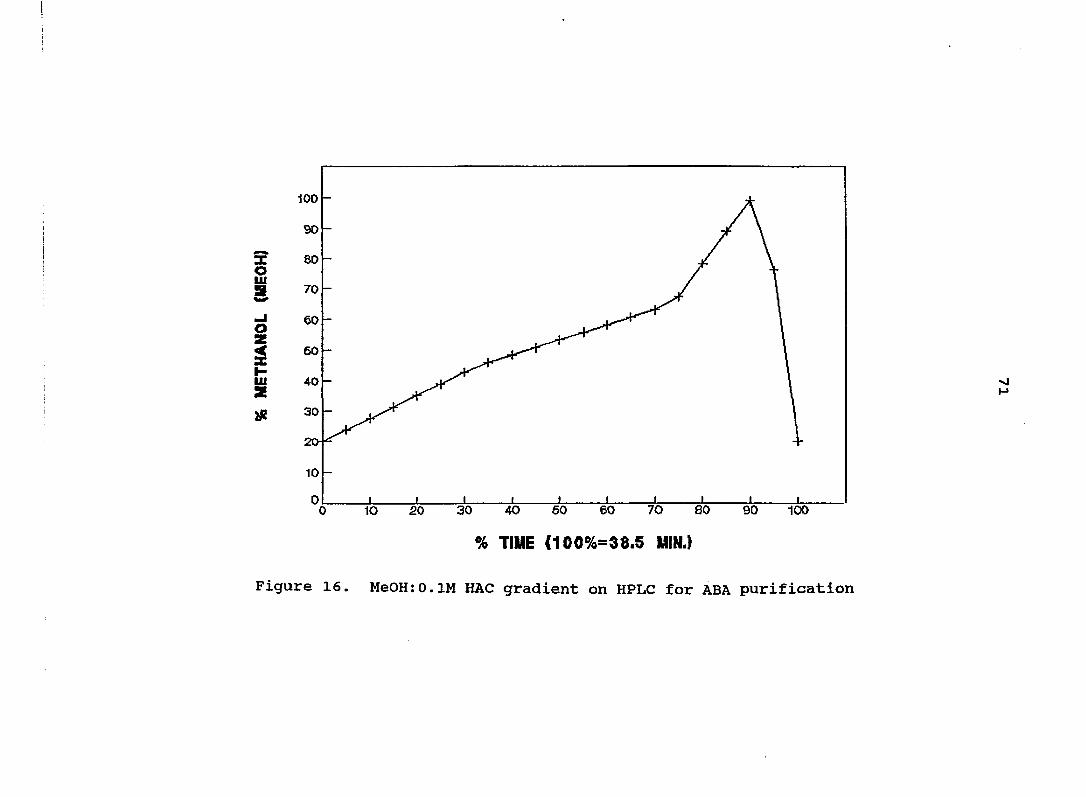
10 -
10 20 30 40 60 60 70 80 90 100
% TIME (100%=38.5 MIN.)
Figure 16. MeOH:0.lM HAC gradient on HPLC for ABA purification
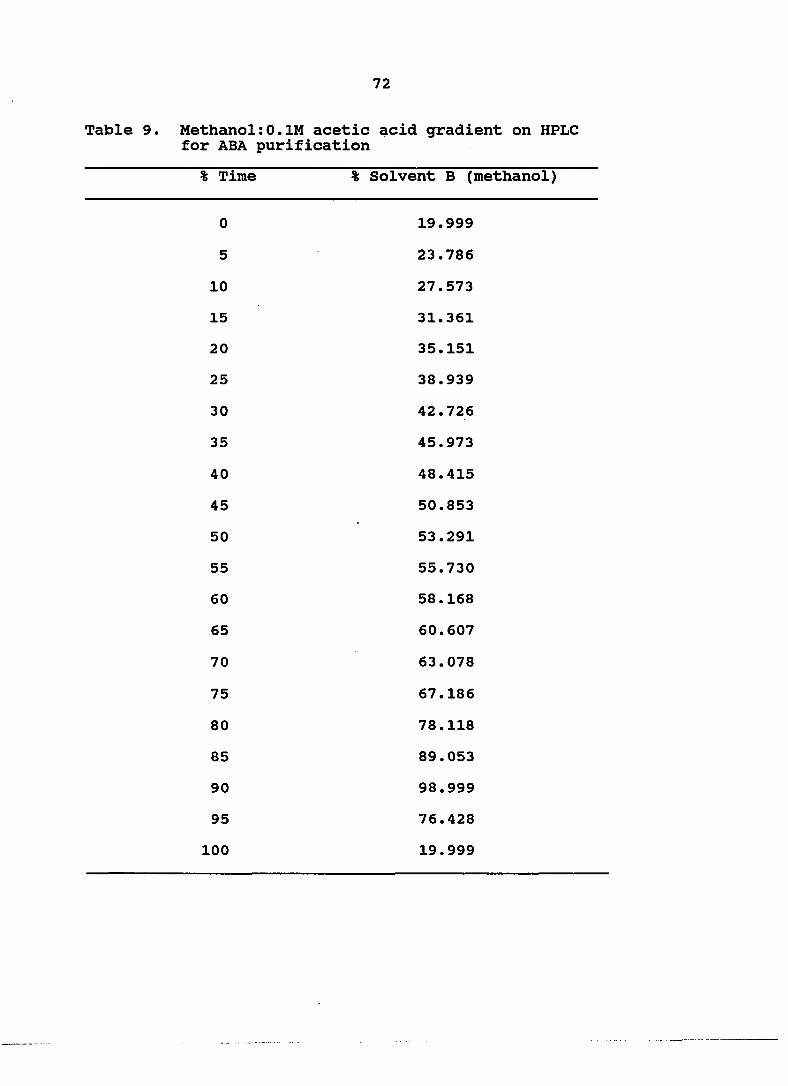
72
Table 9. Methanol: 0.IM acetic acid gradient on HPLC for ABA purification
% Time % Solvent B (methanol)
0 19.999
5 23.786
10 27.573
15 31.361
20 35.151
25 38.939
30 42.726
35 45.973
40 48.415
45 50.853
50 53.291
55 55.730
60 58.168
65 60.607
70 63.078
75 67.186
80 78.118
85 89.053
90 98.999
95 76.428
100 19.999
73
transferred to a 300 ul mine vial (Reliance Glass Works, Inc.,
Bensenville, IL) from the 25 ml pear-shaped flask with three washes of 70, 60 and 60 /xl of 100% methanol. The total 200 /xl
of Methyl esters of ABA in methanol was then dried again under
Ng. Finally, the Me-ABA residue was dissolved in 10 /il of
100% methanol which was ready for quantitative analyses by GC-
MS. The summary of the extraction, purification, and
quantification procedures is shown in Figure 17.
Quantitation of ABA bv GCMS-SIM
A gas chromatograph linked to a mass-selective detector
(GC-MS)(Hewlett Packard model 5890 and 5970, respectively) was
used for ABA analysis. The carrier gas was helium at a flow
rate of 28 cm^/min. The GC with silica capillary columns was
programmed for a linear temperature gradient from 100°C with a
10°C/min increment to final temperature of 250°C at 15 min.
and maintained at this temperature for 5 min. (20 min. total
for each run). 2 /Ltl of sample was injected into GC using a 10
ul syringe with splitless injection. The selected ion
monitoring (SIM) model was run in mass selective detector and
the four abundance of ions current of 162 and 190 atomic mass
units (AMU) for ^H-Me-ABA, at 165 and 193 AMU for ^H-Me-ABA,
respectively were monitored. An analyses program was written
for GCMS systems to calculate the peak areas of the ions. The
Me-ABA and ^H-Me-ABA had retention times between 14.40 to
14.50 min. Each sample was duplicated on GCMS, so the average
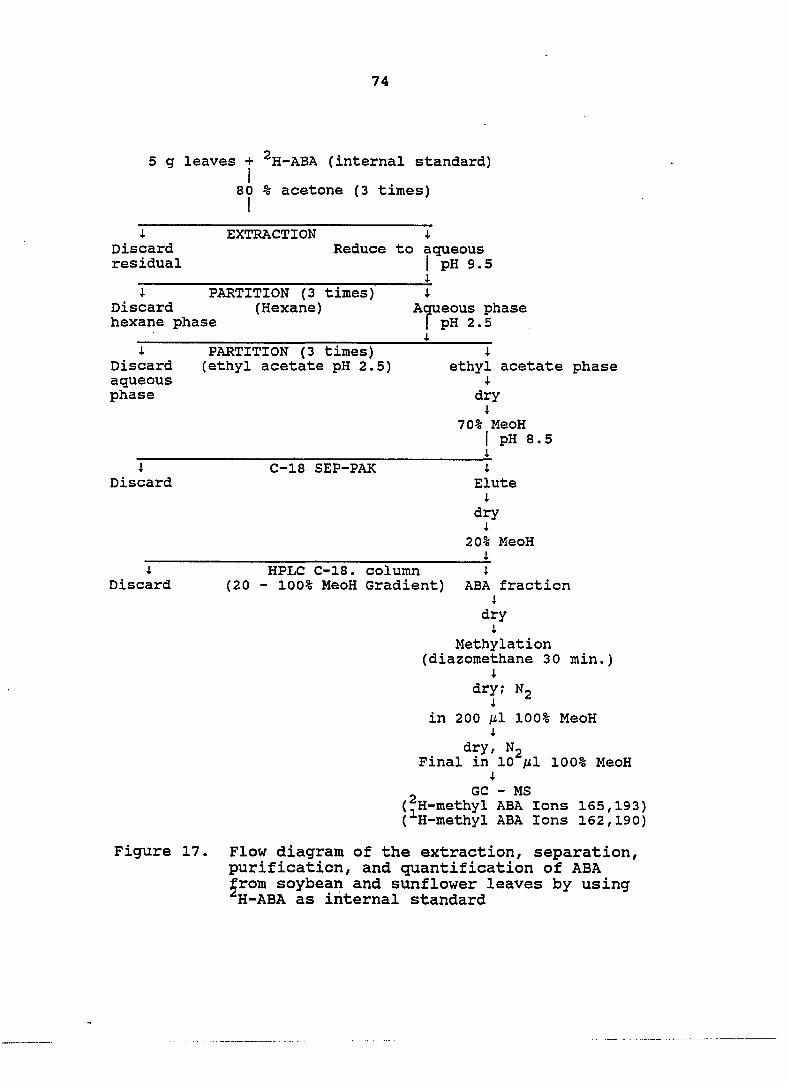
74
5 g leaves + ^H-ABA (internal standard)
80 % acetone (3 times)
1 Discard residual
EXTRACTION Reduce to
4. aqueous 1 pH 9.5 1
I PARTITION (3 times) I Discard (Hexane) Ameous phase hexane phase f pH 2.5 i
1 Discard aqueous phase
PARTITION (3 times) (ethyl acetate pH 2.5)
I ethyl acetate phase i
dry ;
70% MeoH 1 pH 8.5 I I
Discard C-18 SEP-PAK I
Elute i
dry I 20% MeoH I
Discard
Figure 17.
HPLC C-18. column 4 (20 - 100% MeoH Gradient) ABA fraction I
dry I
Methylation (diazomethane 30 min.) I
dry; N-I
in 200 /il 100% MeoH I dry, N-
Final in 10 Ml 100% MeoH 1
GC - MS (^H-methyl ABA Ions 165,193) (^H-methyl ABA Ions 162,190)
Flow diagram of the extraction, separation, purification, and quantification of ABA from soybean and sunflower leaves by using H-ABA as internal standard
75
ABA was reported with two of each 165/162 and 193/190 ion
ratio in calculations, respectively. The ABA amount of leaves
on ng/g bases was calculated by isotope dilution equations
(Magnus et al., 1980) as following:
Equation 1 Y = X [(ci/cf) - 1]
Where: Y = amount of naturally occurring ABA (in ng)
X = known amount of H-ABA added to sample as
internal standard (in ng)
Ci = initial concentration (%) of ^H-ABA before
adding ^H-ABA
= 100%
Cf = final concentration (%) of ^H-ABA after
adding ^H-ABA
= 2-Me-ABA peak area x 100%
^-Me-ABA peak area + ^H-ABA peak area
X was always determined in a parallel run for each set
of determination. A known exact amount of ^-H-ABA (Y) was
added to a estimated amount of ^H-ABA (X, the exact amount was
T_ o unknown). The H- and H-ABA were mixed and methylated, then
processed through GCMS. The X was then calculated by
rearranging equation 1 to obtain the following:
Equation 2: X = Y [(ci/cf) -1]
Therefore, with the amount of ^H-ABA (X) known, the
amount of ^H-ABA in leaf sample can be calculated.
76
Results
The retention time of ^H-ABA and commercial ^H-ABA
(Sigma Scientific) in the standard run in GCMS can be seen in
Figures 18 and 19. It shows clearly that both forms of ABA
had the same retention time between 14.40 - 14.50 min. So,
identifications of sample ABA was based on the retention times
relative to that of standard ABA.
In addition, to further confirm ABA of tissue samples
which we determined although our sample extract showed the
same retention time as that of ^H-ABA and commercial ^H-ABA,
the leaf extract of both soybean and sunflower were run
separately without added ^H-ABA as internal standard on GCMS
with scanning between 50 and 300 AMU range. Compared with the
10 most abundance ions of reference ABA fragments. Figure 20
shows that the mass spectrum of leaf ABA extract was a 99.14%
match of the fragmentation patterns of reference ABA.
For soybean and sunflower results. Figures 21 and 22
also show clearly that the organic solvent partitioning of
extract had much purified ABA and there was less interaction
with other substances for both soybean and sunflower.
Especially examination of ion chromatograph at retention times
tween 13.00 to 16.00 min. showed that Me-ABA had a retention
time of 14.43 min with a dominant peak. Less than 10 other
peaks are shown in this range. This indicates that the
purification by this assay method is excellent. In addition.
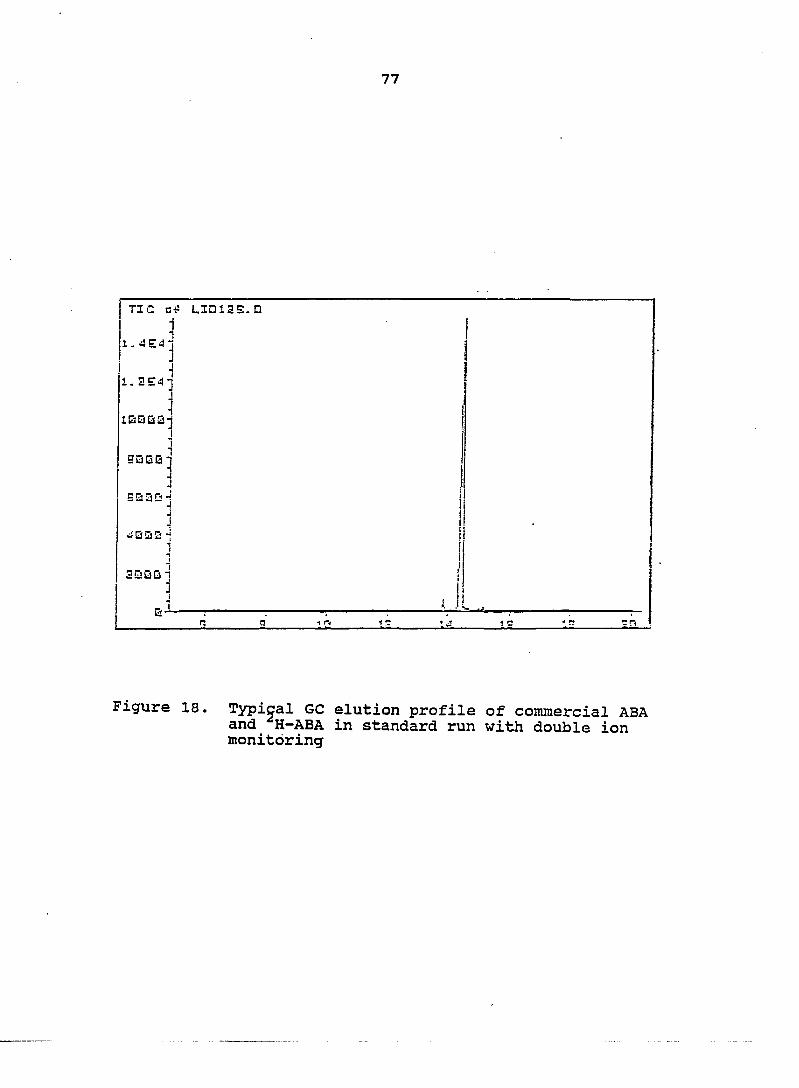
77
TIC cf LIDiaS.Q
1.4E4-
1.2E4-
1BQQ2-
SBBG-
SS3EI J
w'QSS 4
J
Figure 18. Typical GC elution profile of commercial ABA and H-ABA in standard run with double ion monitoring

78
San 1ES.Q2 g mu. frcm LID12S.D
SSBBl
sass-j
ÎGD3J
] l :an 1G5.BS s mu. frcm LZDISS.D 4 4QQa^
ZBSBi
2QEeî
m fi rt 4 ,'1
1QG3
l\ 1 J
I
4G2C
3BBZ
S3BE
L
i f-4DEl2
[•3EI2C
I hseaû
! F-icaB
~3
la n 15Q.QQ =mu. frcm LID122.0
5BQa
S5G0"
4803:
SQBG-
S3ÛQ
SQQQ
n, y 1
sasB
= 353
I -buQS
-4333
: • I -3333
rSBSG C b kJ U iJ
333U
1 J
Figure 19. Detailed typical GC elution profiles for commercial ABA and ®H-ABA with double ion monitoring between 13.0 and 16.0 min.
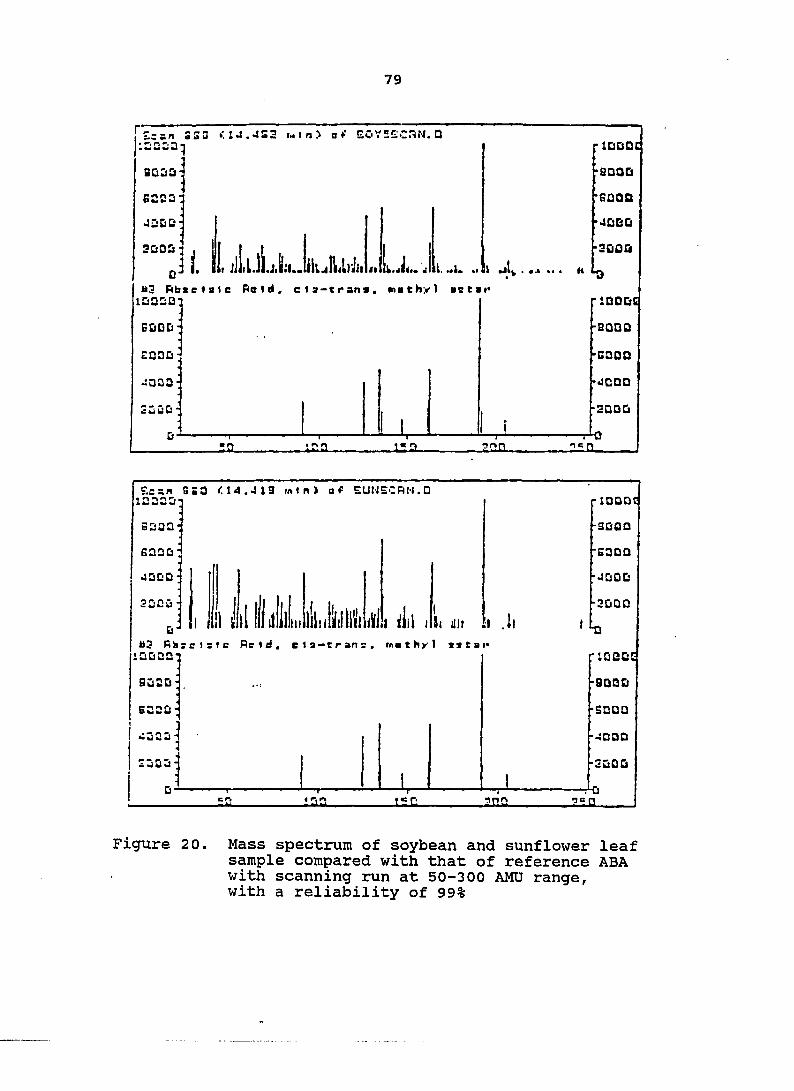
79
[z= z n 3S3 c. «n> a t EOYSECRN. 0 k2223q
BuBB
G223
•IDCtC
""J i. II, il I. I h3 Abac «ale Raid, cla-tran*. «lathyl act 1Û05B]
GOOD
Z03G:
-*003-
2ÛÛB-
T-IS l. 1:2 -T-
?r>n
M
-IDODC
•SDOû
•&QQO
•IQQO
-3000
4)
-IDOOQ
-QQQQ
cooo
dCDO
2Q0Û
rHJ
Se:M S S3 (Id.J 19 min) o f SUWECAN.O 122321
S233:
G32Û-
U30D-
23CÛ •
Û3 Kb 12000
!i i )l lllillli III lii.Jiiiiiiiii ill I ill It lilt if .il I Istc Acid, cla—trans, methyl aator
QÙ20
>:222
£UU>J
Figure 20. Mass spectrum of soybean and sunflower leaf sample compared with that of reference ABA with scanning run at 50-300 AMU range, with a reliability of 99%
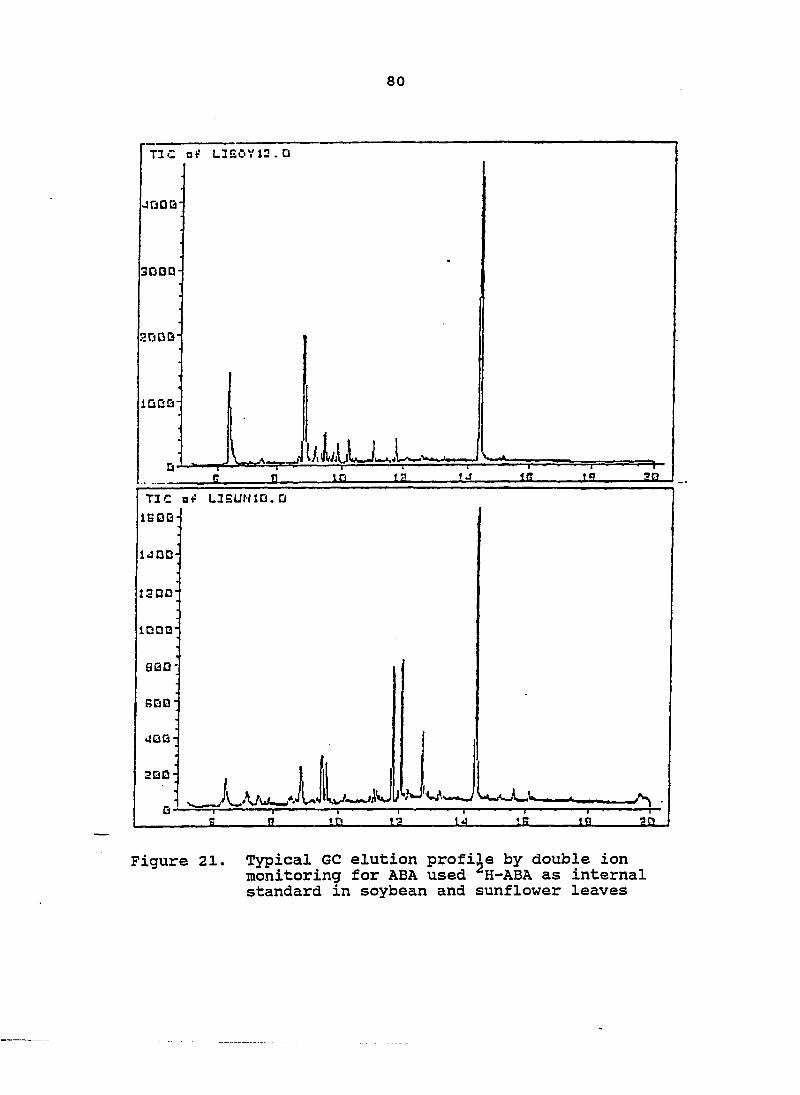
80
TIC of LIE0V12.D
3000
l A
TIC of HSUNID.O IBDQ-
14QD
IDDQ
8G0
Figure 21. Typical GC elution profile by double ion monitoring for ABA used H-ABA as internal standard in soybean and sunflower leaves
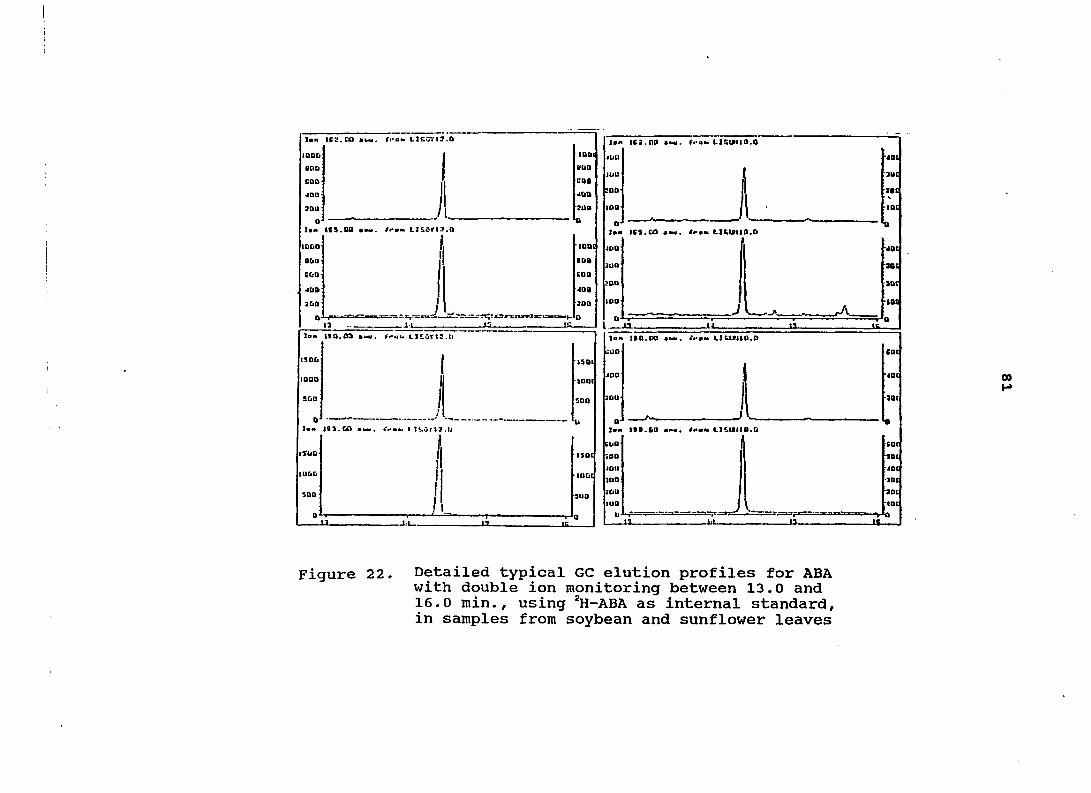
I S A 1 6 3 . O a « t M i . f p o w L J S W t O . O
tSOb 00 H
Figure 22. Detailed typical GC elution profiles for ABA with double ion monitoring between 13.0 and 16.0 min., using ®H-ABA as internal standard, in samples from soybean and sunflower leaves
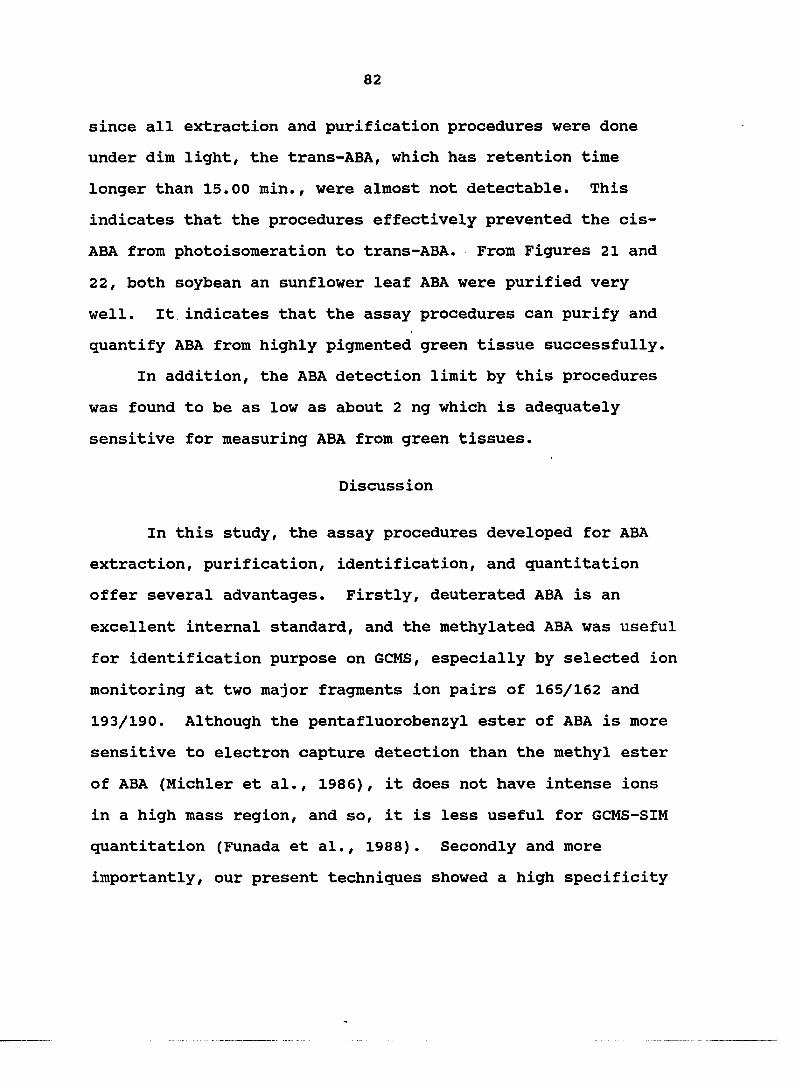
82
since all extraction and purification procedures were done
under dim light, the trans-ABA, which has retention time
longer than 15.00 min., were almost not detectable. This
indicates that the procedures effectively prevented the cis-
ABA from photoisomeration to trans-ABA. From Figures 21 and
22, both soybean an sunflower leaf ABA were purified very
well. It indicates that the assay procedures can purify and
quantify ABA from highly pigmented green tissue successfully.
In addition, the ABA detection limit by this procedures
was found to be as low as about 2 ng which is adequately
sensitive for measuring ABA from green tissues.
Discussion
In this study, the assay procedures developed for ABA
extraction, purification, identification, and quantitation
offer several advantages. Firstly, deuterated ABA is an
excellent internal standard, and the methylated ABA was useful
for identification purpose on GCMS, especially by selected ion
monitoring at two major fragments ion pairs of 165/162 and
193/190. Although the pentafluorobenzyl ester of ABA is more
sensitive to electron capture detection than the methyl ester
of ABA (Michler et al., 1986), it does not have intense ions
in a high mass region, and so, it is less useful for GCMS-SIM
quantitation (Funada et al., 1988). Secondly and more
importantly, our present techniques showed a high specificity
83
and sensitivity for ABA identification and quantitation. This
can be seen clearly in Figures 18 to 22, especially in
Figure 22, ABA showed the only dominant peak as well as a low
ABA detection limits. Thirdly, our techniques are more time
efficient compared to other methods reported. In our method,
the extraction of ABA from leaf tissue takes only 1 hour, and
the total time required for one sample from extraction to
finished GCMS analysis takes only about 8 hours, much shorter
than that of others. Instead of 1 hour for ABA extraction
from plant tissue, other methods required much longer times
for extraction such as 12 hours (Guerrero and Mullet, 1986),
or 15 hours in darkness (Bangerth, 1982), or 24 hours in
darkness (Watts et al., 1983; Subbaiah and Powell, 1987; Vine
et al., 1987; Funada et al., 1988). In addition, our method
is relatively simple, only several steps of organic solvent
partitioning and on step of HPLC, whereas for other methods,
extra centrifuge steps (Neill and Morgan, 1985; Subbaiah and
Powell, 1987), or two HPLC steps (Guerrero and Mullet, 1986)
were used as well as other steps.
It is apparent that the procedure developed here provided
a relatively quick, efficient, simple, and reliable method for
extraction, purification and quantitation of ABA from highly
pigmented green tissues. It can also be used for ABA
determinations from non-green tissues with modifications.
84
CHAPTER 3
EFFECTS OF ENDOGENOUS AND EXOGENOUS ABA ON
PHOTOSYNTHESIS OF SOYBEAN AND SUNFLOWER
Introduction
It is well documented that sunflower possesses greater
photosynthetic capacity than soybean. Much information has
shown that the difference in photosynthesis is due to many
factors including enzymatic reaction efficiency, such as
rubisco activity. However, little information on hormonal
effects, such as ABA levels between the two species under
water stress, have been accumulated. Many reports have shown
that abscisic acid increases during water stress in many
species, such as in barley fHordeum vulaare L.), soybean,
sunflower, spinach fSpinacia oleracea L.), pea fPisum salivum
L.) and tomato fLvcopersicon esculentum L.), and therefore,
ABA has been believed to be responsible for many physiological
changes in plants, especially on photosynthesis. Two
possibilities could explain the mechanism of action by ABA on
photosynthesis; (a), an indirect effect mediated by stomatal
closure which cause a reduction of COg supply (Dubbe et al.,
1978); or (b). direct effect on the photosynthetic mechanism
(Raschke and Hedrich, 1985). Cox and Jolliff (1987), based on
their field measurement of CER of soybean and sunflower under
irrigated and dryland conditions, have suggested that stomatal
85
effects were responsible for the reduction of CER in soybean,
whereas nonstomatal effects were responsible in sunflower.
However, the causes of the differences in stomatal effects in
response to water stress are not clear, especially the role of
ABA is unknown. Therefore, in this study, we hypothesize that
different ABA levels exist between soybean and sunflower,
especially in stressed condition, and that the ABA difference
is one of the causes of photosynthetic difference between the
two species. In addition, the ABA level may be higher in
soybean than in sunflower, especially in water stressed
condition, and the higher ABA level in soybean is responsible
for the stomatal effects on photosynthesis.
To test our hypothesis, this study was divided into two
parts. In Experiment 1, the direct comparison of endogenous
ABA level between soybean and sunflower was measured under
water stress environment, and the relationships of endogenous
ABA to stomatal resistance (conductance), transpiration and
photosynthetic rate were investigated. In Experiment 2, the
effects of exogenous ABA on leaf conductance, transpiration,
and photosynthesis under nonstressed condition were examined.
86
These efforts were attempt to certify the relationships of ABA
in regulating stomatal movement and photosynthesis differently
among species.
Materials and Methods
Experiment 1
Growing conditions The seeds of soybean (Amsoy 71) and
sunflower (s-1888) were planted in the same black plastic pot,
with soybean planted 5 days earlier than sunflower. All other
growth conditions and management in both the greenhouse and
growth chamber were the same as in Chapter 1. Water stress
was also as specified in Chapter 1.
Sampling The leaves used for measurement and sampling
procedures were as described in Chapter 1, except that after
leaf water potential had been measured, 3 leaves of sunflower
and about 5 leaves of soybean were taken. Then, leaves of
each species were cut in pieces avoiding large veins by razor
blade and mixed well. Two 5 gram fresh weight samples of each
species were taken by electronic balance (Mettler PC 2000,
Mettler Instrument Corp., Switzerland), and immediately, the
leaf area of each sample was measured with LI-3000 Potable
Area Meter (LI-COR, Inc., Lincoln, Nebraska). After that, one
of the 5 g leaf samples was put into a small envelope, stored
in liquid Ng, and later transferred to freezer (Forma
Scientific, Division of Mallinckrodt Inc., Marietta, Ohio) and
87
stored at -100 for endogenous ABA determinations. The
other 5 g leaf sample was dried at 70 in Eguatham incubator
(Curtin Matherm Scientific Inc., Houston, Texas) for leaf dry
weight determination. Leaf samples for both species were
taken from day 1 to day 5 during water stress period and 0.5,
1, 2, 3, 6, 9, 24, 48, and 72 h after rewatering,
respectively.
Measurements
a) The endogenous ABA of both species were
quantitatively analyzed by method developed during this study
using HPLC, and a GCMS-SIM system as described in Chapter 2.
b) Leaf water potentials and photosynthetic
parameters were measured as described in Chapter 1.
Experiment 2
Growing conditions In this experiment, all greenhouse
growing conditions were as in Chapter 1, with the exception
that seeds of soybean and sunflower were planted in separate
8 liter black plastic pots. A total of 32 pots with 16 pots
for each species were used. Plants were thinned to one per
pot at VI stage, and the care of plants was as in Chapter 1
until moved into growth chamber. In the growth chamber plants
were kept well watered throughout the experiment, where
chamber temperature was set to 30/20'C for day/night,
respectively, and 24 h photoperiod. Other conditions were as
88
in Chapter 1. After 3 days of adaptation in growth chamber,
the exogenous ABA treatments were ready to employ.
Experiment layout The experiment was a split-split-plot
randomized block design with measuring time, crops, and ABA
treatments representing the main, split, and split-split plot,
respectively. Four pots (replications) were in each ABA
treatment.
ABA treatments In this experiment, three ABA
concentrations with 20, 100 and 500 uM plus control (distilled
water) were used. The ABA, white crystal with 99"*"% pure, was
purchased from Sigma Chemical Co. (P. 0. Box. 14508, ST.
Louis, MO 63118-9974). For making 500 ml of 500 uM solution,
66.078 mg of ABA was weighed carefully by Miller analytical
balance and a small amount of 0.3 N NaOH was added to water to
aid the solubility of ABA. After the ABA crystals dissolved
the volume was adjusted to 500 ml. Then, 100 and 20 uM ABA
solutions were made by dilution from 500 uM solution. In
order to prevent photoisomeration, dim light was used during
preparation of the ABA solutions. For each treatment, 4 pots
of each species were used and leaves used for treatment were
the upper 5 full expanded and illuminated leaves. Each
concentration was applied by spraying both side of the leaves
until wet.
Sampling and measurements Plant samples were taken
before treatment and at 5, 10, 20, 30, 40, 50, 60 and 70 h
89
after treatment for both species. The stomatal conductance
(resistance), transpiration rate and photosynthetic rate were
measured as specified in Chapter 1.
Results
Experiment 1
The endogenous ABA concentrations on leaf fresh weight
(FW), dry weight (DW), and leaf area (cmf) bases for both
soybean and sunflower during water stress and after rewatering
can be seen in Table 10 and Figures 23 to 27. The results of
the analyses of variance is given in Table 11. It is clear
that ABA contents were strongly affected by water stress and
significant changes of ABA patterns were shown in this study.
A statisticaly significant difference (at the 0.01 level of
probability) between soybean and sunflower in endogenous ABA
either on fw, or dw, and on a leaf area bases was found.
Higher ABA content was found in soybean than that in sunflower
during water stress. On fresh weight bases in Figures 23 and
24, ABA did not change very much during first two days of
stress, 142 and 177 vs 115 and 154 ng/g fw for soybean and
sunflower at day 1 and day 2, respectively. However, as
desiccation continued, the ABA contents of soybean increased
dramatically from day 3 to day 5 of stress, which was
paralleled by leaf water potential decreases. The ABA
increased to as high as 1022 and 2044 ng/g fw at day 3 and day
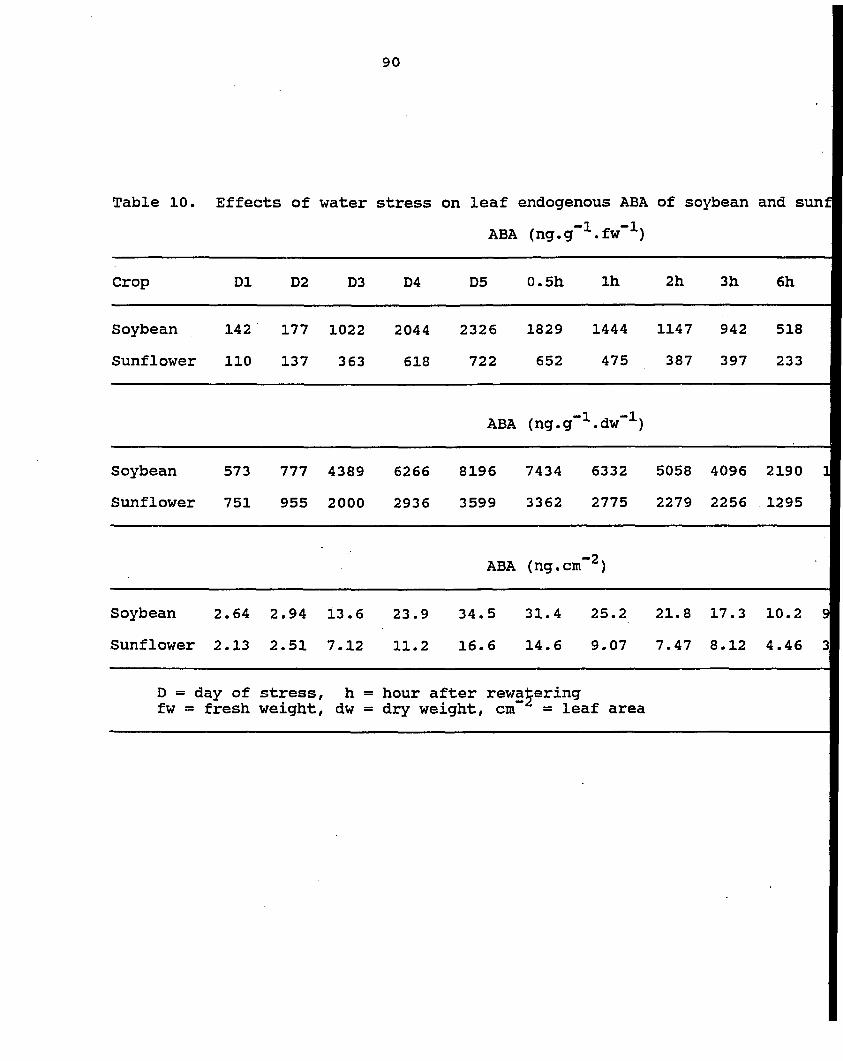
90
Table 10. Effects of water stress on leaf endogenous ABA of soybean and sunf
ABA (ng.g"l.fw"l)
Crop D1 D2 D3 D4 D5 0.5h Ih 2h 3h 6h
Soybean 142 177 1022 2044 2326 1829 1444 1147 942 518
Sunflower 110 137 363 618 722 652 475 387 397 233
ABA (ng.g"^.dw"l)
Soybean 573 777 4389 6266 8196 7434 6332 5058 4096 2190 1
Sunflower 751 955 2000 2936 3599 3362 2775 2279 2256 1295
ABA (ng.cin"^)
Soybean 2.64 2.94 13.6 23.9 34.5 31.4 25.2 21.8 17.3 10.2 9
Sunflower 2.13 2.51 7.12 11.2 16.6 14.6 9.07 7.47 8.12 4.46 3
D = day of stress, h fw = fresh weight, dw
= hour after rewatering = dry weight, cm" = leaf area

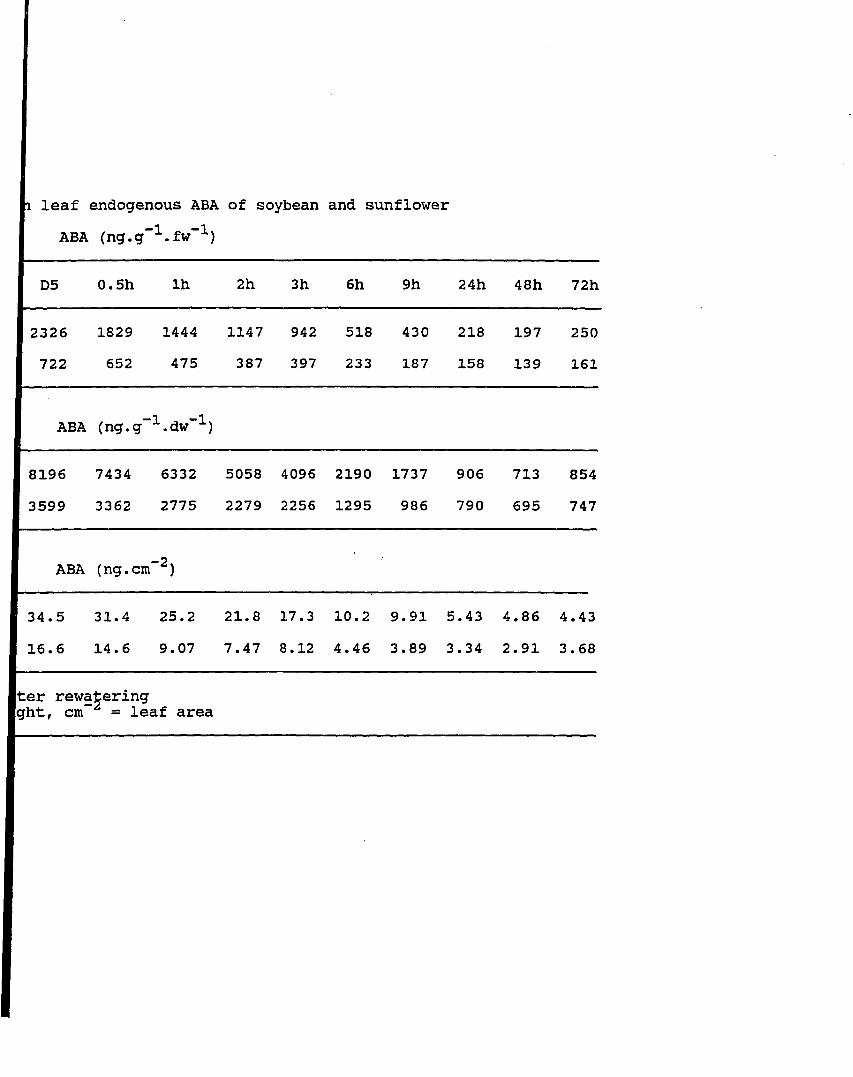
1 leaf endogenous ABA of soybean and sunflower
ABA (ng.g"^.fw~^)
D5 0.5h Ih 2h 3h 6h 9h 24h 48h 72h
2326 1829 1444 1147 942 518 430 218 197 250
722 652 475 387 397 233 187 158 139 161
ABA (ng.g'^.dw""^)
8196 7434 6332 5058 4096 2190 1737 906 713 854
3599 3362 2775 2279 2256 1295 986 790 695 747
ABA (ng.cm"^)
34.5 31.4 25.2 21.8 17.3 10.2 9.91 5.43 4.86 4.43
16.6 14.6 9.07 7.47 8.12 4.46 3.89 3.34 2.91 3.68
rewatering , cm" = leaf area

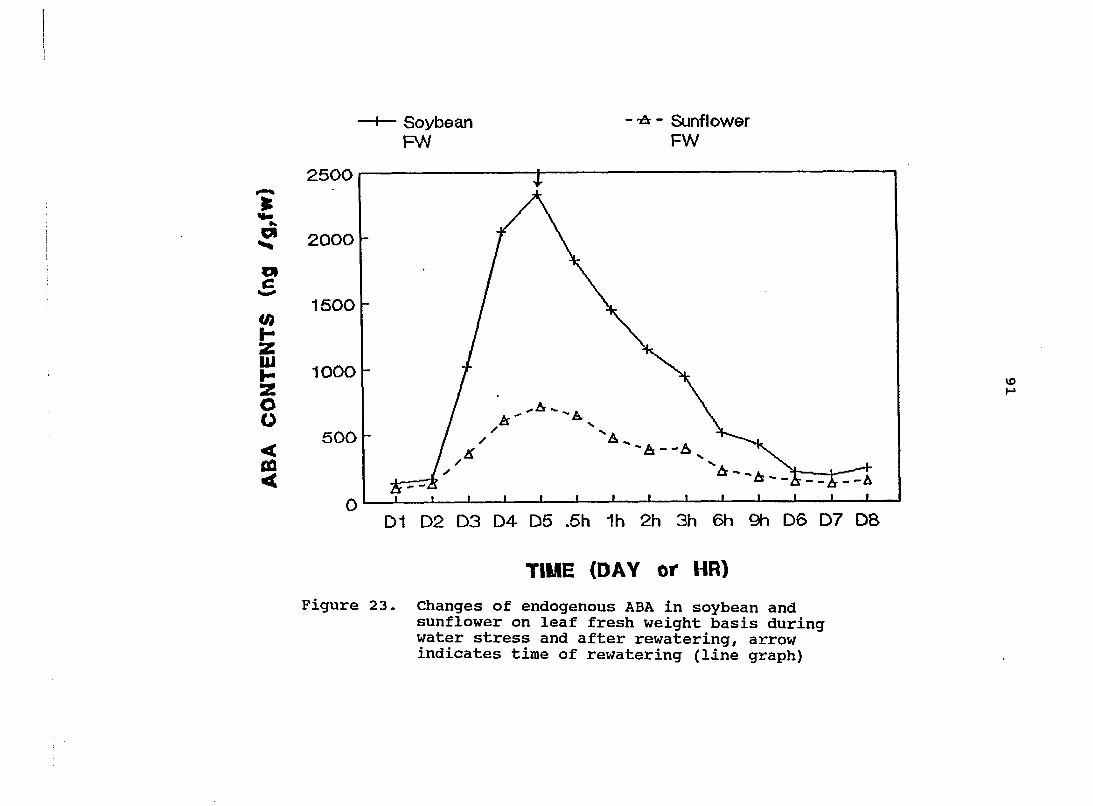
H— Soybean FW
Sunflower FW
Hm
OI
m c
Ui H Z lU H 2 O O
< OÛ <
2500
2000
1500 -
1000 -
500 -
vo H
D1 D2 D3 D4 D5 .5h ih 2h 3h 6h 9h D6 D7 D8
TIME (DAY or HR)
Figure 23. Changes of endogenous ABA in soybean and sunflower on leaf fresh weight basis during water stress and after rewatering, arrow indicates time of rewatering (line graph)
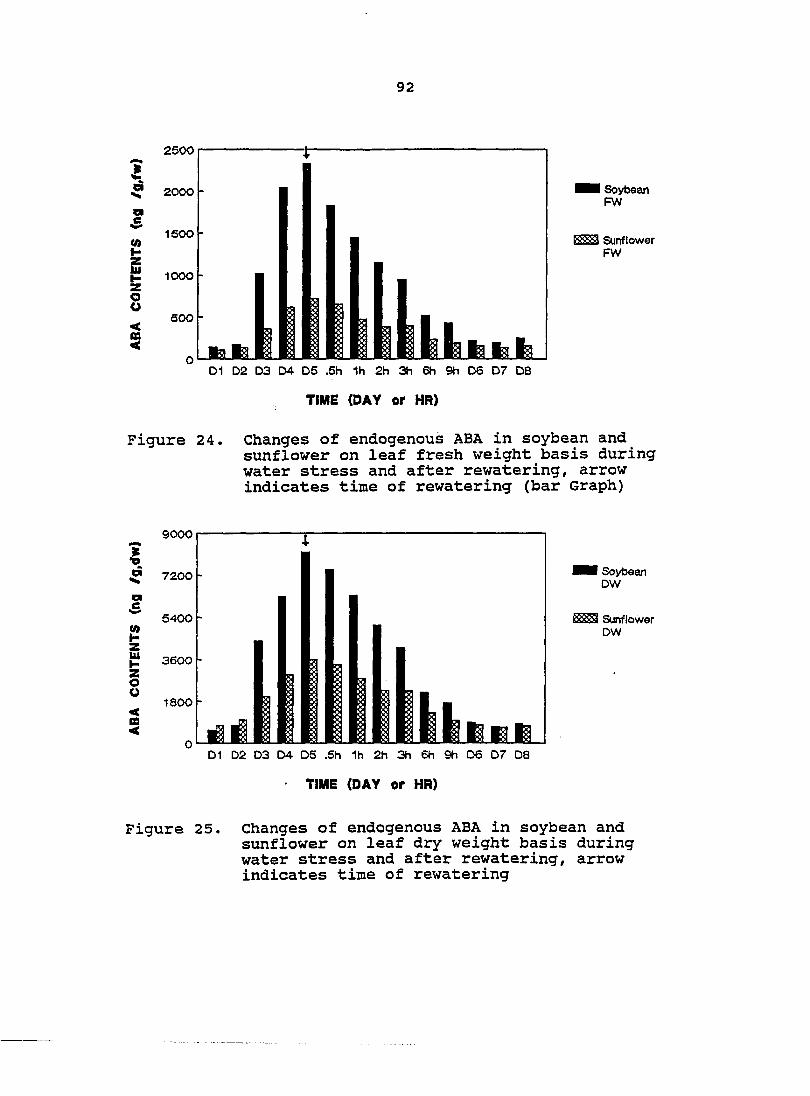
92
1500
1000
I Soybean FW
Sunflower FW
D1 D2 D3 04 D5 .5h 1h 2h 3h 6h 9h D6 D7 D8
TIME (DAY or HR)
Figure 24. Changes of endogenous ABA in soybean and sunflower on leaf fresh weight basis during water stress and after rewatering, arrow indicates time of rewatering (bar Graph)
9000
1800
I Soybean DW
Sunflower DW
D1 D2 D3 D4 D5 .5h 1h 2h 3h 6h 9h D6 D7 08
TIME (DAY or HR)
Figure 25. Changes of endogenous ABA in soybean and sunflower on leaf dry weight basis during water stress and after rewatering, arrow indicates time of rewatering
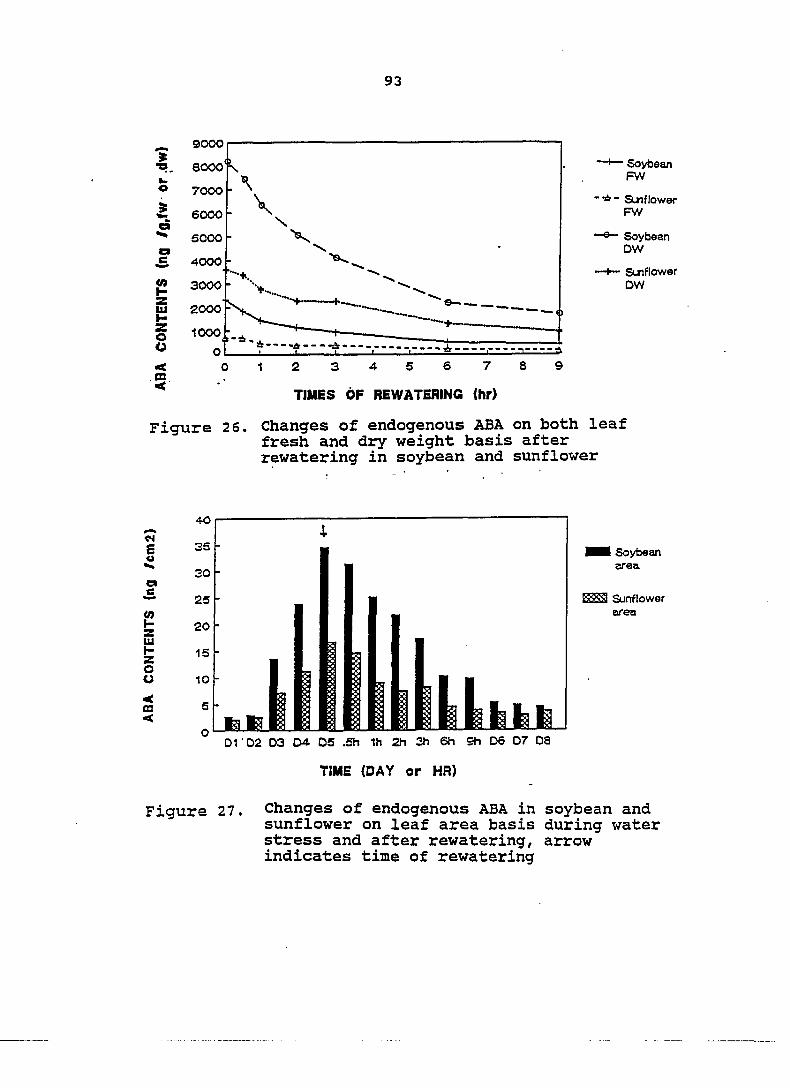
93
9C300
4. o
g s K-Z O o
5
8000
7000
6000
SOOO
4000
3000
2000
1000
O
. \
\ \ X
2 3 4 5 6 7
TIMES OF REWATERING ihr)
—I— Soybean FW
Suif lower FW
— S o y b e a n DW
— S u n f l o w e r DW
Figure 26. Changes of endogenous ABA on both leaf fresh and dry weight basis after rewatering in soybean and sunflower
S u
c* e
(2 S H z O o
< CO < Lki
Soybean area.
Sunflower area
O ^ D r D 2 0 3 D 4 . 0 5 . 5 h 1 h 2 h 2 h 6 h S h D G D 7 0 8
TIME (DAY or HA)
Figure 27 Changes of endogenous ABA in soybean and sunflower on leaf area basis during water stress and after rewatering, arrow indicates time of rewatering
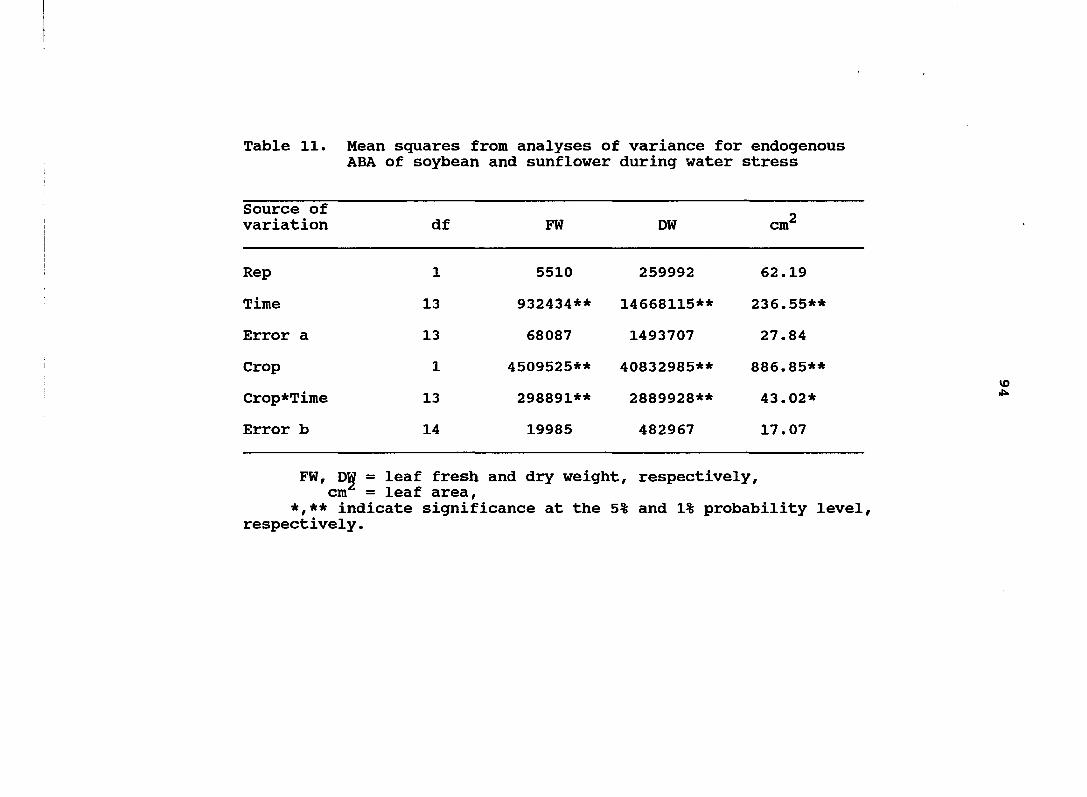
Table 11. Mean squares from analyses of variance for endogenous ABA of soybean and sunflower during water stress
Source of variation df FW DW cm^
Rep 1 5510 259992 62.19
Time 13 932434** 14668115** 236.55**
Error a 13 68087 1493707 27.84
Crop 1 4509525** 40832985** 886.85**
Crop*Time 13 298891** 2889928** 43.02*
Error b 14 19985 482967 17.07
FW, DW = leaf fresh and dry weight, respectively, cm = leaf area,
*,** indicate significance at the 5% and 1% probability level, respectively.
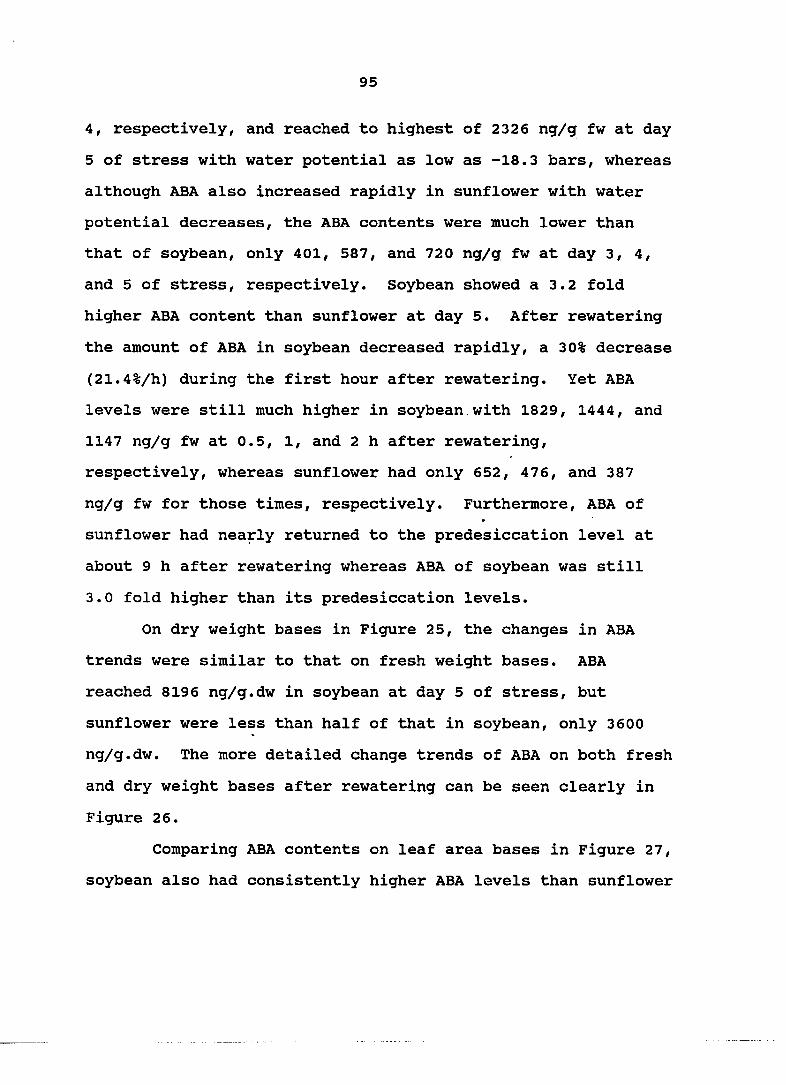
95
4, respectively, and reached to highest of 2326 ng/g fw at day
5 of stress with water potential as low as -18.3 bars, whereas
although ABA also increased rapidly in sunflower with water
potential decreases, the ABA contents were much lower than
that of soybean, only 401, 587, and 720 ng/g fw at day 3, 4,
and 5 of stress, respectively. Soybean showed a 3.2 fold
higher ABA content than sunflower at day 5. After rewatering
the amount of ABA in soybean decreased rapidly, a 30% decrease
(21.4%/h) during the first hour after rewatering. Yet ABA
levels were still much higher in soybean with 1829, 1444, and
1147 ng/g fw at 0.5, 1, and 2 h after rewatering,
respectively, whereas sunflower had only 652, 476, and 387
ng/g fw for those times, respectively. Furthermore, ABA of
sunflower had nearly returned to the predesiccation level at
about 9 h after rewatering whereas ABA of soybean was still
3.0 fold higher than its predesiccation levels.
On dry weight bases in Figure 25, the changes in ABA
trends were similar to that on fresh weight bases. ABA
reached 8196 ng/g.dw in soybean at day 5 of stress, but
sunflower were less than half of that in soybean, only 3600
ng/g.dw. The more detailed change trends of ABA on both fresh
and dry weight bases after rewatering can be seen clearly in
Figure 26.
Comparing ABA contents on leaf area bases in Figure 27,
soybean also had consistently higher ABA levels than sunflower
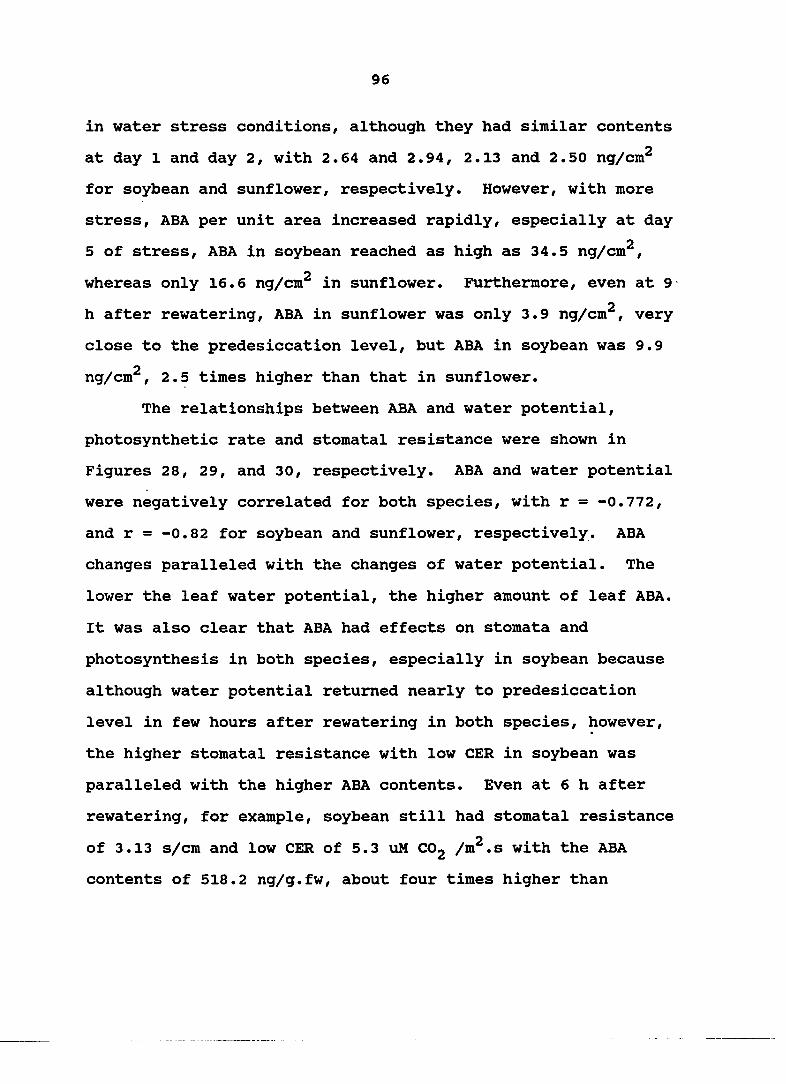
96
in water stress conditions, although they had similar contents
at day 1 and day 2, with 2.64 and 2.94, 2.13 and 2.50 ng/cm^
for soybean and sunflower, respectively. However, with more
stress, ABA per unit area increased rapidly, especially at day
5 of stress, ABA in soybean reached as high as 34.5 ng/cm^,
whereas only 16.6 ng/cm^ in sunflower. Furthermore, even at 9
h after rewatering, ABA in sunflower was only 3.9 ng/cm^, very
close to the predesiccation level, but ABA in soybean was 9.9
ng/cm^, 2.5 times higher than that in sunflower.
The relationships between ABA and water potential,
photosynthetic rate and stomata1 resistance were shown in
Figures 28, 29, and 30, respectively. ABA and water potential
were negatively correlated for both species, with r = -0.772,
and r = -0.82 for soybean and sunflower, respectively. ABA
changes paralleled with the changes of water potential. The
lower the leaf water potential, the higher amount of leaf ABA.
It was also clear that ABA had effects on stomata and
photosynthesis in both species, especially in soybean because
although water potential returned nearly to predesiccation
level in few hours after rewatering in both species, however,
the higher stomata1 resistance with low CER in soybean was
paralleled with the higher ABA contents. Even at 6 h after
rewatering, for example, soybean still had stomatal resistance
of 3.13 s/cm and low CER of 5.3 uM COg /m^.s with the ABA
contents of 518.2 ng/g.fw, about four times higher than
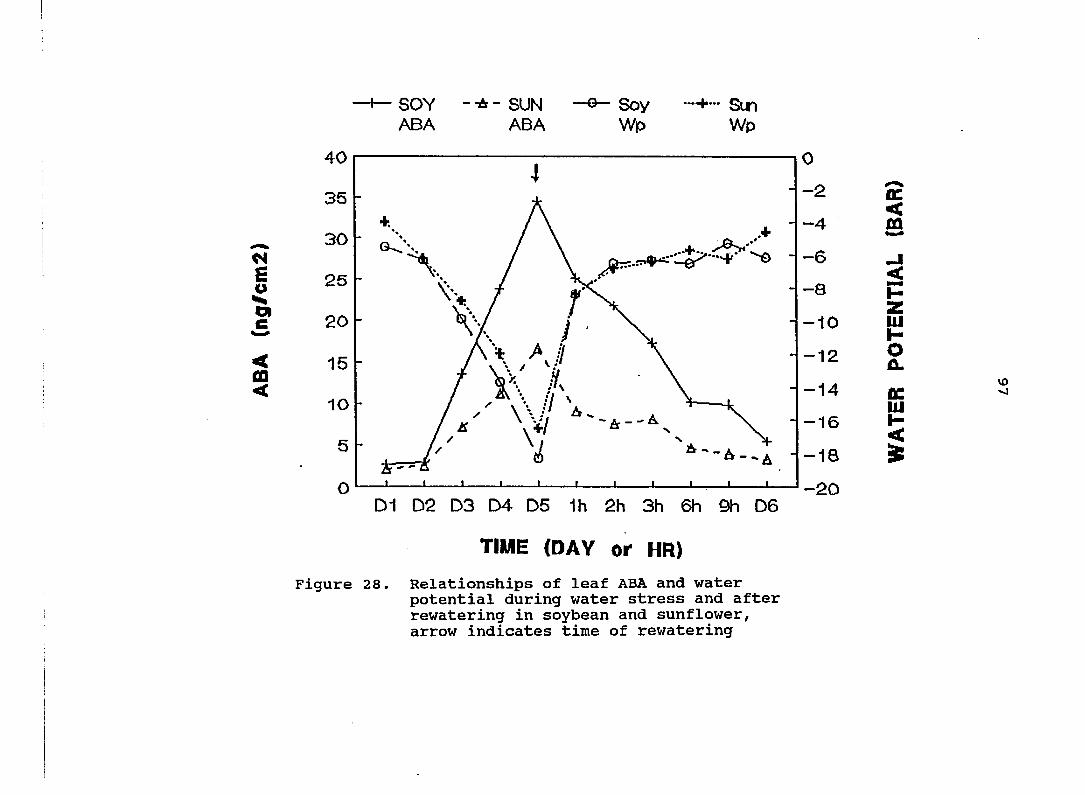
+— SOY --A- SUN ABA ABA
Soy —*" Sun Wp Wp
<4 E o
< m <
40
35
30
25
20
15
10
5
O
4
r
"Èr
D1 D2 D3 D4 D5 1h 2h 3h 6h 9h D6
Figure 28.
TIME (DAY or HR)
Relationships of leaf ABA and water potential during water stress and after rewatering in soybean and sunflower, arrow indicates time of rewatering
O
-2
-4
—6
—6
-10
-12
-14
-16
-18
-20
EC < m
lU I-o CL
tc UJ #-< *
VO «0
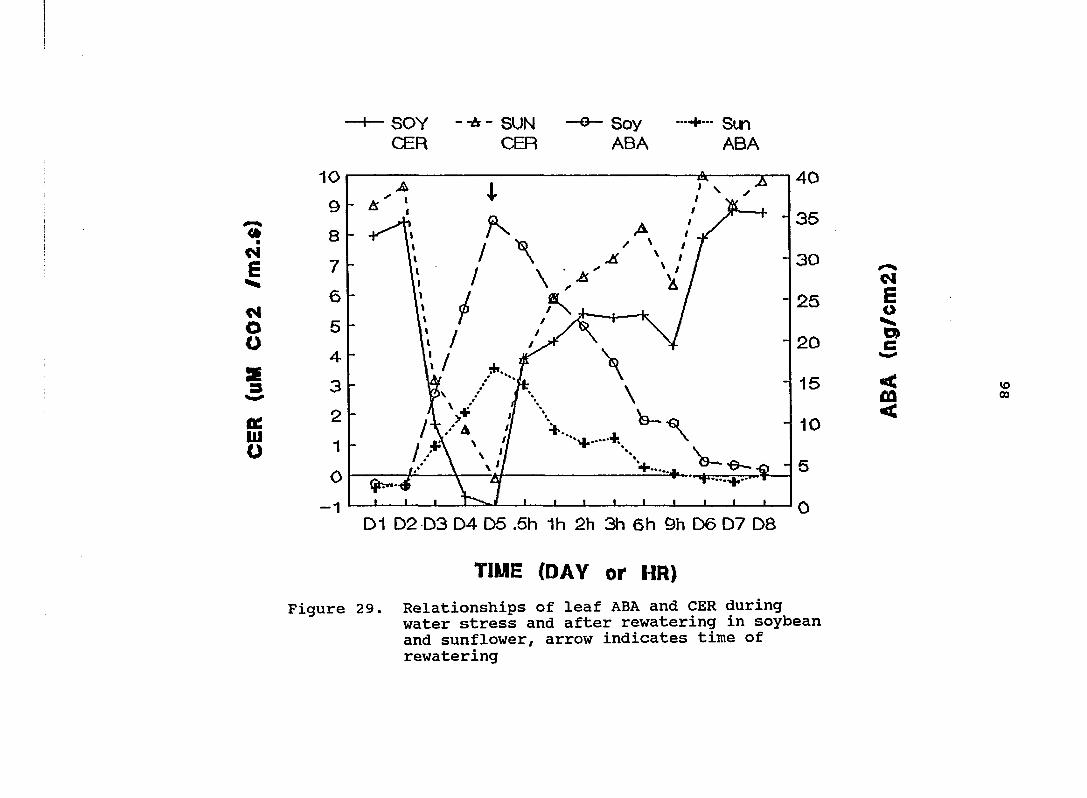
+- SOY - -A - SUN CER CER
Soy —•+— Sun ABA ABA
•
M E
c o
lU o
\
d E o V>
< CÛ < u> 00
D1 D2 D3 D4 D5 .6h 1h 2h 3h 6h 9h D6 D7 D8
TIME (DAY or HR)
Figure 29. Relationships of leaf ABA and CER during water stress and after rewatering in soybean and sunflower, arrow indicates time of rewatering
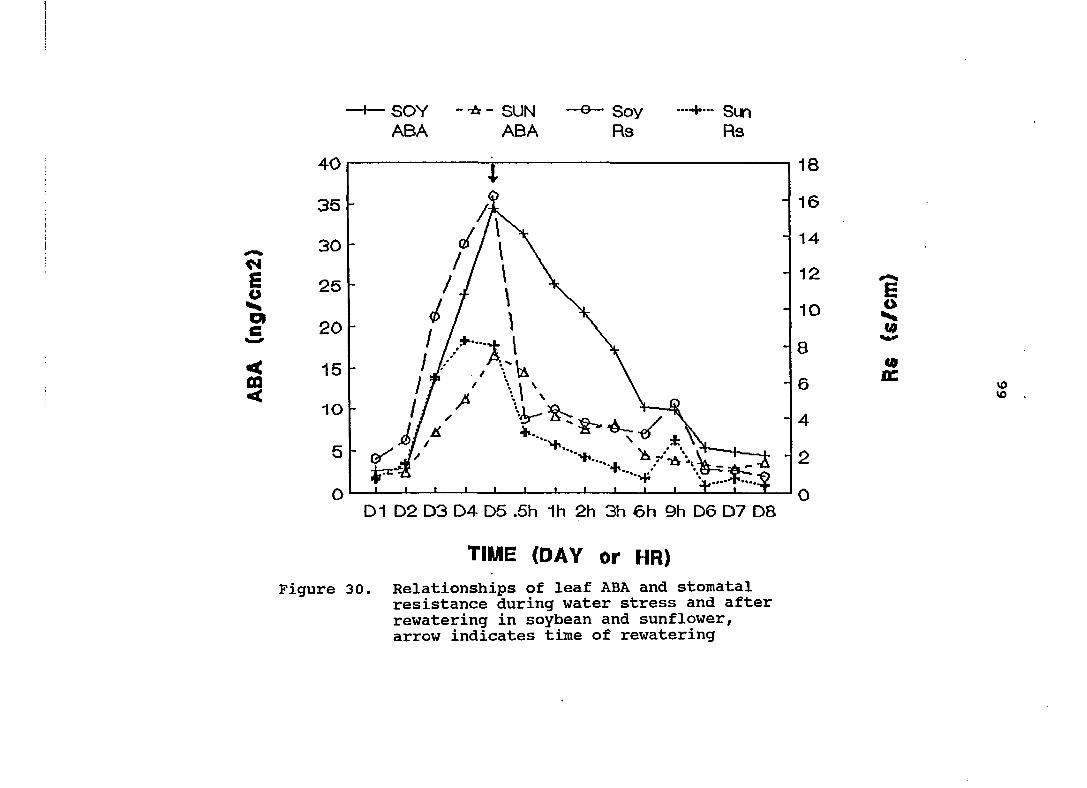
4— SOY - - SUN ABA ABA
Soy Rs
Sun Rs
E o o# c
< m <
4 E o
w
w DC vo
vo
D1 D2 D3 D4 D5 .5h 1h 2h 3h 6h 9h D6 D7 DB
TIME (DAY or HR)
Figure 30. Relationships of leaf ABA and stomatal resistance during water stress and after rewatering in soybean and sunflower, arrow indicates time of rewatering
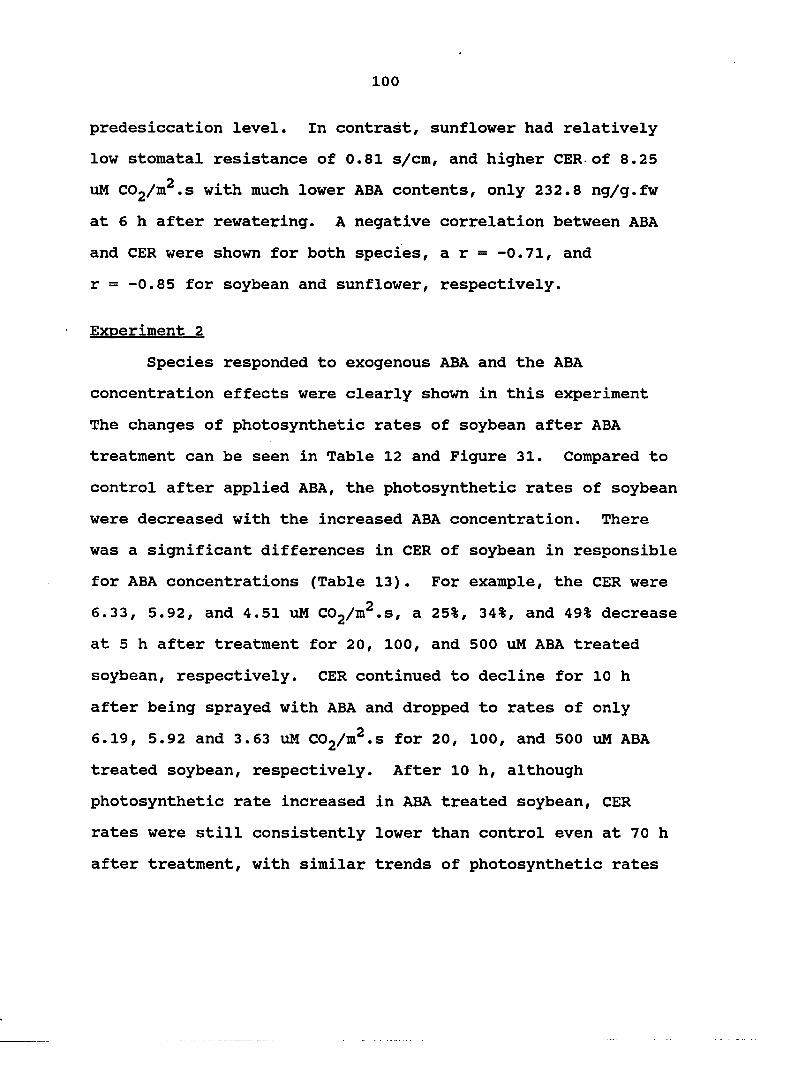
100
predesiccation level. In contrast, sunflower had relatively
low stomatal resistance of 0.81 s/cm, and higher CER of 8.25
uM COj/m^.s with much lower ABA contents, only 232.8 ng/g.fw
at 6 h after rewatering. A negative correlation between ABA
and CER were shown for both species, a r = -0.71, and
r = -0.85 for soybean and sunflower, respectively.
Experiment 2
Species responded to exogenous ABA and the ABA
concentration effects were clearly shown in this experiment
The changes of photosynthetic rates of soybean after ABA
treatment can be seen in Table 12 and Figure 31. Compared to
control after applied ABA, the photosynthetic rates of soybean
were decreased with the increased ABA concentration. There
was a significant differences in CER of soybean in responsible
for ABA concentrations (Table 13). For example, the CER were
6.33, 5.92, and 4.51 uM COg/m^.s, a 25%, 34%, and 49% decrease
at 5 h after treatment for 20, 100, and 500 uM ABA treated
soybean, respectively. CER continued to decline for 10 h
after being sprayed with ABA and dropped to rates of only
6.19, 5.92 and 3.63 uM COg/m^.s for 20, 100, and 500 uM ABA
treated soybean, respectively. After 10 h, although
photosynthetic rate increased in ABA treated soybean, CER
rates were still consistently lower than control even at 70 h
after treatment, with similar trends of photosynthetic rates
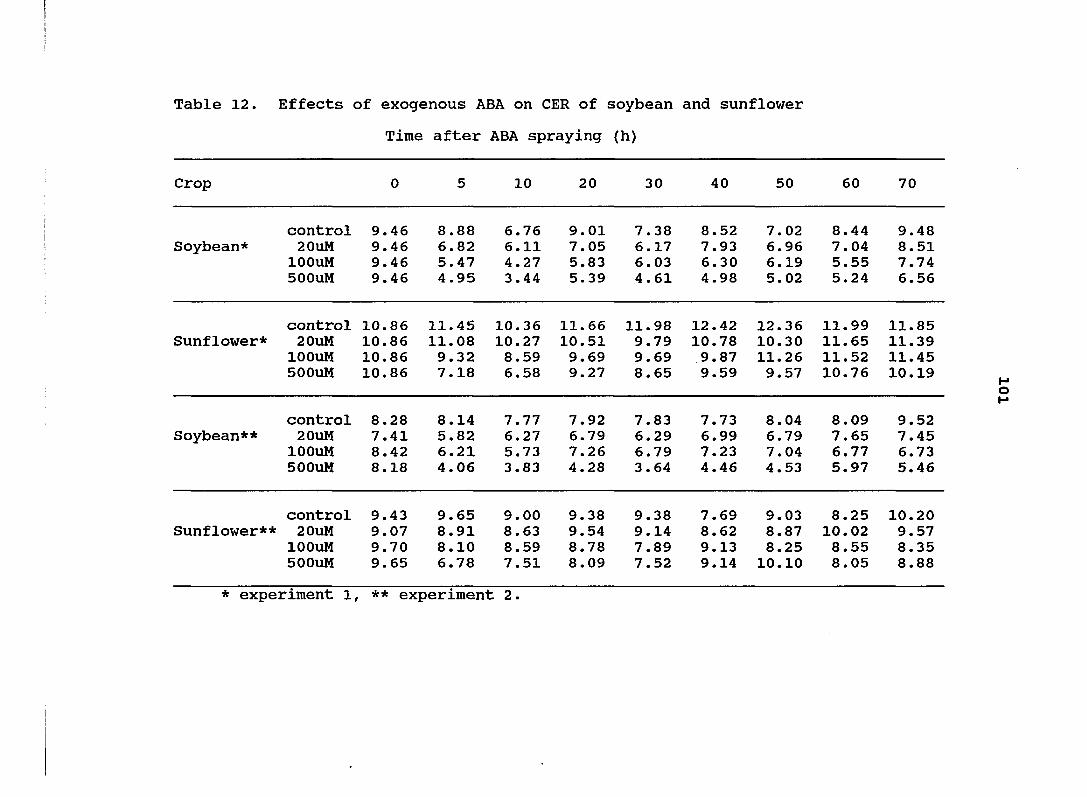
Table 12. Effects of exogenous ABA on CER of soybean and sunflower
Time after ABA spraying (h)
Crop 10 20 30 40 50 60 70
control 9.46 8.88 6.76 9.01 7.38 8.52 7.02 8.44 9.48 Soybean* 20uM 9.46 6.82 6.11 7.05 6.17 7.93 6.96 7.04 8.51
lOOuM 9.46 5.47 4.27 5.83 6.03 6.30 6.19 5.55 7.74 500UM 9.46 4.95 3.44 5.39 4.61 4.98 5.02 5.24 6.56
Sunflower* control 10.86 11.45 10.36 11.66 11.98 12.42 12.36 20uM 10.86 11.08 10.27 10.51 9.79 10.78 10.30
lOOuM 10.86 9.32 8.59 9.69 9.69 9.87 11.26 500UM 10.86 7.18 6.58 9.27 8.65 9.59 9.57
11.99 11.85 11.65 11.39 11.52 11.45 10.76 10.19
control 8.28 8.14 7.77 7.92 7.83 7.73 8.04 8.09 9.52 Soybean** 20uM 7.41 5.82 6.27 6.79 6.29 6.99 6.79 7.65 7.45
lOOuM 8.42 6.21 5.73 7.26 6.79 7.23 7.04 6.77 6.73 500UM 8.18 4.06 3.83 4.28 3.64 4.46 4.53 5.97 5.46
H o h
control 9.43 9.65 9.00 9.38 9.38 7.69 9.03 8.25 10.20 Sunflower** 20uM 9.07 8.91 8.63 9.54 9.14 8.62 8.87 10.02 9.57
lOOuM 9.70 8.10 8.59 8.78 7.89 9.13 8.25 8.55 8.35 500UM 9.65 6.78 7.51 8.09 7.52 9.14 10.10 8.05 8.88
* experiment 1, ** experiment 2.
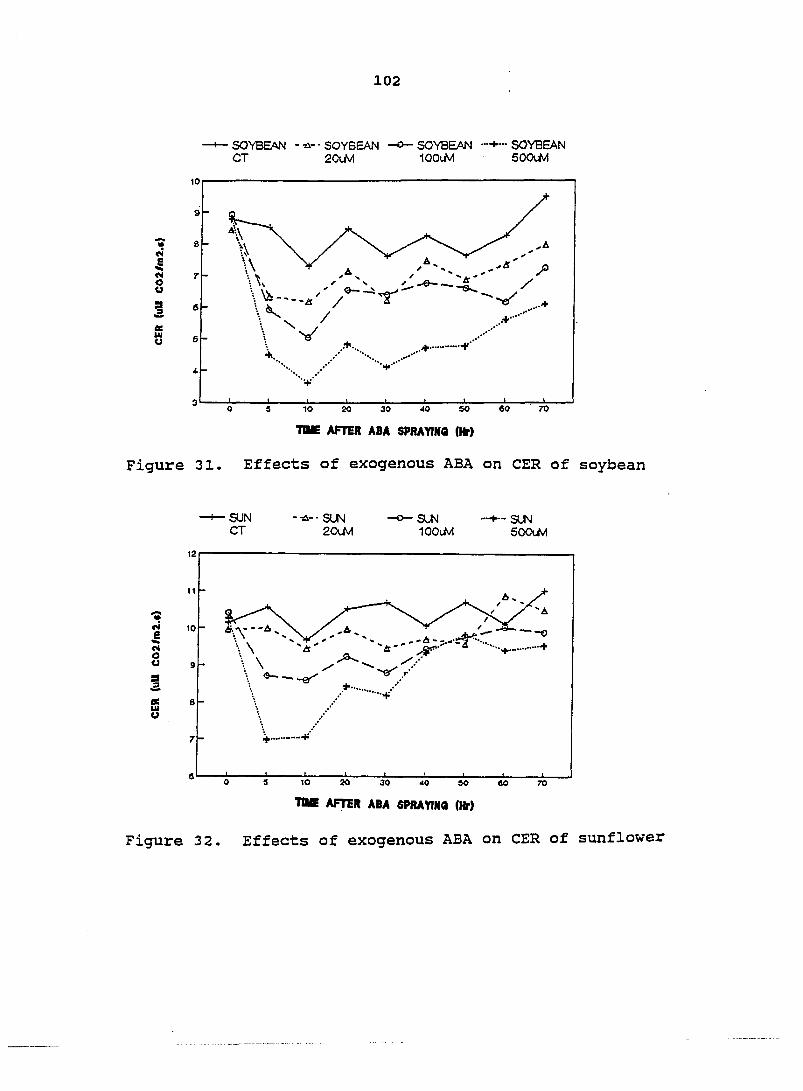
102
• SOYBEAN - ti- • SOYBEAN —0— SOYBEAN + - SOYBEAN CT 20Uv1 lOOiM 60<XM
«4 I <y 8
10 20 30 AO 50 «0 70
TDIE AFTER ABA SPRAYINQ (Hr)
Figure 31. Effects of exogenous ABA on CER of soybean
SUN CT
-•Û-- SUN 20UV1
SUN lOOiM
I— SUN SOOUvl
ti S I S
* / +
7 -
10 20 30 40 SO AO 70
tbie after aba sprayinâ (hp)
Figure 32. Effects of exogenous ABA on CER of sunflower
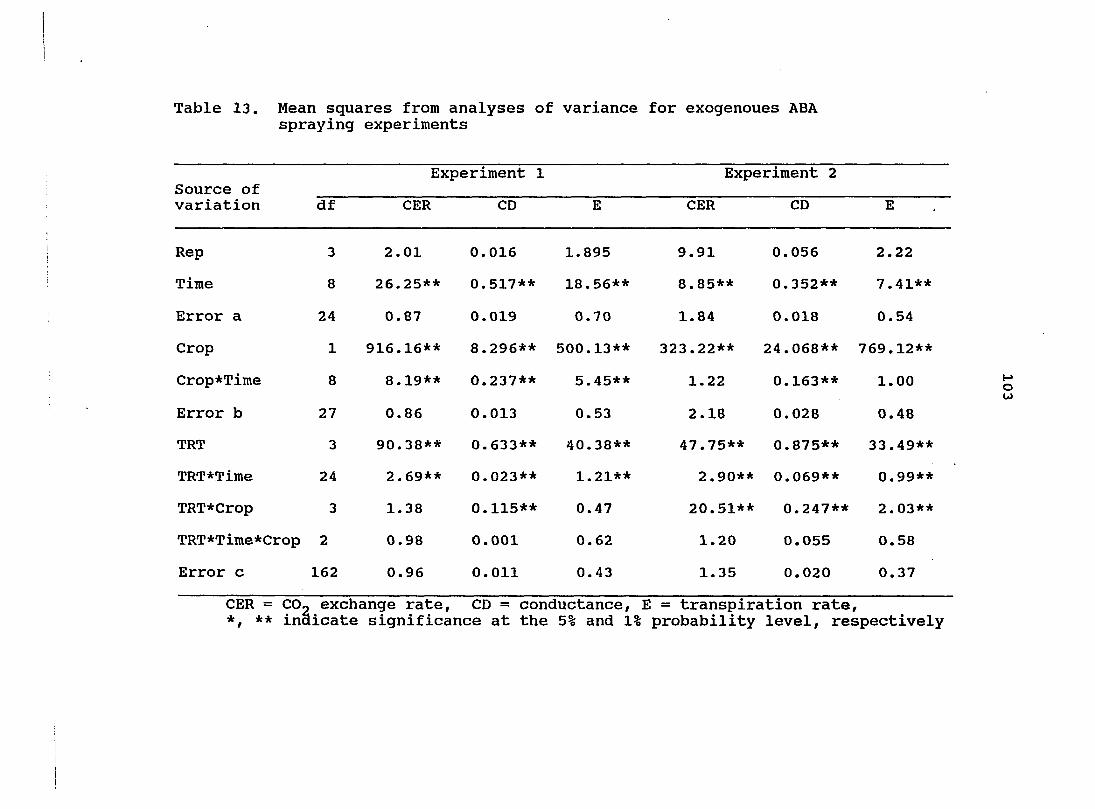
Table 13. Mean squares from analyses of variance for exogenoues ABA spraying experiments
Experiment 1 Experiment 2 Source of variation df CER CD E CER CD E
Rep 3 2. 01 0. 016 1.895 9 .91 0 .056 2. 22
Time 8 26. 25** 0. 517** 18 .56** 8 .85** 0 .352** 7. 41**
Error a 24 0. ,87 0. ,019 0 .70 1 .84 0 .018 0. 54
Crop 1 916. ,16** 8. ,296** 500 .13** 323 .22** 24 .068** 769. ,12**
Crop*Time 8 8. ,19** 0. ,237** 5 . 45** 1.22 0 .163** 1. ,00
Error b 27 0. .86 0. .013 0 .53 2.18 0 .028 0. .48
TRT 3 90. .38** 0. .633** 40 .38** 47.75** 0 .875** 33. .49**
TRT*Time 24 2, .69** 0. .023** 1 .21** 2.90** 0 .069** 0. .99**
TRT*Crop 3 1. .38 0. .115** 0 .47 20.51** 0.247** 2. .03**
TRT*Time*Crop 2 0 .98 0 .001 0 .62 1.20 0.055 0, .58
Error c 162 0 .96 0 .011 0 .43 1.35 0.020 0 .37
CER = CO, exchange rate, CD = conductance, E = transpiration rate, *, ** inaicate significance at the 5% and 1% probability level, respectively
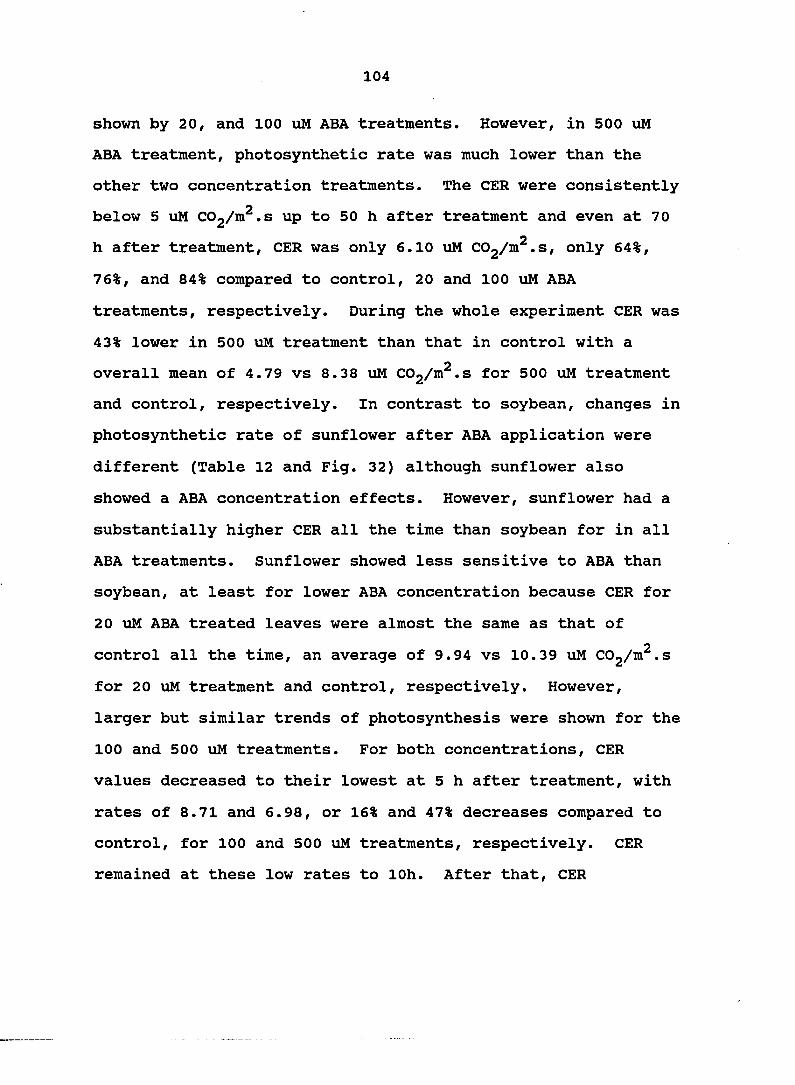
104
shown by 2 0 , and 100 xiM ABA treatments. However, in 500 uM
ABA treatment, photosynthetic rate was much lower than the
other two concentration treatments. The CER were consistently
below 5 uM COj/m^.s up to 50 h after treatment and even at 70
h after treatment, CER was only 6.10 uM COj/m^.s, only 64%,
76%, and 84% compared to control, 20 and 100 uM ABA
treatments, respectively. During the whole experiment CER was
43% lower in 500 uM treatment than that in control with a
overall mean of 4.79 vs 8.38 uM COg/m^.s for 500 uM treatment
and control, respectively. In contrast to soybean, changes in
photosynthetic rate of sunflower after ABA application were
different (Table 12 and Fig. 32) although sunflower also
showed a ABA concentration effects. However, sunflower had a
substantially higher CER all the time than soybean for in all
ABA treatments. Sunflower showed less sensitive to ABA than
soybean, at least for lower ABA concentration because CER for
20 uM ABA treated leaves were almost the same as that of
control all the time, an average of 9.94 vs 10.39 uM COg/m^.s
for 20 uM treatment and control, respectively. However,
larger but similar trends of photosynthesis were shown for the
100 and 500 uM treatments. For both concentrations, CER
values decreased to their lowest at 5 h after treatment, with
rates of 8.71 and 6.98, or 16% and 47% decreases compared to
control, for 100 and 500 uM treatments, respectively. CER
remained at these low rates to lOh. After that, CER
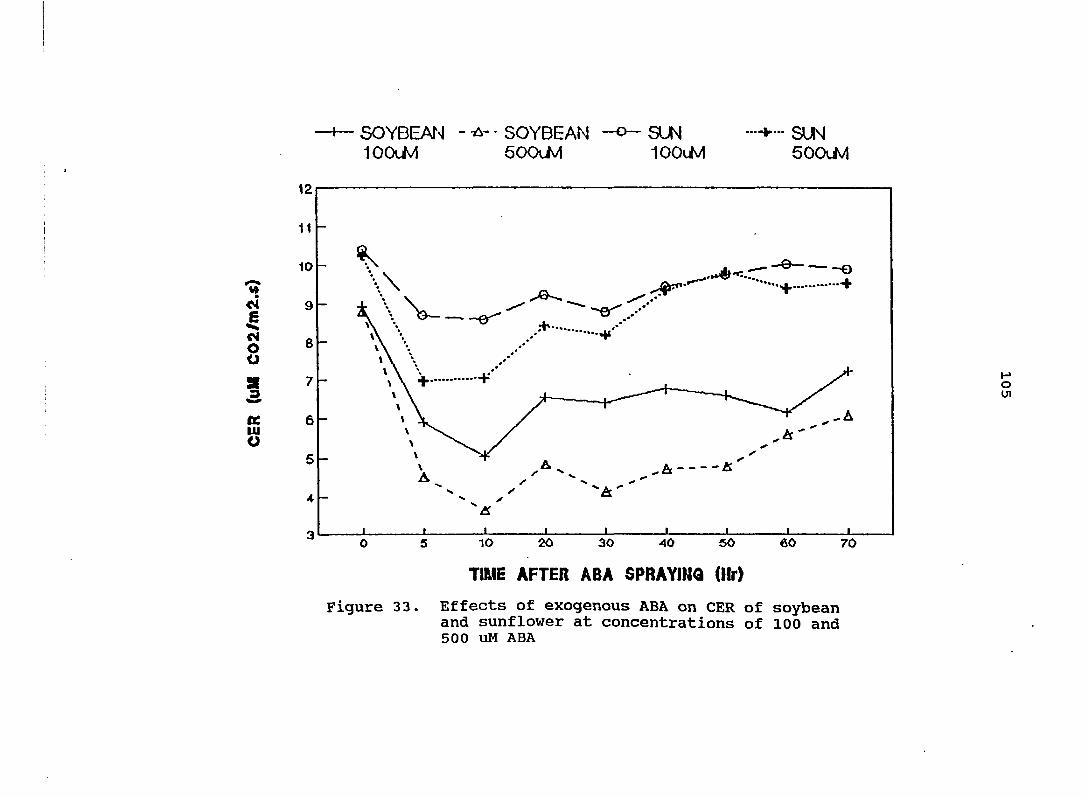
4— SOYBEAT - - SOYBEAN lOCXM 500iiv1
SUN SLN 100«Jvl GCXXivl
TIME AFTER ABA SPRAYING (llr)
Figure 33. Effects of exogenous ABA on CER of soybean and sunflower at concentrations of 100 and 500 uM ABA
106
recovered until after 40 h, CER had almost returned to control
level for both 100 and 500 uM treated sunflowers, with rates
of 9.45, 9.35, and 10.07 UM COj/m^.S for 100, 500 uM
treatments and control, respectively.
For comparisons of CER changes of the two species after
ABA treatment, it is clear in Figure 33 that for both 100 and
500 uM treatments, the CER values for sunflower had nearly
fully recovered 40 h after ABA had been applied, whereas
soybean had not returned to control level even 70 h after
treatment, especially for the 500 uM ABA treatment.
Similar to CER, leaf conductance also showed a different
trends between soybean and sunflower (Figs. 34 and 35). For
soybean, the significant concentration effects of ABA on
conductance were clearly shown in Figure 34 and Tables 13 and
14. The greater the concentration of ABA applied, the lower
the stomatal conductance which was accompanied with a lower
CER. For example, conductance decreased to 0.22, 0.16, and
0.14 cm/s at 5 h after treatment for 20, 100, and 500 uM
treatments, respectively, and remained at these low values
until 10 h after treatments. But after that, conductance of
20 uM treated gradually increased, which was accompanied with
CER recovery. However, with 500 uM ABA treatment, stomatal
conductance remained the low value of 0.14, 0.13, 0.13, 0.15,
and 0.12 cm/s at 5, 10, 20, 30, and 40 h after treatments,
respectively. Although the conductance increased after that.
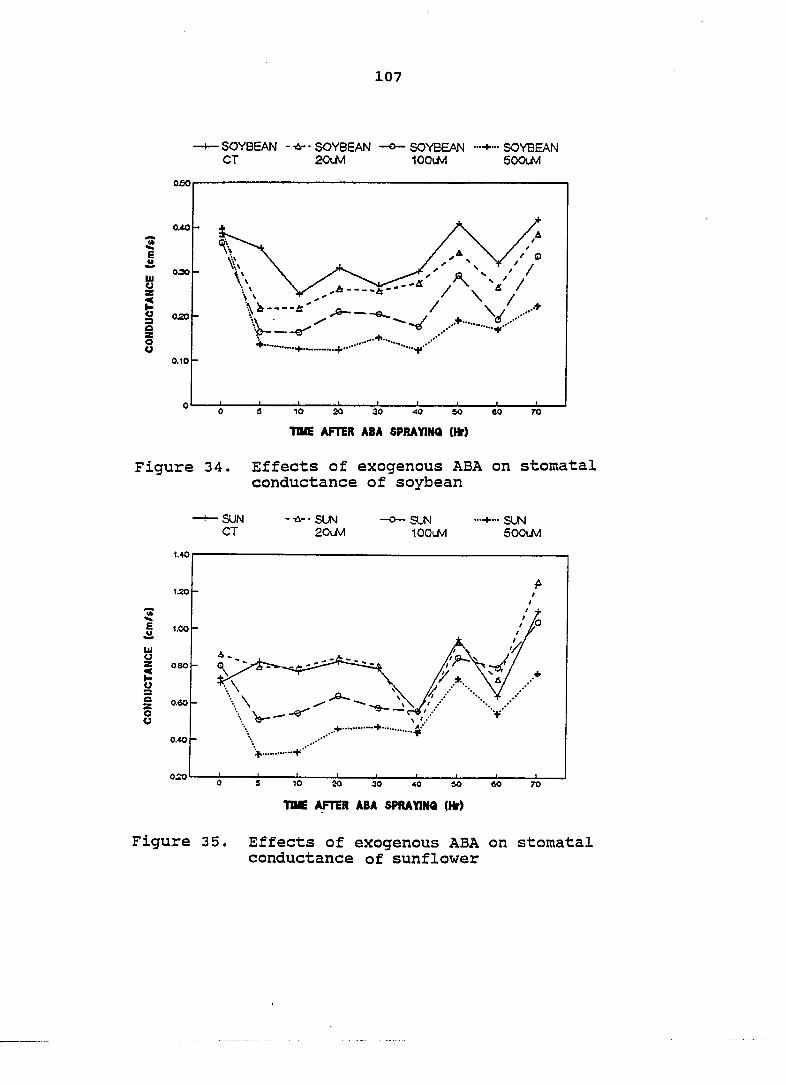
107
+—SOYBEAN SOYBEAN CT 20M
SOYBEAN •••+••• SOYBEAN 100UV) 60<XM
Figure 34. Effects of exogenous ABA on stomatal conductance of soybean
•Û- • SUM 2<XM
SUN 100uM
+ SUN 500UVI
Figure 35. Effects of exogenous ABA on stomatal conductance of sunflower
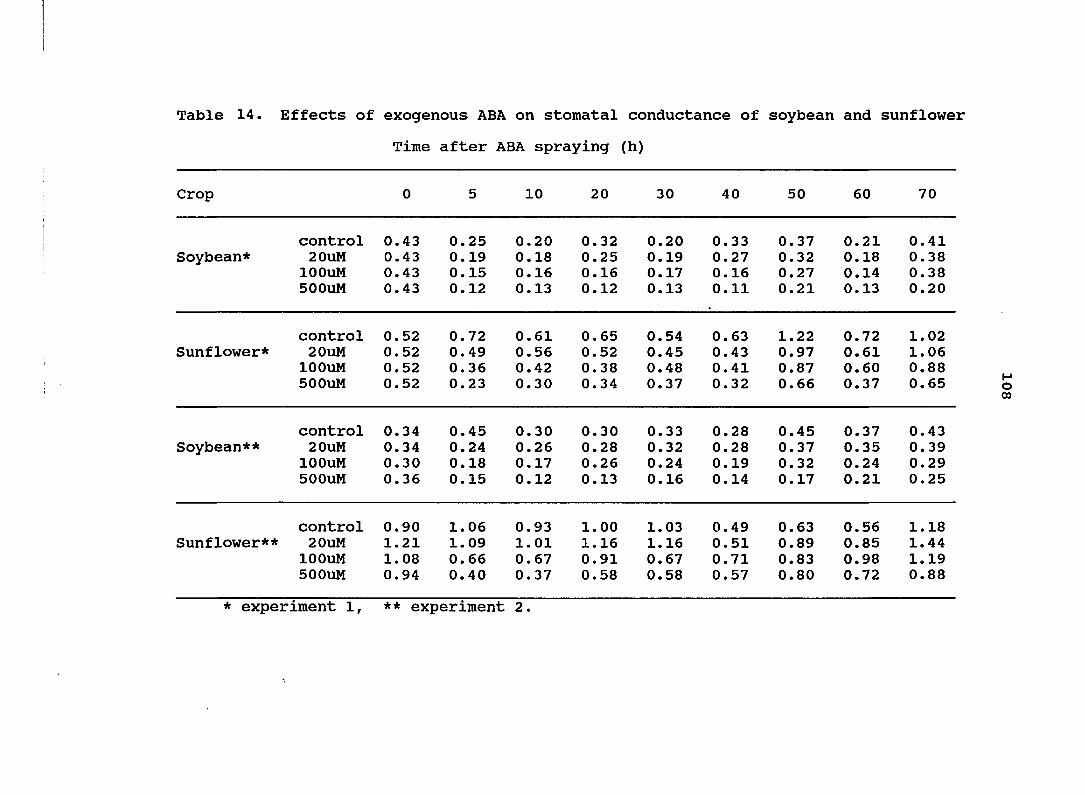
Table 14. Effects of exogenous ABA on stomatal conductance of soybean and sunflower
Time after ABA spraying (h)
Crop 0 5 10 20 30 40 50 60 70
control 0.43 0.25 0.20 0.32 0.20 0.33 0.37 0.21 0.41 Soybean* 20uM 0.43 0.19 0.18 0.25 0.19 0.27 0.32 0.18 0.38
lOOuM 0.43 0.15 0.16 0.16 0.17 0.16 0.27 0.14 0.38 500UM 0.43 0.12 0.13 0.12 0.13 0.11 0.21 0.13 0.20
control 0.52 0.72 0.61 0.65 0.54 0.63 1.22 0.72 1.02 Sunflower* 20uM 0.52 0.49 0.56 0.52 0.45 0.43 0.97 0.61 1.06
lOOuM 0.52 0.36 0.42 0.38 0.48 0.41 0.87 0.60 0.88 500UM 0.52 0.23 0.30 0.34 0.37 0.32 0.66 0.37 0.65
control 0.34 0.45 0.30 0.30 0.33 0.28 0.45 0.37 0.43 Soybean** 20uM 0.34 0.24 0.26 0.28 0.32 0.28 0.37 0.35 0.39
lOOuM 0.30 0.18 0.17 0.26 0.24 0.19 0.32 0.24 0.29 500UM 0.36 0.15 0.12 0.13 0.16 0.14 0.17 0.21 0.25
control 0.90 1.06 0.93 1.00 1.03 0.49 0.63 0.56 1.18 Sunflower** 20uM 1.21 1.09 1.01 1.16 1.16 0.51 0.89 0.85 1.44
lOOuM 1.08 0.66 0.67 0.91 0.67 0.71 0.83 0.98 1.19 500UM 0.94 0.40 0.37 0.58 0.58 0.57 0.80 0.72 0.88
* experiment 1, ** experiment 2.
109
it did not return to control level, even at 70 h after
treatment. On the other hand, for sunflower in Figure 35,
stomatal effects by ABA were not as strong as soybean,
especially at low ABA concentration because the conductance
showed a similar values between control and 20 uM ABA
treatment at all the times (Fig. 35). However, the
significant ABA concentration effects were also in sunflower
(Table 13). For the higher ABA concentration treatments,
conductances were decreased. At 5 h after treatment, for
example, stomatal conductance dropped to 0.59 and 0.32 cm/s,
or 26% and 56% decreases compared to before treatment, for 100
and 500 uM ABA treatments, respectively. But, conductance
increased gradually after 10 h and returned close to the
control level for sunflower leaves treated with both
concentrations of ABA. The changes in stomatal conductance
correspond well to the changes of CER.
For comparing the 100 and 500 uM ABA treated leaves,
sunflower had consistently higher stomatal conductance than
that of soybean in all concentrations (Fig. 36). Although
both soybean and sunflower showed concentration effects of
ABA, stomatal conductance of sunflower increased close to the
control level after 40 h treatment, whereas stomatal
conductance of soybean did not increase very much even at 70 h
after treatment.
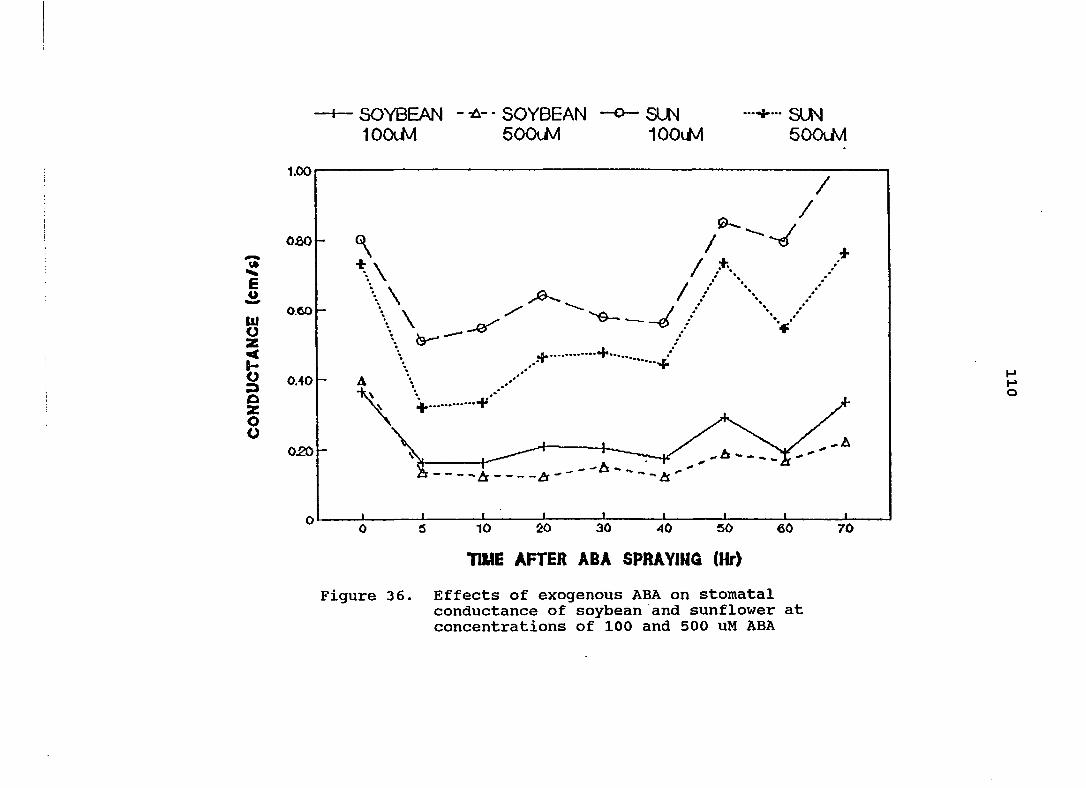
1 o z < k 3 O Z o o
4—SOYBEAN -^--SOYBEAN lOOtM 50(XM
1.00
O&Q -
0.60 —
0.40 -
020 -
SUN 1000 /1
+ SLN
500Jv1
w \ \ \ \
0
•••+
/ /
H H O
10 20 30 40 50 60
TIME AFTER ABA SPRAYING (Hr)
70
Figure 36. Effects of exogenous ABA on stomatal conductance of soybean and sunflower at concentrations of 100 and 500 uM ABA
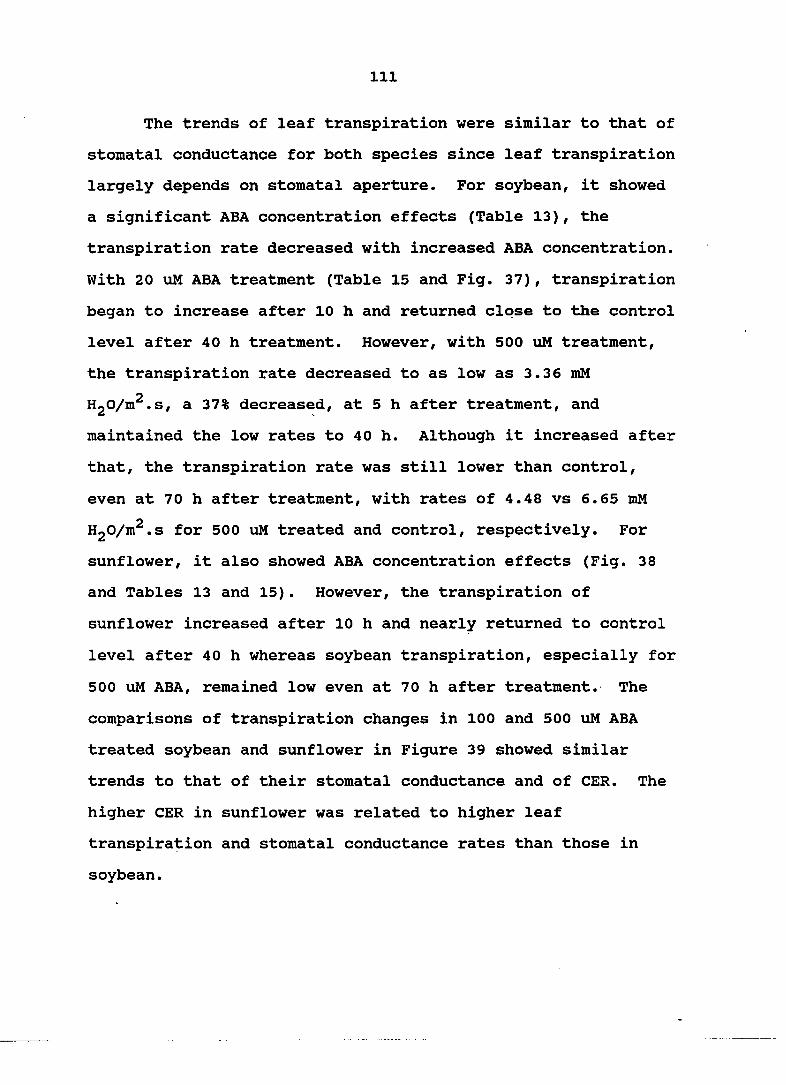
Ill
The trends of leaf transpiration were similar to that of
stomatal conductance for both species since leaf transpiration
largely depends on stomatal aperture. For soybean, it showed
a significant ABA concentration effects (Table 13), the
transpiration rate decreased with increased ABA concentration.
With 20 uM ABA treatment (Table 15 and Fig. 37), transpiration
began to increase after 10 h and returned close to the control
level after 40 h treatment. However, with 500 uM treatment,
the transpiration rate decreased to as low as 3.36 mM
HgO/m^.s, a 37% decreased, at 5 h after treatment, and
maintained the low rates to 40 h. Although it increased after
that, the transpiration rate was still lower than control,
even at 70 h after treatment, with rates of 4.48 vs 6.65 mM
HgO/m^.s for 500 uM treated and control, respectively. For
sunflower, it also showed ABA concentration effects (Fig. 38
and Tables 13 and 15). However, the transpiration of
sunflower increased after 10 h and nearly returned to control
level after 40 h whereas soybean transpiration, especially for
500 uM ABA, remained low even at 70 h after treatment. The
comparisons of transpiration changes in 100 and 500 uM ABA
treated soybean and sunflower in Figure 39 showed similar
trends to that of their stomatal conductance and of CER. The
higher CER in sunflower was related to higher leaf
transpiration and stomatal conductance rates than those in
soybean.
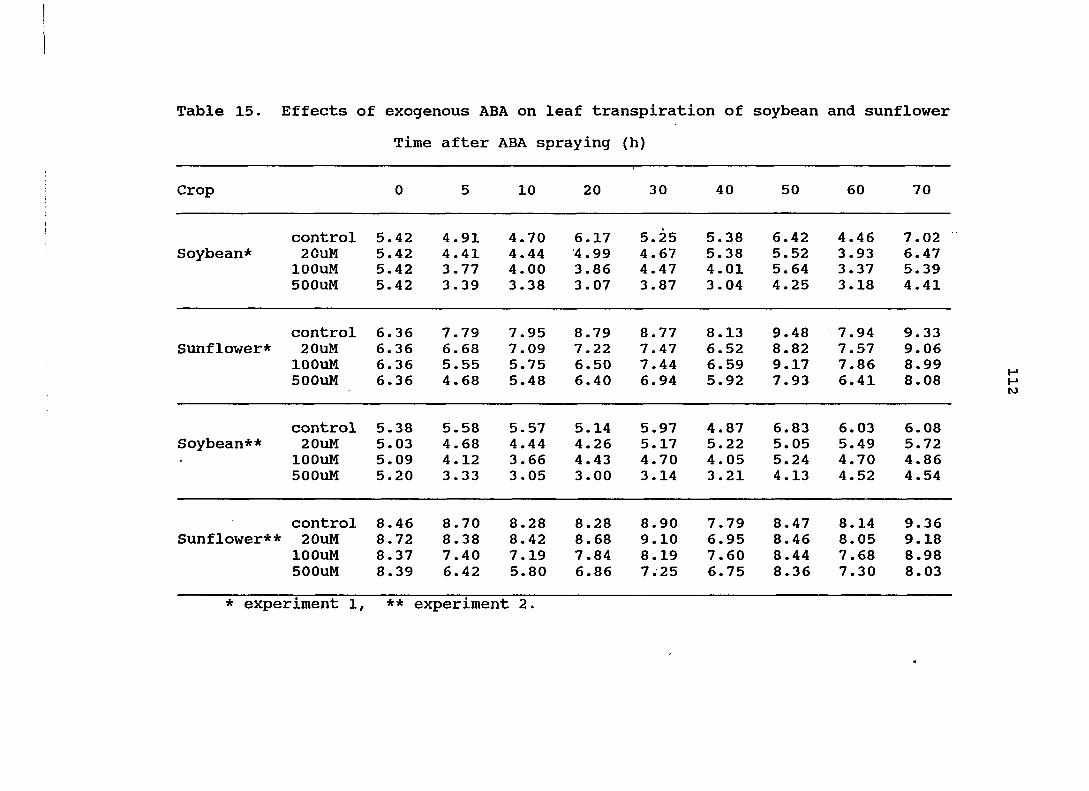
Table 15. Effects of exogenous ABA on leaf transpiration of soybean and sunflower
Time after ABA spraying (h)
Crop 0 5 10 20 30 40 50 60 70
control 5.42 4.91 4.70 6.17 5.25 5.38 6.42 4.46 7.02 Soybean* 20uM 5.42 4.41 4.44 4.99 4.67 5.38 5.52 3.93 6.47
lOOuM 5.42 3.77 4.00 3.86 4.47 4.01 5.64 3.37 5.39 500UM 5.42 3.39 3.38 3.07 3.87 3.04 4.25 3.18 4.41
control 6.36 7.79 7.95 8.79 8.77 8.13 9.48 7.94 9.33 Sunflower* 20uM 6.36 6.68 7.09 7.22 7.47 6.52 8.82 7.57 9.06
lOOuM 6.36 5.55 5.75 6.50 7.44 6.59 9.17 7.86 8.99 500UM 6.36 4.68 5.48 6.40 6.94 5.92 7.93 6.41 8.08
control 5.38 5.58 5.57 5.14 5.97 4.87 6.83 6.03 6.08 Soybean** 20uM 5.03 4.68 4.44 4.26 5.17 5.22 5.05 5.49 5.72
lOOuM 5.09 4.12 3.66 4.43 4.70 4.05 5.24 4.70 4.86 SOOuM 5.20 3.33 3.05 3.00 3.14 3.21 4.13 4.52 4.54
control 8.46 8.70 8.28 8.28 8.90 7.79 8.47 8.14 9.36 Sunflower** 20uM 8.72 8.38 8.42 8.68 9.10 6.95 8.46 8.05 9.18
lOOuM 8.37 7.40 7.19 7.84 8.19 7.60 8.44 7.68 8.98 500uM 8.39 6.42 5.80 6.86 7.25 6.75 8.36 7.30 8.03
* experiment 1, ** experiment 2.
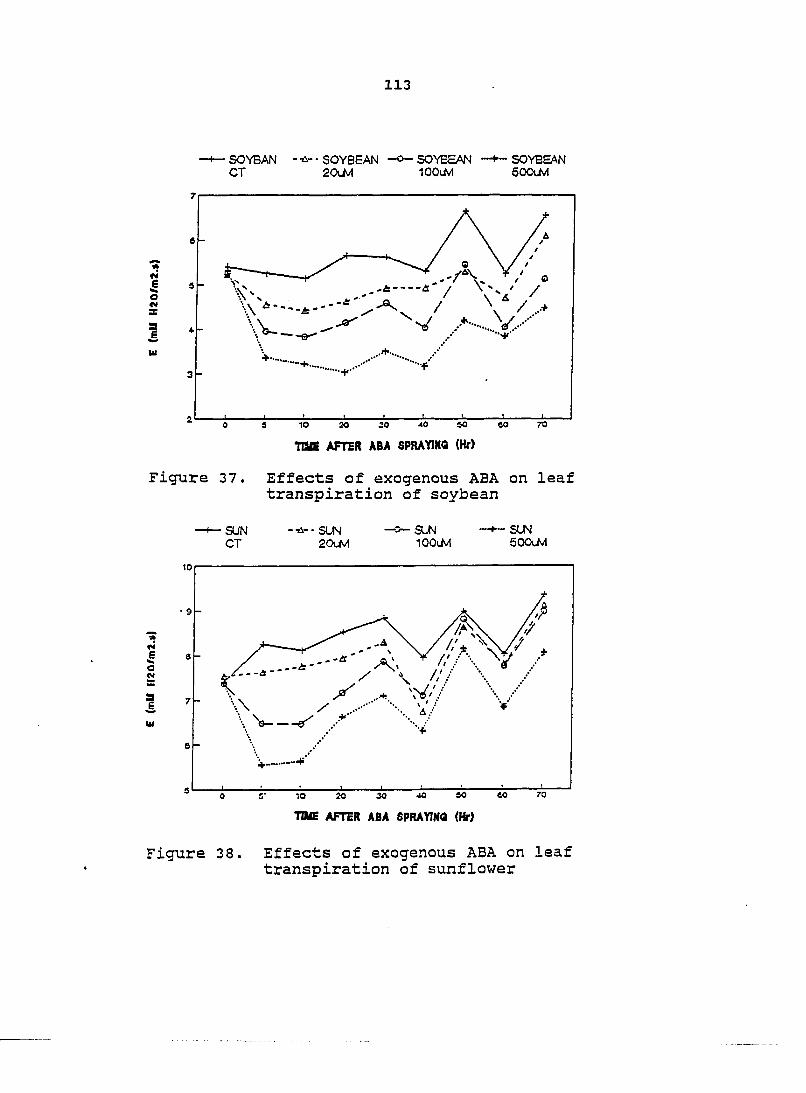
113
SOYBAN -11--SOYBEAN -o-SOYBEAN --«—SOYBEAN CT 20M IOO1M 60<XM
I t4 S
é Ut
'•+
Figure 37,
s 10 20 30 40 so «0 70
TBE AFTER ABA SPRAYING (Hr)
Effects of exogenous ABA on leaf transpiration of soybean
I O
1 u
•SUN CT
- -6- ' SLN 20UV1
9JN lOOJvl
k- SLN SOOJvl
ior
' 9 -
7 -
0 -
' '
S* 10 20 30 JO 50 «O 70
TIME AFTER ABA SPRAYINO (Hr)
Figure 38. Effects of exogenous ABA on leaf transpiration of sunflower
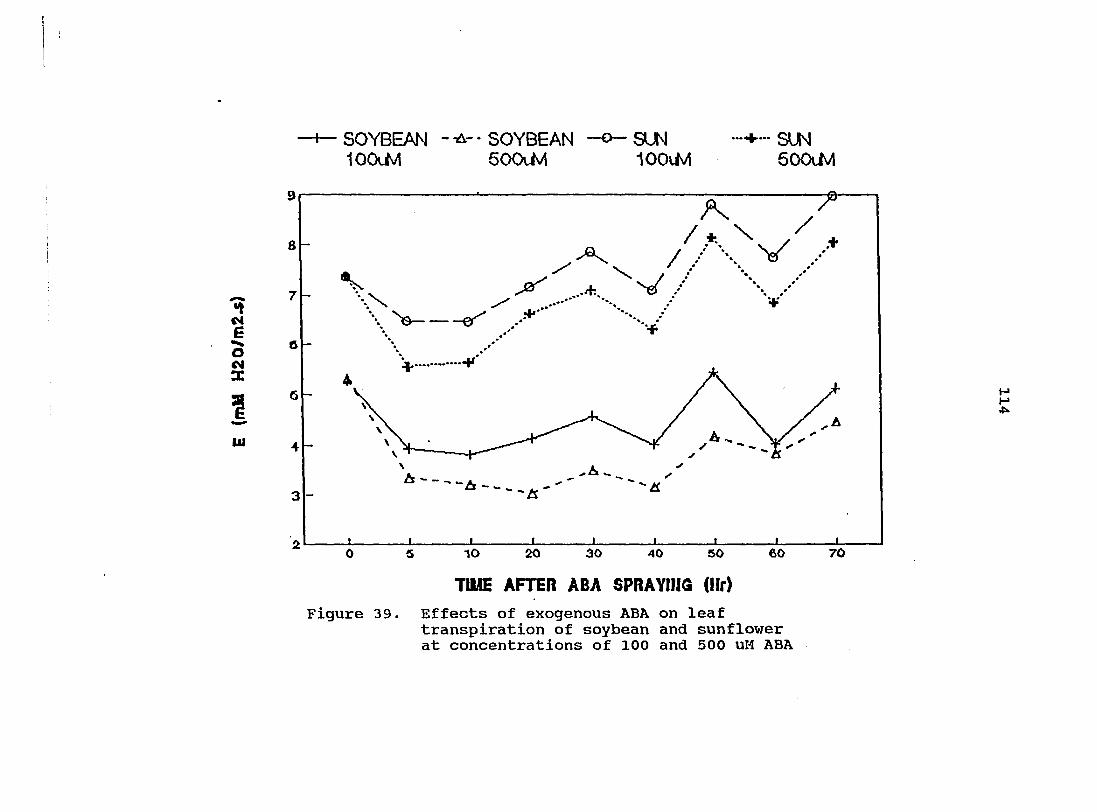
4— SOYBEAN - • SOYBEAN -o- SUN + SUN 10(XM 600Uv1 IOO1M SOOUVI
4 CM E o w
III
o -
5 —
V / •+*
+
3 -
H H
10 20 30 40 50 60
TIME AFTER ABA SPRAYIIIG (llr)
Figure 39, Effects of exogenous ABA on leaf transpiration of soybean and sunflower at concentrations of 100 and 500 uM ABA
70
115
Discussion
Water stress induced increases of ABA. The effects of
both endogenous and exogenous ABA on photosynthesis were
clearly shown in these experiments.
In Experiment 1, ABA resulted in drastic increases of
stomatal resistance for both soybean and sunflower during
water stress. However, soybean showed consistently higher ABA
contents than those of sunflower, which was accompanied by
lower photosynthetic rates and lower recovery rates in
soybean. It is apparent that the depression of photosynthesis
during water stress had a close relationship to ABA contents
for both species, especially for soybean. It seems that the
consistently higher ABA contents in soybean were mainly
responsible for the low CER. Many potential mechanisms may
control tissue concentration of ABA, such as rate of ABA
synthesis, catabolism, and conjugation (Harrison and Walton,
1975; Pierce and Raschke, 1981; Milborrow, 1983), rate and
direction of ABA transport (Zeevaart and Boyer, 1984) and
changes of cellular pH (Kaiser and Hartung, 1981; Daie and
Wyse, 1983). Alterations in any of the above factors would
change the ABA contents in the tissue. Hubick and Reid (1988)
showed results to support above mechanisms. They reported
that although drought promoted ABA synthesis, however, drought
may alter the rate of turnover of ABA and its metabolites,
because in their experiment water stress altered the quantity
116
of radioactive metabolites and reduced the amount of
radioactive ABA in the extracts from the stressed sunflower.
The stress induced increases in ABA are due to local control
over biosynthesis, catabolism, and conjugation. It appears
that the much lower ABA contents in sunflower may be due to
the lower rate of ABA synthesis, or higher catabolism, or
higher conjugation rate, or faster transport rate, either one
or all of them.
In addition, the consistently higher stomatal resistance
of soybean, which resulted from greater ABA contents,
indicates stomatal effects on photosynthesis. The
relationship between ABA and stomatal resistance strongly
implicates that ABA was the messenger coordinating stomatal
resistance with photosynthetic capacity of the mesophyll of
soybean. These results are in agreement with the work of Cox
and Jolliff (1987), who showed that under water stress
condition, the reduction of photosynthesis in soybean was due
to stomatal effects, whereas nonstomatal effects was evident
in sunflower.
Although ABA is very mobile in plant tissue, however,
about 90% of ABA contents in mesophyll cells is located within
the chloroplasts (Heilmann et al., 1980) because ABA
accumulated in the alkaline chloroplast as the impermeable
ABA" anion (Hartung et al., 1981). However, for controlling
stomata, ABA must move out of chloroplast and into guard cell.
117
It is apparent that change in stromal pH occurred during water
stress so that protonated ABA can cross the chloroplast
membrane freely. If the decreased photosynthetic rate is
associated with decreased stromal pH, then ABA release from
chloroplast would increase. Cowan et al. (1982) calculated
that the stromal acidifications resulted from a light-dark
transition should greatly increase in release of ABA to which
guard cells are exposed. These evidences indicated that the
difference in ABA contents between soybean and sunflower
during water stress may also be due to the differences in pH
changes, especially in chloroplast stroma. It seems likely
that the stromal pH of chloroplast in soybean leaf becomes
more acid than in sunflower, and thereby more ABA would be
released from the chloroplast and move into guard cells,
which would finally result in stomatal closure and reduced
photosynthesis. On the other hand, the high ABA in
chloroplast may also have direct effects on photosynthesis
although this point is still unclear, and the acidification of
chloroplast stroma itself could reduce photosynthesis since
rubisco activity is high only in alkaline condition at pH
about 8.4.
In Experiment 2, the direct effects of ABA on stomatal
conductance and photosynthesis were clearly shown by applied
exogenous ABA. The results certified that the depression of
photosynthesis caused by ABA was due to stomatal effects, at
118
least for soybean, because the stomatal conductance decreased
rapidly and remained at low value for a long time after ABA
treatment. The results also showed concentration effects of
ABA on stomatal conductance. That is, the greater amount of
ABA applied, the lower the stomatal conductance, which
resulted in lower photosynthetic and transpiration rates. The
trends were well in agreement with the results in experiment
1. It appears that soybean stomata are more sensitive to
either endogenous or exogenous ABA than sunflower stomata.
For example, at lower concentration of applied ABA, such as 20
uM, photosynthesis of sunflower was not affected since the
stomatal conductance was almost the same as control.
Although photosynthesis was depressed at higher ABA
concentrations, which was accompanied with low stomatal
conductance, CER in sunflower recovered more rapidly than that
of soybean. It is apparent that the different pattern in
response to exogenous ABA between soybean and sunflower may be
due to the differences in rates of absorption, sensitivity,
and metabolism. Hubick and Reid (1988) found that within 24 h
of application of radioactive ABA to various organs of
sunflower, the extracts from drought stressed plants always
had less of original radioactive ABA than did the control.
They concluded that stress increased the rate of disappearance
of the exogenous ABA. It is likely that sunflower had higher
metabolic rates than that of soybean although other factors

119
may be involved. The mechanism may explain in Figures 31 to
36 of Experiment 2 why sunflower photosynthesis and stomatal
conductance recovered more rapidly than soybean 10 h after ABA
treatment, especially the differences between the two species
at high concentrations of ABA.
From these experiments, it is clear that ABA is a major
message for stomatal closure, at least in stressed
environment. ABA is responsible for stomatal effects, which
resulted in reduction of photosynthesis, especially in water
stress condition. The reduction of photosynthesis by stomatal
effects was clearly correlated in soybean and partly in
sunflower. The cause effect aspect can be evaluated by
physical-biochemical model of photosynthesis, however, this
evaluation was was not conducted in this study. It is also
clear that more work needs to be carried out on the role of
ABA in nonstomatal effects (if any) on photosynthesis,
particularly for sunflower.
120
SUMMARY
Plants usually suffer water deficiency during their
growing season. Water stress reduced photosynthesis,
transpiration and increased drastically stomatal resistance
and endogenous ABA in this study. The differences in response
to water stress between soybean and sunflower were also
evident in this study.
As water stress occurred, especially when severe water
stress developed, leaf water potentials decreased rapidly for
both soybean and sunflower, which was accompanied by sharp
increases of stomatal resistance and leaf temperature.
Photosynthetic rate and transpiration rate decreased with
decreases of leaf water potentials, especially when water
potential dropped below -8 bars. Sunflower, however, had a
consistently greater rates of photosynthesis and
transpiration, but lower stomatal resistance and leaf
temperature than soybean during water stress. After
rewatering, the recovery of leaf water potentials was
accompanied by decreases of stomatal resistance and leaf
temperature. But, the recovery of photosynthetic rates were
slower than that of water potentials for both species. The
slower photosynthetic recovery may have been caused by several
factors such as incomplete recover of enzymes or incomplete
opened stomata. Changes of chlorophyll during water stress
and after rewatering, especially changes of the chlorophyll
121
a/b ratio also may have been related to the slower recovery of
CER. However, the recovery of CER was faster in sunflower
than that in soybean. It is apparent that the differences in
CER between the two species were due to differences in
stomatal resistance, transpiration rate, leaf temperature as
well as chlorophyll and protein contents. It was shown
clearly in this study that sunflower was better adapted in
drought environment that soybean.
Leaf endogenous ABA increased drastically during water
stress. The changing trend of ABA was paralleled with the
changes of stomatal resistance and opposite with the changes
of leaf water potential, transpiration rate, and CER. ABA
showed a close relationships with these parameters. The
greater the ABA contents in leaf, the higher stomatal
resistance, and the lower leaf water potential, transpiration
and CER. However, soybean and sunflower showed a
significantly different increases in ABA amounts during water
stress. Much greater amounts of ABA increased during water
stress in soybean than that in sunflower, especially on the
and the 5th day of stress, ABA contents in soybean reached
to 2.3 mg.g~^.fw, which was 3.2 fold higher than in sunflower.
The much greater ABA contents in soybean indicated that ABA
had a major influence on the high stomatal resistance and low
CER. It is apparent that the stomatal effects by ABA on
photosynthesis existed in soybean. The higher soluble protein
122
contents in soybean, however, may be partly responsible for
the high ABA contents. The lower ABA contents in sunflower
indicated that it may have higher ABA metabolism, higher
conjugated rate, or lower ABA synthetic rate than soybean.
The exogenous ABA experiments also conformed the ABA
effects on stomata and photosynthesis. The effects of ABA
concentration showed in both soybean and sunflower. The
higher the concentration of ABA applied the lower the rates of
CER, transpiration, and stomata1 conductance. However,
sunflower showed less sensitive to ABA, especially at low ABA
concentration (20 uM), whereas soybean was sensitive to all
ABA concentrations applied, and showed apparent stomatal
effects on CER. The results agree well with the changes of
endogenous ABA during water stress. ABA is related to
stomatal closure, particularly for soybean, at least in water
stressed condition.
The method developed in this study with HPLC and GCMS
system for measuring ABA showed several advantages to other
methods reported. It provided a relatively quick, simple,
efficient and reliable techniques for extraction,
purification, and quantification of ABA from highly pigmented
green tissues such as from soybean and sunflower leaves. This
method also can be used for ABA determination from non-green
tissues with some modification if necessary.
123
LITERATURE CITED
Ackerson, R. C. 1980. stomatal response of cotton to water stress and abscisic acid as affected by water stress history. Plant Physiol. 65:455-459.
Anderson, B., N. Haggetrom, and K. Anderson. 1978. Identification of abscisic acid in shoots of Picea abies and Pinus svlvestrisbv combined gas chromatography-mass spectrometry. J. Chromatography 157:303-310.
Archbold, D. D., and F. G. Dennis, Jr. 1984. Quantification of free ABA and free and conjugated lAA in strawberry achene and receptacle tissue during fruit development. J. Am. Soc. Hort. Sci. 109:330-335.
Arteca, R. N., B. W. Poovaiah, and O. E. Smith. 1980. Use of high performance liquid chromatography for the determination of endogenous hormone levels in Solanum tuberosum L. subjected to carbon dioxide environment of the root zone. Plant Physiol. 65:1216-1219.
Baer, G. R., and L. E. Schrader. 1985. Relationships between CO- exchange rate and activation of pyruvate. Pi dikinase and ribulose bisphosphate carboxylase, chlorophyll concentration, and cell volume in maize leaves. Plant Physiol. 77:612-616.
Bangerth, F. 1982. Change in the ratio of cis-trans to trans-trans abscisic acid during ripening of apple fruits. Planta 155:199-201.
Bates, L. M., and A. E. Hall. 1981. Stomatal closure with soil water depletion not associated with change in bulk leaf water status. Oecologia 50:62-65.
Beardsell, M. F., and D. Cohen. 1975. Relationships between leaf water status, abscisic acid levels, and stomatal resistance in maize and sorghum. Plant Physiol. 56:207-212.
Beardsell, M. F., K. J. Mitchell, and R. G. Thomas. 1973. Effects of water stress under contrasting environmental conditions on transpiration and photosynthesis in soybean. J. Exp. Bot. 24:579-586.
Berkowitz, G. A., and M. Gibbs. 1982. Effect of osmotic stress on photosynthesis studied with the isolated spinach chloroplast. Plant Physiol. 70:1143-1148.
124
Berkowitz, 6. A., and G. Whalen. 1985. Leaf K interactions with water stress inhibition of nonstomatal controlled photosynthesis. Plant Physiol. 79:189-193.
Blackman, P. 6., and W. J. Davies. 1985. Root to shoot communication in maize plants of the effects of soil drying. J. Exp. Bot. 36:39-48.
Blake, J., and W. K. Ferrell. 1977. The association between soil and xylem water potential, leaf resistance, and abscisic acid content in droughted seedlings of Doglas-fir. fPseudutsuaa menzisici. Physiol. Plant 39:106-109.
Boyer, J. S. 1970. Leaf enlargement and metabolic rates in corn, sorghum, and sunflower at various leaf water potentials. Plant Physiol. 46:233-235.
Boyer, J. S. 1971a. Resistances to water transport in soybean, bean, and sunflower. Crop Sci. 11:403-407.
Boyer, J. S. 1971b. Recovery of photosynthesis in sunflower after a period of low leaf water potential. Plant Physiol. 47:816-820.
Boyer, J. S. 1976. Water deficits and photosynthesis. p. 153-190. In T. T. Kozlowski (ed.). Water deficit and plant growth. Acadamic Press, New York.
Boyer, J. S., and B. L. Bowen. 1970. Inhibition of oxygen evolution in chloroplasts isolated from leaves with low water potentials. Plant Physiol. 45:612-615.
Brady, R. A., S. M. Goltz, W. L. Powers, and E. T. Kanemasu. 1975. Relation of soil water potential to stomatal resistance of soybean. Agron. J. 67:97-99.
Bray, Elizabeth. 1988. Drought- and ABA-induced changes in polypeptide and mRNA accumulation in tomato leaves. Plant Physiol. 88:1210-1214.
Bunce, J. 1987. Species specific responses to water stress of gas exchange parameters mimicked by applied abscisic acid. Can. J. Bot. 65:103-106.
Buttery, B. R., and R. I. Buzzell. 1977. The relationships between chlorophyll content and rate of photosynthesis in soybeans. Can. J. Plant Sci. 57:612-616.
125
Caemmerer, S. V., and G. D. Farguhar. 1984. Effects of partial defoliation, changes of irradiance during growth, short-term water stress and growth at enhanced PfCO.) on the photosynthetic capacity of leaf of Phaseolus vulgaris L. Planta 160:320-329.
Carlson, N., N. Momen, O. Arjmand, and R. H. Shaw. 1979. Leaf conductance of leaf water potential relationships for two soybean cultivars grown under controlled irrigation. Agron. J. 71:321-325.
Cavalieri, A. J., and J. S. Boyer. 1982. Water potentials induced by growth in soybean hypocotyls. Plant Physiol. 85:261-267.
Ciha, A. J., M. L. Brenner, and W. A. Brun. 1977. Rapid separation and quantification of abscisic acid from plant tissues using high performance liquid chromatography. Plant Physiol. 59:821-826.
Cornic, G., and E. Miginiac. 1983. Non-stomatal inhibition of rate CO, uptake by abscisic acid in Pharbitis nil. Plant Physiol. 73:529-533.
Cornish, K., and J. A. D. Zeevaart. 1985. Movement of abscisic acid into the apoplast in response to water stress in Xanthium strumarium L. Plant Physiol. 78:623-626.
Cowan, A. K., and I. D. Railton. 1986. Chloroplasts and the biosynthesis and catabolism of abscisic acid. J. Plant Growth Regul. 4:211-224.
Cowan, A. K., J. A. Raven, W. Hartung, and G. D. Farquhar. 1982. A possible role for abscisic acid in coupling stomatal conductance and photosynthetic carbon metabolism in leaves. Aust. J. Plant Physiol. 9:489-498.
Cox, W. J., and G. D. Jolliff. 1987. Crop water relations of sunflower and soybean under irrigated and dry land conditions. Crop Sci. 27:553-557.
Creelman, R. A., D. A. Gate, J. T. Stults, and J. A. D. Zeevaart. 1987. Abscisic acid biosynthesis in leaves and roots of Xanthium strumarium. Plant Physiol. 85:726-732.
Davies, W. J., J. Metcalfe, T. A. Lodge, and A. R. de Costa. 1986. Plant growth substances and the regulation of growth under drought. Aust. J. Plant Physiol. 13:105-125.
126
Diae, J., and R. E. Wyse. 1983. ^^C-ABA uptake in source and sink tissue of sugarbeet. Plant Physiol. 72:430-433.
Dorffling, K., and D. Tietz. 1983. Methods for the detection and estimation of abscisic acid and related compounds. p. 23-78. %n F. T. Addicott (ed.). Abscisic Acid. Praeger Publishers, New York, New York.
Dubbe, D. R., C. D. Farguhar, and K. Raschke. 1978. Effect of abscisic acid on the gain of feedback loop involving carbon dioxide on stomata. Plant Physiol. 62:413-417.
Durley, R. C., T. Kannangara, and G. M. Simpson. 1978. Analysis of abscising and 3-indolylacetic acid in leaves of Sorghum bicolor by high performance liquid chromatography. Can. J. Bot. 56:157-161.
Ehrler, W. L., S. B. Idso, R. D. Jackson, and R. J. Regon. 1978. Diurnal changes in plant water potential and canopy temperature of wheat as affected by drought. Agron. J. 70:999-1004.
El-Sharkawy, M. A., and J. D. Hesketh. 1965. Photosynthesis among species in relation to characteristics of leaf anatomy and CO, diffusion resistance. Crop Sci. 5:517-521.
Farguhar, G. D., and T. D. Sharkey. 1982. Stomatal conductance and photosynthesis. Ann. Rev. Plant Physiol. 33:317-345.
Fehr, W. R., and C. E. Caviness. 1977. Stage of soybean development. Iowa Agric. and Home Econ. Exp. Stn. Coop. Ext. Ser. Spec. Rep. no. 80.
Fischer, R. A. 1968. Stomatal opening in isolated epidermal strips of vicia faba. I. Response to light and to CO, free air. Plant Physiol. 43:1947-1952.
Fischer, 6. D., T. C. Hsiao, and R. M. Hagan. 1970. After effect of water stress on stomatal opening potential. I. Techniques and magnitudes. J. Exp. Bot. 21:371-385.
Fischer, E., K. Raschke, and M. Stitt. 1986. Effects of abscisic acid on photosynthesis in whole leaves: changes in COg assimilation, levels of carbon reduction cycle intermediates, and activity of ribulose 1,5, bisphosphate carboxylase. Planta 169:536-545.
127
Fry, K. E. 1972. Inhibition of ferricyanide reduction in chloroplasts prepared from water stressed leaves. Crop Sci. 12:698-701.
Funada, R., T. Sugiyama, T. Kubo, and M. Fushitani. 1988. Determination of abscisic acid in Pinus densiflora by selected ion monitoring. Plant Physiol. 88:525-527.
Gamble, P. E., and J. J. Burke. 1984. Effect of water stress on the chloroplast antioxidant system. Plant Physiol. 76:615-621.
Genty, B., J. M. Briantais, and J. B. V. DA Silva. 1987. Effects of drought on primary photosynthetic processes of cotton leaves. Plant Physiol. 83:360-364.
Gollan, T., J. B. Passioura, and R. Munns. 1986. Soil water status affects the stomatal conductance of fully turgid wheat and sunflower leaves. Aust. J. Plant Physiol. 13:459-464.
Goodwin, T. W. 1965. The biosynthesis of carotenoids. p. 143-173. In T. W. Goodwin (ed.). In chemistry and biochemistry of plant pigments. Academic, New York.
Gray, R. T., R. Mallaby, G. Ryback, and V. P. Williams. 1974. Mass spectra of methyl abscisate and isotopically labelled analogues. J. Chem. Soc. Perkin Trans. 2:919-924.
Guerrero, F., and J. Mullet. 1986. Increased abscisic acid biosynthesis during plant dehydration requires transcription. Plant Physiol. 80:588-581.
Harrison, M. A., and D. C. Walton. 1975. Abscisic acid metabolism in water stressed bean leaves. Plant Physiol. 56:250-254.
Hartung, W., H. Gimnler, B. Heilman, and G. Kaiser. 1980. The site of abscisic acid metabolism in mesophyll cells of Spinacia oleracea. Plant Sci. Lett. 18:359-364.
Hartung, W., B. Heilman, and H. Gimnler. 1981. Do chloroplasts play a role in abscisic acid synthesis? Plant Sci. Lett. 22:235-242.
Hartung, W., W. M. Kaiser, and C. Burschka. 1983. Release of abscisic acid from leaf strips under osmotic stress. Z. Pflanzenphysiol. 112:131-138.
128
Hartung, W., J. V. Radin, and D. L. Hendrix. 1988. Absclslc acid movement into the apoplastic solution of water stressed cotton leaves. Plant Physiol. 86:908-913.
Heilmann, B., W. Hartung, and H. Gimnler. 1980. The distribution of abscisic acid between chloroplast and cytoplasm of leaf cells and the permeability of the chloroplast envelope for abscisic acid. Z. Pflanzenphysiol. 97:67-78.
Hemphill, D. D., and H. B. Turkey. 1975. Effect of intermitted mist on abscisic acid levels in Euonvmus alatus sieb: leaching vs. moisture stress. Hortscience 10:369-370.
Henson, I. E. 1981. Changes in abscisic acid content during stomatal closure in millet fPennisetum amerianum [L.]) Leeke. Plant Sci. Lett. 21:121-127.
Hesketh, J. D. 1963. Limitations to photosynthesis responsible for differences among species. Crop Sci. 3: 493-496.
Hesketh, J. D., W. L. Ogren, M. E. Hageman, and D. B. Peter. 1981. Correlations among leaf COg exchange rates, area, and enzyme activities among soybean cultivars. Photosyn. Res. 2:210-230.
Hoad, G. V. 1975. Effect of osmotic stress on abscisic acid levels in xylem sap of sunflower. Planta 124:25-29.
Horton, R. F, and Z. Moran. 1972. Abscisic acid inhibition of potassium flux into stomatal guard cells. Z. Pflanzenphysiol. 66:193-196.
Huber, S. C., H. H. Rogers, and L. M. Fred. 1984. Effects of water stress on photosynthesis and carbon partitioning in soybean fGlvcine max. [L.] Merr.) plants grown in the field at different CO- levels. Plant Physiol. 76:244-249.
Hubick, K. T., and D. M. Reid. 1980. A rapid method for the extraction and analysis of abscisic acid from pant tissues. Plant Physiol. 65:523-525.
Hubick, K. T., and D. M. Reid. 1988. Effects of drought on transport and metabolism of abscisic acid in aeroponically grown Helianthus annuus. Physiol. Plantarum 74:317-325.
129
Hubick, K. T., J. S. Taylor, and D. H. Reid. 1986. The effect of drought on levels of abscisic acid, cytokinins, gibberellins and ethylene in aeroponically grown sunflower plants. Plant Growth Regul. 4:139-151.
Jackson, R. D. 1982. Canopy temperature and water of leaf area, solar radiation, air temperature, and variety on net photosynthesis in field grown soybean. Crop Sci. 9:762-764.
Jackson, R. D., R. J. Reginato, and S. B. Idso. 1977. Wheat canopy temperature: A practical tool for evaluating wheat requirements. Water Resour. Res. 13:651-656.
Jensen, R. G., and J. T. Bear. 1977. Ribulose 1,5, bisphosphate carboxylase/oxygenase. Meth. Enzymol. 69:326-336.
Jones, H. G. 1973. Moderate term water stresses and associated changes in some photosynthetic processes. Plant Physiol. 72:1095-1105.
Jung, P. K., and H. D. Scott. 1980. Leaf water potential, stomatal resistance, and temperatures in field-grown soybeans. Agron. J. 72:986-990.
Kaiser, W. M., and W. Hartung. 1981. Uptake and release of abscisic acid by isolated photo-autotrophic mesophyll cells depends on pH gradients. Plant Physiol. 68:202-206.
Kaiser, W. M., and U. Heber. 1981. Photosynthesis of isolated chloroplasts and protoplasts under osmotic stress. Effect of high solute concentration on the permeability properties of the chloroplast envelope and on activity of stomata enzymes. Planta (In press).
Kaiser, W. M., G. Kaiser, P. K. Parchub, S. G. Wildman, and U. Heber. 1981. Photosynthesis under osmotic stress. Inhibition of photosynthesis of intact chloroplast, protoplasts and leaf slices at high osmotic potentials. Planta 153:416-422.
Kariya, K., and S. Tsunoda. 1972. Relationship of chlorophyll content, chloroplast area index and leaf photosynthesis rate in Brassica. Tohoku J. Agric. Res. 23:1-15.
Kawashima, N., and S. G. Wildam. 1970. Fraction I protein. Ann. Rev. Plant Physiol. 21:325-328.
130
Keck, R. W., and J. S. Boyer. 1974. Chloroplast response to low leaf water potentials. III. Differing inhibition of electron transport and photophosphorylation. Plant Physiol. 53:474-479.
Knox, J. P., and P. F. Wareing. 1984. Apical dominance in Phaseolus vularis L.: The possible roles of abscisic and indole-3-acetic acid. J. Exp. Bot. 35:239-244.
Kok, B. 1965. Photosynthesis: The path of energy, p. 903-960. In Bonner J., and J. E. Varner (ed.). Plant biochemistry. Acadamic Press, New York.
Kung, S. D., R. Chollet, and T. V. Marsho. 1980. Crystallization and assay procedures of tobacco ribulose 1, 5 bisphosphate carboxylase-oxygenase. Meth. Enzymol.
• 69:326-336.
Lawlor, D. W., 1976. Water stress induced changes in photosynthesis, photorespiration and COg compensation concentration of wheat. Photosynthetica 10:378-387.
Lawlor, D. W., and H. Fock. 1975. Photosynthesis and photorespiratory CO- evolution of water stressed sunflower leaves. Planta 126:247-258.
Li, X. Y. 1986. A comparison of photosynthesis in soybean and sunflower leaves. M.S. thesis. Iowa State University, Ames, Iowa.
Loveys, B. R. 1977. The intracellular location of abscisic acid in stressed and non-stressed leaf tissue. Physiol. Plant 40:6-10.
Ludewig, M., K. Dorffling, and H. Seifert. 1988. Abscisic acid and water transport in sunflower. Planta 175:325-333.
MacRobbie, E. A. C. 1981. Ion flues in isolated guard cells of Commelina communis L. J. Exp. Bot. 32:545-562.
Magnus, V., R. S. Bandurski, and A. Schulze. 1980. Synthesis of 4. 5. 6. 7. and 2. 4. 5. 6. 7 beuterium-labeled indole-3-acetic acid for using in mass spectrophotometric assays. Plant Physiol. 66:775-781.
Mansfield, T. A., and W. J. Davies. 1981. Stomata and stomatal mechanism, p. 314-346. %n L. 6. Paley, and D. Aspinad (eds.). The physiology and biochemistry of drought resistance in plant. Academic Press, Sydney.
131
Mansfield, T. A., and R. J. Jones. 1971. Effects of abscisic acid on potassium uptake and starch content of stomatal guard cells. Planta 101:147-158.
Mansfield, T. A., A. R. Wellbum, and T. J. S. Moreira. 1978. The role of abscisic acid and farnesol in the alleviation of water stress. Philos. Trans. R. Soc. London Ser. B. 284:471-482.
Marre, E. 1979. Fusicoccin: A tool in plant physiology. Ann. Rev. Plant Physiol. 30:273-289.
Mawson, B. T., B. Coolman, and W. R. Cummins. 1981. Abscisic acid and photosynthesis in isolated leaf mesophyll cells. Plant Physiol. 67:233-236.
Michler, C. H., R. D. Lineberger, and G. W. Chism. 1986. A highly sensitive method for quantitative determination of abscisic acid. Plant Physiol. 82:600-603.
Milborrow, B. V. 1978. Abscisic acid. p. 295-347. In D. S. Letham, P. B. Goodwin, and T. T. Higging (eds.). Phytohormones and related compounds - A comprehensive treaties. Elsevier/North Holland Biomed. Press, Amsterdam.
Milborrow, B. V. 1979. Antitranspirants and the regulation of abscisic acid content. Aust. J. Plant Physiol. 6:249-254.
Milborrow, B. V. 1981. Abscisic acid and other hormones, p. 348-388. In L. G. Paley, and D. Aspinad (ed.). The physiology and biochemistry of drought resistance in plants. Academic Press, Sydney.
Milborrow, B. V. 1983. The reduction of (±)-[l-^*C] abscisic acid to the 1',4•-trans-diol by pea seedlings and the formation of 4'-deoxy ABA as an artefact. J. Exp. Bot. 34:303-308.
Milborrow, B. v. , and R. C. Noddle. 1970. Conversion of 5-(1,2.epoxy-2, 6,6-trimethylcyclohexy)-3-methylpenatcis-2-trans-4-dienoic acid into abscisic acid in plants. Biochem. J. 119:727-734.
Milborrow, B. V., and D. R. Robinson. 1973. Factors affecting the biosynthesis of abscisic acid. J. Exp. Bot. 24:537-548.
132
Mohanty, P., and J. S. Boyer. 1976. Chloroplast response to low leaf water potentials. II. Quantum yield is reduced. Plant Physiol. 57:704-709.
Mooney, H. A., and O. Bjorkman, and G.J. Collatz. 1977. Photosynthetic acclimation to temperature and water stress in the desert shrub, larrea divaricata. Carnegie Inst. Washington Yearb. 76:328-335.
Munns, R., and R. W. King. 1988. Abscisic acid is not the only stomatal inhibitor in the transpiration stream of wheat plants. Plant Physiol. 88:703-708.
Neill, S. J., and R. Morgan. 1985. Abscisic acid production and water relations in wilty tomato mutants subjected to water deficiency. J. Exp. Bot. 36:1222-1231.
Neill, s . J., R. Morgan, and A. D. Parry. 1986. The carotenoid and abscisic acid content of viviparrous kernels and seedlings of Zea mavs L. Planta 169:87-96.
Nevins, D. J., and R. S. Loomis. 1970. Nitrogen nutrition and photosynthesis in sugar beet (Beta vulgaris L.). Crop Sci. 10:21-25.
Newton, B. A., N. R. Baker, S. P. Long, and D. W. Lawlor. 1981. In vivo photochemical function in water stressed leaves of Zea mavs. p. 209-218. In G. Akoynnoglou (ed.). Photosynthesis VI, photosynthesis and productivity, photosynthesis and environment. Balaban International Science Services, Philadelphia.
Nir, I., and P. Mayber. 1967. Effects of water stress on the photochemical activity of chloroplasts. Nature 213:418-419.
O'Toole, J. C., R. K. Crookston, K. J. Treharne, and J. L. Ozbun. 1976. Mesophyll resistance and carboxylase activity. A comparison under water stress conditions. Plant Physiol. 57:465-468.
Pierce, M. L., and K. Raschke. 1978. The relationship between abscisic acid accumulation and leaf turgor. Plant Physiol. 61:25.
Pierce, M. L., and K. Raschke. 1980. Correlation between loss of turgor and accumulation of abscisic acid in detached leaves. Planta 148:174-182.
133
Pierce, H. L., and K. Raschke. 1981. Synthesis and metabolism of abscisic acid in detached leaves of Phaseolus vulgaris L. after loss and recovery of turgor. Planta 153:156-165.
Popova, L. P., and S. 6. Vaklinova. 1983. The action of abscisic acid and gibberellic acid on the chlorophyll content, intensity of photosynthetic COg fixation and activity of carboxylating enzymes in C, and C. plants. Wiss. Z. Ernt-Moritz-Univ. Greisswald natimatisch Naturwiss. Reihe 3-4:17-22.
Popova, L. P., O. D. Dimitrova, and S. G. Vaklinova. 1982. Effect of abscisic acid on the chlorophyll content, the intensity of the photosynthetic COg fixation and the activity of carboxylating enzymes in C3 and C. plants. C. R. Acad. Bulg. Sci. 35:1291-1294.
Popova, L. P., T. D. Tsonev, and S. G. Vaklinova. 1987. A possible role for abscisic acid in regulation of photosynthetic and photorespiration carbon metabolism in barley leaves. Plant Physiol. 83:820-824.
Potter, J. R., and J. S. Boyer. 1973. Chloroplast response to low leaf water potential. II. Role of osmotic potential. Plant Physiol. 51:993-997.
Powles, S. B., and O. Bjorkman. 1982. High light and water stress effects on photosynthesis in Nerium oleamder. II. Inhibition of photosynthetic reactions under water stress: Interaction with light level. Carnegie Inst. Wash. Yearbook 81:76-77.
Rabinnowitch, E., and Govindjee. 1969. Photosynthesis. John Wiley and Sons, New York.
Radin, J. W., and R. C. Ackerson. 1982. Does abscisic acid control stomatal closure during water stress? What's New in Plant Physiol. 13:9-12.
Radin, J. W., and D. L. Hendrix. 1987. The apoplastic pool of abscisic acid in cotton leaves in relation to stomatal closure. Planta (In Press).
Railton, E. D., D. M. Reid, P. Baskin, and J. MacMillan. 1974. Characterization of abscisic acid in chloroplasts in Pisum sativum cv. Alaska by combined gas chromatography-mass spectrometry. Planta 117:178-182.
Raschke, K. 1975. Stomatal action. Ann. Rev. Plant Physiol. 26:309-340.
134
Raschke, K. 1977. The stomatal turgor mechanism and its responses to CO- and abscisic acid: Observations and a hypothesis, p. 173-183. In E. Marre, and O. Cifferi (ed.). Regulation of cell membrane activities in plants. Elsevier/North-Holland Biomed. Press, Amsterdam.
Raschke, K. 1982. Involvement of abscisic acid in the regulation of gas exchange: Evidence and inconsistence, p. 581-590. In P. F. Wareing (ed.). Plant Growth Substances. Academic, London.
Raschke, K., and R. Hedrich. 1985. Simultaneous and independent effects of abscisic acid on stomata and the photosynthetic apparatus in whole leaves. Planta 163:105-118.
Raschke, K., and J. Patzke. 1988. Abscisic acid can cause apparent depressions of the photosynthetic capacity of leaves through changes in the probability density function of stomata1 aperture. Planta (In Press).
Rawson, H. M., G. A. Constable, and G. N. Howce. 1980. Carbon productions of sunflower cultivars in field and controlled environments. Aust. J. Plant Physiol. 7:575-586.
Reicosky, D. C., D. E. Deaton, and J. E. Parsons. 1980. Canopy air temperatures and evaporation from irrigated stressed soybeans. Agric. Meterorol. 8:92-105.
Rivier, L., H. Milon, and P. E. Pilet. 1977. Gas chromatography - mass spectrometric determination of abscisic acid levels in cap and the apex of maize roots. Planta 134:23-27.
Robertson, J. M., R. P. Pharis, Y. Y. Huang, D. M. Reid, and E. C. Yeung. 1985. Drought induced increases in abscisic acid levels in the root apex of sunflower. Plant Physiol. 79:1086-1089.
Robinson, R. G. 1967. Effect of temperature on net assimilation rate. Ann. Bot. 30:753-761.
Robinson, R. G. 1978. Sunflower production and culture. p. 89-95. In F. C. Jack (ed.). Sunflower science and technology. Am. Soc. Agron., Madison, Wisconsin.
Schnabl, H. 1978. The effects of Cl~ upon the sensitivity of starch containing and starch deficient stomata and guard cell protoplasts towards potassium ions, fuscicoccin, and abscisic acid. Planta 144:95-100.
135
Scott, H. D., P. K. Jung, and J. A. Ferguson. 1981. A comparison of soybean leaf water potential and leaf temperature under progressive drought. Agron. J. 73:574-576.
Secor, J., R. Shibles, and C. R. Stewart. 1984. A metabolic comparison between progressive and monocarpic senescence of soybean. Can. J. Bot. 62:806-811.
Seemann, J. R., and T. D. Sharkey. 1987. The effect of abscisic acid and other inhibitors on photosynthetic capacity and biochemistry of CO- assimilation. Plant Physiol. 84:696-700.
Sharkey, T. D. 1985. Photosynthesis in intact leaves of C^ plants: Physics, physiology and rate limitations. Bot. Rev. 51:53-105.
Sharkey, T. D., and K. Raschke. 1981. Separation and measurement of direct and indirect effect of light on stomata. Plant Physiol. 68:33-40.
Sharp, P. E., and J. S. Boyer. 1986. Photosynthesis at low water potentials in sunflower: lack of photoinhibitory effects. Plant Physiol. 82:90-95.
Sionit, N., and P. H. Kramer. 1977. Effect of water stress during different stages of growth of soybean. Agron. J. 69:274-278.
Sperry, J., and M. T. Tyree. 1988. Mechanism of water stress induced xylem embolism. Plant Physiol. 88:581-587.
Subbaiah, T., and L. Powell. 1987. Abscisic acid in dormant apple seed tissues - a rapid purification scheme using pre-packed columns and GCMS-SIM quantitation. Physiol. Plantarum 71:203-206.
Sweetser, P. B., and A. Vatuars. 1976. High performance liquid chromatographic analysis of abscisic acid in plant extracts. Anal. Biochem. 46:373-376.
Tagari, Y., Y. Murata, and T. Sachi. 1969. Photosynthesis and utilization of solar energy. Level 1 experiment. Report 3, JIBP/PP-Photosynthesis. Faculty of Agriculture, Tokyo University, Japan.
Teare, I. D., and E. T. Kanemsu. 1972. Stomatal diffusion resistance and water potential of soybean and sorghum leaves. New Phytol. 71:805-810.
136
Terashima, I., S. C. Wong, C. B. Osmond, and G. D. Farguhar. 1988. Characterization of non-uniform photosynthesis induced by abscisic acid in leaves having different mesophyll anatomies. Plant Cell Physiol. 29:385-394.
Travis, A. J., and T. A. Mansfield. 1981. Light saturation of stomatal opening on the adaxial and abaxial epidermis of Commelina communis. J. Exp. Bot. 32:1169-1179.
Van Kirk, C. A., and K. Raschke. 1978. Release of malate from epidermal strips during stomatal closure. Plant Physiol. 61:474-475.
Vaughan, G. T., and B. V. Milborrow. 1984. Resolution of Rs-abscisic acid and the separation of abscisic acid metabolites from plant tissue by high performance liquid chromatography. J. Chromatography 336:221-228.
Vine, J. H., D. Noiton, J. A. Plummer, C. B. Lucas, and M. G. Mullins. 1987. Simultaneous quantitation of indole-3-acetic acid and abscisic acid in small samples of plant tissues by gas chromatography/mass spectrometry/selected ion monitoring. Plant Physiol. 85:419-422.
Von Caemmerer, S. 1981. On the relationship between chloroplast biochemistry and gas exchange of leaves. Ph.D. thesis. Australian National Univ., Canberra.
Vu, J. C. v. , L. H. Allen, Jr., and G. Bowes. 1987. Drought stress and elevated COg effects on soybean ribulose bisphosphate carboxylase activity and canopy photosynthetic rates. Plant Physiol. 83:573-578.
Vu, J. C. v. , and G. Yelenosky. 1988. Water deficit and associated changes in some photosynthetic parameters in leaves of 'Valencia' Orange fCitrus sinensis L. Osbeek). Plant Physiol. 88:375-378.
Walton, D. Ç. 1980. Biochemistry and physiology of abscisic acid. Ann. Rev. Plant Physiol. 31:453-489.
Walton, D. C., E. Galson, and M. A. Harrison. 1977. The relationship between stomatal resistance and abscisic acid levels in leaves of water stressed bean plants. Planta 133:145-148.
Walton, D. C., E. Galson, and M. A. Harrison. 1979. A radioimmunoassay for abscisic acid. Planta 146:139-145.
137
Ward, D. A., and J. A. Bunce. 1987. Abscisic acid simultaneously decreases carboxylation efficiency and quantum yield in attached soybean leaves. J. Exp. Bot. 38:1182-1192.
Warren, J. 1967. High net assimilation rate of sunflower plants in an arid climate. Ann. Bot. N. S. 30:745-751.
Watts) S. H., C. T. Wheeler, and J. R. Hillman. 1987. Abscisic acid and dormancy in root-nodulated Alnus alutinosa (L.) gaertn. New Phytoi. 105:459-468.
Watts, S. H., C. T. Wheeler, J. R. Hillman, A. M. M. Berrie, A. Crozier, and V. B. Math. 1983. Abscisic acid in the nodulated root system of Alnus alutinosa. New Phytoi. 95:203-208.
Weiler, E. W. 1979. Radioimmunoassay for the determination of free and conjugated abscisic acid. Planta 144:255-263.
Weyers, J. B., and J. R. Hillman. 1979. Uptake and distributions of abscisic acid in Commelina leaf epidermis. Planta 144:167-172.
Wien, H. C., E. J. Littleton, and A. Ayanaba. 1979. Drought stress of cowpea and soybean under tropical conditions, p. 283-301. In H. Mussel1, and R. C. Staples (ed.). Stress physiology in crop plants. John Wiley and Sons, New York.
Wintermans, J. F., and A. De Mots. 1965. Spectrophotometer characteristics of chlorophyll a and b and their phenophytins in ethanol. Biochem. Biophys. Acta 109:448-453.
Wong, S. C., I. R. Cowan, and G. D. Farquhar. 1985. Leaf conductance in relation to rate of CO- assimilation. III. Influences of water stress and photosynthesis. Plant Physiol. 78:830-834.
Wright, S. T. C. 1977. The relationship between leaf water potential and abscisic acid and ethylene in excited wheat leaves. Planta 134183-189.
Wright, S. T. C. 1978. Photohormones and stress phenomena. p. 495-563. In D. S. Letham, P. E. Goodwin, and T. J. V. Higgins (eds). Phytohormones and related compounds. A comprehensive treaties. Vol. 2. Elsevier/North-Holland, New York.

138
Zabadal, T. J. 1974. A water potential threshold for the increase of abscisic acid in leaves. Plant Physiol. 53:125-127.
Zeevaart, J. A. D., and G. L. Boyer. 1984. Accumulations and transport of abscisic acid and its metabolites in Ricinus and Xanxthium. Plant Physiol. 74:934-939.
Zeevaart, J. A. D., and R. A. Greelman. 1988. Metabolism and physiology of abscisic acid. Ann. Rev. Plant Physiol. Ann. Mol. Biol. 39:439-473.
Zhang, J., V. Schurr, and W. J. Davies. 1987. Control of stomatal behavior by abscisic acid which apparently originates ih~the roots. J. Exp. Bot. 38:1176-1181.
139
ACKNOWLEDGEMENTS
To Dr. I. C. Anderson, my major professor, I, firstly,
would like to express my many thanks for his suggestions,
encouragements, and thoughtful guidance during the experiments
and throughout my study. To Drs. R. B. Pearce, S. E. Taylor,
C. E. LaMotte, and R. J. Gladon, my committee members, I would
like to thank them for their excellent lectures and helpful
suggestions and comments, especially to Dr. C. E. LaMotte, for
his suggestions and guidance when I worked in his laboratory
on ABA analyses. To Mr. Norman Cloud and Richard Meilan, I
also thank for their help with the HPLC and GCMS.
To my wife, Xue Luo, and my daughter, Bian Li, I give my
special thanks for their patience, encouragement and
understanding throughout this study.
To above people, I dedicate my thesis.


![Identification of a Novel Abscisic Acid-Regulated...Identification of a Novel Abscisic Acid-Regulated Farnesol Dehydrogenase from Arabidopsis1[W][OA] Jayaram Bhandari, A. Heather](https://img.pdfslide.us/doc/110x75/5e642e6038fe702ff26ae7dc/identiication-of-a-novel-abscisic-acid-identiication-of-a-novel-abscisic.jpg)