Embed Size (px)
Citation preview

Relationships between the distributions of marine avian predators and their prey,
Euphausia superba, in Bransfield Strait and southern Drake Passage, Antarctica
Published December 15 Vol. 5 8 3-16, 1989
Dennis ~ e i n e m a n n l ~ *, George ~ u n t ' , Inigo ~ v e r s o n ~
MARINE ECOLOGY PROGRESS SERIES Mar. Ecol. Prog. Ser.
' Department of Ecology and Evolutionary Biology, University of California at Irvine, Irvine, California 92717, USA British Antarctic Survey, Natural Environmental Research Council, High Cross Madingley Road, Cambridge CB3 OET,
United Kingdom
ABSTRACT: We investigated the joint distributions of seabirds and krill (primarily Euphausia superba) in Bransfield Strait and southern Drake Passage, Southern Ocean. We estimated seabird and krill densities, simultaneously and continuously uslng visual and acoustic techniques while traversing a transect grid standardized for the Second International BIOMASS Experiment (SIBEX) program. This is one of only 3 studies to find a correlation between the densities of seabirds and their prey. We defined 2 statistically independent components of distributional correlation: 'spatial concordance', the tendency for predators and prey to CO-occur in the same sampling unit, and 'numerical concordance', the tendency for densities of spatially concordant predators and prey to covary. Within nautical-mile transect intervals, we found cape petrels Daption capensis and antarctic fulmars Fulmarus glacialoides spatially concordant, and cape petrels, and adelie penguins Pygoscelis adeliae numerically concordant with krill. A few large concentrations of seabirds and krill accounted for the majority of seabird and krill biomass. Such large concentrations were rarely found within the same mile intervals, but were found within a few miles of each other more often than expected by chance. Seabird-krill correlations increased with spatial scale, and attained their maxima over large areas defined by their seabird species composition or krill depth profiles. In general, species specializing on krill as a food resource showed the highest degree of distributional correlation with krill, and species using less than 50 % krill in their diets showed little evidence of distributional correlation with krill. Although significant, correlations at small spatial scales were weak, which we suggest, that although exacerbated by sampling biases, was primarily due to d~fficulties seabirds have in locating and tracking krill swarms Further, we suggest that these difficulties result in (1) most krill swarms being unexploited at any given time, (2) a few very large swarms being disproportionately important to seabirds, and (3) krill densities being a poorer predictor of seabird densities than vice versa.
INTRODUCTION
Seabird ecologists expect a strong correlation between the distributions of seabirds and their prey over a wide range of spatial and temporal scales for at least 2 reasons. First, seabird biomass is often high in habitats with high prey biomass (e.g. polar seas, conti- nental shelf breaks, current boundaries, gyres and tidal rips; see Brown 1980, Hunt & Schneider 1987). Second, at least at large colonies, there may be strong intra-
' Present address. Manomet Bird Observatory, Manomet, Massachusetts 02345, USA
specific competition for food (Furness & Birkhead 1984, Hunt et al. 1986), which would favor efficient location and tracking of prey. However, a strong correlation between seabirds and their prey rarely has been documented, because of the difficulty in simultane- ously measuring their distributions. Two studies of predators that specialize on one or few prey types showed that the density of seabirds was an indicator of the likelihood of the presence of prey, but not of prey density (Obst 1985, Safina & Burger 1985). Studies of alcids preying on capelin are the only ones to have reported a correlation between the densities of marine avian predators and their prey (Piatt & Methven 1986,
@ Inter-Research/Printed in F. R. Germany
4 Mar. Ecol Prog. Ser. 58 3-16, 1989
Schneider & Piatt 1986, Cairns & Schneider in press). In contrast, Woodby (1984) found that murre distributions were unrelated to fish distributions, and only crudely related in 1 of 2 yr to zooplankton distributions.
The Antarctic offers a nearly ideal ecosystem in which to examine the degree of correlation between the abundance of seabirds and their prey. Krill, prima- rily Euphausia superba, is a rich and widespread food resource for seabirds (Marr 1962, Everson 1977, Macauley 1983). There is a large diversity of seabirds that feed exclusively or primarily on krill (Croxall et al. 1985). Recent advances in hydroacoustic survey methods (Macauley 1978, Everson 1983, Macauley et al. 1984) permit continuous, quantitative measurement of density and vertical distribution of krill, and, there- fore, simultaneous estimation of predator and prey densities.
Although the degree and form of correlation between seabird and krill distributions is of fundamental interest in understanding the dynamics of predator-prey interactions in the Antarctic marine environment, it also is important to the effective management and conservation of the species involved. The potential effects of the developing commercial fishery for krill in the Antarctic makes it important that we understand how the distribution and density of krill influences its use by seablrds.
We used numbers of all seabirds species observed simultaneously with acoustic estimates of krill density along transects in Bransfield Strait and southern Drake Passage to examine the correlation between the dis- tributions of marine birds and krill. Because variation in spatial and temporal scale is important to the rela-
tionship among different components of the marine environment (e.g. Haury et al. 1978, Schneider & Duffy 1985, Hunt & Schneider 1987, Murphy et al. in press), we examined the relationship between seabird densities, and the presence and density of krill over a variety of spatio-temporal scales.
METHODS
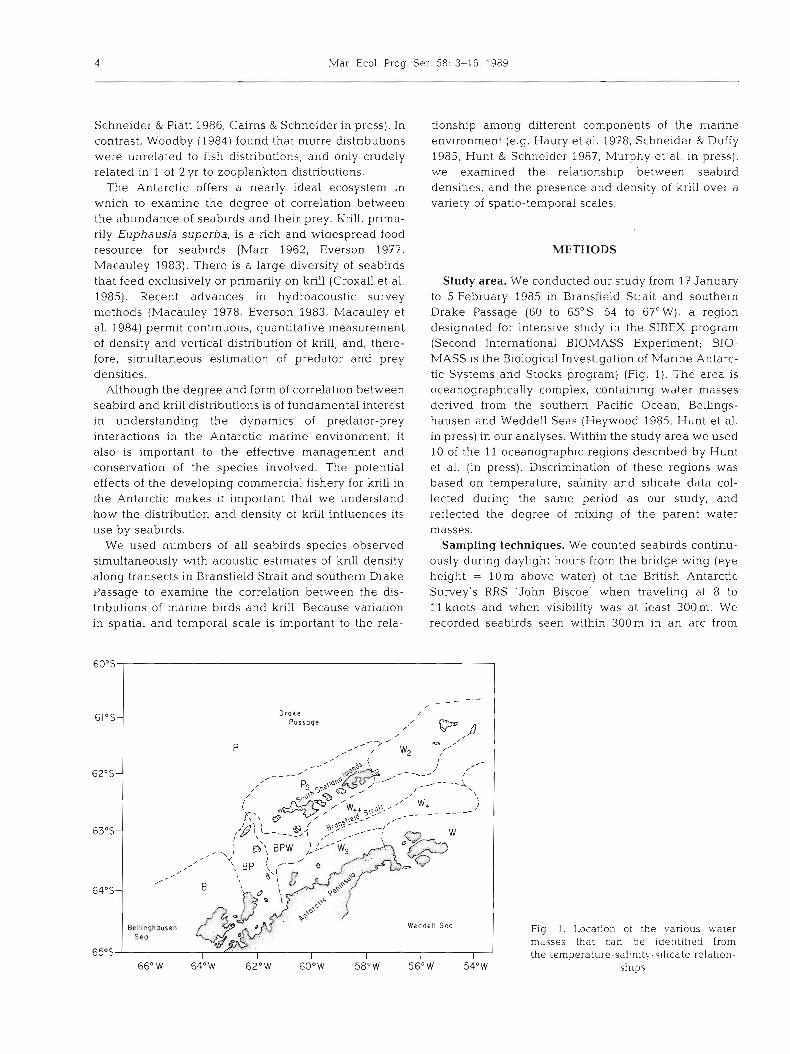
Study area. We conducted our study from 17 January to 5 February 1985 in Bransfield Strait and southern Drake Passage (60 to 65"S, 54 to 6f0W), a region designated for intensive study in the SIBEX program (Second International BIOMASS Experiment; BIO- MASS is the Biological Investigation of Marine Antarc- tic Systems and Stocks program) (Fig. 1). The area is oceanographically complex, containing water masses derived from the southern Pacific Ocean. Bellings- hausen and Weddell Seas (Heywood 1985, Hunt et al. in press) in our analyses. Within the study area we used 10 of the 11 oceanographic regions described by Hunt et al. (in press). D~scrimination of these regions was based on temperature, saLinity and silicate data col- lected during the same period as our study, and reflected the degree of mixing of the parent water masses.
Sampling techniques. We counted seabirds continu- ously during daylight hours from the bridge wing (eye height = 10m above water) of the British Antarctic Survey's RRS 'John Biscoe' when traveling at 8 to l l knots and when visibility was at least 300 m. We recorded seabirds seen within 300m in an arc from
D r a k e Possage
Fly 1 Location of the various water mcisses that can be ~ d e n t ~ f i e d from the temperature-salrn~t\ -s~licate relat~on-
66OW 6 4 " W 6 2 " W 6 0 ° W 5 8 " W 5 6 " W 54OW ships
Heinen~ann et al.: Distributions of seabirds and their prey 5
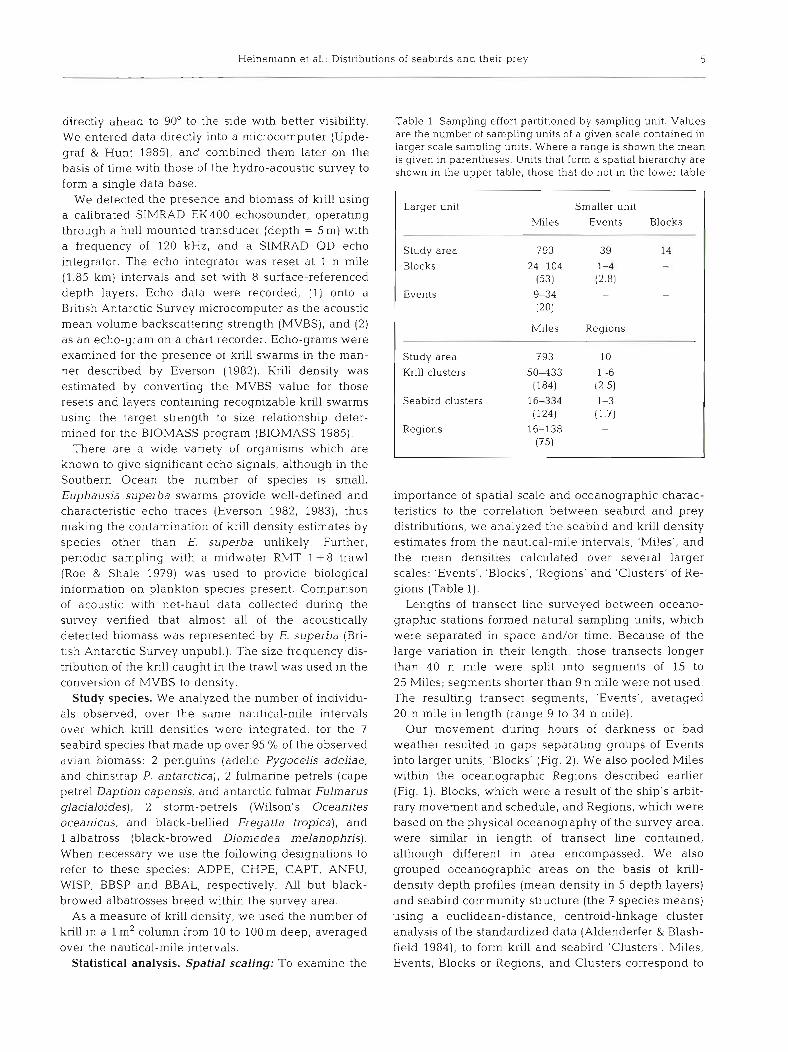
Larger unit Smaller unit
Miles Events Blocks
Study area 793 39 14
Blocks 24-104 1-4 - (53) (2.8)
Events 9-34 - - (20)
Miles Regions
Study area 793 10
Krill clusters 5 0 4 3 3 1-6 (1 84) (2.5)
Seabird clusters 16-334 1-3 (124) (1.7)
Regions 16-138 - (75)
directly ahead to 90' to the side with better visibility. Table 1 Sampling effort partitioned by sampling unit. Values
we entered data directly into a microcomputer (Upde- are the number of sampling units of a given scale contained in
graf & Hunt 1985,, and combined them later on the larger scale sampling units. Where a range is shown the mean is given in parentheses. Units that form a spatial hierarchy are
basis of time with those of the hydro-acoustic survey to S ~ O , V ~ in the upper table, those that do not in the lower table form a single data base.
We detected the presence and biomass of krill using a calibrated SIMRAD EK400 echosounder, operating through a hull-mounted transducer (depth = 5m) with a frequency of 120 kHz, and a SIMRAD QD echo integrator. The echo integrator was reset at 1 n mile (1.85 km) intervals and set with 8 surface-referenced depth layers. Echo data were recorded, (1) onto a British Antarctic Survey microcomputer as the acoustic mean volume backscattering strength (MVBS), and (2) as an echo-gran? on a chart recorder. Echo-grams were examined for the presence of krill swarms in the man- ner described by Everson (1982). Krill density was estimated by converting the MVBS value for those resets and layers containing recognizable krill swarms using the target strength to size relationship deter- mined for the BIOMASS program (BIOMASS 1985).
There are a wide variety of organisms which are known to give significant echo signals, although in the Southern Ocean the number of species is small. Euphausia superba swarms provide well-defined and characteristic echo traces (Everson 1982, 1983), thus making the contamination of krill density estimates by species other than E. superba unlikely. Further, periodic sampling with a midwater RMT 1 + 8 trawl (Roe & Shale 1979) was used to provide biological information on plankton species present. Comparison of acoustic with net-haul data collected during the survey verified that almost all of the acoustically detected biomass was represented by E. superba (Bri- tlsh Antarctic Survey unpubl.). The size frequency dis- tribution of the krill caught in the trawl was used in the conversion of MVBS to density.
Study species. We analyzed the number of individu- als observed, over the same nautical-mile intervals over which knll densities were integrated, for the 7 seabird species that made up over 95 O/O of the observed avian biomass: 2 penguins (adelie Pygocelis adeliae, and chinstrap P. antarctica), 2 fulmarine petrels (cape petrel Daption capensis, and antarctic fulmar Fulmarus glacialoides), 2 storm-petrels (Wilson's Oceanites oceanicus, and black-bellied Fregatta tropics), and l albatross (black-browed Diomedea melanophris). When necessary we use the following designations to refer to these species: ADPE, CHPE, CAPT, ANFU, WISP, BBSP and BBAL, respectively. All but black- browed albatrosses breed within the survey area.
As a measure of krill density, we used the number of krill in a l m2 column from 10 to 100 m deep, averaged over the nautical-mile intervals.
Statistical analysis. Spatial scaling: To examine the
importance of spatial scale and oceanographic charac- teristics to the correlation between seabird and prey distributions, we analyzed the seabird and krill density estimates from the nautical-mile intervals, 'Miles', and the mean densities calculated over several larger scales: 'Events', 'Blocks', 'Regions' and 'Clusters' of Re- gions (Table 1).
Lengths of transect line surveyed between oceano- graphic stations formed natural sampling units, which were separated in space and/or time. Because of the large variation in their length, those transects longer than 40 n mile were split into segments of 15 to 25 Miles; segments shorter than 9 n mile were not used. The resulting transect segments, 'Events', averaged 20 n mile in length (range 9 to 34 n mile).
Our movement during hours of darkness or bad weather resulted in gaps separating groups of Events into larger units, 'Blocks' (Fig. 2). We also pooled Miles within the oceanographic Regions described earlier (Fig. 1). Blocks, which were a result of the ship's arbit- rary movement and schedule, and Regions, which were based on the physical oceanography of the survey area, were similar in length of transect line contained, although different in area encompassed. We also grouped oceanographic areas on the basis of krill- density depth profiles (mean density in 5 depth layers) and seabird community structure (the 7 species means) using a euclidean-distance, centroid-linkage cluster analysis of the standardized data (Aldenderfer & Blash- field 1984), to form krill and seabird 'Clusters'. Miles, Events, Blocks or Regions, and Clusters correspond to

6 mar Ecol. Prog. Ser. 58: 3-16, 1989
D r o k e Possage
lower coarse-, coarse-, upper coarse- to lower meso-, and meso-scale areas, sensu Haury et al. (1978), re- spectively.
Although we expected the basis for any association between bird patches and krill swarms to exist at spa- tial scales of 10's to 100's of meters (fine scale, sensu Haury et al. 1978), we were obliged by the constraints of the krill hydro-acoustic survey to use Miles as the smallest spatial-analysis scale. Events and Blocks were constructed because, (1) the spatio-temporal separation between adjacent units produced independent sam- ples, a condition that could not be achieved with the Miles data except through a posteriori sub-sampling, and (2) their placement was independent of any oceanographic features. Miles, Events and Blocks were used to provide an unconfounded measure of the degree of seabird-krill correlations at 3 different scales, and w e constructed Regions and Clusters to determine the added influence of oceanographic features on the correlations.
Measurement scaling and testing: Because there is a large variance in seabird and krill densities in space and time, a difference in mean density of a n order of magnitude is more likely to be biologically meaningful than a few percent or even 2-fold difference. Therefore, we used a logarithmic, rather than arithmetic, scale for presentation of data and some analyses. In several analyses we transformed the data to rank or nominal scales to meet the assumptions of the stat~stical tests used. All statistical tests and analyses were completed using SYSTAT (Wilkinson 1986). Except where stated otherwise all tests were 2-tailed.
Mile scale: We analyzed 2 statistically independent
Fig. 2. Location of SIBEX transects lines and sampling Blocks
components of the correlation between predator and prey distributions: 'spatial' and 'numerical' concord- ance. Spatial concordance or association (technically, nominal association), defined as the degree to which seabird and krill presence are related, was measured only at the Mile scale because krill were always pre- sent in larger sampling units. Numerical concordance (technically, conditional ordinal association), defined as the degree to which the ranks of numbers of seabirds and krill are related, given that both are present, was measured using only those Miles with seabirds and krill present. We will use the terms 'spatial concord- ance' and 'association' synonymously.
We were unable to use the entire data set for testing, because density estimates of seabirds and krill were significantly autocorrelated at the mile scale. Based on the observed extent of temporal autocorrelation, we selected every third Mile to produce 3 systematic, serially, although not mutually, independent samples. Alternative approaches to this problem can be found in Schneider & Piatt (1986) and Schneider et al. (1987). For each species, we chose one subsample at random to use for significance testing of spatial and numerical concordance. At scales larger than M~les , temporal autocorrelations of mean densities of seabirds or krill were not significant.
To estimate spatial concordance between a given seabird species and krill we calculated the Phi-coeffi- cient (Conover 1980), a measure of association for a 2 X 2 contingency table, for Mile data expressed as absence or presence, within the randomly selected, serially independent subsamples of Miles. We chose the Phi-coefficient rather than the tradit~onal or G-
Heinemann et al.: Distributions of seabirds and their prey
statistics, because Phi is identical to a Pearson product- moment correlation coefficient (PPMCC) calculated from presence-absence data expressed as l ' s and O's, and, thus, Phi could be more appropriately compared with the results of our other analyses (see below).
To estimate numerical concordance, within the sub- samples, we calculated Spearman rank correlations, which are mathematically identical to PPMCC's calcu- lated on rank-transformed data; PPh4CC's were not used on the continucius data because we were unable to find a transformation that allowed their testing. Tests of numerical concordance were l-tailed, because the extreme mobility of seabirds relative to krill makes it unlikely that the depletion of prey by seabirds would lead to negative predator-prey correlations.
High densities: Because spatial and numerical con- cordance may manifest itself only above some threshold in seabird and/or krill density, we repeated our analyses using only Miles with both seabirds and krill, and coding Miles with 'high densities' as l ' s and those without as 0's. The 'high density' thresholds were chosen to reflect discontinuities in the distributions of density and to produce adequate numbers of Miles with high densities for analysis. For krill and most seabird species, thresholds were between the 86"' and 91'' percentiles of their abundance-frequency distribu- tions. However, for adelie penguins and black-browed albatrosses a scarcity of values greater than 1 required us to use the 96'h percentile, which corresponded to the lowest possible count threshold, 2.
We also assessed the association of high densities of seabirds and krill at the Event scale by coding each Event as a '1' if it contained any Miles with high densities of the given species and a '0' if not. At this scale, thresholds as large or slightly larger than those in the Mile-scale analysis were used to give roughly equal numbers of l ' s and 0's.
Overall correlation: For most scales, the overall cor- relation between seabirds and prey was estimated with PPMCC's of the log-transformed data. We assessed the significance of the overall correlations at the Mile scale by combining probabilities from the statistically inde- pendent tests of spatial and numerical concordance (Sokal & Rohlf 1981). The direct approach of testing the overall PPMCC's within the subsamples, while control- ling the 'experimentwise' error rate, was not used because it was more involved and gave the same results as combining probabilities.
Densities above the Mile scale were means of the Mile densities pooled within larger sampling units. Therefore, the appropriate tests at the larger scales were of differences from the underlying correlations at the Mile scale, not of differences from zero. For these tests, p-values were obtained by comparing observed coefficients with null distributions of correlation coeffi-
cients obtained through repeated randomizations of the data. Randomizations involved assigning Mile unlts randomly to the larger sampling units (e.g. Events), calculating means of the log-transformed data, and computing a PPMCC from the means.
Large aggregations: We encountered 2 very large aggregations of seabirds and krill. The first, in Region W:! (Fig. l) , contained 62 %, each, of all cape petrels and antarctic fulmars recorded during the study. The second, in Region W,, contained 75 % of all adelie penguins (Hunt et al. 1985). These large aggregations were associated with, respectively, the third and first largest concentrations of krill encountered during the survey. Because these aggregations provided extreme values for these species and resulted in a potential distortion of the more general pattern of the relation- ships between seabirds and krill, most analyses were repeated without the data from these aggregations.
RESULTS
Mile scale
Spatial concordance
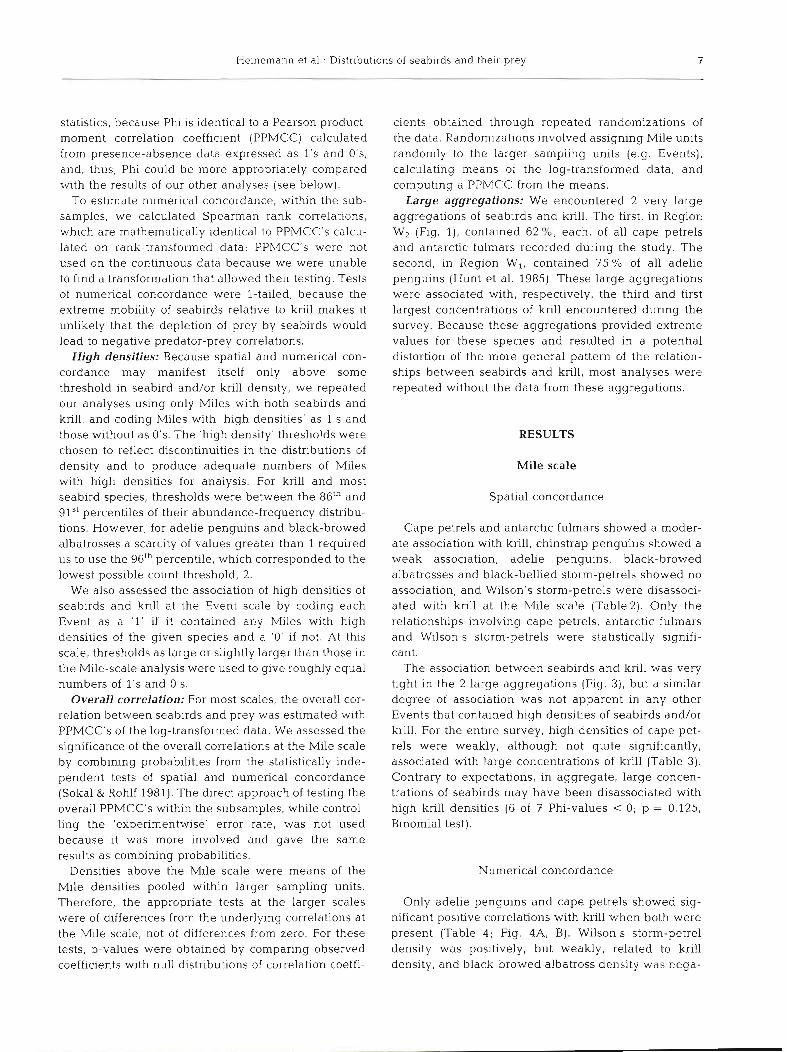
Cape petrels and antarctic fulmars showed a moder- ate association with krill, chinstrap penguins showed a weak association, adelie penguins, black-browed albatrosses and black-bellied storm-petrels showed no association, and Wilson's storm-petrels were disassoci- ated with krill at the Mile scale (Table 2 ) . Only the relationships involving cape petrels, antarctic fulmars and Wilson's storm-petrels were statistically signifi- cant.
The association between seabirds and krill was very tight in the 2 large aggregations (Fig. 3), but a similar degree of association was not apparent in any other Events that contained high densities of seabirds and/or krill. For the entire survey, high densities of cape pet- rels were weakly, although not quite significantly, associated with large concentrations of krill (Table 3). Contrary to expectations, in aggregate, large concen- trations of seabirds may have been disassociated with high krill densities (6 of 7 Phi-values < 0; p = 0.125, Binomial test).
Numerical concordance
Only adelie penguins and cape petrels showed sig- nificant positive correlations with krill when both were present (Table 4; Fig. 4A, B). Wilson's storm-petrel density was positively, but weakly, related to krill density, and black-browed albatross density was nega-

8 Mar. Ecol. Prog. Ser 58: 3-16, 1989
Table 2. Spatial concordance between seabirds and krill, at the Mile scale. Diagnostic estimates of seabird and krill presence, Columns 2 and 3, were compiled using the entire data set. Statistical tests were made using the randomly selected, systematic,
serially independent subsamples. The association test reflects the difference between Columns 2 and 3
Percentage of Miles with birds Degree of Association Out of miles Out of miles Phi-coef. p-valueb without krill with krill
ADPE CHPE C APT ANFU BBAL WISP BBSP
a See 'Methods' for species abbreviations 2-tailed
" Distance Along T r a n s e c t
(naut ical m ~ l e s ) -
- 1500
ZI- - W .- - m .- = E
- l 0 0 0 5 .S .- - .%g = c
- 5 0 0 , g g ; 4 ,
0 Distance Along Tronsect
( n a u t i c a l m i l e s ] - 0 -
150
Fig. 3. Densities of seabirds and krill in the large aggregations of adelie pen- guins, and cape petrels and antarctic ful- mars. Bars represent mean density of sea- birds or krill in slngle nautical-mile inter- vals of transect line. These aggregations occurred in Blocks D and C, respectively
Table 3. Spatial concordance between high densities of seabirds and krill, at the Mile scale. Diagnostic estimates of the presence of hlgh densities of seabirds and knll, Columns 2 and 3, and statistical tests were made using the entire data set. The association
test reflects the difference between Columns 2 and 3
Speciesa Percentage of miles with high seabird density Degree of association Out of miles without Out of miles with high Phi-coef. p-valueb
hlgh krill density kril.1 density
ADPE CHPE CAPT ANFU BBAL WISP BBSP
See 'Methods' for species abbreviations 2-tailed

Heinemann et al.: Distributions of seablrds and their prey 9
Table 4. Numerical concordances between seabirds and krill, overall, and between high densities of seabirds and krill, at the Mile scale. Concordances are Spearman rank correlations calculated from Miles with seabirds and krill present. Spearman rank correlations for all Miles are shown for comparison (see Table 6 for a test of statistical significance). Sample sizes are given in
parentheses
Species'" Miles with seabirds and kr~ll All miles Overall Hlgh densities
C ~ r r . ~ Corr. p-valueb Corr p-value'
ADPE -0.01 0.60 0.04 0.70 0.10 (10) (5)
CHPE 0.10 0.06 0.30 0.09 > 0.20 (75) (191
CAPT 0.27 0.22 0.01 0.34 0.05 (116) (25)
ANFU 0.20 0.04 0.34 0.37 0.06 (114) (19)
BB AL 0.00 -0.27 > 0.50 - -
(45) (1) WISP -0.12 0.12 0.15 0.04 , 0.50
(102) (17) BBSP 0.01 0.00 0.50 0.62 0 04
(69) (9)
" See 'Methods' for species abbreviations Sample size = 793
c l-tailed
tively dependent on krill density (Flg. 4C). However, high densities of seabirds or krill, excluding Miles that except for adelie penguins, the explained variances of did not have both seabirds and krill. Numerical concor- these correlations were extremely small. dances among Miles with high densities were higher
We repeated these comparisons for those Miles with than those for the full data set for most species, and
- .- - C). l I 10 loo
t , : U
0 . . . . m _C
- D l . ' " 7 " - .
ol I 10
Fig. 4. Numerical concordances of (A) adelie penguins, (B) cape petrels and (C) black-browed albatrosses, and krill at the
Mile scale
Seoblrd Density (number/noutlcal mile)
Fig. 5. Relationship between seabud density and the pro- portion of Mile intervals with krill present at densities greater than zero to), greater than zero and less than 1.5 ( A ) , and greater than 1.5 krill m-2 (0). See 'Methods' for species ab-
breviations

10 Mar Ecol Prog. Ser 58- 3-16, 1989
Table 5. Overall correlations of seabirds and krill by spatial scale. Values are Pearson product-moment correlation coefficients calculated from data on a logarithmic measurement scale. For the Mlle scale, p-values were obtained by combining probabilities from the tests of the 2 independent components of overall correlation, spatial and numerical concordance. Other p-values are for
tests of difference from the Mlle-scale correlations, and were obtained by randomization (see text). All tests were 2-tailed
Species ' Spatial scale Mile Event Block Region Seabird cluster Krill cluster
ADPE 0.18 0.07 -0.16 -0.09 -0.37 -0.99' ' CHPE 0.08 0.29 0.4 1 0.60 0.83' 0.81 CAPT 0.24. " 0.63' ' 0.69+ 0.60 0.68 0.92 ANFU 0.16' ' 0.45 0.5gf 0.53 0.84 0 99' BBAL -0.03 0.08 0.01 -0.07 0.34 -0.34 WISP -0.08+ -0.24 -0.29 -0.60 -0.75 -0.68 BBSP -0.04 0.01 -0.08 0.28 0 70 0.55
" See 'Methods' for species abbreviations +p<O.lO, ' ~ ~ 0 . 0 5 , " p<O.Ol, " ' p<O.OOl
significant, or nearly significant, between krill and adelie penguins, cape petrels, antarctic fulmars and black-browed albatrosses (Table 4 ) .
Using an approach that combined aspects of the spatial and numerical concordance (Obst 1985), we found that densities of cape petrels, antarctic fulmars, and chinstrap penguins at all but the highest densities were positively related to the probability of knll presence (Fig. 5A, B, C). For adelie penguins and black-browed albatrosses, the relationship only became positive with the inclusion of the highest densities of each species (Fig. 5D, E ) . Asin the spatial-association analysis, there was a negative rela- tionship between Wilson's storm-petrels and krill (Fig. 5F). The strength of the foregoing relationships varied somewhat depending on the minimum density of krill used to define 'krill presence'.
Fig. 6 Overall correlation between (A) cape petrels and (B) antarctic fulmars, and krill at the Mile scale. Points are desig-
nated by their Block labels (see Fig. 2)
Overall correlation
Overall correlations at the Mile scale (Table 5) were significant (combined probabilities of tests of spatial and numerical concordance) and positive, although very low, for antarctic fulmars and cape petrels, and nearly significant and negative for Wilson's storm-pet- rels. All other species were uncorrelated with krill.
Event, Block and Region scales
Overall correlations between seabird and knll means at the Event, Block and Region scales were strong for several species, but the only correlations significantly, or nearly significantly, larger than the underlying Mile- scale correlations, were those for cape petrels at the Event and Block scales, and antarctic fulmars at the
Fig. 7 Overall correlation between krill and chinstrap pen- guins, at the Region scale. Points are designated by their
Region labels (see Fig. 1)
Heinemann et al.: Distributions of seabirds and their prey 11
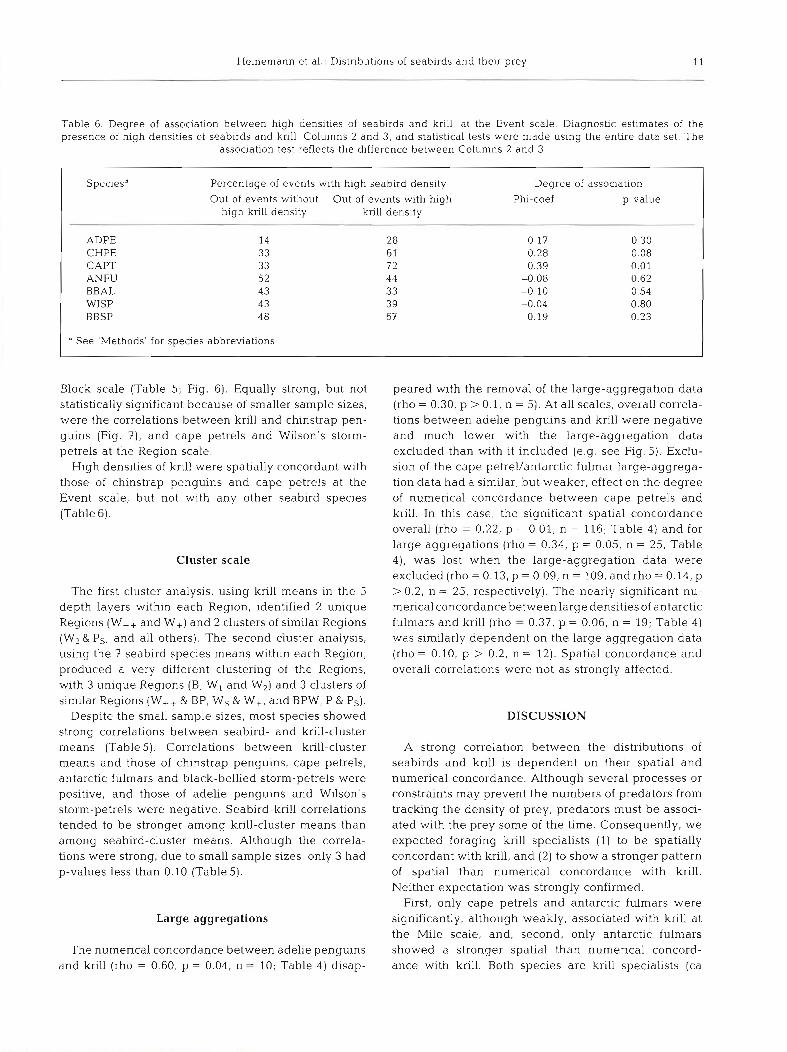
Table 6. Degree of association between high densities of seabirds and krill, at the Event scale. Diagnostic estimates of the presence of high densities of seabirds and krill, Columns 2 and 3, and statistical tests were made using the entire data set. The
assoclation test reflects the difference between Columns 2 and 3
ADPE CHPE CAPT ANFU BBAL WISP BBSP
Percentage of events with high seabird density Out of events without Out of events with high
high krill density krill density
14 28 33 6 1 33 7 2 52 4 4 43 33 43 39 48 67
" See 'Methods' for species abbreviations
Degree of association
Phi-coef. p-value
Block scale (Table 5; Fig. 6). Equally strong, but not statistically significant because of smaller sample sizes, were the correlations between krill and chinstrap pen- guins (Fig. 7), and cape petrels and Wilson's storm- petrels at the Region scale.
High densities of krill were spatially concordant with those of chinstrap penguins and cape petrels at the Event scale, but not with any other seabird species (Table 6).
Cluster scale
The first cluster analysis, using krill means in the 5 depth layers within each Region, identified 2 unique Regions (W++ and W+) and 2 clusters of similar Regions ( W Z & PS, and all others). The second cluster analysis, using the 7 seabird species means within each Region, produced a very different clustering of the Regions, with 3 unique Regions (B, W, and W2) and 3 clusters of similar Regions (W++ & BP, Ws & W + , and BPW, P & PS).
Despite the small sample sizes, most species showed strong correlations between seabird- and krill-cluster means (Tables). Correlations between krill-cluster means and those of chinstrap penguins, cape petrels, antarctic fulmars and black-bellied storm-petrels were positive, and those of adelie penguins and Wilson's storm-petrels were negative. Seabird-krill correlations tended to be stronger among krill-cluster means than among seabird-cluster means. Although the correla- tions were strong, due to small sample sizes, only 3 had p-values less than 0.10 (Table 5).
Large aggregations
The numerical concordance between adelie penguins and krill (rho = 0.60, p = 0.04, n = 10; Table 4) disap-
peared with the removal of the large-aggregation data (rho = 0.30, p > 0.1, n = 5). At all scales, overall correla- tlons between adelie penguins and krill were negative and much lower with the large-aggregation data excluded than with it included (e.g. see Fig. 5). Exclu- sion of the cape petrel/antarctic fulmar large-aggrega- tion data had a similar, but weaker, effect on the degree of numerical concordance between cape petrels and krill. In this case, the significant spatial concordance overall (rho = 0.22, p = 0.01, n = 116; Table 4) and for large aggregations (rho = 0.34, p = 0.05, n = 25, Table 4 ) , was lost when the large-aggregation data were excluded (rho = 0.13, p = 0.09, n = 109, and rho = 0.14, p > 0.2, n = 25, respectively). The nearly significant nu- merical concordance betweenlarge densities of antarctic fulmars and krill (rho = 0.37, p = 0.06, n = 19; Table 4) was similarly dependent on the large aggregation data (rho = 0.10, p > 0.2, n = 12). Spatial concordance and overall correlations were not as strongly affected.
DISCUSSION
A strong correlation between the distributions of seabirds and krill is dependent on their spatial and numerical concordance. Although several processes or constraints may prevent the numbers of predators from tracking the density of prey, predators must be associ- ated with the prey some of the time. Consequently, we expected foraging krill specialists (1) to be spatially concordant with krill, and (2) to show a stronger pattern of spatial than numerical concordance with krill. Neither expectation was strongly confirmed.
Flrst, only cape petrels and antarctic fulmars were significantly, although weakly, associated with krill at the Mile scale, and, second, only antarctic fulmars showed a stronger spatial than numerical concord- ance with krill. Both species are krill specialists (ca
12 Mar Ecol. Prog. Ser. 58: 3-16, 1989
85 % krill, by weight, in their diets; Croxall et al. 1985). Although they were the only species to show significant overall correlations with krill, the correla- tions were very weak at the Mile scale, with ~ ~ - v a l - ues of just 6 and 3 % , respectively. The absence of positive correlations between krill and black-bellied storm-petrels and black-browed albatrosses, which are not krill specialists (48 and 38 % krill, by weight, in their diets, respectively; Croxall et al. 1985), was consistent with our expectations. However, adelie and chinstrap penguins are extreme krill specialists (> 95 %, by weight, of their diets; Croxall & Furse 1980, Volkman et al. 1980, Croxall et al. 1985), but were not consistently correlated with krill. Finally, Wilson's storm-petrels, which appear to be krill specialists in the study area (85 %, by weight, in their diet; Obst 1985) but not in other areas (45% by weight, in their diet; Croxall et al. 1985), showed a negative correlation with krill.
In contrast to this study, other data from the Brans- field Strait region (Obst 1985), at a scale comparable to our Mile scale, showed that seabird and krill densities were uncorrelated. However, the relationships between the probability of krill being present and seabird density, a hybrid of spatial and numerical con- cordance, was positive and showed complete associa- tion above a threshold in seabird density, for some species. We found a similar positive relationship between seabird density and the probability of the presence of krill for some of the same species, but we did not find the complete association of krill with high densities of seablrds. In both studies, seabird density appeared to be a much better predictor of krill density than vice versa. However, we found that this asym- metry was, at least in part, a statistical artifact of more Miles having krill present than having seabirds pre- sent.
The strong association of birds and krill in the 2 large aggregations (Fig. 3) similarly suggests that the linkage between krill and cape petrels, antarctic fulmars and adelie penguins is strongly expressed only above a threshold in seablrd, or perhaps krill., density or bio- mass. That a similar process may affect chinstrap pen- guin distributions is suggested by the significant corre- lation between high densities of this species and krill, versus the lack of a correlation in the entire data set.
Effects of scale
Interpretation of predator-prey distributional correla- tions at d~fferent scales requires consideration of spatial and temporal scales at which the processes affecting those distributions operate (Hunt & Schneider 1987, Croxall et al. in press, Murphy et al. i.n press).
The densities of seablrds within areas the size of the larger Regions or Clusters of Regions, at least during the breeding season, should reflect long-term mean krill densities, but not necessarily krill density within a given year or season. Seabird density should show relatively little inter-annual variation because at-sea density at this scale is largely a function of breeding colony size, which changes slowly because of the con- servative life history characteristics of seabirds (e.g. slow maturation, strong philopatry, low fecundity and long life-spans). In contrast, because large-scale currents and gyres witbin the Southern Ocean can carry krill through Region-scale areas in a few weeks (Priddle et al. in press), changes in krill density at the Region scale can be rapid and independent of pro- cesses operating within the individual Regions.
Blocks and the smaller Regions are the size of major portions of the foraging ranges of nesting seabirds, and seabird density within such areas should reflect krill density when local hydrographic features (e.g. current rates, gyres) promote an increased concentration of krill for a long enough time to allow foraging seabirds to maintain contact with krill. If contact can be main- tained or predictably re-established, then, over days or weeks, the number of seabirds exploiting a krill con- centration should come to reflect the amount of krill available (Obst 1985). Otherwise, krill concentrations at this scale often will be found in association with few or no seabirds.
At the smallest scales, Events to Miles, the associa- tion of seabirds and krill may depend on [actors such as krill depth and water turbidity, and should have a large stochastic element. The matching of seabird density to swarm size should be dependent on the speed of response of other seabirds to the seabirds that have discovered the swarm, and on the length of time the swarm remains available. Thus, distance from colony and time of day, among other factors, should be important. There should be a positive relationship between swarm size and the swarm availability, and we suspect that this relationship is important in pro- ducing threshold responses by seabirds to krill de- nsities.
All species showed large changes in the degree of correlation with krill across the range of scales examined, but the pattern of change varied among species. We expected seabird-krill correlations to increase with scale as the environment's stochastic influence on spatial concordance was ameliorated, but, possibly to decrease at the largest spatial scales due to the discrepancy in the amount of temporal variation in seabird and krill numbers. As pred~cted, correlations increased for 3 of the 5 krill specialists (cape petrel, antarctic fulmar and chinstrap pengum) as scale increased from Miles to Blocks. The increase in the

Heinernann et al . : Distnbul :ions of seabirds and their prey 13
disassociation of Wilson's storm-petrels may have indi- cated a similar process going on with respect to some prey type that had a distribution complementary to that of krill. On a linear measurement scale, which emphasizes the effect of high densities, the correlation of adelie penguins and krill was strongly positive and increased with spatial scale due to the influence of the large-aggregation data. The apparently contradictory trend toward a negative correlation between adelie penguins and krill with increasing spatial scale for the entire data set on a logarithmic scale (Table 5), was due to the dilution of the effect of the large-aggregation data as it was averaged with increasing amounts of the 'background' data, which showed a negative cor- relation.
Effects of oceanographic characteristics
Differences in correlation between the similar Block and Region scales can be attributed less to differences in size than to the degree to which seabirds and krill respond similarly to water mass characteristics, or to the degree seabirds can use water-mass characteristics to locate areas with above-average krill density. We found little evidence that water masses, as charac- terized by their temperature and chemistry, exerted a strong influence on the joint distributions of seabirds and krill. Most species were similarly correlated with krill at the Block and Region scales, although chinstrap penguins and black-bellied strom-petrels (positive), and Wilson's storm-petrels (negative) showed moder- ately stronger correlations at the Region scale.
Similar responses by some seabird species to krill should lead to characteristic seabird assemblages in areas of relatively uniform krill availability. As expected, the mean densities of seabirds and krill were correlated more strongly at the scale of Clusters of Regions with similar seabird communities than at Block or Region scales, for several species. This pattern was most strongly exhibited by 3 of the 4 species, chinstrap penguin, antarctic fulmar and black-bellied storm-pet- rel, characteristic of Region WP, which contained the antarctic fulmar/cape petrel large aggregation and a high 'background' level of krill.
In addition, if the daytime depth of krill swarms strongly influences krill availability to seabirds, then areas with similar knll depth-profiles should have simi- lar seabird densities. This was strongly borne out by the strong seabird-krill correlations among krill Clusters. The WP-PS Cluster, as well as being rich in krill, was characterized by the most even distribution of krill over the full depth range, which may explain the dominance of its seabird community by 2 abundant surface feeders that specialize in krill (cape petrel and antarctic fulmar)
and the common chinstrap penguin, a diving species that feeds exclusively on krill.
Sampling problems
We conclude that even those seabirds that specialize on krill are only occasionally found in immediate association with krill, and at most scales their numbers are only moderately correlated with the density of krill. Although this view is qualitatively realistic, the lack of a strong predator-prey distributional correlation at the small scales may have been exaggerated, especially at smaller spatial scales, by several sources of bias and error inherent in the sampling techniques available to us.
Because we counted seabirds during the day and some seabird species feed, perhaps predominantly, at night (Imber 1973, 1976, Lishman & Croxall 1983, Croxall et al. 1988), we may have missed the periods when seabird and krill distributions were most concor- dant. Although the effect of time of day on the degree of concordance was not examined in this study, we were unable to find any such effect in a similar analysis of seabirds and krill around Bird Island, South Georgia (G. L. Hunt unpubl.).
Ideally, we would have preferred to analyze the density of feeding individuals, a s we did not expect the distributions of commuting or resting seabirds to be concordant with that of krill. However, we used total numbers, as it was rarely possible to distinguish forag- ing from other behaviors, and because the limited data we obtained on potentially foraging individuals did not indicate any stronger concordance than was obtained using total numbers. We suspect that the inclusion of the probably large number of observations of non- foraging individuals, which should have been distri- buted independently of krill, contributed to the low concordances at the Mile scale.
We may have missed correlations between surface- feeding seabirds and krill that remained in the surface waters during the day, because we were unable to measure krill density above 10 m in depth. Krill swarms have been observed close to the surface by day (e.g. Marr 1962). However, krill are rarely caught in surface nets (British Antarctic Survey unpubl.), although this may be caused more by daytime avoidance than by a genuine absence of krill from the surface layer (Ever- son & Bone 1986a). Sampling with a towed upward- directed transducer during this study (Everson & Bone 1986b) indicated that krill swarms were not present at the surface during daylight. Further, surface plankton hauls with a Gulf 111 high-speed tow net towed at 10 knots during this study rarely caught krill (British Antarctic Survey unpubl.) .
14 Mar Ecol. Prog. Ser. 58. 3-16, 1989
Foraging constraints
With the elimination of all sampling biases, we sug- gest that the small-scale correlation between foraging seabirds and krill would still be far from perfect (Obst 1985, Schneider & Piatt 1986). First, the choice of forag- ing area, which will strongly affect the probability of encountering krill swarms, should depend on experiences g a ~ n e d on previous foraging trips, deduc- ing the success of other individuals, and information gathered on the current trip. Time lags and inac- curacies associated with these processes, coupled with the mobile and ephemeral nature of krill swarms may result in seabirds often choosing poor foraging areas. Second, the location of krill swarms within a foraging area is undoubtedly difficult because they are rarely visible from the surface. Although some seabirds can locate food on the surface by olfaction, we do not know if subsurface prey can be detected by this or other indirect techniques. Third, the tracking of krill density or biomass should depend on the duration of krill availability. We expect the duration of knll availability to depend on factors outside the control of the preda- tors and have a large stochastic component, and, there- fore, to be largely unpredictable by predators. Thus, a numerical concordance between seabirds and krill may be expected at only the largest and most stable krill swarms, which should lead to a threshold relationship between seabird and krill density or biomass. Krill densities were low in this study compared to other krill surveys in the same area (e.g. Macauley 1983, Obst 1985), which may have contributed to low seabird-krill correlations for those species whose distributions show a threshold response to krill.
Importance of large aggregations
Studies of the oceanographic features and krill popu- l a t i o n ~ in the Bransfield Strait area have shown that krill are advected to the area by several major currents (Antarctic Circumpolar, Antarctic Coastal, and Wed- dell Sea Gyre; Everson 1977, Hampton 1985). The complex bathymetry of the strait and opposing currents may circulate krill predictably through some areas, or entrain and concentrate krill in gyres in others (Everson & Murphy 1987). The large-scale correlations detected in this study may occur because colony sizes are pro- portional to the predictability of nearby currents or gyres that bring or concentrate krill (Obst 1985, Croxall et al. in press).
The presence of most of the individuals of 3 of the 5 krill specialists in 2 feeding aggregations may indicate that large krill swarms are very important to the overall energy budget of the populations of these species. We
suspect that some suite of oceanographic features led to the aggregation and cohesion of krill swarms for a penod of at least several days, thus permitting the accumulation of large numbers of seabirds. The antarc- tic fulmar/cape petrel large aggregation occurred adja- cent to an area which was documented to contain a stationary gyre a few weeks later (R. B. Heywood pers. comm.). Although the gyre had an elevated phytoplank- ton biomass (Heywood & Priddle in press), concen- trations of krill appeared to move rapidly through this area without being entrained within the gyre (Everson & Murphy 1987). The large aggregation of adelie pen- guins occurred in Antarctic Sound, a n area where Wed- dell Sea Surface Water is funnelled through narrow passes, a process that may function to concentrate krill (Uda & Ishino 1958, Bogdanov et al. 1969, Alldredge &
Hamner 1980, Hamner & Hauri 1981, Everson 1984). If such patches are as important as we expect, despite their apparent rarity, then the poor overall correlation recorded in this study may result from the fact that most seabirds spend much of their time searching for or in transit to and from such patches. This was most probably the case with adelie penguins in this study.
Predator-prey surveys and conservation
Our view of the manner and efficiency with which seabirds are able to exploit krill, and of the importance of large aggregations of krill to seabird populations, has important implications for the further study of seabird- prey interactions and the conservation of Antarctic seabirds. First, most of the covanationin seabird and prey distributions may be noise with respect to the bulk of the energy flow in the system. This implies that surveys broad in spatial scale, but narrow in temporal scale, such as this study, may be destined to record apparently poor correlations between predators and prey Everson & Murphy (1987) caution against the use of such surveys because of the rapid flux of krill through the Bransfield Strait, which makes the estimation of krill abundance by repeated transects across the flow (a survey design broad in temporal but narrow in spatial scale) more efficient. Assessment of the interactions among predators and prey, and their consequences to the CO-distributions of preddtors and prey, in general, may require intensive long-term surveys in one region. However, surveys such as the one reported here are required to identify the areas and times in which more intensive studies should be conducted. Second, if large aggregations of krill are crucial to the reproductive output of krill specialists, then our understanding of the factors leading to and maintain- ing such swarms is vital in light of the fact that it is just these swarms that are targeted by the ever expanding krill fishery in Antarctica.

Heinen~ann et al.. Distribu ~tions of seabirds and their prey 15
Acknowledgements. We thank the Captain, officers and crew of the RRS 'John Biscoe' for support in the field. R. Veit shared equally in the collection of seabird data. A. Wood and C. Mitchell assisted significantly in data management and analy- sis. R. Ve~t , E. Flint, D. Schnelder and 3 anonymous reviewers provided valuable comments on this manuscript. Financial support was provided by the Natural Environmental Rrsearch Council to the British Antarctic Survey, and by the National Sclence Foundation, Grant No. DPP-8318464, to G. L. Hunt.
LITERATURE CITED
Aldenderfer, M. S., Blashfield, R K. (1984) Cluster analysis. Sage Publications, Beverly Hills
Alldredge, A. L., Hamner, W. M. (1980). Recurring aggrega- tion of zooplankton by a tidal current. Estuar. cstl mar. Sci. 10: 31-57
BIOMASS (1985). Report on Post-FIBEX Acoustic Workshop, Frankfurt (FRG). Sept., 1984. BIOMASS Report Series No. 40
Bogdanov, M. A. , Oradovskiy, S G. , Solyankin, V., Khvatskiy, N. V (1969). On the frontal zone of the Scotia Sea. Oceanology 9: 777-783
Brown, R. G. B. (1980). Seabirds as marine animals. In: Burger, J . , Olla, B., Winn, H. E. (eds.) Behavior of marine animals. Vol. 4, Marine birds. Plenum Press, New York, p. 1-39
C a m s , D. K.. Schneider, D. C. (in press). Hot spots in cold water: feeding habitat selection by Thick-billed Murres. In: Sealy, S. G. (ed ) Alcids at sea. Pacific Seabird Group
Conover, W. J. (1980) Practical nonparametric statistics. Wiley & Sons, New York
Croxall, J. P., Furse, J. R. (1980). Food of Chinstrap Penguins Pygoscelis antarctica and Macaroni Penguins Eudyptes chrysolophus at Elephant Island, South Shetland Islands. Ibis 122: 237-245
Croxall, J. P., Prince, P. A., Ricketts, C. (1985). Relationships between prey life-cycles and the extent, nature and timing of seal and seabird predation in the Scotia Sea. In. Sieg- fned, W. R.. Condy, P. R., Laws, R. M. (eds.) Antarctic nutrient cycles and food webs. Springer-Verlag. Berlin, p. 516-533
Croxall, J . P., Davis, R. W. , O'Connell, h4 J. (1988). Diving patterns in relation to diet of Gentoo and Macaroni Pen- guins at South Georgia. Condor 90: 157-167
Croxall, J . P., McCann, T. S. , Prince, P. A., Rothery, P. (in press). Reproductive performance of seabirds and seals at South Georgia and Signy Island, South Orkney Islands, 1976-1986: implications for Southern Ocean monitoring studies. In: Sahrhage, D. (ed.) Antarctic ocean and resour- ces variability. Springer-Verlag, Berlin. p. 261-285
Everson, 1. (1977). The living resources of the Southern Ocean. Southern Ocean Fisheries Service Program, Food and Agriculture Organization of the United Nations, Rome
Everson, I. (1982). Diurnal variat~ons in mean volume back- scattering strength of an Antarctic krill (Euphausia superba) patch. J. Plankton Res. 4: 155-162
Everson, I . (1983). Estimation of krill abundance. In: On the biology of krill Euphausia superha. Ber. Polarforsch. 4: 156-168
Everson, 1. (1984). Marine interactions. In: Laws, R. M. (ed.) Antarctic ecology. Academic, London, p. 783-819
Everson, I . , Bone, D. G (1986a). Effectiveness of the RIVIT8 system for sampling krill (Euphausia superba) swarms. Polar Biol. 6: 83-90
Everson, I . , Bone, D. G. (1986b). Detection of krill (Euphausia superba) near the sea surface: preliminary results using a towed upward-looking echo-sounder Br. Antarct. Surv. Bull 72: 61-70
Everson, I . , Murphy, E. (1987). Mesoscale variability in the distribution of krill Euphausia superba. Mar Ecol. Prog. Ser. 40: 53-60
Furness, R. W., Birkhead, T R. (1984). Seabird colony distribu- tions suggest competition for food supplies during the breeding season. Nature, Lond. 331: 655-656
Hamner, W. H., Hauri, I. R. (1981). Effect of island mass: water flow and plankton pattern around a reef in the Great Barrier Reef lagoon, Australia. Limnol. Oceanogr 26: 1084-1 102
Hampton, 1. (1985). Abundance, distribution and behavior of Euphausia superba in the Southern Ocean between 15' and 30°E during FIBEX. In: Siegfned, W. R., Condy, P R. , Laws, R. M. (eds.) Antarctic food cycles and food webs. Springer-Verlag, Berlin, p. 294-303
Haury, L. R., McGowan, J A., Wiebe, P. H (1978). Patterns and processes in the time-space scales of plankton dis- tributions. In: Steele. J. H. (ed.) Spatial pattern in plankton communities. Plenum, New York, p. 277-327
Heywood, R. B. (1985). Environmental conditions in the Antarctic Peninsula area of the Southern Ocean during the Anglo-German Joint Biological Expedition. February 1982. Meeresforsch. 30: 220-239
Heywood, R. B., Priddle, J . (in press). Retention of phytoplank- ton by an eddy. Cont Shelf Res.
Hunt, G. L., Eppley, Z. A., Schneider, D. C. (1986). Reproduc- tive performance of seabirds: the importance of population and colony size Auk 103: 306-317
Hunt, G . L., Everson, I . , Veit, R. R , Heinemann, D. (1985). Distribution of marine birds and their prey in Bransfield Strait and southern Drake Passage. Antarct. J. U.S. 19: 166-168
Hunt, G. L., Heinemann, D., Veit, R. R . , Heywood, K. B., Everson, I. (in press). The distribution, abundance and community structure of marine birds in southern Drake Passage and Bransfield Strait, Antarctica. Cont. Shelf Res.
Hunt, G L . , Schneider, D. C. (1987). Scale-dependent process- es in the physical and biological environment of marine birds. In: Croxall, J . P. (ed.) Seabirds, feeding ecology and role in marine ecosystems Cambridge Univ Press, Cam- bridge, p. 7-41
Imber. h4. J. (1973). The food of Grey-faced Petrels [Ptero- droma n~acroptera gouldi (Hutton)], with special reference to diurnal vertical migration of their prey J Anim. Ecol. 42: 645-662
Imber, M. J. (1976). Comparison of prey of the black Procel- laria petrels of New Zealand. N. Z. J1 mar Freshwater Res. 10: 119-130
Lishman, G. S., Croxall, J . P. (1983). Diving depths of the Chinstrap Penguin Pygoscelis antarctica. Br. Antarct. Surv. Bull. 61: 21-25
Macauley, M. C. (1978). Quantitative acoustic assessment of zooplankton standing stock. Ph.D. thesis, Univ. of Washington
Macauley, M. C. (1983). Antarctic krill (Euphausia superba) swarms from Elephant Island. Antarct. J . U.S. 13: 197-199
Macauley, M. C., English, T. S. , Mathisen, 0. A. (1984). Acoustic characterization of swarms of Antarctic krill (Euphausia superba) from Elephant Island and Bransfield Strait. J Crust. Biol. 4: 1 6 4 4
Marr, J . W. S. (1962). The natural history and geography of antarctic krill (Euphausia superba Dana). 'Discovery' Reps. 32: 3 3 4 6 4

16 Mar Ecol. Prog. Ser. 58: 3-16, 1989
Murphy, E. J., Morris, D. J., Watkins, J. L. , Priddle, J. (in press). Scales of interaction between Antarctic krill and the environment. In: Sahrhage. D. (ed.) Antarctic ocean and resources variability. Springer-Verlag, Berlin, p. 120-130
Obst, B. S. (1985). Densities of Antarctic seabirds at sea and the presence of the krill Euphausia superba. Auk 102: 540-549
Piatt, J. F., Methven, D. A. (1986). Marine food webs: seabird/ capelin interactions at Witless Bay, Newfoundland. New- foundland Institute for Cold Ocean Science, Memorial Univ. Newfoundland, St. Johns
Priddle, J., Croxall, J. P,, Everson, I., Heywood, R. B., Murphy. E. J., Prince, P. A., Sear, C. B. (in press). Large-scale fluctuations in distribution and abundance of knll - a discussion of possible causes. In: Sahrhage, E. (ed.) Antarctic ocean and resources variability. Springer-Ver- lag, Berlin. p. 169-182
Roe, H. S. J., Shale, D. M. (1979). A new multiple rectangular underwater trawl (RMT1+8M) and some modifications to the Institute of Oceanographic Sciences RMT1+8. Mar Biol. 50: 283-288
Safina, C., Burger. J. (1985). Common Tern foraging: seasonal trends in prey flsh densities and competition w ~ t h bluefish. Ecology 66: 1457-1463
This article was presented by Professor D. C. Schneider, St. John's, Newfoundland, Canada
Schneider, D., Duffy, D. C. (1985). Scale-dependent variability in seabird density. Mar. Ecol. Prog. Ser. 25: 211-218
Schneider, D. C., Gagnon, J., Gilkinson, K. D. (1987). Patchi- ness of epibenthic megafauna on the outer Grand Banks of Newfoundland. Mar. Ecol. Prog. Ser 39: 1-13
Schneider, D. C. , Piatt, J F. (1986). Scale-dependent correla- tion of seabirds with schooling fish in a coastal ecosystem. Mar. Ecol. Prog. Ser 32: 327-246
Sokal, R. B., Rohlf, F. J . (1981). Biometry. Freeman, San Francisco
Uda, M, , Ish~no, M. (1958). Enrichment pattern resulting from eddy systems In relat~on to fishing ground. J. Fac. Mar. Sci. Technol. Tokai Univ 7: 245-265
Updegraff, G. E., Hunt, G. L. (1985). Field use of rnicro- computers for the collection of seabird data. Pac. Seabird Group Bull. 12: 19
Volkman, N. J., Presler, P,, Trivelpiece, W. (1980). Diets of pygoscelid penguins at King George Island, Antarctica. Condor 82: 373-378
Wilkinson, L. (1986). SYSTAT: The system for statistics. SYS- TAT, Evanston, Illinois
Woodby, D. (1984). The April distribution of murres and prey patches In the southeastern Bering Sea. Limnol. Oceanogr 29: 181-188
Manuscript first received: January 28, 1989 Revised version accepted: July 26, 1989