Embed Size (px)
Citation preview

Self-Archive
1
Relationships between soil CO2 concentration and CO2 production, temperature, water content, and gas diffusivity: Implications for field studies through sensitivity analyses. HASHIMOTO, SHOJI
Soil Resources Evaluation Laboratory, Department of Forest Site Environment, Forestry & Forest Products Research Institute, 1 Matsunosato, Tsukuba, Ibaraki, 305-8687, Japan
KOMATSU, HIKARU
This is the peer reviewed version of the following article: [Hashimoto, S. and H.
Komatsu (2006) Relationships between soil CO2 concentration and CO2 production,
temperature, water content, and gas diffusivity: Implications for field studies
through sensitivity analyses. Journal of Forest Research, 11: 41-50.
doi:10.1007/s10310-005-0185-4].
The final publication is available
at Springer via [ http://dx.doi.org/10.1007/s10310-005-0185-4].

Self-Archive
2
Soil CO2 levels reflect CO2 production and transport in soil and provide valuable information about soil CO2 dynamics. However, extracting information from soil CO2 profiles is often difficult because of the complexity of these profiles. In this study, we constructed a simple numerical model that simulated soil CO2 dynamics and performed sensitivity analyses for CO2 production rates, soil water content and temperature, and gas diffusivity at the soil surface to clarify the relationships among these parameters. Increased soil surface CO2 flux did not always coincide with higher soil CO2 concentrations; increased CO2 production at shallow depths had little effect on soil CO2 concentrations, while the opposite may be true for high levels of soil water content. Higher soil CO2 concentration did not always coincide with greater soil surface CO2 flux; under high soil water conditions, soil surface CO2 flux sometimes decreased despite increased soil CO2 concentration. Increases in soil water content did not always enhance both soil surface CO2 flux and soil CO2 concentration. Under high soil water conditions, increases in soil water content could lower soil surface CO2 flux and increase soil CO2 concentration. Increases in soil temperature resulted in greater soil surface CO2 flux and higher soil CO2 concentration in our simulation (extremely high temperatures were not assumed in this study). Gas diffusivity in very shallow layers did affect, albeit weakly, soil CO2 concentration. The findings of this study may help direct future observations and aid in the interpretation of their results.
Key words: Numerical simulation; Soil CO2 concentration; Soil respiration; Soil surface CO2 flux.
Introduction The response of soil carbon to climate change is of great importance because soil contains the largest known pool of terrestrial organic carbon, and this pool interacts strongly with both the atmosphere and vegetation (e.g. Foley 1995; Raich and Tufekcioglu 2000; Rustad et al. 2000; Schlesinger and Andrews 2000). Many studies have investigated soil surface CO2 flux or soil respiration in various ecosystems (Hanson et al. 1993; Ohashi et al. 1999; Morén and Lindroth 2000; Ishizuka et al. 2002; Hashimoto et al. 2004; Tamai et al. 2005). However, in addition to soil surface CO2 flux, CO2 concentration in the soil is also important, because it provides valuable information about soil CO2 production and transport through the subsurface. Soil respiration is the result of complex processes in the subsurface; the sources of soil CO2 are distributed vertically (Jackson et al. 1997; Jobbágy and Jackson 2000), and the environmental conditions that control soil CO2 production vary with soil depth. CO2 is produced at all depths and is transported to the soil surface. To understand when and how soil CO2 is produced at each depth, it is necessary to determine, not only soil surface CO2 flux, but also soil CO2 concentration profiles (Davidson and Trumbore 1995; Osozawa and Hasegawa 1995; Hamada et al. 1996; Hamada and Tanaka 1997; Shimada et al. 1998; Gaudinski et al. 2000; Hirsch et al. 2002; Pumpanen et al. 2003; Fujikawa et al. 2003; Davidson et al. 2004). However, extracting information from soil CO2 profiles is often difficult, because these profiles reflect the complex interactions between CO2 production and transport at all depths, soil temperature (e.g., Goulden et al. 1998) , soil water content (e.g., Davidson et al. 2004), and sources of CO2 production. Therefore, soil CO2 profiling results can sometimes lead to misunderstandings or problems. For example, because of low gas diffusivity caused by low porosity, high soil CO2 concentrations at certain depths do not necessarily reflect high soil CO2 production at those depths. Similarly, low soil CO2 concentrations do not always indicate low soil CO2 production in soils with high gas diffusivity. A site with higher soil respiration does not always have higher soil CO2 concentrations if the main source of soil CO2 is very shallow. While deeper soils generally have
Self-Archive
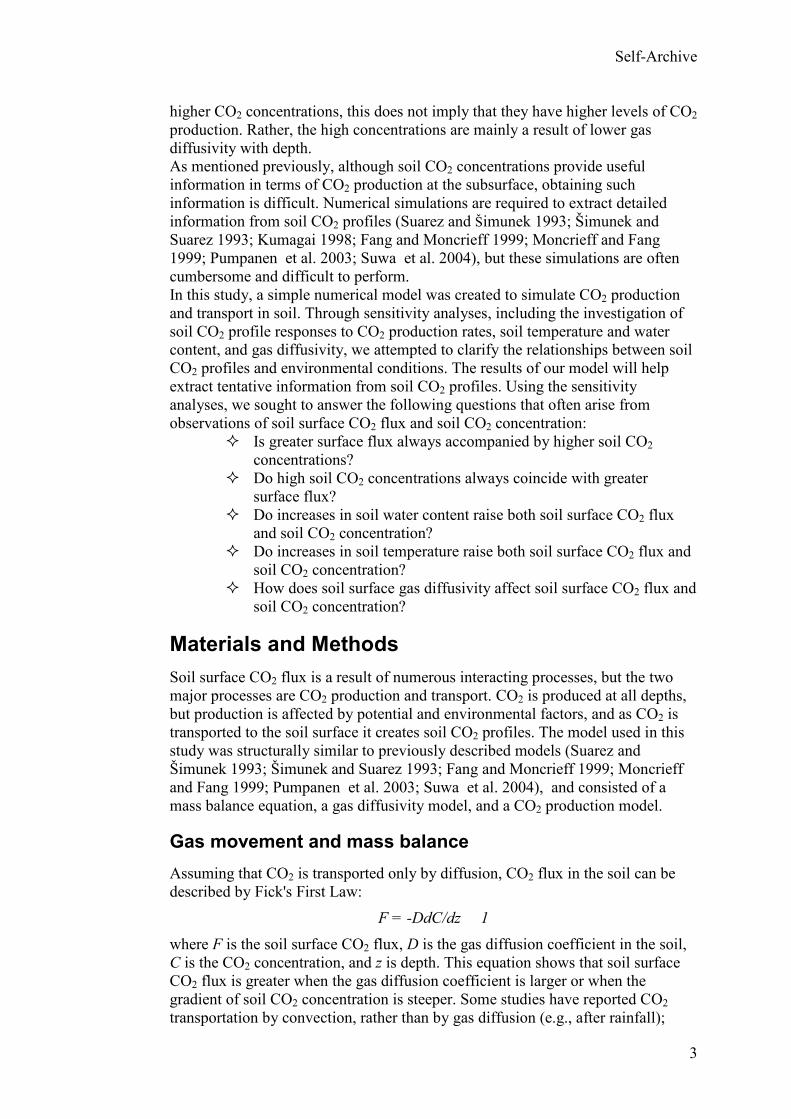
3
higher CO2 concentrations, this does not imply that they have higher levels of CO2 production. Rather, the high concentrations are mainly a result of lower gas diffusivity with depth. As mentioned previously, although soil CO2 concentrations provide useful information in terms of CO2 production at the subsurface, obtaining such information is difficult. Numerical simulations are required to extract detailed information from soil CO2 profiles (Suarez and Šimunek 1993; Šimunek and Suarez 1993; Kumagai 1998; Fang and Moncrieff 1999; Moncrieff and Fang 1999; Pumpanen et al. 2003; Suwa et al. 2004), but these simulations are often cumbersome and difficult to perform. In this study, a simple numerical model was created to simulate CO2 production and transport in soil. Through sensitivity analyses, including the investigation of soil CO2 profile responses to CO2 production rates, soil temperature and water content, and gas diffusivity, we attempted to clarify the relationships between soil CO2 profiles and environmental conditions. The results of our model will help extract tentative information from soil CO2 profiles. Using the sensitivity analyses, we sought to answer the following questions that often arise from observations of soil surface CO2 flux and soil CO2 concentration:
Is greater surface flux always accompanied by higher soil CO2 concentrations?
Do high soil CO2 concentrations always coincide with greater surface flux?
Do increases in soil water content raise both soil surface CO2 flux and soil CO2 concentration?
Do increases in soil temperature raise both soil surface CO2 flux and soil CO2 concentration?
How does soil surface gas diffusivity affect soil surface CO2 flux and soil CO2 concentration?
Materials and Methods Soil surface CO2 flux is a result of numerous interacting processes, but the two major processes are CO2 production and transport. CO2 is produced at all depths, but production is affected by potential and environmental factors, and as CO2 is transported to the soil surface it creates soil CO2 profiles. The model used in this study was structurally similar to previously described models (Suarez and Šimunek 1993; Šimunek and Suarez 1993; Fang and Moncrieff 1999; Moncrieff and Fang 1999; Pumpanen et al. 2003; Suwa et al. 2004), and consisted of a mass balance equation, a gas diffusivity model, and a CO2 production model.
Gas movement and mass balance Assuming that CO2 is transported only by diffusion, CO2 flux in the soil can be described by Fick's First Law:
F = -DdC/dz 1 where F is the soil surface CO2 flux, D is the gas diffusion coefficient in the soil, C is the CO2 concentration, and z is depth. This equation shows that soil surface CO2 flux is greater when the gas diffusion coefficient is larger or when the gradient of soil CO2 concentration is steeper. Some studies have reported CO2 transportation by convection, rather than by gas diffusion (e.g., after rainfall);

Self-Archive
4
however, convection is usually negligible except under such special circumstances, and the primary form of soil CO2 transport is thought to be gas diffusion (e.g. Jury and Horton 2004). One-dimensional CO2 transport is described by the following mass balance equation:
d ε C/d t = -d F/d z + Y, 2 where ε is the air-filled porosity, t is time, and Y is the CO2 production in soil. The left half of the equation indicates the change in CO2 concentration, the first term on the right represents the difference between influx and efflux, and the second term on the right shows the yield of CO2 at a given depth.
Gas diffusivity In general, the gas diffusion coefficient is affected by temperature (T: °C) and pressure (P: hpa):
D0 = Dstd((T + 273)/273)n1(1013/P) n2 , 3 where D0 is the gas diffusion coefficient in free air, Dstd is the gas diffusion coefficient at standard conditions, and n1 and n2 are constants. (Campbell 1985). The constants for CO2 are 1.39 x 10⁻⁵ m2s-1 for Dstd, 1.75 for n1, and 1 for n2. When considering gas diffusion coefficients in soil, a relative gas diffusion coefficient (D/D0), i.e., the ratio of the gas diffusion coefficient in soil to that in free air, is usually used. The relative gas diffusion coefficient is affected by the air-filled porosity of the soil. Although several models have been used to describe the relationship between the relative gas diffusion coefficient in soil and porosity (Campbell 1985; Jin and Jury 1996; Moldrup et al. 1996, 2000), the three-porosity model (TPM: Moldrup et al. 2004) is the most reliable, and was therefore used in this study. The TPM model is as follows:
D/D0 = Φ 2(ε/Φ)X 4
X = 2ε1003 + 0.04ε100, 5
Figure 1 where Φ is the total porosity (m3m-3), ε is the air-filled porosity (m3m-3), X is a tortuosity-connectivity parameter, and ε100 is the air-filled porosity at -100 cm H2O of matric potential. Figure 1 shows examples of relationships between air-filled porosity and D/D0. In general, D/D0 increases exponentially with increasing air-filled porosity.
CO2 production The relative contributions of root respiration and microbial respiration, i.e., soil organic matter decomposition, to CO2 production vary with ecosystem and season, and are not yet fully understood. Some studies (e.g., Fang and Moncrieff 1999; Moncrieff and Fang 1999; Pumpanen et al. 2003) have separated CO2 production potential into two compartments, i.e., root respiration and microbial respiration, whereas others have not (e.g., Suarez and Šimunek 1993; Šimunek and Suarez 1993; Suwa et al. 2004). Also, the response of root respiration to environmental factors, such as temperature and water content, has not yet been clarified. For simplicity, in this

Self-Archive
5
study, the two processes were not distinguished; CO2 production potential was described using only one term. CO2 production was given simply as the potential for CO2 production at each depth. Although various environmental factors affect CO2 production in soil, we assumed only two major influences, i.e., soil temperature and soil water content:
Y =αf(T) g(θ), 6 where α is the coefficient representing the potential of CO2 arising (mgCO2 m-3 s-
1), f(T) is the response of soil CO2 production to soil temperature, and g(θ) is the response to soil water. Soil CO2 production increases exponentially with increasing soil temperature and responds parabolically to soil water content. Although soil CO2 production decreases at very high temperatures, this rarely occurs in the field.
f(T)= ek(T - 20) 7
g(θ) = a(θ/θmax)2 + b(θ/θmax) + c, 8
where k represents the temperature sensitivity of CO2 production, a, b, and c are the parameters, and θmax is the maximum soil water content or maximum porosity. f(T) has a value of 1 when soil temperature is 20 °C. g(θ) varies between 0 and 1 and decreases under extreme wet or dry conditions (Howard and Howard 1993; Zak et al. 1999). Structurally, the model is simpler than other soil CO2 models (Suarez and Šimunek 1993; Šimunek and Suarez 1993; Fang and Moncrieff 1999; Moncrieff and Fang 1999; Pumpanen et al. 2003; Suwa et al. 2004). While the model (i.e., equation 2 and 6) was not validated with observational data, it is structurally similar in CO2 regime to the model of Kumagai (1998), which was validated with field observation data from the University Forest, University of Tokyo, in the Fukuroyamasawa watershed in Chiba prefecture. Kumagai (1998), the earliest study modeling soil CO2 dynamics in a Japanese forest, demonstrated that a model could accurately reproduce soil CO2 concentrations, but failed at depicting some detailed fluctuations. Therefore, the simpler model used in the present study was not necessarily expected to reproduce detailed soil CO2 dynamics; however, the model could demonstrate and explain approximate dynamics of soil CO2.
Running conditions The following assumptions were made:
① CO2 was transported only by diffusion; convective flux was not considered.
② Dissolved CO2 in water and CO2 emissions from water were neglected because the effects were considered negligible.
③ Responses of CO2 production to O2 concentration or CO2 concentration were not considered because these relationships are not yet understood.
④ CO2 diffusion through soil water was not considered, i.e., the gas diffusion coefficient in saturated soil was 0.
⑤ The value of P in equation 3 was assumed to be 1013. ⑥ The value of k in equation 7 was assumed to be 0.1 (Q10 = 2.7; Q10 is
the factor by which the respiration rate differs for a temperature interval of 10 °C).

Self-Archive
6
⑦ The values of a, b, and c in equation 8 were assumed to be -4, 4, and 0, respectively, indicating a parabolic response with a maximum of 1 at θ/θmax = 0.5 and a minimum of 0 at θ/θmax = 0, 1.
The boundary conditions were as follows: ① CO2 concentration at the soil surface was assumed to be 610
mgCO2m-3. ② The gas diffusion coefficient in the lowest horizon was assumed to
be 0, and CO2 did not go beyond this boundary. We used the Crank-Nicholson implicit method for solving the diffusion equation and adopted a 3600-s time step and a 0.01-m grid size. We solved the matrixes using Thomas algorithms (Campbell 1985). The saturated soil water content was set using the Fukuroyamasawa watershed data (35°12'N, 140 ° 06'E) (Kumagai et al. 1997). Details of the site can be found in previous studies (Kumagai et al. 1997; Hashimoto and Suzuki 2004; Kajitani et al. 2005; Maita et al. 2005). The temperature conditions were also determined using Fukuroyamasawa watershed data (Hashimoto and Suzuki 2004). The saturated soil water content was set at 0.85, 0.65, 0.6, and 0.6 m3m-3 for 0, 0.2, 0.5, and 0.9 m depths, respectively. Total porosity (Φ) was calculated as the saturated soil water content. The ε100 above 0.3 m was assumed to be 0.2 m3m-3, and that below 0.4 m was assumed to be 0.15 m3m-3. Values between the indicated depths were linearly interpolated. In Cases 1, 2, and 3 (see next section; Fig. 2) and Cases 6 and 7 (Fig. 4), soil temperature was assumed to be 13.5 °C (approximate average soil temperature at Fukuroyamasawa watershed) at each depth, and the soil water content at each depth was assumed to be 70 % of the saturated soil water content. In Case 4 (Fig. 3), soil temperature was assumed to be 13.5°C, and soil water content in Case 5 (Fig. 3) was assumed to be 70 % of the saturated soil water content. The CO2 production rate at each depth (shallower than 0.4 m) was set using the experimental data from Hashimoto and Suzuki (2002), which included the vertical distribution of CO2 production rate at the Fukuroyamasawa watershed up to 0.4 m depth. CO2 production rates for soil deeper than 0.4 m were assumed to be the same as that for soil at 0.4 m. With these parameter values, the soil surface CO2 flux calculated in this study ranged from 0.037 to 0.13 mgCO2 m-2 s-1, which was within the ranges reported for Japanese forests (Ohashi et al. 1999; Nobuhiro et al. 2003; Hashimoto 2004; Tamai et al. 2005), and soil CO2 concentration ranged from 9000 to 66000 mgCO2m-3 at the deepest point (0.9 m), values almost within previously reported ranges (Hashimoto 2004). However, the very low values obtained under very dry conditions were not within reported ranges (Hashimoto 2004). Nevertheless, we believe that these low values are not necessarily unrealistic.
Results and Discussion
Table 1 We conducted a sensitivity analysis on the profile of CO2 production rate in soil, the soil water content and soil temperature, and the gas diffusion coefficient at the soil surface (Table 1). For clarity, we assumed a steady temperature and water content, and ran a calculation under each condition for 360,000 s to obtain an equilibrium soil surface CO2 flux and soil CO2 concentration profile.

Self-Archive
7
Production rate We examined the dependence of the soil CO2 profile and soil surface CO2 flux on the Soil CO2 production rate by changing the CO2 production rate in three different ways (Fig. 2): Case 1 All CO2 production rates except that in the shallowest layer were varied (Runs 1-3) Case 2 CO2 production rates in every layer were varied (Runs 4-6) Case 3 CO2 production rate was only varied in the shallowest layer (Runs 7-9)
Figure 2
Case 1 (Runs 1-3): CO2 production rates were only changed in the deeper layers Generally, soil organic matter content and root density decrease with increasing depth (Jobbágy and Jackson 2000); as a result, the CO2 production rate also tends to decrease with increasing depth (e.g. Ino and Monsi 1969; Hashimoto and Suzuki 2002). However, the contributions of CO2 production at deeper depths differ among ecosystems. For Runs 1-3, CO2 production rates increased in deeper layers (Fig. 2 (a)). Both soil CO2 concentration and soil surface CO2 flux increased with increasing CO2 production in deep soil (Fig. 2 (b), (c)); however, the increases in soil CO2 concentration were greater than those of soil surface CO2 flux. Soil surface CO2 flux increased about two-fold from Run 1 to Run 3; soil CO2 concentration at the deepest depth (0.9 m) increased about three-fold. The incremental increase of CO2 concentration from Run 1 to Run 3, however, decreased with decreasing depth; the soil CO2 concentration at 0.1 m depth increased about two-fold from Run 1 to Run 3.
Case 2 (Runs 4-6): CO2 production rates were changed in all layers In Case 2, CO2 production rates in every layer increased from Run 4 to Run 6 (Fig. 2 (d)), and soil CO2 concentration and surface CO2 flux rose (Fig. 2 (e)(f)). The ratios of CO2 concentration among the three runs were similar at each depth. Compared to Case 1, soil CO2 concentration at each depth increased linearly.
Case 3 (Runs 7-9): CO2 production rate was changed only in the shallowest layer Litterfall from aboveground biomass is supplied to the shallowest soil layer and root density is highest in this layer (e.g. Jackson et al. 1996; Noguchi et al. 2004). As a result, the CO2 production rate in the shallowest layer will vary greatly with season and year. Also, changes at only the shallowest depths often occur diurnally because shallower depths tend to experience larger diurnal changes in temperature. For this reason, we only varied the CO2 production rate at the shallowest depth in Case 3 (Fig. 2 (g)). Even at the deepest depth, soil CO2 concentration increased with increasing CO2 production rate in the shallowest layer (Fig. 2 (h)); however,

Self-Archive
8
the increases in CO2 concentration were much smaller than those of soil surface CO2 flux (Fig. 2 (i)). Compared to Cases 1 and 2, changes in soil CO2 concentration in Case 3 were very small, indicating that changes in shallow layer CO2 production rate have little effect on soil CO2 profile. Throughout Cases 1-3, deeper soils showed lower CO2 production but higher CO2 concentration, which are realistic and typical results. Note, however, that the higher soil CO2 concentration at deeper depths was, in general, caused by the lower gas diffusivity at those depths, not by a higher CO2 production rate. It may be useful to imagine in situ soil as being similar to soil in a bucket.
Soil water and temperature conditions Soil water content and soil temperature are major controllers of soil respiration. We examined the performance of the soil CO2 concentration profile and soil surface CO2 flux (Fig. 3) as follows: Case 4 Soil water content was varied from very dry to wet. Soil water conditions in the first runs were drier, especially at shallower depths (Runs 10-12), and soil water conditions in later runs were wetter (Runs 13-15).
Figure 3 Case 5 Soil temperature was varied from low to high. When ambient temperatures were high, the shallowest layer was warmer. When ambient temperatures were low, the shallowest layer was cooler (Runs 16-22).
Case 4 (Runs 10-15): Changes in soil water content Rainfall often affects soil CO2 conditions (e.g., Hamada and Tanaka 2001; Lee et al. 2002), and in some regions, soil water is the primary controller of soil CO2 (e.g., Hashimoto et al. 2004). Soil surface CO2 flux responded parabolically to soil water content (Fig. 3 (c)), which is in accordance with the CO2 production rate (equation 8). However, the response of CO2 concentration was extremely complex (Fig. 3 (b)). Until Run 14, CO2 concentration steadily increased with increasing soil water content, and the increases in CO2 concentration were greater at higher soil water contents. However, from Run 14 to Run 15, the performance of CO2 concentration changed. The increment of soil CO2 concentration increase was very low, particularly at deeper depths. The small change in CO2 concentration from Run 14 to 15 resulted from the greater impact of decreased soil CO2 production relative to decreased gas diffusivity. CO2 concentration tended to increase with increasing CO2 production rate and decreasing gas diffusivity. Moreover, note that the soil CO2 flux decreased from Run 12 despite the increase in CO2 concentration from Run 10 to Run 15. Thus, the soil CO2 concentration profile was complex, with soil CO2 production responding parabolically to soil water content and air-filled porosity largely controlling gas diffusivity. Field measurements of actual performances at high soil water content have been ambiguous because measurement methods require the extraction of soil air to measure CO2 concentration. Recently, new equipment that does not require the extraction of soil air has become available (Tang et al. 2003); measurements using such equipment will clarify the properties of soil with a high water content.

Self-Archive
9
Case 5 (Runs 16-22): Changes in soil temperature on a vertical gradient Under field conditions, shallower soils tend to have greater seasonality, i.e., soil temperatures are higher at shallower depths than at deeper depths during warm seasons and lower at shallower depths during cold seasons. In Case 5, we examined the performance of the model under seven different temperature profiles (Fig. 3 (d)).
Figure 4 Soil surface CO2 flux increased with increasing temperature; however, the relationship between soil surface CO2 flux and soil temperature depended on the depth at which soil temperatures were compared (Fig. 3 (f)). In general, we found steeper correlations at deeper depths because soil temperature decreased with depth. For example, Q10 values, which are the factors by which the respiration rate differs for a temperature interval of 10 °C, differ; the Q10 value obtained with the temperature at 0 m was 2.0, while that obtained with the temperature at 0.3 m was 2.6. This result indicates the difficulty of comparing Q10 values measured under different field conditions in different ecosystems. Even in the same ecosystem, the relationship between soil surface CO2 flux and soil temperature differed with depth, suggesting the need for reevaluating studies that reported Q10 values without considering soil depth. Soil CO2 concentration steadily increased with increasing soil temperature from Run 16 to Run 22 (Fig. 3 (e)), as did soil surface CO2 flux. Unlike soil water content, changes in soil temperature had simpler effects on soil CO2 concentration and surface flux, because soil CO2 production increased with increasing soil temperature within normal temperature ranges, and changes in soil temperature do not change soil gas diffusivity as drastically as do changes in soil water content.
Gas diffusion coefficient at the soil surface Modeling the soil surface is difficult for many reasons. For example, measuring soil water content or maximum porosity is technically challenging because of the difficulty in installing probes and the complications caused by the litter layer. Moreover, soil properties and soil environmental conditions change dramatically at the shallowest depths. The soil surface receives litterfall from aboveground biomass that can cause dramatic changes in soil surface conditions. Plant roots at shallower soil depths, as well as litter decomposition, can also alter soil properties near the surface. The soil surface receives rainfall directly or as throughfall, and temperature variations are greatest at the soil surface. The form of transporting soil CO2 may vary, although the main form is considered to be diffusion. Wind speed also affects soil surface CO2 flux (Hanson et al. 1993; Ohashi et al. 1995; Kutsch et al. 2001). In the present model, a constant and high gas diffusion coefficient at the soil surface was assumed and the assumed diffusivity was changed with depth. This was a reasonable assumption, because the soil surface had a higher porosity and greater gas diffusivity, and even during rainfall, the air-filled porosity was maintained by high water permeability. A sensitivity analysis of the boundary gas diffusivity was conducted as follows (Fig. 4):

Self-Archive
10
Case 6 The depth at which high and constant gas diffusivity occurred was varied (Runs 23-25) Case 7 The value of gas diffusivity was varied (Runs 26-28)
Case 6 (Runs 23-25): Depth of constant gas diffusion coefficient We examined the dependence of soil surface gas diffusivity on the soil CO2 profile. We assumed 0 m, 0-0.05 m, and 0-0.1 m depths as D/D0 = 0.3 (Fig. 4 (a)). The results may be similar to those derived under conditions measured after removing surface soil. Soil surface CO2 flux did not change from Run 23 to Run 25 (Fig. 4 (b)) because soil surface gas diffusivity did not affect CO2 production. Soil CO2 concentration decreased with increasing depth with constant and high gas diffusivity (Fig. 4 (a)). The changes in soil CO2 concentration in this case were smaller than those in cases 1, 2, 4, and 5; yet those at shallower depths were relatively considerable within the profile. For example, soil CO2 concentration at 0.2 m depth dropped by 50 % from Run 23 to Run 25.
Case 7 (Runs 26-28): Gas diffusion coefficient at the soil surface The value of the gas diffusion coefficient changed at shallower depths, and its correlation with soil CO2 concentration was examined. This condition was similar to that after low-intensity rainfall, which moistens only a very shallow layer of soil. We used three gas diffusion coefficients at 0-0.05 m: D/D0 = 0.03, 0.3, and 0.5 (Fig. 4 (c)). A coefficient of 0.5 indicated that soil water was almost completely drained from around the soil surface (Fig. 1). As in Case 6, soil surface CO2 fluxes were the same among the three runs because of the insensitivity of soil CO2 production to surface gas diffusivity (Fig. 4 (d)). Soil CO2 concentration decreased slightly from Run 26 to Run 27, and very little from Run 27 to Run 28 (Fig. 4 (c)). The changes in CO2 concentration were smaller than in Cases 1, 2, 4, and 5, yet CO2 concentrations at shallower depths were, as in Case 6, certainly affected; CO2 concentration at 0.2 m depth was as much as two-thirds lower than in Runs 26 to Run 27 and 28. Cases 6 and 7 suggested that gas diffusivity at the shallowest depths had less effect on CO2 concentration in the soil than did changes in CO2 production at deeper depths (Fig. 2), soil water content, and soil temperature (Fig. 3); yet CO2 concentration at shallow depths was certainly affected. Cases 6 and 7 also highlight an important point. Sudden decreases in soil surface gas diffusivity may lead to decreases in soil surface CO2 flux. However, soil surface CO2 flux will recover, assuming CO2 production rates do not change with the decrease in soil surface gas diffusivity. Thus, the effect of decreased soil surface gas diffusivity on soil surface CO2 flux is only tentative when CO2 production rates are held constant.
Conclusions Through sensitivity analyses we demonstrated the relationships between the soil CO2 profile and other environmental conditions, and clarified the following

Self-Archive
11
relationships. CO2 production at deeper depths strongly affected the soil CO2 profile; however, CO2 production in shallower layers had subtle effects on the soil CO2 profile even though soil surface CO2 fluxes were at the same level (Fig. 2). Changes in soil water content resulted in complicated behavior of the soil CO2 profile because CO2 production was lowered under both wet and dry conditions; moreover, gas diffusivity was controlled strongly by soil water content (Fig. 3 left). Up to certain limits, soil CO2 concentration increased with increasing soil water content and changed little with further increases in soil water. Soil surface CO2 flux may decrease despite an increased soil CO2 concentration profile. Soil temperature strongly affected the soil CO2 profile (Fig. 3 right). Gas diffusivity in very shallow layers had little effect on the soil CO2 profile, although soil CO2 concentration at shallower depths was definitely affected (Fig. 4). Changes in gas diffusivity may temporarily affect soil surface CO2 flux; however, flux will return to the same level over time if the CO2 production rate at each depth is the same. Through the sensitivity analyses, we were able to answer the questions posed earlier:
Greater soil surface CO2 flux often coincided with higher soil CO2 concentration, but not always; increases in CO2 production at shallower depths had little effect on soil CO2 concentration, while the opposite may be true for high levels of soil water content.
Higher soil CO2 concentration often coincided with greater soil surface CO2 flux, although not always; under high soil water conditions, soil surface CO2 flux may decrease despite increases in soil CO2 concentration.
Increases in soil water content often enhanced both soil surface CO2 flux and soil CO2 concentration. Nevertheless, under high soil water conditions, soil surface CO2 flux can decrease while soil CO2 concentration increases. However, in some cases of high soil water conditions, CO2 concentration is not enhanced.
Increases in soil temperature resulted in greater soil surface CO2 flux and higher soil CO2 concentrations in our simulation. Note that this result may not be applicable to extremely high temperature conditions, as our simulation did not assume such temperatures.
Gas diffusivity in very shallow layers did not strongly affect soil CO2 concentration, but at shallow depths, it clearly affected soil CO2 concentration. While sudden changes in soil surface gas diffusivity may temporarily affect soil surface CO2 flux, the flux will return to the same level if the sudden decrease in gas diffusivity does not change soil CO2 production rate at all depths.
In reality, environmental factors do not change independently; rather, several factors tend to vary together, and extremely complex interactions are possible. However, the fundamental results of this study may help direct future observations and aid in interpreting their results.
List of symbols Definitions of symbols used in this study: a, b, c parameters for the dependence of soil CO2 production on soil water content α coefficient representing the potential of CO2 arising, mg CO2 m-3s-1

Self-Archive
12
C CO2 concentration, mg CO2 m-3 D CO2 diffusion coefficient in soil, m2s-1 D0 CO2 diffusion coefficient in free air, m2s-1 Dstd gas diffusion coefficient in air at standard conditions, m2 s-1 ε porosity, m3 m-3 ε100 air-filled porosity at -100 cm H2O of matric potential, m3 m-3 F CO2 flux, mg CO2 m-2s-1 Φ total porosity, m3 m-3 f(T) temperature dependence of soil CO2 production g(θ) dependence of soil CO2 production on soil water content k parameter of the temperature sensitivity of soil CO2 production n1, n2 parameters of the relationships between the gas diffusion coefficient and temperature and pressure T temperature, °C t time, s θ soil water content, m3 m-3 θ max maximum or saturated soil water content, m3 m-3 X tortuosity-connectivity parameter Y CO2 production rate, mg CO2 m-3s-1 z soil depth, m
References
Campbell GS (1985) Soil physics with BASIC: transport models for soil-plant systems. Elsevier Science
Publishers B.V., Amsterdam
Davidson EA, Ishida FY, Nepstad DC (2004) Effects of an experimental drought on soil emissions of carbon
dioxide, methane, nitrous oxide, and nitric oxide in a moist tropical forest. Global Change Biology 10: 718-
730
Davidson EA, Trumbore SE (1995) Gas diffusivity and production of CO2 in deep soils of the eastern
Amazon. Tellus 47B: 550-565
Fang C, Moncrieff JB (1999) A model for soil CO2 production and transport 1: Model development.
Agricultural and Forest Meteorology 95: 225-236
Foley JA (1995) An equilibrium model of the terrestrial carbon budget. Tellus 47B: 310-319
Fujikawa T, Miyazaki T, Imoto H (2003) Study on behavior of CO2 and O2 gas in soil with a hard pan.
Transactions of the Japanese Society of Irrigation, Drainage and Reclamation Engineering 225: 111-118 (in
Japanese with English summary)
Gaudinski JB, Trumbore SE, Davidson EA, Zheng S (2000) Soil carbon cycling in a temperate forest:
radiocarbon-based estimates of residence times, sequestration rates and partitioning of fluxes.
Biogeochemistry 51: 33-69
Goulden ML, Wofsy SC, Harden JW, Trumbore SE, Crill PM, Gower ST, Fries T, Daube BC, Fan S-M,
Sutton DJ, Bazzaz A, Munger JW (1998) Sensitivity of boreal forest carbon balance to soil thaw. Science
279: 214-217
Hamada M, Ohte N, Kobashi S (1996) A measurement of soil CO2 profile in a forest watershed. Journal of
Japanese Forestry Society 78: 376-383 (in Japanese with English summary)
Hamada Y, Tanaka T (1997) Temporal and spatial distribution of carbon dioxide concentration in forest soil
air. Japanese Association of Hydrological Science 27: 3-16 (in Japanese with English summary)
Hamada Y, Tanaka T (2001) Dynamics of soil carbon dioxide during a storm event. Annual Report of the
Institute of Geoscience, the University of Tsukuba 27: 3-6

Self-Archive
13
Hanson PJ, Wullschleger SD, Bohlman SA, Todd DE (1993) Seasonal and topographic patterns of forest
floor CO2 efflux from an upland oak forest. Tree Physiology 13: 1-15
Hashimoto S (2004) Studies on carbon dioxide production and its transport in forest soil. PhD thesis. The
University of Tokyo.
Hashimoto S, Suzuki M (2002) Vertical distributions of carbon dioxide diffusion coefficients and production
rates in forest soils. Soil Science Society of America Journal 66: 1151-1158
Hashimoto S, Suzuki M (2004) The impact of forest clear-cutting on soil temperature: a comparison between
before and after cutting, and between clear-cut and control sites. Journal of Forest Research 9: 125-132
Hashimoto S, Tanaka N, Suzuki M, Inoue A, Takizawa H, Kosaka I, Tanaka K, Tantasirin C, Tangtham N
(2004) Soil respiration and soil CO2 concentration in a tropical forest, Thailand. Journal of Forest Research 9:
75-79
Hirsch AI, Trumbore SE, Goulden ML (2002) Direct measurement of the deep soil respiration accompanying
seasonal thawing of a boreal forest soil. Journal of Geophysical Research 108: 8221-8230
Howard DM, Howard PJA (1993) Relationships between CO2 evolution, moisture content and temperature
for a range of soil types. Soil Biology and Biochemistry 25: 1537-1546
Ino Y, Monsi M (1969) An experimental approach to the calculation of CO2 amount evolved from several
soils. Japanese Journal of Botany 20: 153-188
Ishizuka S, Tsuruta H, Murdiyarso D (2002) An intensive field study on CO2, CH4, and N2O emissions from
soils at four land-use types in Sumatra, Indonesia. Global Biogeochemical Cycles 16: 1049.
doi:10.1029/2001GB001614
Jackson RB, Canadell J, Ehleringer JR, Mooney HA, Sala OE, Schulze ED (1996) A global analysis of root
distributions for terrestrial biomes. Oecologia 108: 389-411
Jackson RB, Mooney HA, Shulze E-D (1997) A global budget for fine root biomass, surface area, and
nutrient contents. Proceedings of the National Academy of Sciences of the United States of America 94:
7362-7366
Jin Y, Jury WA (1996) Characterizing the dependence of gas diffusion coefficient on soil properties. Soil
Science Society of America Journal 60: 66-71
Jobbágy EG, Jackson RB (2000) The vertical distribution of soil organic carbon and its relation to climate
and vegetation. Ecological Applications 10: 423-436
Jury WA, Horton R (2004) Soil Physics. John Wiley & Sons, Inc., New Jersey
Kajitani N, Hotta N, Komatsu H, Kume T, Suzuki M (2005) Differences in diurnal pattern of transpiration
between young sugi trees (Cryptomeria japonca) located at the ridge and the bottom of a slope. Journal of
Japanese Forest Society 87: 63-72 (in Japanese with English summary)
Kumagai T (1998) Process of formation of CO2 gas environment in forest soil-Examination using numerical
model-. Journal of Japanese Forest Science 80: 214-222 (in Japanese with English summary)
Kumagai T, Kaneko M, Shiraki K, Shuin Y, Suzuki M, Ohta T (1997) Hydraulic properties of forest soil in
Fukuroyama-sawa watershed in the Tokyo University forest in Chiba. Bulletin of The Tokyo University
Forests 98: 135-150 (in Japanese with English summary)
Kutsch WL, Staack A, Wotzel J, Middelhoff U, Kappen L (2001) Field measurements of root respiration and
total soil respiration in an alder forest. New Phytologist 150: 157-168
Lee M-S, Nakane K, Nakatsubo T, Mo W-H, Koizumi H (2002) Effects of rainfall events on soil CO2 flux in
a cool temperate deciduous broad-leaved forest. Ecological Research 17: 401-409
Maita E, Suzuki M, Ohta T (2005) Change in the annual discharge after clear-cutting a 70-year-old mixed
plantation of Sugi and Hinoki in a Tertiary formation area. Journal of Japanese Forest Society 87: 124-132 (in
Japanese with English summary)
Self-Archive
14
Moldrup P, Kruse CW, Rolston DE, Yamaguchi T (1996) Modeling diffusion and reaction in soils: III.
predicting gas diffusivity from the campbell soil-water retention model. Soil Science 161: 366-375
Moldrup P, Olesen T, Schjonning P, Yamaguchi T, Rolston DE (2000) Predicting the gas diffusion
coefficient in undisturbed soil from soil water characteristics. Soil Science Society of America Journal 64:
94-100
Moldrup P, Olesen T, Yoshikawa S, Komatsu T, Rolston DE (2004) Three-porosity model for predicting the
gas diffusion coefficient in undisturbed soil. Soil Science Society of America Journal 68: 750-759
Moncrieff JB, Fang C (1999) A model for soil CO2 production and transport 2: Application to florida Pinus
elliotte plantation. Agricultural and Forest Meteorology 95: 237-256
Morén A-S, Lindroth A (2000) CO2 exchange at the floor of a boreal forest. Agricultural and Forest
Meteorology 101: 1-14
Nobuhiro T, Tamai K, Kominami Y, Miyama T, Goto Y, Kanazawa Y (2003) Development of the IRGA
enclosed-chamber system for soil CO2 efflux measurement and its application to a spatial variation
measurement. Journal of Forest Research 8: 297-301
Noguchi K, Sakata T, Mizoguchi T, Takahashi M (2004) Estimation of the fine root biomass in a Japanese
ceder (Cryptomeria japonica) planting using minirhizotrons. Journal of Forest Research 9: 261-264
Ohashi M, Gyokusen K, Saito A (1995) Effects of carbon dioxide concentration and wind speed using the
chamber method on soil respiration. Journal Japan Forest Society 77: 599-601
Ohashi M, Gyokusen K, Saito A (1999) Measurement of carbon dioxide evolution from a Japanese cedar
(Cryptomeria japonica D. Don) forest floor using an open-flow chamber method. Forest Ecology and
Management 123: 105-114
Osozawa S, Hasegawa S (1995) Diel and seasonal changes in carbon dioxide concentration and flux in an
Andisol. Soil Science 160: 117-124
Pumpanen J, Ilvesniemi H, Hari P (2003) A process-based model for predicting soil carbon dioxide efflux
and concentration. Soil Science Society of America Journal 67: 402-413
Raich JW, Tufekcioglu A (2000) Vegetation and soil respiration: Correlations and controls. Biogeochemistry
48: 71-90
Rustad LE, Huntington TG, Boone RD (2000) Controls on soil respiration: Implications for climate change.
Biogeochemistry 48: 1-6
Schlesinger WH, Andrews JA (2000) Soil respiration and the global carbon cycle. Biogeochemistry 48: 7-20
Shimada H, Toda H, Haibara K, Koike T (1998) Seasonal changes of CO2 gas concentration in forest soils at
different slope sites. Japanese Journal of Soil Science and Plant Nutrition 69: 170-177 (in Japanese with
English summary)
Šimunek J, Suarez DL (1993) Modeling of carbon dioxide transport and production in soil 1. Model
Development. Water Resources Research 29: 487-497
Suarez DL, Šimunek J (1993) Modeling of carbon dioxide transport and production in soil 2. Parameter
selection, sensitivity analysis, and comparison of model predictions to field data. Water Resources Research
29: 499-513
Suwa M, Katul GG, Oren R, Andrews J, Pippen J (2004) Impact of elevated atmospheric CO2 on forest floor
respiration in a temperate pine forest. Global Biogeochemical Cycles 18: GB2013,
doi:10.1029/2003GB002182
Tamai K, Kominami Y, Miyama T, Goto Y (2005) Temporal fluctuations in the CO2 efflux on a forest floor -
The case of an extremely immature forest soil-. Journal of Agricultural Meteorology 60: 773-776
Tang J, Baldocchi DD, Qi Y, Xu L (2003) Assessing soil CO2 efflux using continuous measurements of CO2
profiles in soils with small solid-state sensors. Agricultural and Forest Meteorology 118: 207-220

Self-Archive
15
Zak DR, Holmes WE, MacDonald NW, Pregitzer KS (1999) Soil temperature, matric potential, and the
kinetics of microbial respiration and nitrogen mineralization. Soil Science Society of America Journal 63:
575-584
Table
Case Run Parameters
Case 1 Runs 1-3 Production rates varied except in the shallowest layer
Case 2 Runs 4-6 Production rates varied in every layer
Case 3 Runs 7-9 Production rates varied only in the shallowest layer
Case 4 Runs 10-15 Soil water content varied
Case 5 Runs 16-22 Soil temperatures varied more at shallower depths
Case 6 Runs 23-25 The depth at which gas diffusivity was high and constant varied
Case 7 Runs 26-28 The value of the gas diffusion coefficient at the soil surface
varied
Table 1: Sensitivity analyses conducted in this study. Production rate, soil water content
and temperature, and soil surface gas diffusivity varied.
Figures
Figure 1: Relationships between air-filled porosity and relative gas diffusivity.
Figure 2: Sensitivity analysis: Various vertical profiles of CO2 production rate were assumed, and
the CO2 gas concentration profile and soil surface CO2 flux were simulated.
Figure 3: Sensitivity analysis: Given vertical profiles of soil water or soil temperature, the CO2
concentration profile and soil surface CO2 flux were simulated. Soil water content at 0.2 m depth
compared with soil surface CO2 flux (c). Temperatures at 0, 0.1, and 0.3 m depths were compared
with the soil surface CO2 flux (f).
Figure 4: Sensitivity analysis: The CO2 concentration profile and soil surface CO2 flux were
simulated for different soil surface gas diffusivities.