Embed Size (px)
Citation preview
RELATIONSHIPS BETWEEN PHYSICOCHEMICAL PROPERTIES AND
HARD-TO-COOK PHENOMENON OF DRY COMMON BEANS
By
ROSETTE NAKALEMA
A THESIS
Submitted to
Michigan State University
in partial fulfillment of the requirements
for the degree of
Food Science - Master of Science
2015

ABSTRACT
RELATIONSHIPS BETWEEN PHYSICOCHEMICAL PROPERTIES AND
HARD-TO-COOK PHENOMENON OF DRY BEANS
By
ROSETTE NAKALEMA
Common beans (Phaseolus vulgaris) are one of the most important legumes cultivated
worldwide today. Despite the fact that all beans have a long cooking time, some beans cook
faster than others. The objective of this study was to determine the physicochemical properties of
dry common beans influencing their cooking time. Three genotypes of yellow and three of red
mottled beans from both Puerto Rico and Tanzania locations were used in the study. In order to
ascertain the relationships among physiochemical properties and cooking times, the properties
such as seed coat weight and thickness, calcium and magnesium contents, protein content, starch
content, starch gelatinization and protein denaturation temperatures, and pectin content were
determined.
Ascending order of cooking time for yellow bean varieties was ADP-521, ADP-111 and
ADP-513, and for red mottled bean varieties was ADP-443, ADP-436 and ADP-434. There was
no significant difference in cooking time of soaked and dehulled studied bean varieties. Country
of origin had no effect on the trend of cooking time. Among the studied physicochemical
properties, seed coat thickness, starch content, total pectin content, and hot water soluble pectin
content each was associated with cooking time of the studied dry bea
iii
ACKNOWLEDGEMENTS
I am very much grateful to the Almighty God for his grace, love and care throughout the two years
at Michigan State University. My sincere gratitude goes out to MasterCard Foundation Scholars
program for offering me a great opportunity to study here at MSU.
My earnest appreciation goes to my adviser Professor Perry Ng and my research committee
members, Dr. Karen Cichy and Professor Gale Strasburg, for all their guidance, encouragement
and supervision they offered in accomplishing this work. I am appreciative of their confidence in
me, patience, correction and aid during the course of this project. Great thanks go to Dr. YongFeng
Ai, Dr. Jin Yining, Yasmin Salat and Jason Wiesinger for sharing with me their technical expertise
and guidance. Heartfelt gratitude goes to my family and friends who have given me pecuniary,
devout and moral support even when I was a thousand miles away.
iv
TABLE OF CONTENTS
LIST OF TABLES ........................................................................................................................ vii
LIST OF FIGURES ..................................................................................................................... viii
KEY TO ABBREVIATIONS ......................................................................................................... x
CHAPTER 1 ................................................................................................................................... 1
INTRODUCTION AND PROBLEM STATEMENT .................................................................... 1
CHAPTER 2 ................................................................................................................................... 4
LITERATURE REVIEW ............................................................................................................... 4
2.1. Physicochemical properties influencing cooking time of beans .......................................... 4
2.1.1 Introduction .................................................................................................................... 4
2.1.2. Bean seed coat ............................................................................................................... 4
2.1.3. Bean cotyledon .............................................................................................................. 8
2.1.4. Proteins .......................................................................................................................... 8
2.1.5. Starch ........................................................................................................................... 10
2.2. Proposed mechanisms of the HTC Phenomenon ............................................................... 13
2.3. Factors influencing the HTC phenomenon ........................................................................ 15
2.3.1.1 Time ........................................................................................................................... 15
2.3.1.2. Relative Humidity and Temperature ........................................................................ 15
2.3.2.1 Polyphenolic compounds ........................................................................................... 16
2.3.2.2. Phytic acid ................................................................................................................ 18
2.3.2.3. Dietary fiber .............................................................................................................. 19
2.3.2.4. Pectin ........................................................................................................................ 20
2.3.2.5. Divalent cations ........................................................................................................ 21
2.3.2.6. Starch content and starch gelatinization temperature ............................................... 25
2.4. Methods used to reduce cooking time of dry common beans ............................................ 26
2.4.1. Soaking ........................................................................................................................ 26
2.4.2. Micronization............................................................................................................... 27
2.4.3. Dehulling ..................................................................................................................... 27
2.5. Knowledge gaps ................................................................................................................. 28
v
2.6. Hypothesis .......................................................................................................................... 29
2.7. Objectives ........................................................................................................................... 29
CHAPTER 3 ................................................................................................................................. 30
METHODS AND PROCEDURES............................................................................................... 30
3.1. Materials: Dry common bean samples ........................................................................... 30
3.2. Sample preparation ......................................................................................................... 32
3.3. Determination of cooking time ....................................................................................... 32
3.4. Determination of the percentage of seed coat weight..................................................... 33
3.5. Measurement of the seed coat thickness......................................................................... 33
3.6. Determination of calcium and magnesium contents ....................................................... 36
3.7. Determination of total protein content............................................................................ 36
3.8. Determination of total starch content of the common bean varieties ............................. 37
3.9. Thermal properties of common dry beans ...................................................................... 38
3.10. Extraction and determination of contents of hot water soluble pectin and hot water
insoluble pectin and total pectin of dry common beans. ....................................................... 39
3.11. Statistical analysis of data............................................................................................. 41
CHAPTER 4 ................................................................................................................................. 42
RESULTS AND DISCUSSION ................................................................................................... 42
4.1. Effect of processing on cooking time of common beans................................................ 42
4.2. Percentage seed coat weight ........................................................................................... 48
4.3. Seed coat thickness ......................................................................................................... 50
4.4. Calcium and magnesium contents .................................................................................. 56
4.5. Protein content ................................................................................................................ 59
4.6. Starch content ................................................................................................................. 61
4.7. Hot water soluble pectin (HWSP) content ..................................................................... 64
4.8. Hot water insoluble pectin (HWIP) content ................................................................... 67
4.9. Total Pectin ..................................................................................................................... 68
4.10. Starch gelatinization temperature ................................................................................. 69
4.11. Protein denaturation temperature.................................................................................. 71
CHAPTER 5 ................................................................................................................................. 72
CONCLUSIONS AND RECOMMENDATIONS ....................................................................... 72
vi
APPENDIX ................................................................................................................................... 73
REFERENCES ............................................................................................................................. 79
vii
LIST OF TABLES
Table 1. Overall Mineral Content of Phaseolus vulgaris (Common beans). Source: Salunkhe and
Kadam (1989) ................................................................................................................................24
Table 2. Cooking times of raw tempered yellow (Y) and red mottled (R) beans from Puerto Rico
(PR) and Tanzania (TZ); beans were raw (not soaked or dehulled), soaked, or dehulled before
cooking1 .........................................................................................................................................43
Table 3. Seed coat weight (%) and thickness (µm) of fast, moderate and slow cooking yellow
and red mottled beans from Puerto Rico and Tanzania1 ................................................................49
Table 4. Correlation coefficients between cooking time of raw common beans and their
physicochemical properties: protein content, gelatinization temperature, denaturation
temperature, seed coat weight, seed coat thickness, magnesium content, and calcium contents,
starch content, hot water soluble pectin, hot water insoluble pectin, and total pectin for dry
common beans from Tanzania and Puerto Rico locations1 ...........................................................55
Table 5. Calcium and magnesium contents of whole seeds of fast, moderate, and slow cooking
yellow and red mottled common dry beans from Puerto Rico and Tanzania locations1 ...............57
Table 6. Protein concentration of fast, moderate, and slow cooking yellow and red mottled
common dry beans varieties from Puerto Rico and Tanzania locations1 .......................................60
Table 7. Starch contents of raw fast, moderate, and slow cooking yellow and red mottled dry
common beans from Puerto Rico and Tanzania locations1 ...........................................................63
Table 8. Hot water soluble pectin (HWSP), hot water insoluble pectin (HWIP), and total pectin
(Total) of six fast (F), moderate (M), and slow (S) cooking common bean varieties of yellow (Y)
and red mottled (R) beans grown in Puerto Rico and Tanzania locations1 ...................................66
Table 9. Starch gelatinization and protein denaturation temperatures of dry common bean
varieties of yellow and red mottled beans from Puerto Rico and Tanzania locations1..................70
Table 10. Correlation coefficients among physicochemical properties of dry common beans:
cooking time (CK) protein content (PC), protein solubility (PS), Gelatinization temperature
(GT), Denaturation temperature (DT), seed coat weight (SCW), seed coat thickness (SCT),
magnesium content (MC) and calcium content(CA), starch content (SC), HWSP, HWSIP and
total pectin (PC) for dry common beans ........................................................................................76
viii
LIST OF FIGURES
Figure 1. A cross section of a mature broad bean seed with one cotyledon removed. Source:
Salunkhe and Kadam (1991) ........................................................................................................... 5
Figure 2. A microstructure of mung bean seed coat and cotyledon: PC= Palisade cells; MC=
Mesophyll cells; SP= Spongy cells. Source: Salunkhe and Kadam (1991) .................................... 7
Figure 3. Scanning electron microscope (SEM) photomicrographs for chick pea cotyledon; (A)
dry and (B) soaked; S-starch globule, ECS-Extra cellular space. Source: Tiwari and others
(2011). ............................................................................................................................................. 9
Figure 4. Chemical structure of amylose and amylopectin Source: Tester and others (2004). .... 12
Figure 5. Scanning Electron Microscope images of the middle lamella between three cells of
bean cotyledon stored under different conditions for 6.5 months. (A) Control (5oC/40% RH) and
(B) HTC (35oC/75% RH). Source: Mohan and others (2011). .................................................... 14
Figure 6. The polyphenol units commonly found in common beans. Source: Petry and others,
(2015). ........................................................................................................................................... 17
Figure 7. Dry common bean genotypes used in the study. ........................................................... 31
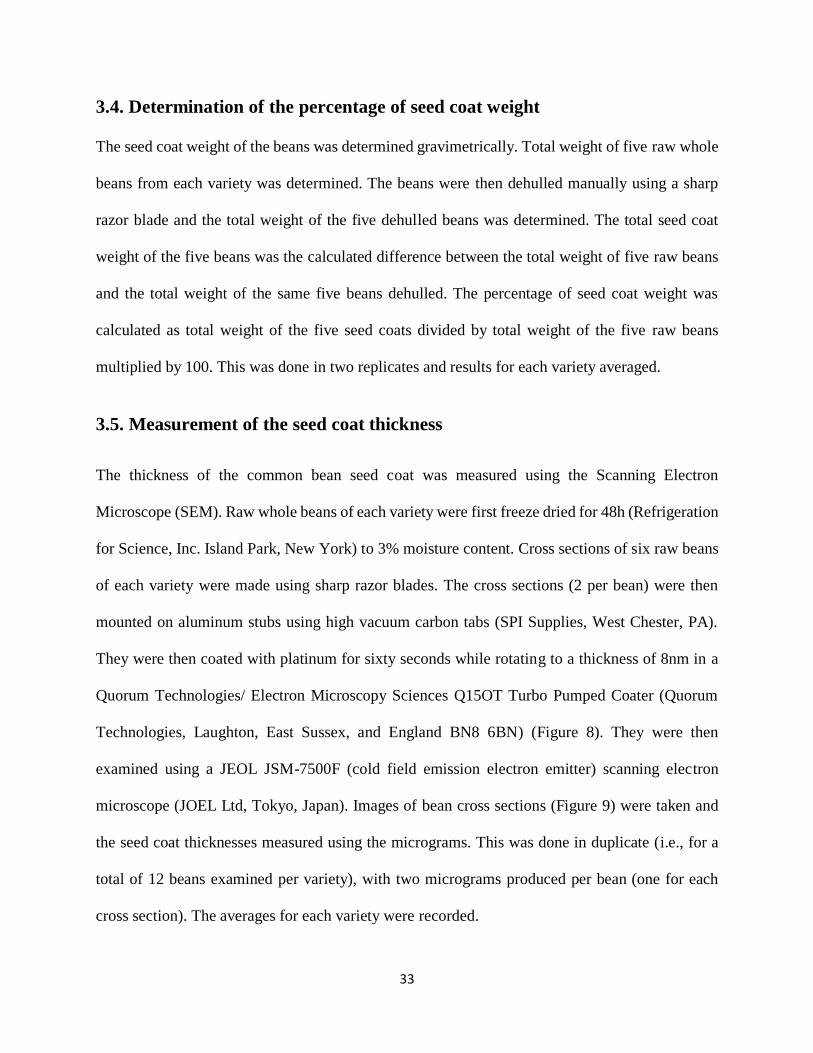
Figure 8. Cross sections of raw beans mounted on aluminum stubs in a Turbo Pumped Coater for
platinum coating............................................................................................................................ 34
Figure 9. SEM image of a cross section of a raw ADP-513-S common bean seed from Puerto
Rico with four seed coat thickness measurements indicated (in orange). .................................... 35
Figure 10. Cross-sections of seed coats for fast, moderate and slow cooking common beans by
Scanning Electron Microscope (SEM). Y-521-F = fast cooking, Y-111-M = moderate cooking
and Y-513-S = slow cooking for yellow beans. R-443-F = fast cooking, R-436-M = moderate
cooking and R-434-S = slow cooking for red mottled beans ....................................................... 53
Figure 11. The peak gelatinization (first peak) and peak denaturation (second peak) temperatures
of dry common beans from Tanzania. .......................................................................................... 74
Figure 12. The peak gelatinization (first peak) and peak denaturation (second peak) temperatures
of dry common beans from Puerto Rico. ...................................................................................... 75
Figure 13. Cooking time of raw tempered yellow (Y) and red mottled beans (R) from Puerto
Rico (PR) and Tanzania (TZ) that were raw (not soaked or dehulled), soaked and dehulled before

ix
cooking. Data represent means and standard deviations. Values of each bar topped by the same
letter are not significantly different (P ≤ 0.05) from each other. .................................................. 77
Figure 14. Hot water soluble pectin (HWSP), hot water insoluble pectin (HWIP), and total pectin
(Total) of six fast (F), moderate (M), and slow (S) cooking common bean varieties of yellow (Y)
and red mottled (R) beans grown in Puerto Rico and Tanzania locations. Data represent means
and standard deviations of n=2. Values of each bar topped by the same letter are significantly
different (P ≤ 0.05) from each other. ............................................................................................ 78
x
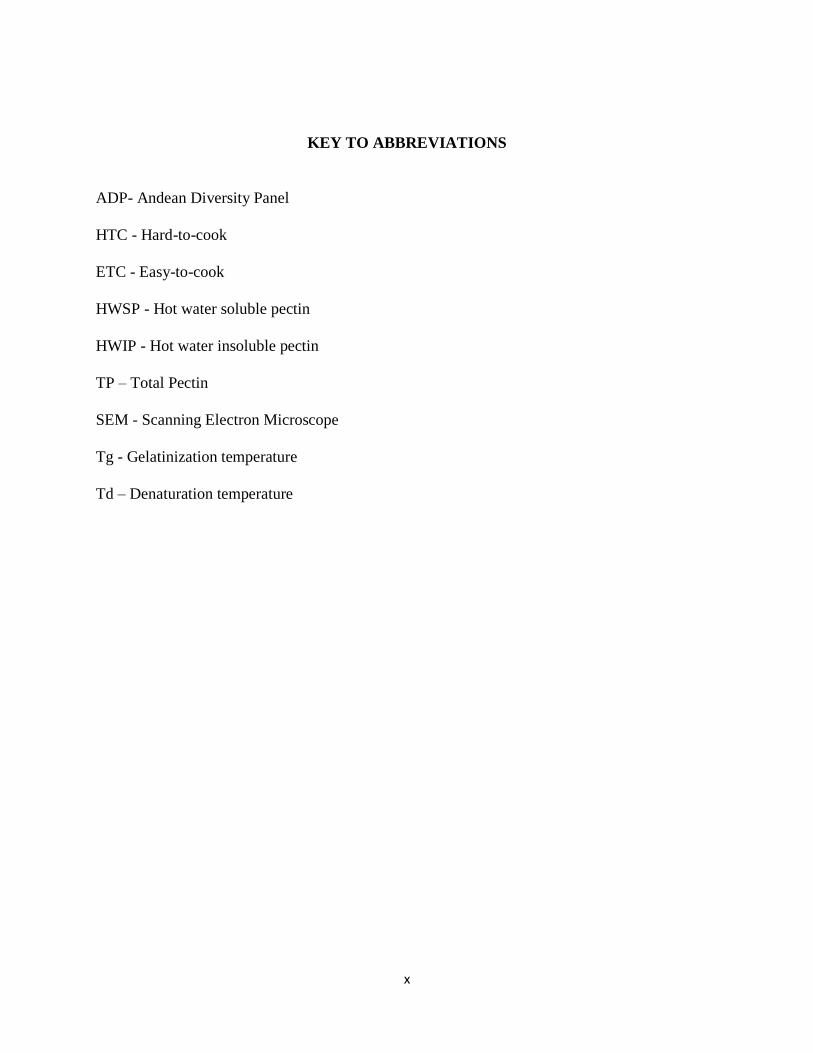
KEY TO ABBREVIATIONS
ADP- Andean Diversity Panel
HTC - Hard-to-cook
ETC - Easy-to-cook
HWSP - Hot water soluble pectin
HWIP - Hot water insoluble pectin
TP – Total Pectin
SEM - Scanning Electron Microscope
Tg - Gelatinization temperature
Td – Denaturation temperature
1
CHAPTER 1
INTRODUCTION AND PROBLEM STATEMENT
Common beans (Phaseolus vulgaris L.) are one of the most important legumes cultivated
worldwide today (El-Tabey Shehata, 1992) and a major source of food to large populations of
people in the world. They originated from South and Central America. There are different market
classes of beans which are differentiated according to seed size, color and shape. Examples include
yellow beans, red mottled beans, pinto beans, kidney beans, black beans, etc. They are a good
source of dietary protein, fiber, starch, vitamins and minerals (Kaur and others, 2013).
Unlike fresh common beans, dry beans require a long cooking time, which has been a problem for
centuries. Cooking dry beans is time consuming and, most importantly, energy consuming. Beans
being a staple food commonly eaten as a protein source, they are the biggest component of most
school children’s diet in Uganda. In most African countries, particularly Uganda, firewood is the
main source of energy for cooking since the biggest percentage of population cannot afford gas
and electricity. This implies that a lot of trees are cut down per day for this cause, which has
detrimentally degraded the environment. For developed countries that mainly use gas or electricity,
cooking beans is costly since more gas or electricity is needed to cook dry beans than other foods
like rice or beef. This justifies the importance of studying relationships among cooking time and
physiochemical properties of dry beans in hopes of eventually producing varieties with shorter
cooking times.
Past studies have proven that long cooking time of dry beans is a result of beans hardening during
storage. This is known as the hard-to-cook (HTC) phenomenon. Long storage time, high
2
temperatures and high relative humidity are factors that were reported to enhance the hardening
phenomenon of beans (Aguilera and Stanley, 1985). There are two possible mechanisms by which
storage hardens the beans: (1) pectin-phytate crosslinking in the cell walls and (2) lignification
(Aguilera and Stanley, 1985). The latter is a result of deposition of lignin-like material into the
cell walls from the seed coat, thus hardening them (Stanley and others, 1989; Stanley, 1992).
Pectin-phytate crosslinking is promoted by high temperature and relative humidity storage
conditions. Under these conditions, phytic acid undergoes hydrolysis, releasing the bound divalent
cations, i.e., calcium and magnesium. These cations then move to the middle lamella where they
participate in crosslinking of the enzymatically demethoxylated pectin substances and phenolic
compounds, thus hardening the cell walls (Del Valle and Stanley, 1995). This hardening of the
bean cell walls increases the bean’s cooking time. In an effort to save energy and time, several
methods have been adopted to reduce the cooking time (i.e., easy-to-cook, ETC, methods), such
as soaking (in water, sodium and potassium salt solutions), micronization, pressure cooking, and
dehulling.
The HTC effect develops in all dry beans regardless of the variety. However, some varieties have
inherently longer cooking times than others. Maryange and others (2010) reported a significant
difference in cooking time among 30 bean lines that were tested, with times ranging from 29-83
minutes using the Matson method (Maryange and others, 2010). These differences were
maintained even when dry beans were preconditioned (soaking of dry beans in distilled water for
4 hours) before cooking. Cooking time of beans is said to be a genetic trait (Singh, 1999), but it is
also associated with factors such as seed size, seed coat color and thickness, the cotyledon and
seed coat chemical compositions, and the size of the micropyle and hilum (Mkanda and others,

3
2007). However, it is still not fully understood why some varieties cook faster than others. The
aim of this study was to understand if the physicochemical properties influencing the HTC
mechanism are associated with the varietal differences in cooking time of different market classes
of dry common beans. Information generated from this study could be used by plant breeders to
perform targeted genetic engineering in order to develop bean varieties with shortened cooking
times.
4
CHAPTER 2
LITERATURE REVIEW
2.1. Physicochemical properties influencing cooking time of beans
2.1.1 Introduction
A mature dry common bean seed (hereafter referred to as bean) is mainly comprised of two
cotyledons and a seed coat. The cotyledons comprise 80-90% and the seed coat 8-20% of the total
seed weight (Sathe and Deshpande, 2003). There are different market classes of beans, which are
differentiated according to seed size, color and shape. The cooking time of beans is greatly
influenced by both physicochemical properties and environmental factors. The physicochemical
properties include seed size, seed coat color and thickness, the cotyledon and seed coat chemical
compositions, and size of the micropyle and hilum (Mkanda and others, 2007). The environmental
factors are temperature and relative humidity of the storage environment.
2.1.2. Bean seed coat
A seed coat is an outer layer of a bean seed (Figure 1) that protects the inner part of the seed from
the external environment (Reyes-Moreno and Paredes-Lopes, 1993). It is rich in minerals such as
calcium and iron (Sathe and Dashpande, 2003). In addition, the cell walls of the seed coat are
reported to have high amounts of fiber including cellulose (59.4 to 60.7%), hemicelluloses (17.4
to 25.8%), pectin substances (11.1 to 15.9%) and lignin (1.4 to 1.9%).
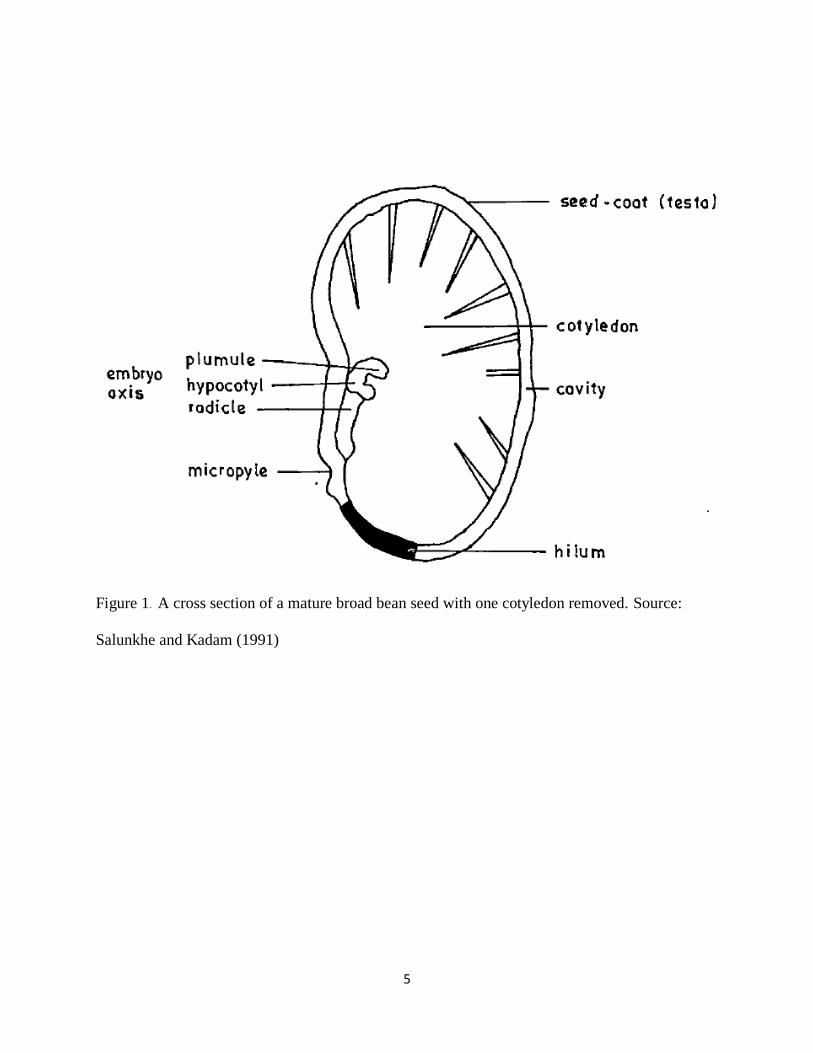
5
Figure 1. A cross section of a mature broad bean seed with one cotyledon removed. Source:
Salunkhe and Kadam (1991)
6
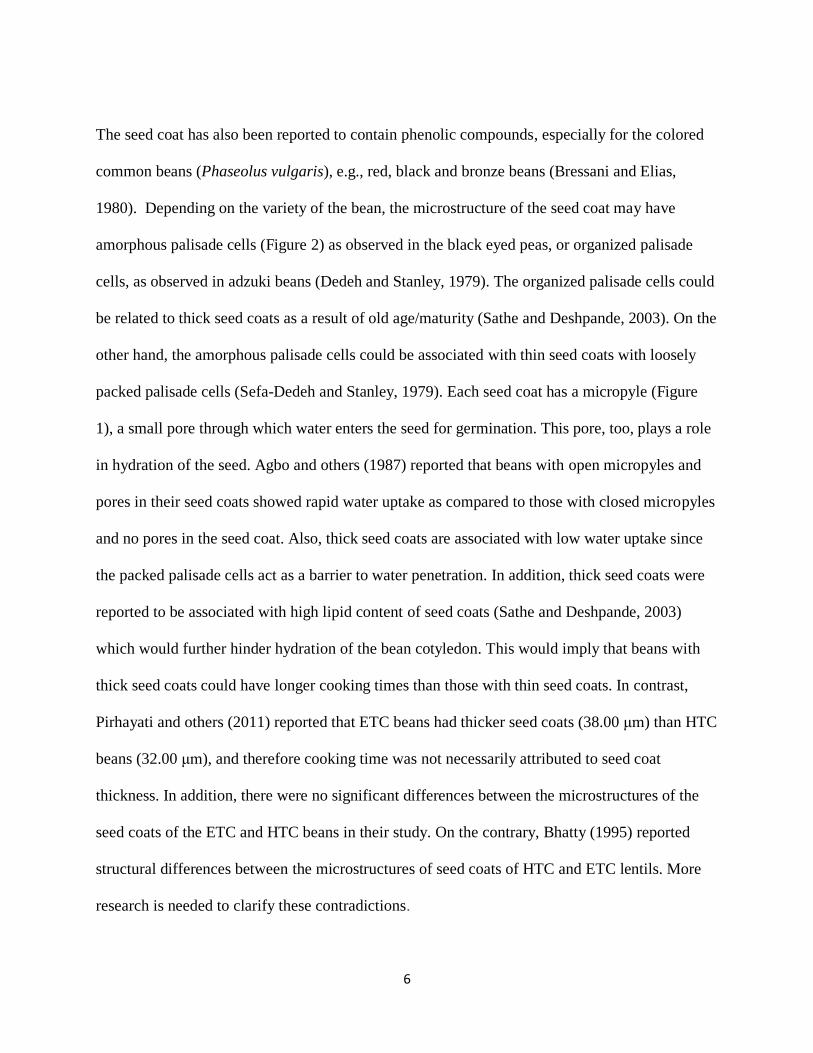
The seed coat has also been reported to contain phenolic compounds, especially for the colored
common beans (Phaseolus vulgaris), e.g., red, black and bronze beans (Bressani and Elias,
1980). Depending on the variety of the bean, the microstructure of the seed coat may have
amorphous palisade cells (Figure 2) as observed in the black eyed peas, or organized palisade
cells, as observed in adzuki beans (Dedeh and Stanley, 1979). The organized palisade cells could
be related to thick seed coats as a result of old age/maturity (Sathe and Deshpande, 2003). On the
other hand, the amorphous palisade cells could be associated with thin seed coats with loosely
packed palisade cells (Sefa-Dedeh and Stanley, 1979). Each seed coat has a micropyle (Figure
1), a small pore through which water enters the seed for germination. This pore, too, plays a role
in hydration of the seed. Agbo and others (1987) reported that beans with open micropyles and
pores in their seed coats showed rapid water uptake as compared to those with closed micropyles
and no pores in the seed coat. Also, thick seed coats are associated with low water uptake since
the packed palisade cells act as a barrier to water penetration. In addition, thick seed coats were
reported to be associated with high lipid content of seed coats (Sathe and Deshpande, 2003)
which would further hinder hydration of the bean cotyledon. This would imply that beans with
thick seed coats could have longer cooking times than those with thin seed coats. In contrast,
Pirhayati and others (2011) reported that ETC beans had thicker seed coats (38.00 μm) than HTC
beans (32.00 μm), and therefore cooking time was not necessarily attributed to seed coat
thickness. In addition, there were no significant differences between the microstructures of the
seed coats of the ETC and HTC beans in their study. On the contrary, Bhatty (1995) reported
structural differences between the microstructures of seed coats of HTC and ETC lentils. More
research is needed to clarify these contradictions.
7
Figure 2. A microstructure of mung bean seed coat and cotyledon: PC= Palisade cells; MC=
Mesophyll cells; SP= Spongy cells. Source: Salunkhe and Kadam (1991)
PC
SC
MC
8
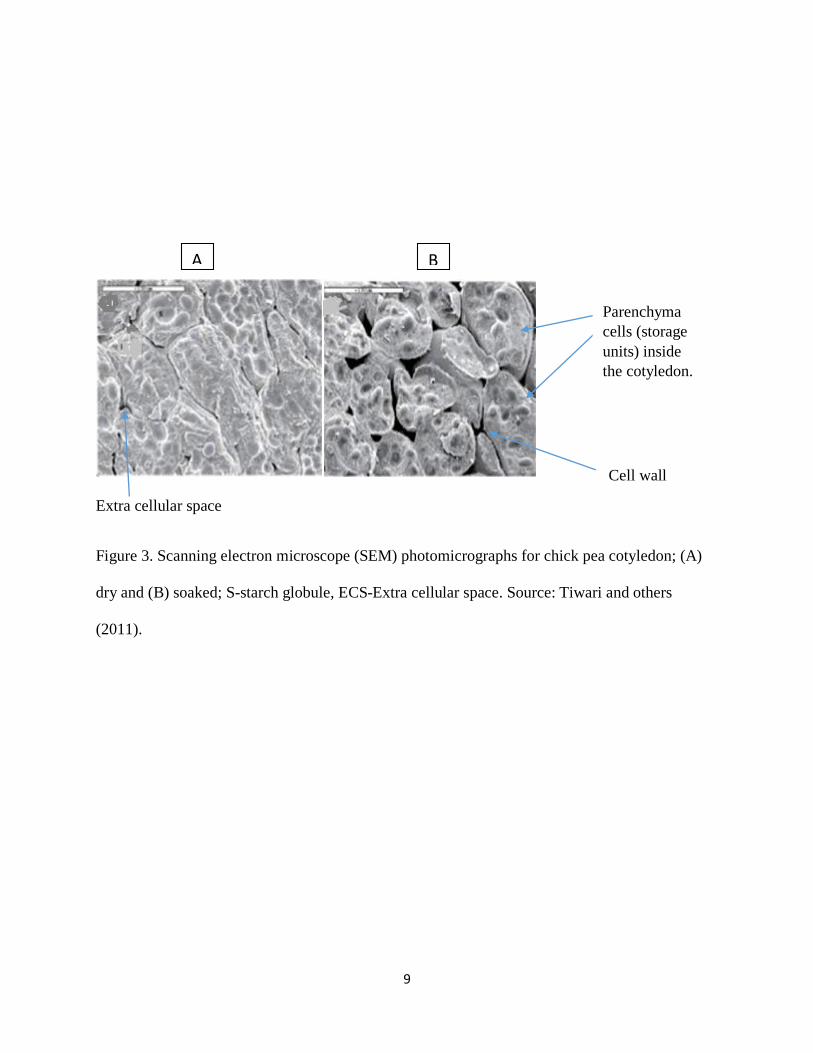
2.1.3. Bean cotyledon
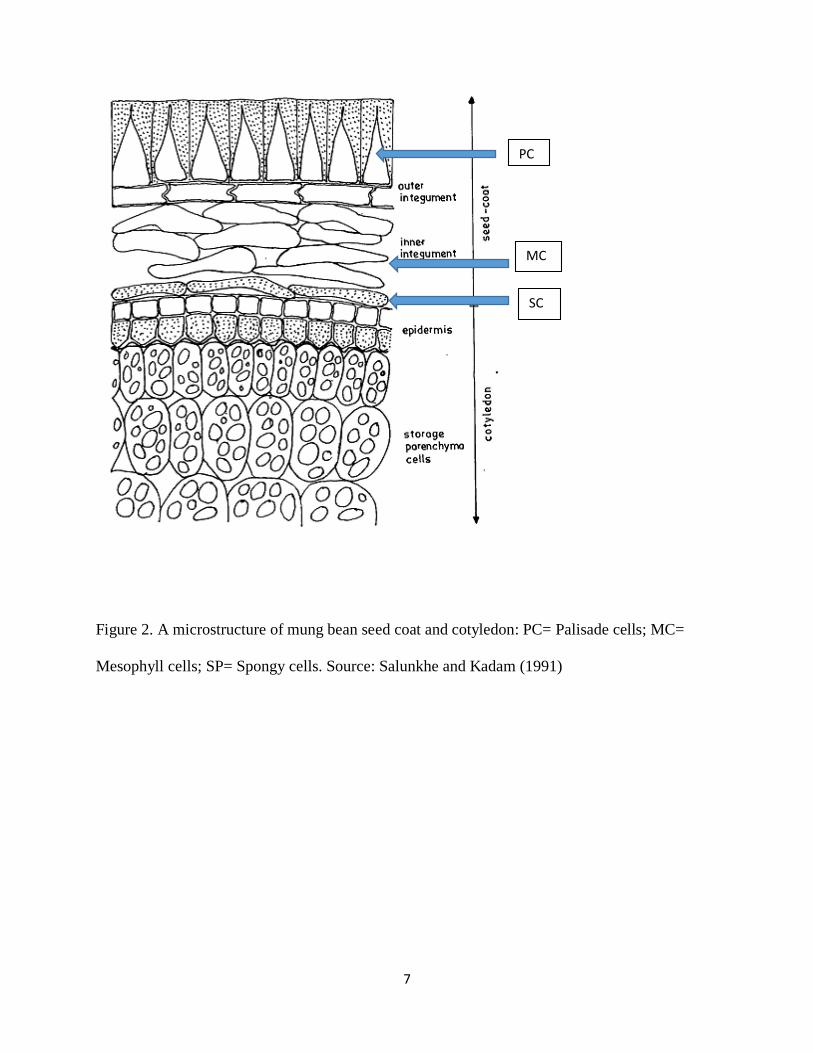
A common bean seed is composed of two cotyledons covered with a seed coat. The cotyledons
contain parenchyma cells (Figure 3) which are the storage units for most of the seed’s nutrients,
e.g., protein bodies and starch granules (Sefa-Dedeh and Stanley, 1979b). Each cell wall contains
15 to 25% protein, 50 to 75% carbohydrates and 0.4 to 0.6% lignin (Sathe and Deshpande, 2003).
Reyes and Paredes-Lopez (1993) reported that cotyledon cell walls also contain non-starch
polysaccharides including cellulose (25.9 to 30.9%) and, pectin substances (28.5 to 41.2%) in the
middle lamella.
2.1.4. Proteins
The common bean (Phaseolus vulgaris L.) contains 18-25% proteins, most of which are salt-
soluble globulins (45 to 70%) and water-soluble albumins (10 to 30%) (Chung and others, 2008).
Proteins play a major role in water absorption in the parenchyma cells of the cotyledon.
However, the cells do not have direct contact with water because of the seed coat which is a
barrier to water movement (Sefah-Dedeh and Stanley, 1979b). Proteins form a matrix around the
starch granules, which hinders hydration of the granules. The different packing densities of the
parenchyma cells also affect hydration (Jones and Boutler, 1983). Bernal-Lugo and others (1997)
discovered that an easy-to-cook (ETC) bean (variety Michigan 800) had a higher protein content
(252.4 mg/g) than a HTC bean (variety Ojo de Cabra, 219.0 mg/g).
9
Extra cellular space
Figure 3. Scanning electron microscope (SEM) photomicrographs for chick pea cotyledon; (A)
dry and (B) soaked; S-starch globule, ECS-Extra cellular space. Source: Tiwari and others
(2011).
Parenchyma
cells (storage
units) inside
the cotyledon.
Cell wall
B A
10
It is not known however, if other genotypes of the same market classes would behave in the same
way in terms of cooking time. If protein content does not have an influence on cooking time,
perhaps its functional properties such as denaturation temperature could play a role. Reyes-Moreno
and others (1994) reported that ETC beans (variety Michigan 800) had a lower protein denaturation
temperature (88.6oC) than that of HTC beans (variety Ojo de Cabra, 95.3oC), and indicated that
this affected the cooking time of beans. On the contrary, Bernal-Lugo and others (1997) reported
that both ETC and HTC beans had similar protein denaturation temperatures (103oC and 104oC,
respectively) and therefore protein denaturation temperature did not appear to contribute to
cooking time.
The other functional property that may influence cooking time of beans is protein solubility.
Coelho and others (2011) reported that in their studied beans, a decrease in soluble proteins was
associated with increases in storage time and cooking time. They concluded that the high storage
temperature induced protein denaturation, which caused coagulation of protein thus reducing its
solubility. It is not known if common beans stored under similar conditions (e.g., temperature and
time), but with different cooking times, will exhibit similar protein solubility properties.
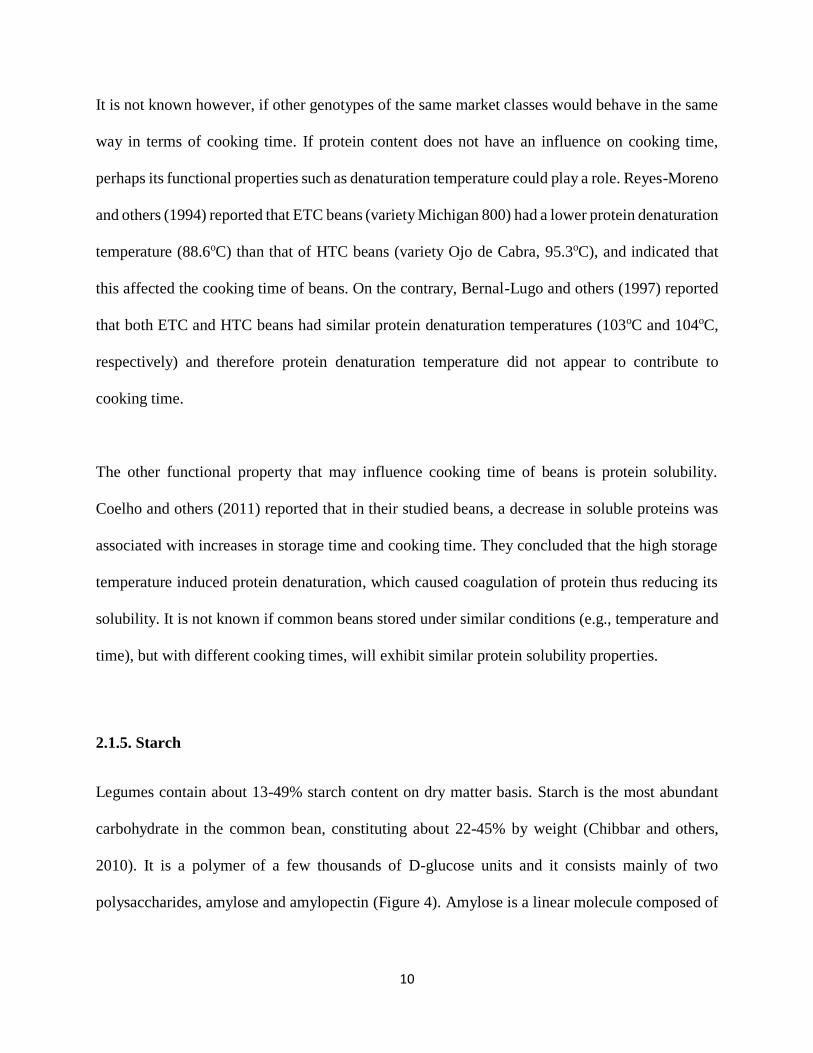
2.1.5. Starch
Legumes contain about 13-49% starch content on dry matter basis. Starch is the most abundant
carbohydrate in the common bean, constituting about 22-45% by weight (Chibbar and others,
2010). It is a polymer of a few thousands of D-glucose units and it consists mainly of two
polysaccharides, amylose and amylopectin (Figure 4). Amylose is a linear molecule composed of

11
D-glucose units linked by α 1-4 linkages. Amylopectin is a branched molecule of D-glucose units
with about 5% α 1-6 branch linkages. It has a molecular weight of 10 9 g/mole (Jane, 2012).
12
Figure 4. Chemical structure of amylose and amylopectin Source: Tester and others (2004).
13
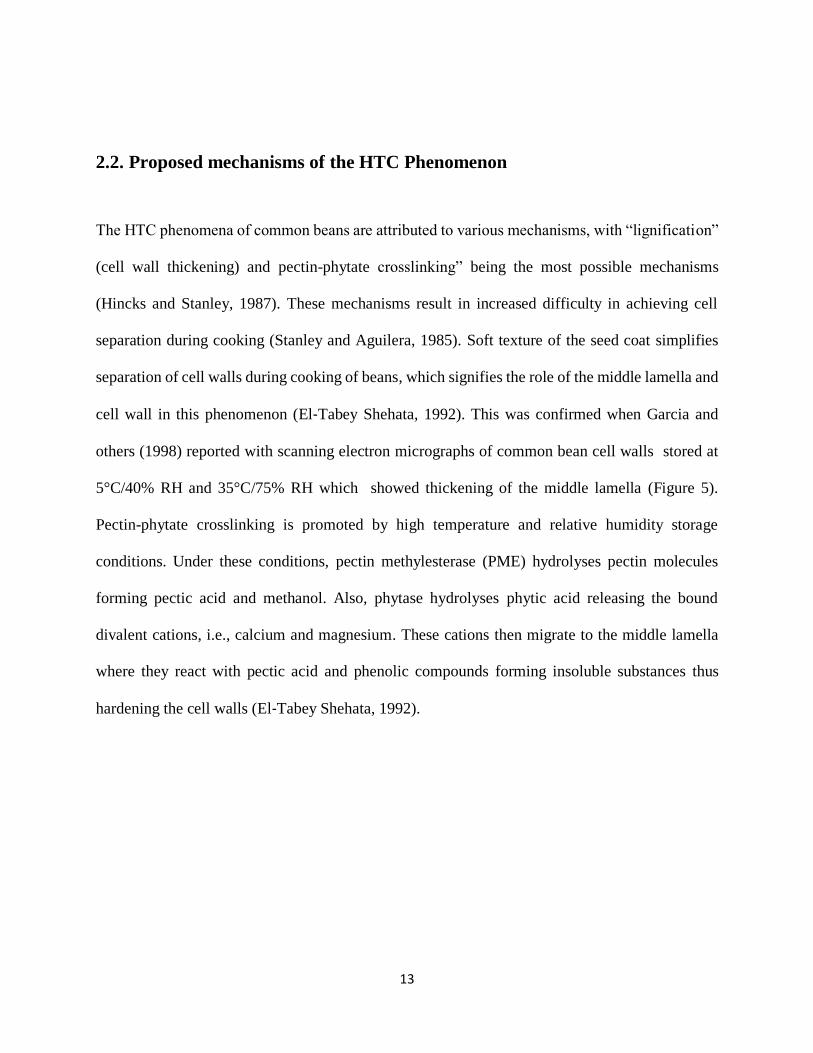
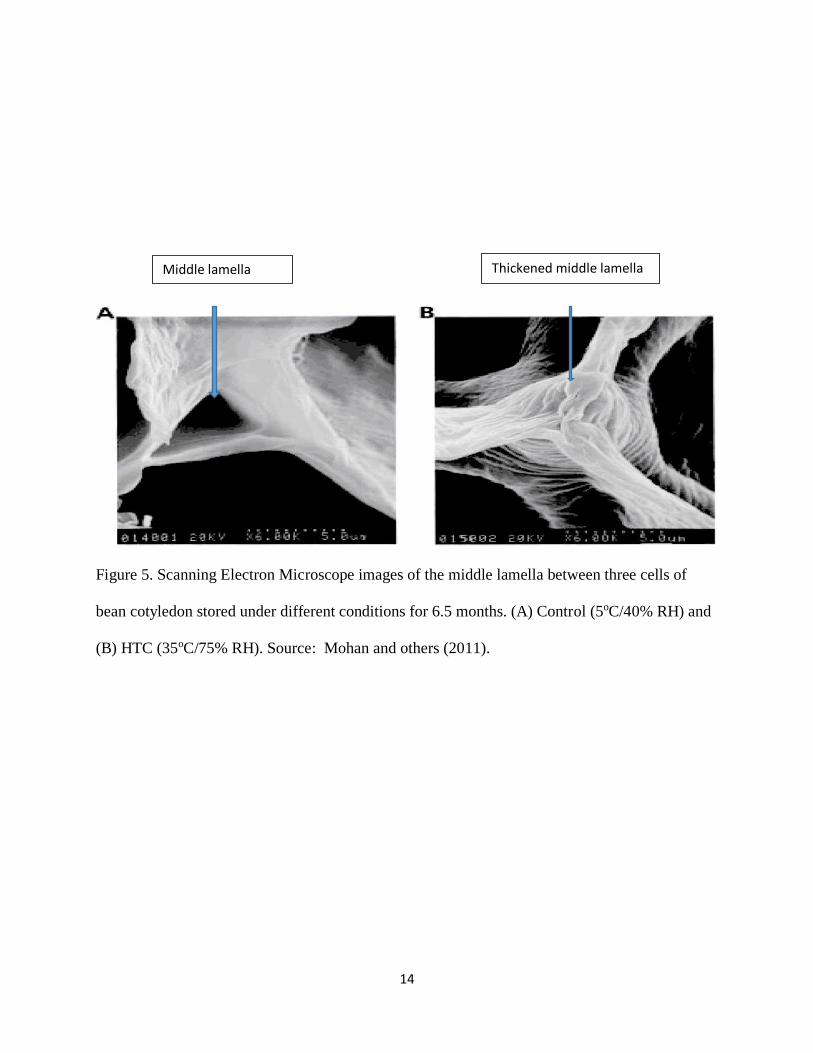
2.2. Proposed mechanisms of the HTC Phenomenon
The HTC phenomena of common beans are attributed to various mechanisms, with “lignification”
(cell wall thickening) and pectin-phytate crosslinking” being the most possible mechanisms
(Hincks and Stanley, 1987). These mechanisms result in increased difficulty in achieving cell
separation during cooking (Stanley and Aguilera, 1985). Soft texture of the seed coat simplifies
separation of cell walls during cooking of beans, which signifies the role of the middle lamella and
cell wall in this phenomenon (El‐Tabey Shehata, 1992). This was confirmed when Garcia and
others (1998) reported with scanning electron micrographs of common bean cell walls stored at
5°C/40% RH and 35°C/75% RH which showed thickening of the middle lamella (Figure 5).
Pectin-phytate crosslinking is promoted by high temperature and relative humidity storage
conditions. Under these conditions, pectin methylesterase (PME) hydrolyses pectin molecules
forming pectic acid and methanol. Also, phytase hydrolyses phytic acid releasing the bound
divalent cations, i.e., calcium and magnesium. These cations then migrate to the middle lamella
where they react with pectic acid and phenolic compounds forming insoluble substances thus
hardening the cell walls (El‐Tabey Shehata, 1992).
14
Figure 5. Scanning Electron Microscope images of the middle lamella between three cells of
bean cotyledon stored under different conditions for 6.5 months. (A) Control (5oC/40% RH) and
(B) HTC (35oC/75% RH). Source: Mohan and others (2011).
Middle lamella Thickened middle lamella
15
2.3. Factors influencing the HTC phenomenon
2.3.1.1 Time
The cooking time of dry beans depends not only on the genotype of the common bean (Singh,
1999), but also on storage conditions, including storage time, temperature and relative humidity
(Nasar-Abbas and others, 2008). Duration of storage of beans is one of the main factors influencing
cooking time of beans. The longer the storage time, the harder the texture of the dry beans.
However, rate of bean texture hardening depends on the storage conditions such as relative
humidity and temperature. Moscosco and others (1984) reported an increase in hardness with
increasing storage time of red kidney beans stored for 9 months. Furthermore, Curtis (1991)
studied a relationship between bean texture hardness and soaking time before cooking, where fresh
and aged beans were soaked for 0, 20 and 44 hours and their texture hardnesses determined. Aged
beans were observed to have the greatest hardness at each of the soaking times.
2.3.1.2. Relative Humidity and Temperature
Jones and Boulter (1983) reported that high relative humidity (RH) of the storage environment is
an initiation stage of the hardening effect of beans. It allows metabolic breakdown of the cell wall
allowing bivalent ions from hydrolyzed phytate to access pectin making the latter insoluble.
Hentges and others (1991) studied the effects of storage temperature and humidity on physical and
chemical components of beans. They reported that seeds stored at 29oC and 65% RH required a
longer cooking time than seeds stored at 5oC and 30% RH, or 29oC and 30% RH, or 5oC and 65%
RH. There is a linear relationship between HTC effect and high storage temperature. Nasar-Abbas
and others (2008) reported a linear increase in the HTC effect on Faba beans with high storage
16
temperatures of > 37oC. In addition, Reyes-Moreno and others (2001) reported a long cooking
time of chick peas after storing them at temperatures > 25oC and relative humidities > 65%.
Furthermore, storage of beans under high temperature and relative humidity conditions was
reported by Kon and Sanshuck (1981) to have increased cooking time by about 5-fold. Similarly,
prolonged storage of dry beans at high temperatures (30-35oC) and high relative humidities (60-
80%) has been reported to elevate the HTC phenomenon (Taiwo, 1998). It is not clear which one
of the three factors (time, temperature, or relative humidity) is the major contributor to the HTC
effect.
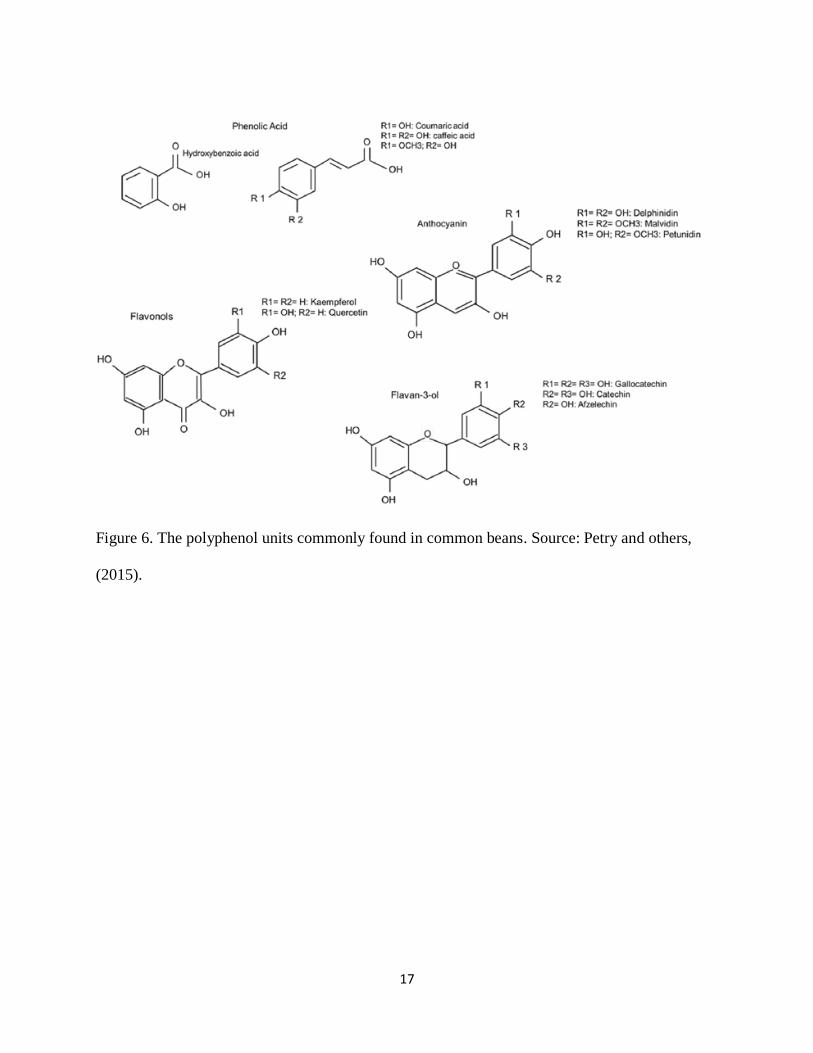
2.3.2.1 Polyphenolic compounds
Polyphenolic compounds are a heterogeneous class of compounds derived from secondary plant
metabolism. They protect the plant against pathogens and UV radiation; they are also responsible
for pigmentation in beans. In addition, they play an important role in pollination by insects (Petry
and others, 2015). Some of the polyphenols present in common beans include phenolic acids,
anthocyanidins, and flavonoids (Figure 6) (Petry and others, 2015). Flavanols are commonly
referred to as proanthocyanidins or condensed tannins; they are the major polyphenols found in
colored beans and are located in the seed coat (Reddy and others, 1985). Diaz and others (2010)
determined polyphenol concentration in bean seed coats and they reported an average
concentration of about 20% of seed coat weight, with an overall average of about 20% in 250 bean
varieties.
17
Figure 6. The polyphenol units commonly found in common beans. Source: Petry and others,
(2015).

18
Phenolic compounds are also responsible for the browning of the seed coat of legumes during
storage (Nozzolillo and Bezada, 1984). Browning is ascribed to the polymerization of soluble
tannins forming insoluble brown high molecular weight tannins. The presence of condensed
tannins in the seed coat of lentils was supported by the deep color (brown) of not-soaked seeds
after four days of storage as compared to the yellow color of the presoaked seeds after the same
storage time. Phenolics in these lentil samples were abundant in the not-soaked seeds and most
originated from the seed coat (Nozzolillo and Bezada, 1984).
2.3.2.2. Phytic acid
Phytic acid is a natural reservoir of phosphorous in the bean seed and it has been implicated in
influencing the HTC effect in legumes. Stanley and Aguilera (1985) reported that phytic acid
chelates divalent ions (Ca2+ and Mg2+), hindering them from precipitating pectic acid in the cell
wall. More evidence was reported by Chang and others (1997) who studied the phytase enzyme
(myo-inositol hexakisphosphate phosphohydrolase, EC. 3.1.3.8). The activity of this enzyme
increases with storage time at higher temperatures and relative humidities. Phytase hydrolyses
phytate, releasing the divalent cations that move to the cell walls where they precipitate pectic acid
and phenolic compounds resulting in insoluble substances forming in the middle lamella, thus
hardening the bean. Upon blanching the beans before storage, the hardening effect was reduced,
implying that the enzyme had been inactivated (Vindiola and others, 1986). Bhatty and Slinkard
(1989) studied the effect of phytic acid and cooking quality of 36 samples of lentils; they reported
that the cooking time was predominantly influenced by phytic acid. Seeds with a long cooking
time had a low phytic acid content which implied that most of it had been hydrolyzed. Increasing
19
phytic acid levels in legumes would be a remedy to HTC effect; on the contrary, phytic acid binds
divalent cations making them unavailable for human nutrition.
Moscosco and others (1984) reported a decrease in the phytic acid content of beans during storage
for 9 months under elevated temperatures and high relative humidity conditions which was
associated with a subsequent increase in cooking time. After the ninth month, beans were left with
less phytic acid and fewer of the monovalent ions (Na+ and K+) that are typically responsible for
solubilizing the pectin substances via ion exchange and chelation during cooking. It was concluded
that the degraded cell wall allowed redistribution of divalent ions to the middle lamella during
storage where they formed insoluble substances with pectin. This was in agreement with the
pectin-phytate theory. Furthermore, Chitra (1994) studied the effect of storage on phytic acid and
cooking time. He reported a notable loss of phytic acid associated with elevated cooking time for
chick peas and soy beans stored at 25oC and 37oC, respectively. For short cooking time, a high
phytic acid content is needed, however, it binds divalent ions making them unavailable for human
nutrition. It was suggested that genotypes with high phytic acid could be identified and bred to
improve their cooking times (Chitra, 1994).
2.3.2.3. Dietary fiber
Dietary fiber is defined as the component of plant cells that is resistant to hydrolysis by human
digestive enzymes. Dietary fiber includes cellulose, hemicellulose, pectin, lignin, and resistant
starch. Dietary fiber can be classified according to its solubility, i.e., water-soluble and water-
insoluble (Salunkhe and Kadam, 1989). The dietary fiber content of legumes can be affected by
variety, environmental conditions and agronomical practices (Wang and others, 2008). The total
dietary fiber (TDF) of pulses ranges from 8-27.5%, with soluble dietary fiber (SDF) in the range
20
of 3.3-13.8% (Gullion and Champ, 2002). Gullion and Champ further reported that DF is located
in both the cotyledons and the seed coat of the common bean. The cell walls of the cotyledons
contain pectin substances (approximately 55% w/w) and non-lignified cellulose (about 9%). On
the other hand, the seed coat contains a large amount of cellulose (35-57% w/w) and small amounts
of hemicellulose and pectin (Van-Laar and others, 1999). Kutos and others (2003) determined
contents of SDF, IDF (insoluble dietary fiber), TDF and resistant starch (RS) of raw and processed
dry beans. The results indicated that thermal processing reduced IDF content and the overall TDF
of the beans. Thermal processing also increased RS of beans. Shiga and others (2009) investigated
effects of cooking on fibers of HTC beans, and reported that the HTC effect did not change the
amounts of soluble and insoluble fiber contents in cooked beans, but rather the physico-chemical
characteristics of the bean carbohydrates like solubility of the fiber. Furthermore, Shiga and others
(2011) studied the effect of storage on the solubility of bean hull fiber. It was observed that aging
resulted in a decrease in water-soluble fiber and an increase in water-insoluble fiber. This was
caused by the insolubilization of galacturonans and xyloglucans. Hulls make up 7% of all water-
insoluble fiber of the whole bean while cotyledons contribute 10% of the water-insoluble fiber.
2.3.2.4. Pectin
Pectin is a complex polysaccharide in plant cell walls and consists of three components i.e.,
rhamnogalacturonan I, homogalacturonan with homogalacturonan accounting for about 60% of
the total pectin in the cell walls (Mohnen, 2008). Pectin molecules can also be tightly bound to
other polysaccharides like hemicellulose, wall proteins and phenolic compounds (Caffall and
Mohnen, 2009). It consists of about 100-200 D-galacturonic acids linked via (1-4) α-D-
galacturonic acid linkage. Shiga and others (2006) reported that the pectin in common beans
consists of rhamnogalacturonans, galactans, xylogalacturonans and ramified arabinans. During
21
storage of beans under higher temperature and relative humidity, phytase hydrolyses phytate
releasing calcium and magnesium cations. These cations migrate to the cell walls where they bind
demethylated pectin molecules, forming insoluble substances thickening the cell wall (Reyes-
Moreno and Paredes-Lopez, 1993). There are changes in pectin during storage of beans at high
temperature and humidity, which result in increased bean cooking time.
Jones and Boulter (1983) observed a reduction in water-solubility of pectin during storage at 4oC
and RH of 65%. In addition, Salvador (2007) observed reduced pectin water-solubility of cowpeas
stored at an elevated temperatures of 42oC and RH of 67% and this was associated with increased
cooking time from 89 to more than 270 minutes. Bernal-Lugo and others (1997) reported that the
fast cooking common beans (variety Michigan 800) and the slow cooking beans (variety Ojo de
Cabra), both grown in Mexico, had similar total pectin contents (25.0 and 25.7 mg/g, respectively).
On the other hand, the fast cooking beans (variety Michigan 800) had more hot-water-soluble
pectin (13.6±1.5 mg/g) than the slow cooking beans (variety Ojo de Cabra; 6.0±1.0 mg/g).
2.3.2.5. Divalent cations
Common beans contain 70-210 μg/g calcium and 160-230 μg/g magnesium (Table 2.1). The
cations of these minerals have been reported to be involved in the HTC effect of common beans.
Soaking cow peas in Ca2+ salt solutions prior to cooking enhanced the hardening effect (Shewfelt
and McWatters, 1992). Aguilera and Rivera (1992) also reported that there was a positive
correlation between calcium content and the HTC effect, however, it was small. Furthermore,
Kyriakidis and others (1997) boiled beans in both plain water and divalent cation solutions (CaCO3
and MgCO3) and they reported that beans boiled in the divalent solutions were much harder than
22
those boiled in plain water. However, they did not report which of the two solutions, i.e., CaCO3
or MgCO3 solution, caused more hardness.

24
Table 1. Overall Mineral Content of Phaseolus vulgaris (Common beans). Source: Salunkhe and Kadam (1989)
Common
beans
Ca
(μg/g)
Cu
(μg/g)
Fe
(μg/g)
Mg
(μg/g)
Mn
(μg/g)
P
(μg/g)
K
(μg/g)
Na
(μg/g)
Zn
(μg/g)
Raw 70-210 0.0-1.40 3.34-8.0 160-230 1.0-2.0 380-570 1320-1780 4.0-21.0 1.9-6.5
Cooked 70-260 0.50-1.10 2.88-7.93 130-220 1.0-2.1 360-510 1100-1710 1.5-6.90 1.9-4.0
25
2.3.2.6. Starch content and starch gelatinization temperature
There are two physicochemical properties of starch that are proposed to influence cooking time,
i.e., starch content and starch gelatinization temperature. Bernal-Lugo and others (1997) reported
that the fast-cooking common beans of variety Michigan 800 had a lower starch content (240.0
mg/g) than the slow-cooking bean variety Ojo de Cabra (260.0 mg/g), indicating that starch content
influenced cooking time. Furthermore, the fast-cooking bean variety was reported to have a lower
amylose content (38.0%) than the slow-cooking bean variety (44%). This implied that amylose
content could influence cooking time.
Starch gelatinization is the disruption of molecular orders within the starch granule when heated
in water and it results in irreversible changes in properties such as granular swelling, native
crystalline melting, loss of birefringence, and starch solubilization (Jane, 2012). Gelatinization is
usually followed by a process known as pasting. When starch is heated in water, there is disruption
of hydrogen bonds between starch molecules, which weakens the granules. This allows the starch
granules to imbibe water and swell, which contributes to an increased viscosity of the starch-water
solution (Jane, 2012). The initial temperature at which gelatinization begins is known as the onset
gelatinization temperature. Studies have shown that high onset gelatinization temperatures are
exhibited by starches with long-branch chains of amylopectin as these can form much more stable
crystalline structures than the short chains (Jane and others, 1999). Lower onset gelatinization
temperature has been associated with short amylopectin chains (Ovando-Martinez and others,
2011). The peak gelatinization temperatures of varieties Black 8025 and Pinto Durango beans
grown in two different locations and with different watering regimes were reported to range from
26
70.14oC to 75.42oC; starch of beans grown in a rainy location had a lower peak gelatinization
temperature than that of those grown in the irrigation locality (Ovando-Martínez and others, 2011).
When cooking beans, starch granules present in the beans are heated in water and therefore
undergo gelatinization. It has been proposed that if beans have a low peak gelatinization
temperature, they could have a shorter cooking time. Reyes-Moreno and others (1994) studied
physicochemical properties influencing cooking time of fresh, storage-hardened, and chemical-
hardened variety Mayocoba (fast-cooking) and variety Flor de Mayo (slow-cooking) common
beans. He reported that the fast-cooking beans had a lower peak gelatinization temperature
(76.6oC) than the slow-cooking beans (78.7oC), thus influencing cooking time of the beans. On the
contrary, Bernal-Lugo and others (1997) reported that both fast and slow-cooking beans had
similar peak gelatinization temperatures (86oC and 87oC, respectively), therefore peak
gelatinization temperature may not relate much to differences in cooking time. In both cases, it is
not mentioned if the two varieties studied belonged to the same market class; it would be important
to know how bean genotypes of the other market classes grown in the same location would behave.
2.4. Methods used to reduce cooking time of dry common beans
2.4.1. Soaking
Soaking beans before cooking is a common practice used in many parts of the world with a goal
of reducing subsequent cooking time. The amount of water absorbed depends on the permeability
of the seed coat (Valle and others, 1992). Soaking dry beans in monovalent (Na+) cation solutions
has also been used to reduce the cooking time of beans. De Leo and others (1992) reported that
soaking HTC beans in a salt solution of 2.5% K2CO3 or of 0.5% NaHCO3, w/v, significantly
27
reduced their cooking time. Furthermore, Salvador (2007) reported that cowpeas soaked in a
sodium chloride solution were observed to have improved pectin water-solubility, which was
associated with reduced cooking time. Soaking activates rhamnogalacturonase, galactanase and
polygalacturonase cell wall enzymes of beans. These enzymes break down the pectin
polysaccharides, rhamnogalacturonan I and polygalacturonan giving cell walls new
polysaccharide arrangements that result in higher thermosolubility hence shorter cooking time
(Martinez-Manrique, 2011).
2.4.2. Micronization
Micronization of legumes is a process in which moisture-conditioned seeds are treated with
infrared heat (1800 to 3400 nm) to soften their texture by breaking the pectin molecules into
smaller and more soluble molecules before cooking. This increases water uptake during cooking
thus reducing cooking time of beans (Mwangwela and others, 2007). According to Fasina and
others (2001), the infrared rays cause vibration of water molecules at 60000 to 150000 MHz
resulting in internal heating of the bean. This is a high efficiency method as compared to other
technologies (Bellido and others, 2003). Salvador (2007) preconditioned cow peas using sodium
ion solution prior to micronization, and the combination was seen to reduce cooking time from
more than 270 to 59 minutes.
2.4.3. Dehulling
Dehulling has been reported to reduce cooking time of pulses. Kon and others (1973) reported a
70% reduction in cooking time of pinto beans resulting from dehulling. This was attributed to the
removal of the impermeable seed coat that hinders water uptake of the bean during cooking.
However, dehulling has been reported to result in a significant reduction in minerals, especially
28
calcium, copper, magnesium and manganese (Wang and others, 2009), which are important for
human health.
2.5. Knowledge gaps
Pirhayati and others (2011) reported that the seed coat thickness of the fast-cooking beans (38.00
μm) was greater than that of the HTC beans (32.00 μm); therefore, cooking time might not be
solely attributed to seed coat thickness. There were also no significant differences in the
microstructures of the seed coats of the fast and slow-cooking beans. On the contrary, according
to the other published literature, varieties with thick seed coats are expected to have longer cooking
times. In addition, Bhatty’s (1995b) observations on fast and slow-cooking lentils showed
structural differences in seed coats of slow-cooking lentils. To resolve this contradiction, this
current thesis research was aimed at characterizing the dry common bean seed coat thickness and
weight, and their relationships with cooking time.
The influence of calcium and magnesium salt solutions on the cooking time of beans has been
extensively studied. Pirhayati and others (2011) reported an increase in hardness of beans after
soaking them in tap water (Ca2+ and Mg2+). This was attributed to the assumption that the calcium
and magnesium ions in the tap water migrated to the middle lamella and participated in the
crosslinking of pectate substances and phenolic compounds hardening the cell walls. However, the
influence of the inherent calcium and magnesium of the entire bean is not yet known. Protein
solubility of dry common beans was reported to decrease with increase in storage time, and result
in an increase in the cooking time of dry beans. Coelho and others (2012) concluded that the high
storage temperature induced protein denaturation which caused coagulation of protein thus
reducing its solubility in water. It is not known, however, if protein from other dry common bean
29
varieties will behave in a similar manner. Slow-cooking beans were reported to have less hot water
soluble pectin (HWSP) and higher starch content than the fast cooking beans (Bernal-Lugo and
others, 1997). However, determinations were done on only two varieties grown in Mexico. It is
not known if other varieties from other locations would follow the same trend.
2.6. Hypothesis
Dehulling reduces cooking time of raw dry common beans more than does soaking the whole raw
bean. Cooking time of dry common beans is associated with seed coat thickness and weight, starch
content, starch gelatinization and protein denaturation temperatures, protein content, hot water
soluble pectin content, and inherent calcium and magnesium contents in the entire bean.
2.7. Objectives
Overall objective
To determine the physicochemical properties of components in dry common beans associated with
cooking time of dry common beans.
Specific objectives
1. To determine the seed coat weight and thickness and their correlations with cooking time
of dry common beans.
2. To determine the thermal properties of various components of dry common beans and to
quantify their correlations with cooking times of the studied varieties.
3. To quantify the storage protein, starch, and pectin contents, and to determine the contents
of inherent calcium and magnesium of dry common beans and to quantify their
correlations with cooking time.
30
CHAPTER 3
METHODS AND PROCEDURES
3.1. Materials: Dry common bean samples
Dry common beans (Phaseolus vulgaris L.) belonging to the Andean Diversity Panel (ADP) were
used in this study. Bean varieties in the ADP are large seed beans that are commonly consumed in
Southern and Eastern Africa. Two market classes were used in this study, i.e., yellow beans and
red mottled beans. These market classes were chosen because they showed large variations in
cooking time (Cichy and others, 2015). Each market class had three genotypes, one slow-cooking
(S), one moderate-cooking (M), and one fast-cooking (F) variety. Yellow beans included Cebo
cela (ADP-521-F) that originated from a market Place in Angola, Uyole 98 (ADP-111-M) that
originated from Tanzania and was developed by the Tanzania National breeding Program in 1999
and Canario (ADP-513-S) that originated from Angola (hereafter referred to as Y-521-F, Y-111-
M, and Y-513-S, respectively). Genotypes of red mottled beans all originated from Puerto Rico.
JB178 (ADP-443-F) was released for its superior agronomic traits and disease resistance, Vazon
7 was released in 2005 (ADP-436-M) and PR0737-1 (ADP-434-S) is a virus resistant variety
developed jointly by University of Puerto Rico, Haiti National Program and USDA-ARS in 2013
(Cichy and others, 2015). Hereafter referred to as R-443-F, R-436-M, and R-434-S, respectively
(Figure 7). All six genotypes were grown in two locations, i.e., Puerto Rico and Tanzania (Arusha)
in 2014. These beans were sorted and cleaned to remove dirt and foreign matter.
31
Figure 7. Dry common bean genotypes used in the study.
Y-521-F Y-111-M Y-513-S
R-443-F R-436-M R-434-S
32
3.2. Sample preparation
The bean samples were tempered by storing whole beans in a moisture equalizer at 14% moisture
content at room temperature for 3 weeks (hereafter referred to as raw beans) prior to any analyses.
For analyses requiring ground sample, raw beans were freeze-dried (Refrigeration for Science, Inc.
Island Park, New York) for 48 hours, then ground by a Wiley laboratory mill (Arthur H. Thomas
Co., Scientific Apparatus, Philadelphia. PA., USA) to pass through a 0.5 mm screen before
analysis. The ground samples were stored in airtight plastic tubes at room temperature.
3.3. Determination of cooking time
Cooking time was determined using a Mattson cooker (Customized Machining and Hydraulics
Co., Winnipeg, Canada) (Wang and Daun, 2005). For each bean variety, 25 raw beans were cooked
as is, another 25 raw beans were soaked for 12h before cooking, and another 25 raw beans were
dehulled manually using a razor blade before cooking. The Mattson cooker has 25 metallic pins
under which beans are to be placed, one under each pin. The device is connected to a monitor with
the Mattson software. Distilled water (1800 ml) was boiled in the pan of the Mattson cooker. The
Mattson device, loaded with 25 raw, soaked, or dehulled beans of one variety, was placed in the
boiling water, the start button pressed, and the starting time recorded. During cooking, the beans
softened and the pins dropped as they pierced the beans. The time at which each pin dropped was
recorded. When 80% of the pins had dropped (i.e., 20 beans), the time was recorded as the end
cooking time of that particular treated bean variety. Cooking time was calculated by subtracting
time at the beginning of cooking from end cooking time. Cooking time determinations were done
in two replicates for each bean variety and treatment as described above.
33
3.4. Determination of the percentage of seed coat weight
The seed coat weight of the beans was determined gravimetrically. Total weight of five raw whole
beans from each variety was determined. The beans were then dehulled manually using a sharp
razor blade and the total weight of the five dehulled beans was determined. The total seed coat
weight of the five beans was the calculated difference between the total weight of five raw beans
and the total weight of the same five beans dehulled. The percentage of seed coat weight was
calculated as total weight of the five seed coats divided by total weight of the five raw beans
multiplied by 100. This was done in two replicates and results for each variety averaged.
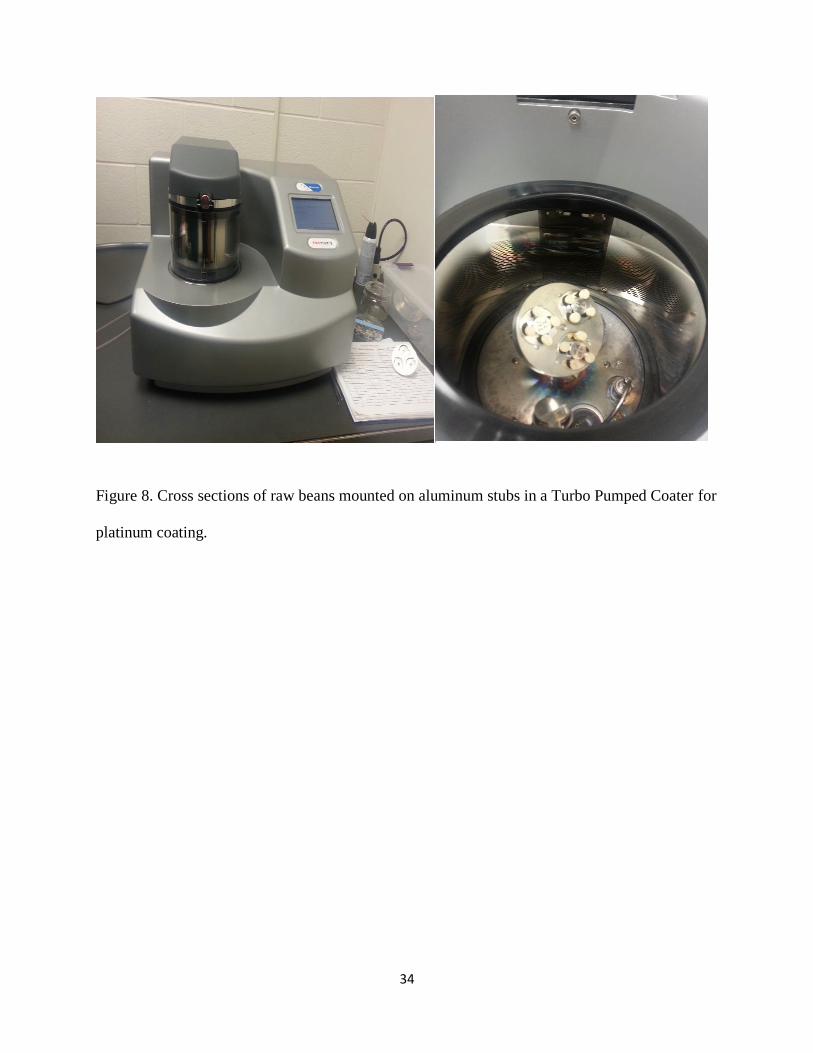
3.5. Measurement of the seed coat thickness
The thickness of the common bean seed coat was measured using the Scanning Electron
Microscope (SEM). Raw whole beans of each variety were first freeze dried for 48h (Refrigeration
for Science, Inc. Island Park, New York) to 3% moisture content. Cross sections of six raw beans
of each variety were made using sharp razor blades. The cross sections (2 per bean) were then
mounted on aluminum stubs using high vacuum carbon tabs (SPI Supplies, West Chester, PA).
They were then coated with platinum for sixty seconds while rotating to a thickness of 8nm in a
Quorum Technologies/ Electron Microscopy Sciences Q15OT Turbo Pumped Coater (Quorum
Technologies, Laughton, East Sussex, and England BN8 6BN) (Figure 8). They were then
examined using a JEOL JSM-7500F (cold field emission electron emitter) scanning electron
microscope (JOEL Ltd, Tokyo, Japan). Images of bean cross sections (Figure 9) were taken and
the seed coat thicknesses measured using the micrograms. This was done in duplicate (i.e., for a
total of 12 beans examined per variety), with two micrograms produced per bean (one for each
cross section). The averages for each variety were recorded.
34
Figure 8. Cross sections of raw beans mounted on aluminum stubs in a Turbo Pumped Coater for
platinum coating.
35
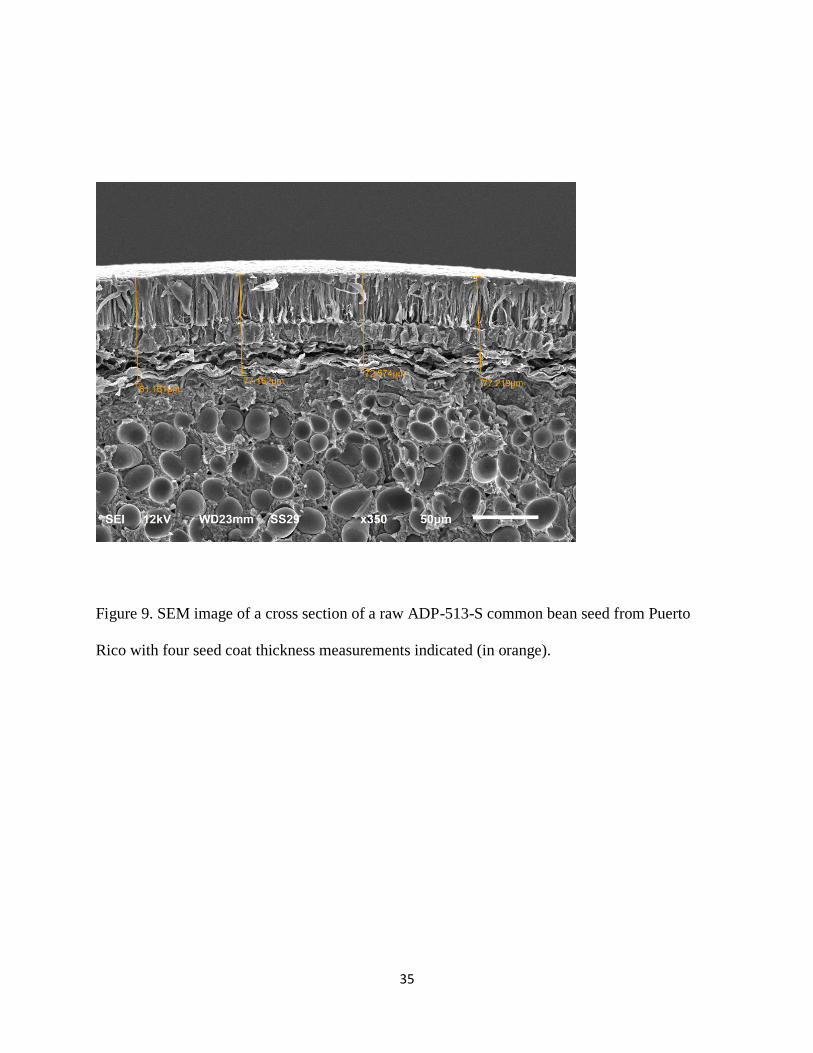
Figure 9. SEM image of a cross section of a raw ADP-513-S common bean seed from Puerto
Rico with four seed coat thickness measurements indicated (in orange).
36
3.6. Determination of calcium and magnesium contents
Calcium and magnesium contents were determined using Inductively Coupled Argon Plasma
Emission Spectroscopy (ICAPES) following AOAC Method 985.01. Calcium or magnesium
standards or ground raw whole beans (2 g each, prepared according to the description in 3.1) were
each weighed into microwave digestive tubes and 2.0 mL of concentrated nitric acid was added
into each tube. Samples were chemically digested according to the Open Vessel Microwave
SW846-3051A procedure (AOAC 991-10D) at 175oC for 15 minutes. After the digestion, samples
were diluted to a volume of 25 ml with deionized water and analyzed on a Thermo iCAP 6000
Series ICAPES. This analysis was done in duplicate and the averages for each variety were
recorded.
3.7. Determination of total protein content
Ground freeze dried bean samples were analyzed by A & L Great Lakes Laboratories, Inc, Fort
Wayne, USA. Total protein was calculated by determining total nitrogen of the bean samples
according to the Dumas Method (AOAC 990.03). For each variety, ground raw bean sample (about
120 mg) was weighed and a sample press was then used to compress the sample to remove any
atmospheric air. The sample weight was recorded and checked using the “Sample View Window”
in the Dumas software to verify that the weight was recorded accurately. During the run, 100 mg
of aspartic acid was used in the blank position to calibrate throughout the run. The samples were
loaded into the rapid nitrogen cube auto-sampler carousel for analysis. The percentage nitrogen
37
content was recorded and converted to protein content by multiplying by 6.25. All determinations
were conducted in duplicate and the averages for each variety were recorded.
3.8. Determination of total starch content of the common bean varieties
Beans of each variety were prepared for analysis by placing raw whole beans in a freeze drier
(Refrigeration for Science, Inc., Island Park, New York) for 48 h, then grinding each sample using
a Wiley laboratory mill to pass through a 0.5 mm screen. Total starch content was determined
according to Megazyme Total Starch Kit procedure (Megazyme International, Wicklow, Ireland).
For each variety, ground bean sample (about 100 mg) was weighed accurately into a glass tube. It
was then wetted with 0.2 ml of 80% v/v aqueous ethanol to aid dispersion and the mixture was
mixed vigorously on a vortex mixer (Fisher Vortex, Genie 2TM) for 30 seconds. Immediately, 2 ml
of dimethyl sulfoxide (DMSO) were added and the mixture was shaken vigorously using the above
vortex mixer. The tube was then placed in a vigorously boiling water bath and was removed after
five minutes. Immediately, 3 ml of thermal stable α-amylase (contents of bottle 1 diluted 1:30 in
Reagent 1; 100 mM sodium acetate buffer, pH 5.0) was added to the tube. The tube was then
incubated in a boiling water bath for 6 minutes, and stirred vigorously using the above vortex
mixer after 2, 4 and 6 minutes. The tube was then placed in a water bath (Julabo SW22, USA) at
50oC and 0.1 ml of the contents of bottle 2 of the kit (amyloglucosidase, 300 U of starch) was
added. The tube was vortexed and incubated at 50oC for 30 minutes. The entire contents of the test
tube was transferred to a 100 ml volumetric flask using a funnel to assist transfer, and a wash bottle
with distilled water to rinse out the tube’s contents thoroughly. The volume was adjusted to the
volume mark with distilled water and mixed thoroughly by hand swirling. An aliquot of this
solution (10 ml) was centrifuged using the above centrifuge at 3000 x g for 10 minutes and the
38
clear undiluted filtrate was used for the assay. Duplicate aliquots of 0.1 ml of each sample were
transferred to glass test tubes. Glucose oxidase/peroxidase (GOPOD) reagent (3.0 ml) was added
to each tube. In addition, D-glucose controls consisting of 0.1 ml of D-glucose standard solution
(1mg/ml) and 3.0 ml of GOPOD reagent were prepared and stirred. Furthermore, a blank solution
was prepared by adding 0.1 ml distilled water and 3.0 ml of GOPOD reagent to a glass test tube
and vortexed. All the tubes were then incubated at 50oC for 20 minutes. Absorbance for each
sample and D-glucose control was read at 510 nm against the reagent blank using a
spectrophotometer (Spectronic Genesys TM5, USA). Starch % was calculated using the formula:
starch % = ΔA * F/W*FV*0.9, where ΔA = absorbance against the reagent blank, F = 100 µg of
D-glucose/absorbance of 100 µg of D-glucose, FV = 100ml, W = weight of sample flour in mg.
This experiment was done in duplicate.
3.9. Thermal properties of common dry beans
Both starch gelatinization and protein denaturation temperatures were measured using a
differential scanning calorimeter (DSC) (TA Instruments, DSC Q100, DE, USA) and the method
reported by Yin and others (2008). Raw whole freeze dried beans were ground to pass through a
0.5 mm screen. For each study variety, the sample (5 mg) was weighed into a standard DSC
aluminum pan and distilled water (15 µl) was added to the sample. A rubber ring was placed on
the edge of an aluminum standard DSC lid, the lid positioned on top of the pan, and the pan then
sealed tightly with a standard sealer. The samples were then left in the pan to stand at room
temperature for 2h before analysis. A reference was prepared by sealing an empty pan to be a
control. The reference pan and a sample pan were placed in the DSC machine with the reference
39
pan taking the back position. The DSC was closed and analysis was run between 30oC and 140oC
at a temperature increase rate of 10oC per minute. This was done in duplicate.
3.10. Extraction and determination of contents of hot water soluble pectin and
hot water insoluble pectin and total pectin of dry common beans.
Pectin content was determined spectrophotometrically using the metahydroxydiphenyl method of
Blumenkrantz and Asboe-Hansen (1973) and using galacturonic acid as a standard (Berna-Lugo
and others, 1996). Raw bean samples were dehulled manually with a blade and freeze dried for 48
hours. The raw-dehulled, freeze-dried beans were then ground to pass through a 0.5 mm screen,
and stored in airtight plastic tubes at room temperature until analysis. Before extraction of pectin,
soluble sugars were removed from the ground samples by extracting with 75% ethanol. Ground
sample (3 g) was weighed into a beaker and 30 ml of 75% ethanol was added. The mixture was
stirred at 25oC for 2h. It was then centrifuged by the above centrifuge for 15 minutes at 4000 x g
at 20oC to remove soluble sugars. The residue, alcohol insoluble solids (AIS), was washed with
30 ml of absolute ethanol twice. It was then oven dried for 24h at 25oC. Hot water soluble pectin
(HWSP) and hot water insoluble pectin (HWIP) were extracted in the following manners. The
HWSP was extracted by weighing 1g of AIS into a beaker, adding 10 ml of distilled water, and
then stirring for 2hrs at 85oC using the VWR 575 Digital Hotplate Stirrer made in the USA. The
mixture was then centrifuged for 15 minutes at 4000 x g and 20oC. The extract was frozen
overnight and then freeze dried for 48h using the above freeze drier. The HWIP was extracted
using 2% sodium hexametaphosphate. One g of AIS was weighed into a glass beaker and 10 ml
of 2% hexametaphosphate were added to the sample. The mixture was stirred at 90oC for 6h. The
mixture was centrifuged with the above centrifuge for 15 minutes at 4000 x g and 20oC. The extract
40
in the supernatant was frozen overnight and then freeze dried for 48 hours using the above freeze
drier. The samples were kept in airtight plastic tubes at room temperature until further analysis.
Pectin content was expressed as galacturonic acid. This is because galacturonic acid is mainly used
as a representative of acid mucopolysaccharides (including pectin) in biological substances, since
it is the main component of repeating units of most acid mucopolysaccharides. The colorimetric
assay using m-hydroxydiphenyl solution for analysis of galacturonic acids was used. While all
carbohydrates react in concentrated acid to form pink-colored compounds, galacturonic acids react
with m-hydroxydiphenyl solution in a strong basic environment to form pink-colored complexes.
Reagents used included the following: (1) galacturonic acid stock solution, prepared by dissolving
100 mg dry galacturonic acid powder in 100 ml distilled water to give a solution concentration of
1 mg/ml (this was kept refrigerated); (2) M/80 sodium tetraborate in sulphuric acid (0.0125M); (3)
0.5% sodium hydroxide; (4) m-hydroxydiphenyl solution (0.15%), covered in a container with
aluminium foil to protect it from the light, and kept refrigerated.
Solutions for the standard curve were made as follows: 2 ml stock galacturonic acid solution were
pipetted into a 100 ml volumetric flask and diluted to final volume with distilled water. The
concentration of galacturonic acid in this sample was 20 µg/ml. This was subsequently repeated
using 4 ml, 6 ml, 8 ml, 10 ml, 12 ml, 14 ml and 16 ml of stock galacturonic acid solutions to make
40, 60, 80,100, 120, 140 and 160 µg/ml concentrations of standard solutions.
To determine the pectin contents of each bean variety, clean glass test tubes were placed in an ice
bath to cool before being used. The sulfuric acid/sodium tetraborate solution was kept in an ice
bath throughout the experiment. An aliquot (1.0 ml) of the standard solution or sample was pipetted
into a test tube and allowed to cool for 1 minute. The tetraborate solution (6.0 ml) was then added
to the test tube. This was mixed thoroughly using a vortex mixer (Fisher Vortex, Genie 2TM, USA)
41
for 1 minute. The glass test tubes were then heated at 80oC in a water bath (Julabo SW22, USA)
for precisely 6 minutes. The tubes were then returned to the ice bath and allowed to cool to 4oC.
M-hydroxydiphenyl solution (0.1 ml) was pipetted into each tube and mixed thoroughly using the
above vortex mixer. A blank was prepared by mixing 10 ml deionized water plus 6.0 ml tetraborate
solution and 0.1 ml of 0.5% sodium hydroxide solution. The glass tubes were then allowed to stand
for 15-20 minutes at room temperature to allow any bubbles formed to dissipate. Absorbance was
measured at 520 nm using a spectrophotometer (Spectronic Genesys TM5, USA) by reading sample
against the blank. A calibration curve of absorbance (y-axis) against concentration of galacturonic
acid (x-axis) was plotted and was used to determine the pectin contents of the bean varieties
studied. The experiment was done in duplicate and the averages were recorded.
3.11. Statistical analysis of data
All data obtained from above experiments were analyzed using Statistical Package for Social
Sciences (SPSS version 2009, International Business Machines, New York, USA). Multiple Linear
regression and Analysis of Variance (ANOVA) were performed and means were separated by
Tukeys HSD test (p ˂ 0.05).

42
CHAPTER 4
RESULTS AND DISCUSSION
4.1. Effect of processing on cooking time of common beans
Cooking times of tempered raw, tempered soaked and tempered dehulled common beans (hereafter
referred to as raw, soaked and dehulled, respectively) from Puerto Rico and Tanzania are presented
in Table 2. Generally, cooking time of the studied bean varieties was specific to variety for both
yellow and red mottled beans. For the raw yellow (Y) beans from Puerto Rico, it was confirmed
that the Y-521-F had the shortest cooking time (80.93±0.87 minutes) followed by Y-111-M
(83.33±1.27 minutes) and Y-513-S had the longest cooking time (106.37±1.69 minutes); F, M,
and S, refer to fast, moderate and slow cooking time, respectively. The cooking time of variety Y-
521-F was 2.4 minutes less than that of Y-111-M and 25 minutes less than that of variety Y-513-
S. This implies that less energy and money is required to cook variety Y-521-F than variety Y-
513-S. These results show that genotypes within a market class have significantly different cooking
times.
All the yellow genotypes maintained the same cooking time trend when grown in Tanzania, i.e.,
Y-521-F, Y-111-M, and Y-513-S in ascending order. The cooking time of variety Y-521-F was
about 5 minutes less than that of Y-111-M and 9 minutes less than that of variety Y-513-S.
However, the cooking time of raw yellow beans grown in Tanzania were significantly greater than
their counterparts from Puerto Rico (P<0.05). The cooking times of genotypes Y-521-F, Y-111-
M, and Y-513-S grown in Tanzania were 31, 33, and 14 minutes longer than those of their
counterparts grown in Puerto Rico.
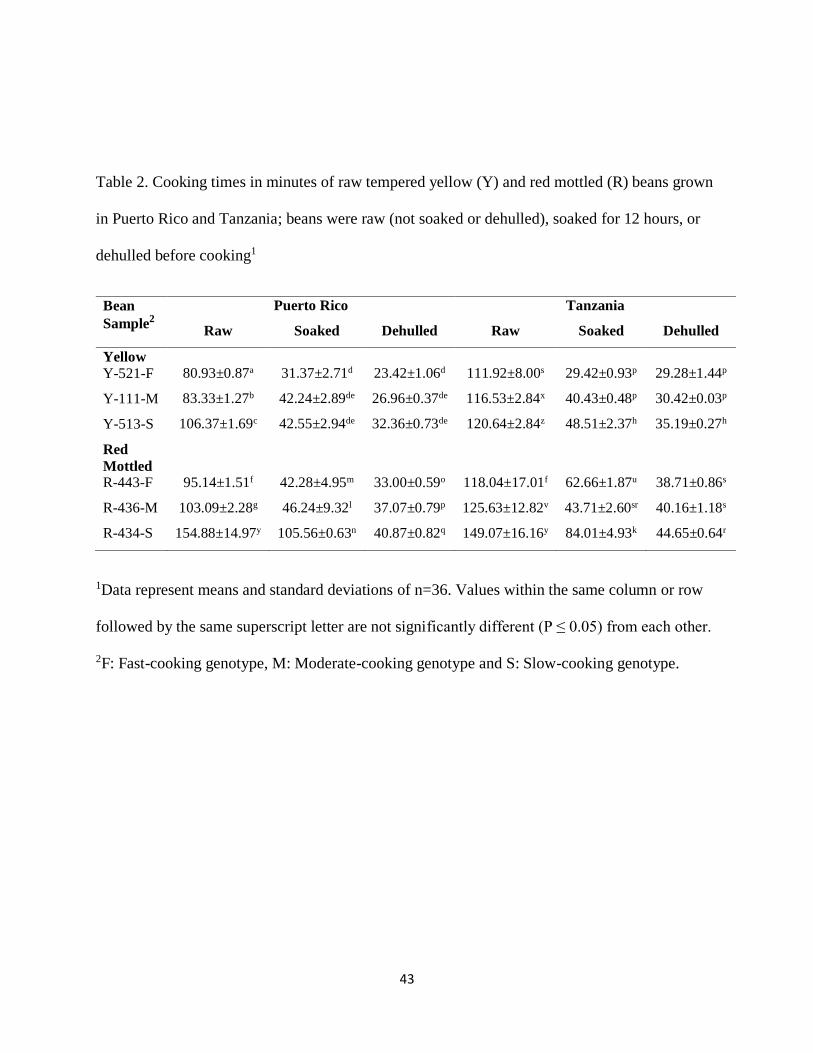
43
Table 2. Cooking times in minutes of raw tempered yellow (Y) and red mottled (R) beans grown
in Puerto Rico and Tanzania; beans were raw (not soaked or dehulled), soaked for 12 hours, or
dehulled before cooking1
Bean
Sample2
Puerto Rico Tanzania
Raw Soaked Dehulled Raw Soaked Dehulled
Yellow
Y-521-F 80.93±0.87a 31.37±2.71d 23.42±1.06d 111.92±8.00s 29.42±0.93p 29.28±1.44p
Y-111-M 83.33±1.27b 42.24±2.89de 26.96±0.37de 116.53±2.84x 40.43±0.48p 30.42±0.03p
Y-513-S 106.37±1.69c 42.55±2.94de 32.36±0.73de 120.64±2.84z 48.51±2.37h 35.19±0.27h
Red
Mottled
R-443-F 95.14±1.51f 42.28±4.95m 33.00±0.59o 118.04±17.01f 62.66±1.87u 38.71±0.86s
R-436-M 103.09±2.28g 46.24±9.32l 37.07±0.79p 125.63±12.82v 43.71±2.60sr 40.16±1.18s
R-434-S 154.88±14.97y 105.56±0.63n 40.87±0.82q 149.07±16.16y 84.01±4.93k 44.65±0.64r
1Data represent means and standard deviations of n=36. Values within the same column or row
followed by the same superscript letter are not significantly different (P ≤ 0.05) from each other.
2F: Fast-cooking genotype, M: Moderate-cooking genotype and S: Slow-cooking genotype.

44
This could be attributed to environmental differences like temperature and relative humidity during
their growth. The variety Y-513-S had the least difference in cooking time between Tanzania and
Puerto Rico.
As expected, soaking significantly reduced the cooking time of beans (P<0.05) for all the yellow
genotypes from Puerto Rico or Tanzania, however, the magnitude of this decrease varied among
genotypes. There were 61.2%, 49.3%, and 60% reductions in cooking time of Y-521-F, Y-111-M,
and Y-513-S bean genotypes, respectively, from Puerto Rico when soaked before cooking. When
grown in Tanzania, there was a 73.7%, 65%, and 60% reduction in cooking time of Y-521-F, Y-
111-M, and Y-513-S bean genotypes, respectively, when soaked before cooking.
Similar to soaking, dehulling significantly reduced the cooking time for all the yellow genotypes
from Puerto Rico or Tanzania (P<0.05). The magnitude of this decrease also varied among
genotypes. There were 71%, 68%, and 70% reductions in cooking time of Y-521-F, Y-111-M, and
Y-513-S bean genotypes, respectively, from Puerto Rico when dehulled before cooking. When
grown in Tanzania, there were 73%, 74%, and 71% reductions in cooking time of Y-521-F, Y-
111-M, and Y-513-S bean genotypes, respectively, when dehulled before cooking. Generally, Y-
521-F exhibited a greater reduction in cooking time when soaked than Y-513-S. This could imply
that perhaps it had a better soaking ability than Y-513-S. There were no significant differences
between the cooking times of soaked yellow beans and their dehulled counterparts from Puerto
Rico or Tanzania.
For the raw red mottled (R) beans from Puerto Rico, it was confirmed that the R-443-F had the
shortest cooking time followed by R-436-M and R-434-S had the longest cooking time; F, M, and
S, refer to fast, moderate and slow cooking time, respectively. The cooking time of variety R-443-
F was 8 minutes less than that of R-436-M and 60 minutes less than that of variety R-434-S. This

45
implies that less energy and money is required to cook variety R-443-F than varieties R-436-M
and R-434-S. As yellow beans, red mottled beans maintained the same cooking time trend when
grown in Tanzania, i.e., R-443-F, R-436-M, and R-434-S in ascending order. The cooking time of
variety R-443-F was about 8 minutes less than that of R-436-M, and 31 minutes less than that of
variety R-434-S. However, the cooking time of raw red mottled beans grown in Tanzania were
significantly greater than their counterparts from Puerto Rico (P<0.05). The cooking times of
genotypes R-443-F, R-436-M, and R-434-S grown in Tanzania were 23, 23 and 6 minutes longer
than those of their counterparts grown in Puerto Rico. This could be attributed to environmental
differences like temperature and relative humidity during their growth. Like yellow beans, the
slow-cooking genotype, R-434-S, had the least difference in cooking time when grown in Tanzania
and Puerto Rico. This could imply that environmental differences did not have much effect on its
cooking time.
Like yellow beans, soaking significantly reduced the cooking time of red mottled beans (P<0.05)
for all the genotypes from Puerto Rico or Tanzania, however, the magnitude of this decrease varied
among genotypes. There were 56%, 55%, and 32% reductions in cooking time of R-443-F, R-436-
M, and R-434-S bean genotypes, respectively, from Puerto Rico when soaked before cooking.
When grown in Tanzania, there were 47%, 65%, and 44% reductions in cooking time of R-443-F,
R-436-M, and R-434-S bean genotypes, respectively, when soaked before cooking. As yellow
beans, the fast-cooking red mottled genotype, R-443-F, grown in Puerto Rico had the greatest
reduction in cooking time when soaked implying that it could have the best soaking ability among
the three genotypes. However, for Tanzania red mottled beans, the moderate-cooking genotype,
R-436-M, had the greatest reduction in cooking time when soaked before cooking.
46
Similar to soaking, dehulling significantly reduced the cooking time of beans (P<0.05) for all the
red mottled genotypes from Puerto Rico or Tanzania. The magnitude of this decrease also varied
among genotypes. There were 65%, 64%, and 74% reductions in cooking time of R-443-F, R-436-
M, and R-434-S bean genotypes, respectively from Puerto Rico when dehulled before cooking.
When grown in Tanzania, there were 67%, 68%, and 70% reductions in cooking time of R-443-F,
R-436-M, and R-434-S bean genotypes, respectively, when dehulled before cooking. Among the
three red mottled genotypes grown in Puerto Rico or Tanzania, the slow-cooking genotype, R-
434-S, had the greatest reduction in cooking time when dehulled before cooking. There were no
significant differences between the cooking times of dehulled red mottled genotypes and their
soaked counterparts for both locations. This implies that dehulling reduced cooking time of beans
as soaking.
The results in the present study show that genotypes within a market class have significantly
different cooking times. It is commonly known that yellow beans cook faster than red mottled
beans however this is not true for all genotypes. The raw genotype R-443-F had a shorter cooking
time (95.14±1.51) than the yellow genotype Y-513-S (106.37±1.69 minutes). This information is
very vital when making a choice among many bean varieties for consumption since fast-cooking
beans will require less energy and money to cook them.
The findings in the present study are in agreement with past studies that have shown that soaking
reduced cooking time of legumes, (Taiwo and others, 1998; Martinez-Manrique and others, 2011).
The results are also consistent with the common experience of reduced cooking time in households.
Soaking activates the pectic enzymes in the cell walls of beans which hydrolyze the main pectin
polymer rhamnogalacturonan I reducing its degree of polymerization and increasing
47
polygalactururonan and galactan solubility. This results into a reduced thermosolubility of pectic
polysaccharides thus shorter cooking time (Martinez-Manrique and others, 20011).
The results of the present study are also in line with Kon and others (1973) who reported that
dehulling reduces cooking time of pulses. This is attributed to the removal of the impermeable
seed coat that hinders water uptake of the bean during cooking. It has also been reported that
dehulling results in a significant reduction of minerals especially calcium, copper, magnesium and
manganese (Wang and others, 2009) and dietary fiber. Removal of these minerals compromises
the nutritional quality of the beans, thus soaking is often preferred. From the above results of the
current study, we can conclude that the studied bean genotypes within a market class have different
cooking times, and that soaking and dehulling each reduced cooking time, relative to raw bean
cooking, in a similar way. Since dehulling is very cumbersome and compromises the nutritional
quality of the beans, soaking is the easiest way to reduce cooking time. Although the cooking times
of the studied bean genotypes from different locations may be different, the trends within each
location were consistent, i.e., the variety that cooked fast when grown in Puerto Rico, still cooked
fast when grown in Tanzania.
48
4.2. Percentage seed coat weight
The percentages seed coat weight of the studied raw beans are presented in Table 3. Generally,
beans from Puerto Rico had larger percentage seed coat weights than their counterparts from
Tanzania. The percentage seed coat weights of yellow beans were not significantly different
among fast, moderate and slow cooking genotypes for both locations (P>0.05). Except for the fast-
cooking red mottled beans variety R-433-F being significantly smaller than the slow-cooking
variety R-434-S from Puerto Rico, the percentage seed coat weight values of all the three
genotypes from both locations were not significantly different (P>0.05). This implies that
percentage seed coat weight did not have an association with cooking time of bean genotypes
within a market class and between market classes in the studied varieties. Also, locations did not
display significant effect on the percentage seed coat weight values.
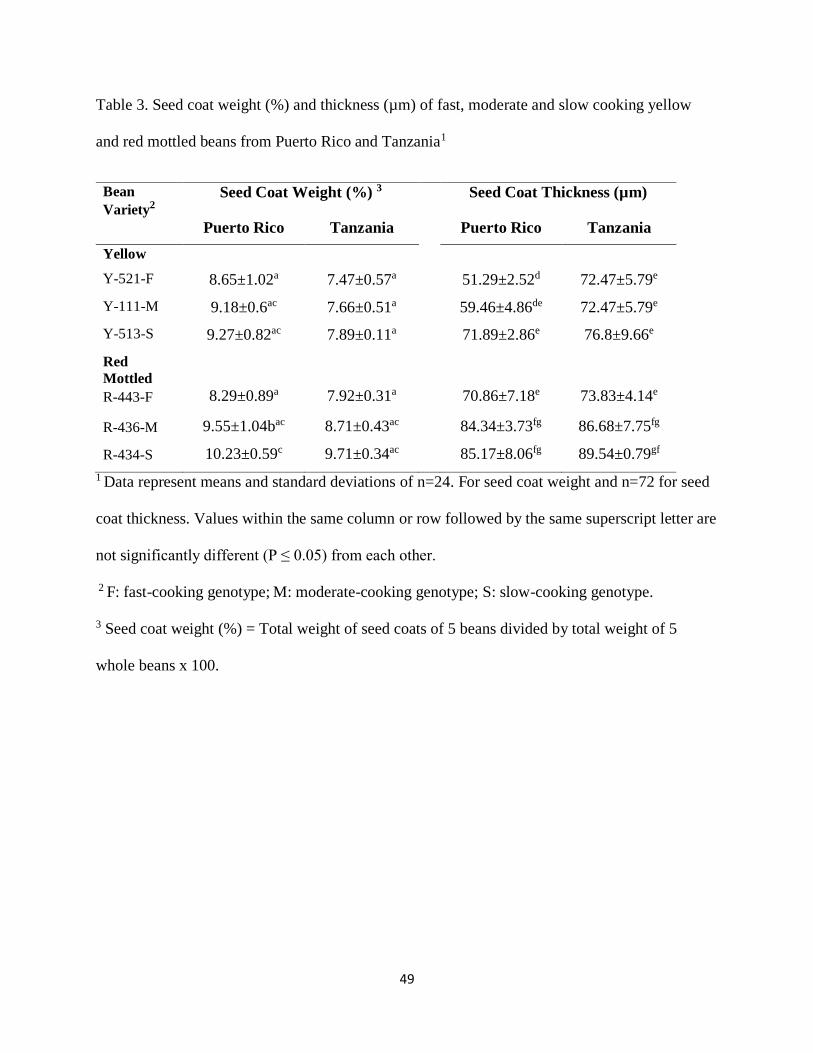
49
Table 3. Seed coat weight (%) and thickness (µm) of fast, moderate and slow cooking yellow
and red mottled beans from Puerto Rico and Tanzania1
Bean
Variety2
Seed Coat Weight (%) 3 Seed Coat Thickness (µm)
Puerto Rico Tanzania Puerto Rico Tanzania
Yellow
Y-521-F 8.65±1.02a 7.47±0.57a 51.29±2.52d 72.47±5.79e
Y-111-M 9.18±0.6ac 7.66±0.51a 59.46±4.86de 72.47±5.79e
Y-513-S 9.27±0.82ac 7.89±0.11a 71.89±2.86e 76.8±9.66e
Red
Mottled
R-443-F 8.29±0.89a 7.92±0.31a 70.86±7.18e 73.83±4.14e
R-436-M 9.55±1.04bac 8.71±0.43ac 84.34±3.73fg 86.68±7.75fg
R-434-S 10.23±0.59c 9.71±0.34ac 85.17±8.06fg 89.54±0.79gf
1 Data represent means and standard deviations of n=24. For seed coat weight and n=72 for seed
coat thickness. Values within the same column or row followed by the same superscript letter are
not significantly different (P ≤ 0.05) from each other.
2 F: fast-cooking genotype; M: moderate-cooking genotype; S: slow-cooking genotype.
3 Seed coat weight (%) = Total weight of seed coats of 5 beans divided by total weight of 5
whole beans x 100.

50
4.3. Seed coat thickness
The seed coat thicknesses of the studied raw beans are presented in Table 3, and Figure 10 shows
images of cross sections of raw beans with seed coats. Generally, red mottled beans had thicker
seed coats than yellow beans. Also, beans from Tanzania had thicker seed coats than their
counterparts from Puerto Rico. The seed coat thickness of yellow beans from Puerto Rico was
significantly different among genotypes (P<0.05) and increase in thickness was associated with an
increase in cooking time. The seed coat thickness of the slow-cooking genotype Y-513-S from
Puerto Rico was 1.4-fold thicker than genotype Y-521-F. On the contrary, there were no significant
differences in the seed coat thicknesses of fast, moderate and slow cooking yellow bean genotypes
(P>0.05) from Tanzania. For red mottled beans, the fast cooking genotype R-443-F had a
significantly smaller seed coat thickness than the moderate and slow cooking genotypes for both
Puerto Rico and Tanzania locations. Generally, seed coat thicknesses of all the three red mottled
bean genotypes from Puerto Rico and Tanzania were not significantly different (P>0.05). This
would imply that location had no effect on seed coat thickness.
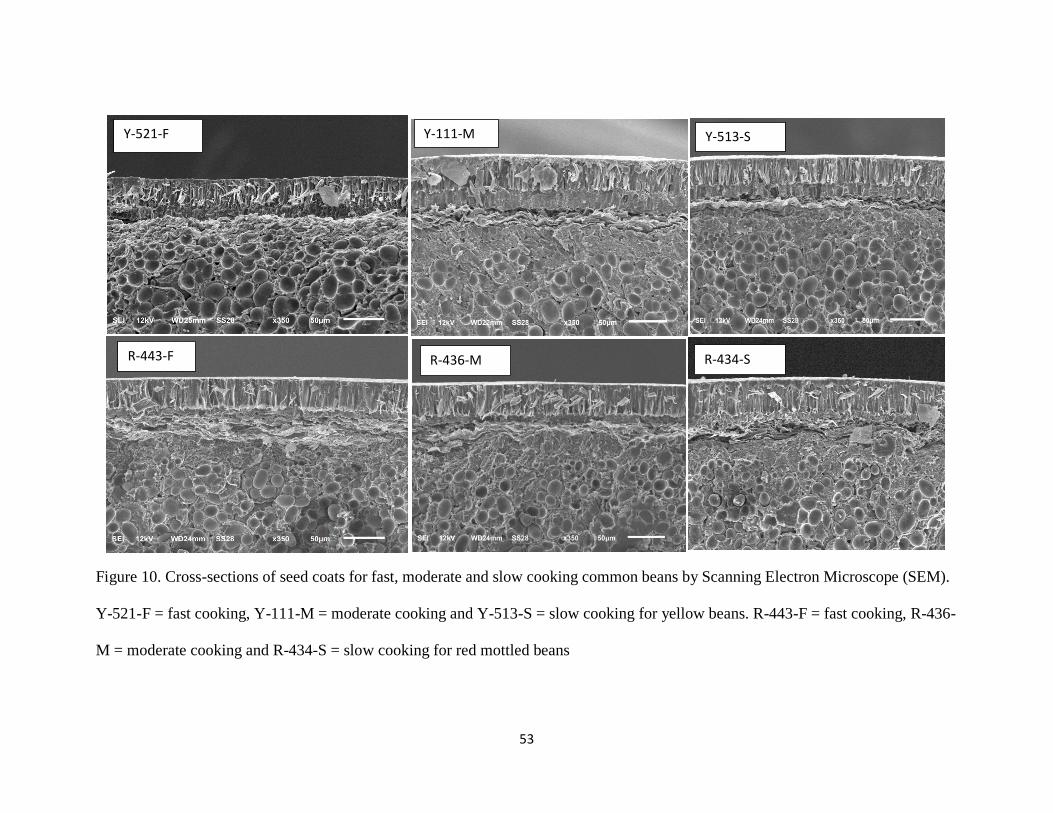
53
Figure 10. Cross-sections of seed coats for fast, moderate and slow cooking common beans by Scanning Electron Microscope (SEM).
Y-521-F = fast cooking, Y-111-M = moderate cooking and Y-513-S = slow cooking for yellow beans. R-443-F = fast cooking, R-436-
M = moderate cooking and R-434-S = slow cooking for red mottled beans
Y-521-F Y-111-M Y-513-S
R-436-M R-443-F R-434-S
54
Regardless of the market class, increase in seed coat thickness was associated with an increase in
bean cooking time. There was a 74.3% positive correlation (P<0.05) between seed coat thickness
and cooking time of raw beans (Table 4), which implies that cooking time of beans was largely
associated with the seed coat thickness. Furthermore, seed coat thickness made a unique
association with cooking time (beta coefficient = .824) (P<0.05); however, this value was lower
than that of hot water soluble pectin (beta coefficient = 3.548) implying that it made less of a
contribution when the variance explained by all other variables in the model is controlled for.
These results are in agreement with (Sathe and Deshpande, 2003) who reported that thick seed
coats hinder hydration of the bean cotyledon. Hydration is a requirement for any bean to cook. The
results from the current study generally show that red mottled beans have thicker seed coats than
yellow beans. This could explain why yellow beans cook faster than red mottled beans. Selecting
for a thinner seed coat would be a good method of reducing cooking time of beans, however, it is
a protective mechanism against pests, and so perhaps selecting for thin but tough seed coats would
address the problem.
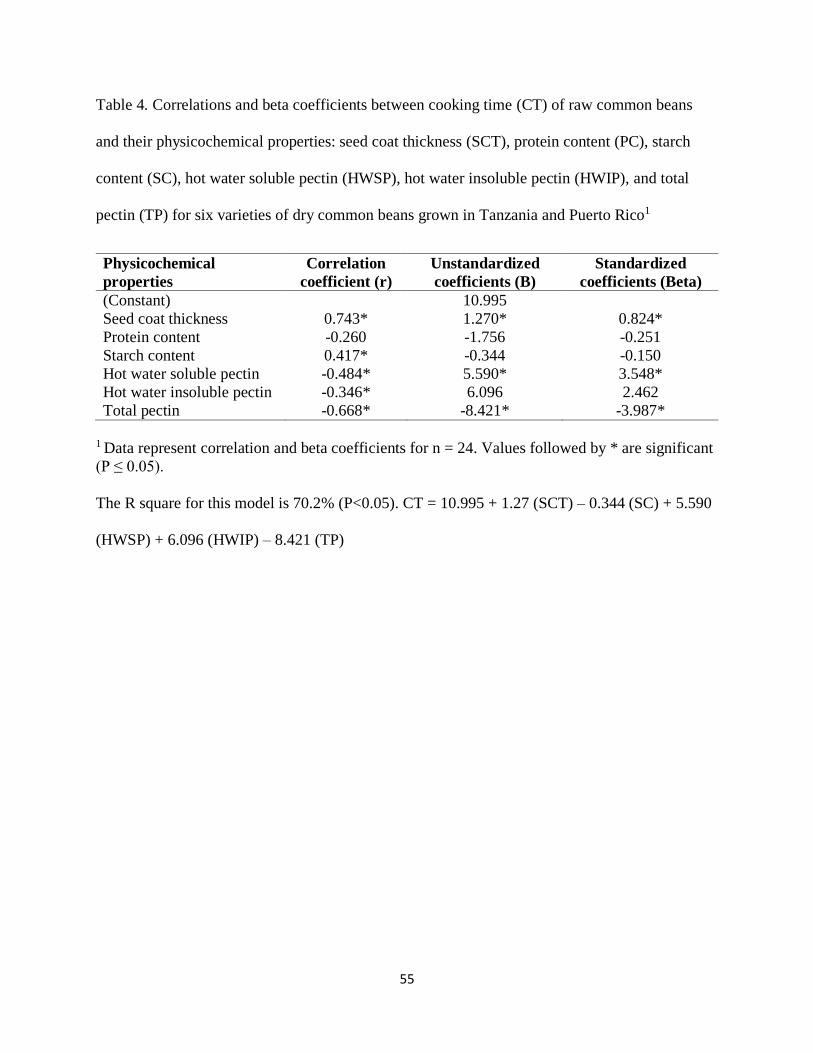
55
Table 4. Correlations and beta coefficients between cooking time (CT) of raw common beans
and their physicochemical properties: seed coat thickness (SCT), protein content (PC), starch
content (SC), hot water soluble pectin (HWSP), hot water insoluble pectin (HWIP), and total
pectin (TP) for six varieties of dry common beans grown in Tanzania and Puerto Rico1
1 Data represent correlation and beta coefficients for n = 24. Values followed by * are significant
(P ≤ 0.05).
The R square for this model is 70.2% (P<0.05). CT = 10.995 + 1.27 (SCT) – 0.344 (SC) + 5.590
(HWSP) + 6.096 (HWIP) – 8.421 (TP)
Physicochemical
properties
Correlation
coefficient (r)
Unstandardized
coefficients (B)
Standardized
coefficients (Beta)
(Constant) 10.995
Seed coat thickness 0.743* 1.270* 0.824*
Protein content -0.260 -1.756 -0.251
Starch content 0.417* -0.344 -0.150
Hot water soluble pectin -0.484* 5.590* 3.548*
Hot water insoluble pectin -0.346* 6.096 2.462
Total pectin -0.668* -8.421* -3.987*
56
4.4. Calcium and magnesium contents
The calcium and magnesium contents of the studied raw common beans are presented in Table 5.
The calcium content ranged between 0.089-0.188 g/100 g of beans, and magnesium content ranged
between 0.172-0.22 g/100 g. There were no significant differences in the calcium and magnesium
contents of fast, moderate and slow cooking yellow or red mottled beans from either the Puerto
Rico or the Tanzania location (P>0.05). Kyriakidis and others (1997) reported that beans cooked
in divalent cation solutions (CaCO3 and MgCO3) had a longer cooking time than those boiled in
plain water. This could imply that the total inherent calcium and magnesium contents of dry beans
is not associated with cooking time of beans, but rather only those found in cooking solutions.
Since these minerals were proved to play a role in the HTC phenomenon (Kyriakidis and others,
1997), perhaps it is about how much of these minerals are available for a chemical reaction. Fast
and slow cooking beans might inherently have similar amounts of these minerals, but perhaps the
slow cooking beans release more divalent cations during phytic acid hydrolysis which in turn
participate in crosslinking of pectin molecules, as compared to the fast cooking beans that might
be releasing fewer of these divalent ions. Growing location did not have an effect on calcium and
magnesium contents of the beans according to the findings in the current study. These findings are
in agreement with Muyonga and others (2008) who reported that calcium and magnesium contents
of common beans grown in different locations (Kabale, Lira and Naari) were not significantly
different (P>0.05).
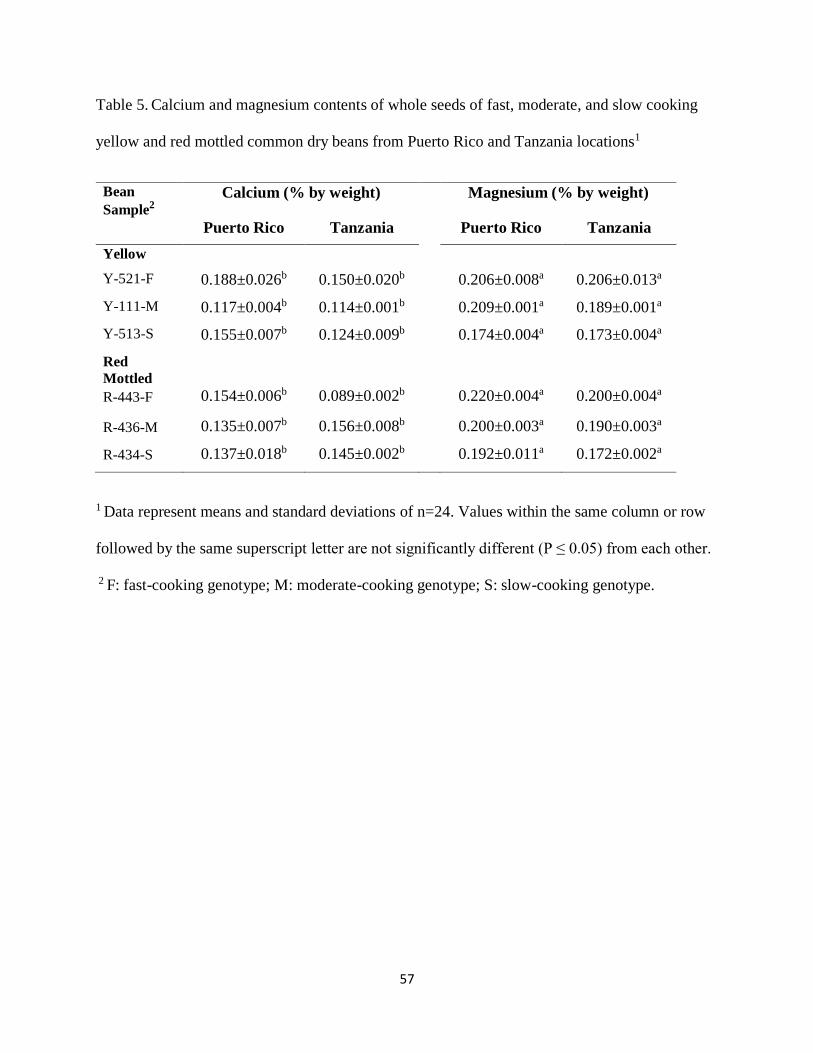
57
Table 5. Calcium and magnesium contents of whole seeds of fast, moderate, and slow cooking
yellow and red mottled common dry beans from Puerto Rico and Tanzania locations1
Bean
Sample2
Calcium (% by weight) Magnesium (% by weight)
Puerto Rico Tanzania Puerto Rico Tanzania
Yellow
Y-521-F 0.188±0.026b 0.150±0.020b 0.206±0.008a 0.206±0.013a
Y-111-M 0.117±0.004b 0.114±0.001b 0.209±0.001a 0.189±0.001a
Y-513-S 0.155±0.007b 0.124±0.009b 0.174±0.004a 0.173±0.004a
Red
Mottled
R-443-F 0.154±0.006b 0.089±0.002b 0.220±0.004a 0.200±0.004a
R-436-M 0.135±0.007b 0.156±0.008b 0.200±0.003a 0.190±0.003a
R-434-S 0.137±0.018b 0.145±0.002b 0.192±0.011a 0.172±0.002a
1 Data represent means and standard deviations of n=24. Values within the same column or row
followed by the same superscript letter are not significantly different (P ≤ 0.05) from each other.
2 F: fast-cooking genotype; M: moderate-cooking genotype; S: slow-cooking genotype.

58
Therefore inherent calcium and magnesium contents in beans are not associated with cooking time
of the six common beans studied here. Perhaps the distribution of these minerals in the bean cells
might be different for the fast and slow cooking beans. Further research should be conducted to
investigate this.
59
4.5. Protein content
The protein contents of the studied raw common beans are presented in Table 6. They ranged
between 20.17 and 25.97 g/100 g of raw beans. The protein contents of the fast, moderate, and
slow cooking yellow beans were not significantly different from each other (P>0.05) for both
Puerto Rico and Tanzania locations. However, genotypes Y-111-M and Y-513-S from Puerto Rico
had 4 g and 2.3 g, respectively, greater protein content than their counterparts from Tanzania. This
could be attributed to the fertility of the soil where they were grown. Except for the genotype R-
443-F, the protein contents of all the red mottled genotypes were not significantly different from
each other (P>0.05) for both Puerto Rico and Tanzania locations. The fast-cooking genotype R-
443-F from Puerto Rico had about 3 g/100 g of protein greater than the slow-cooking genotypes.
There was also no correlation between protein content and cooking time. This however does not
necessarily imply that protein has no association with cooking time of beans. Perhaps the structure
of the proteins in the fast and slow cooking beans could be different. Further research should be
done to study the structure of protein in these beans.

60
Table 6. Protein content of fast, moderate, and slow cooking yellow and red mottled common dry
bean varieties from Puerto Rico and Tanzania locations1
1 Data represent means and standard deviations of n=24. Values within the same column and row
followed by the same superscript letter are not significantly different (P ≤ 0.05) from each other.
2 F: fast-cooking genotype; M: moderate-cooking genotype; S: slow-cooking genotype.
Common Bean Varieties2
Protein Content (%)
Puerto Rico Tanzania
Yellow
Y-521-F 22.34±0.04fb 21.67±0.05b
Y-111-M 24.15±0.23fe 20.17±0.14b
Y-513-S 23.57±0.16f 21.28±0.36b
Red mottled
R-443-F 25.97±0.39e 23.82±0.17f
R-436-M 23.03±0.04f 23.42±0.12f
R-434-S 23.29±0.03f 22.59±0.03fb
61
4.6. Starch content
The starch contents of the studied raw common bean genotypes ranged between 22.8 and 39.75
g/100 g (Table 7). There was a significant difference among the starch contents of fast, moderate
and slowing-cooking yellow bean genotypes (P<0.05) from Puerto Rico and Tanzania. As
expected, starch content increased with increase in cooking time for all yellow genotypes in both
locations except genotype Y-521-F from Puerto Rico that had 7 g and 5 g higher starch content
than genotypes Y-111-M and Y-513-S, respectively. The slow-cooking genotype Y-531-S from
Tanzania had 4.3 g greater starch than the fast-cooking genotype Y-521-F. The genotypes Y-111-
M and Y-513-S from Tanzania had 27% and 26%, respectively, greater starch content than their
counterparts from Puerto Rico.
Like yellow beans, starch content of fast, moderate and slow-cooking red mottled beans was
significantly different from each other for both locations (P<0.05) with fast-cooking beans having
the lowest starch content and the slow-cooking beans having the highest content. Like yellow
beans, the starch content of red mottled beans from Tanzania was significantly higher than their
counterparts from Puerto Rico however the differences varied according to genotypes. The
genotypes R-443-F, R-436-M, and R-434-S from Tanzania had 8 g, 10 g, and 9 g, respectively,
greater starch content than their counterparts from Puerto Rico.
There was a 41.7% positive correlation (P<0.05) between starch content and cooking time of raw
beans (Table 4), which implies that cooking time of beans was associated with their starch content.
These results are in agreement with Reyes-Moreno and others (1994) who reported that the fast
cooking common bean variety Michigan 800 had a lower starch content (24.0 g/100 g) than that
62
of the slow cooking bean variety Ojo de Cabra (26.0 g/100 g), thus starch content could be
associated with cooking time. Regardless of the positive correlation with cooking time, the present
study also showed that starch content did not make a significant contribution to cooking time (beta
coefficient = -.150) (P>0.05) in this model. This could have been due to the small number of
samples used in the present study. Further research should be conducted using a larger number of
samples, and perhaps the different components of starch and the starch: protein ratio could be
studied in relation to cooking time.
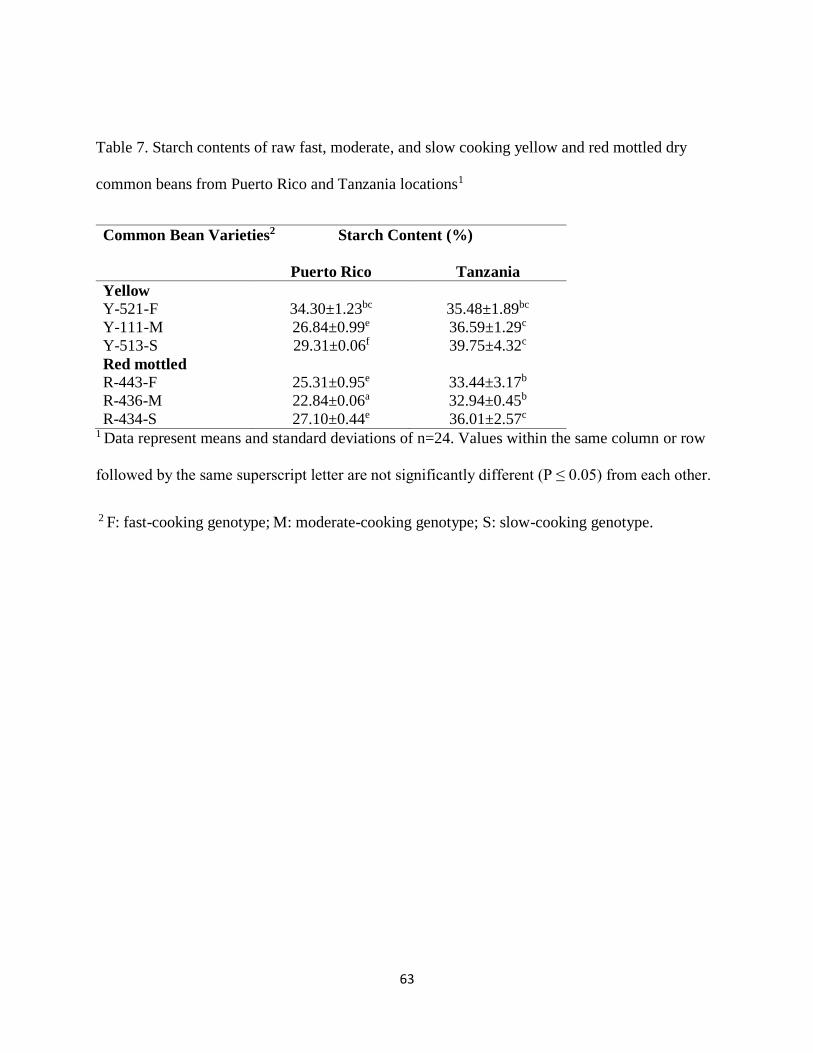
63
Table 7. Starch contents of raw fast, moderate, and slow cooking yellow and red mottled dry
common beans from Puerto Rico and Tanzania locations1
1 Data represent means and standard deviations of n=24. Values within the same column or row
followed by the same superscript letter are not significantly different (P ≤ 0.05) from each other.
2 F: fast-cooking genotype; M: moderate-cooking genotype; S: slow-cooking genotype.
Common Bean Varieties2
Starch Content (%)
Puerto Rico Tanzania
Yellow
Y-521-F 34.30±1.23bc 35.48±1.89bc
Y-111-M 26.84±0.99e 36.59±1.29c
Y-513-S 29.31±0.06f 39.75±4.32c
Red mottled
R-443-F 25.31±0.95e 33.44±3.17b
R-436-M 22.84±0.06a 32.94±0.45b
R-434-S 27.10±0.44e 36.01±2.57c
64
4.7. Hot water soluble pectin (HWSP) content
Total pectin content and its two fractions for the studied raw common beans are presented in Table
8. All bean genotypes for both market classes from both locations had less HWSP than HWIP. The
HWSP contents of fast, moderate and slow cooking yellow beans from Puerto Rico were
significantly different (P<0.05), with moderate cooking beans having the highest HWSP. The
HWSP content of Y-521-F was about 2.4-fold greater than the slow cooking beans with the lowest
HWSP value. HWSP content of fast, moderate, and slow-cooking yellow from Tanzania location
were not significantly different from each other (P>0.05).
HWSP contents of red mottled beans from Puerto Rico were not significantly different from each
other (P>0.05). HWSP content of fast, moderate, and slow-cooking red mottled beans from Puerto
Rico and Tanzania location were not significantly different from each other except for the fast-
cooking red mottled bean genotype, R-443-F, that was significantly greater than all of them and
had about 2.5-fold greater HWSP content (14.78±0.62 mg/g) than the slow-cooking red mottled
bean genotype (5.94±1.26 mg/g).
There was a 48.4% (P<0.05) negative correlation between HWSP and cooking time of raw beans
(Table 4), which implies that cooking time of beans decreased with increase in HWSP.
Furthermore, HWSP made the greatest contribution to cooking time (beta coefficient = 3.548)
(P<0.05) when the variance explained by all other variables in the model is controlled for.
These results were in agreement with Bernal-Lugo and others (1996) and Njoroge and others
(2014) who reported that fast cooking bean (variety Rose coco) had more hot water soluble pectin

65
(8.44 mg/g) than the slow cooking beans (variety Pinto, 5.51mg/g). Further research with a large
sample size should to be conducted to verify these findings.
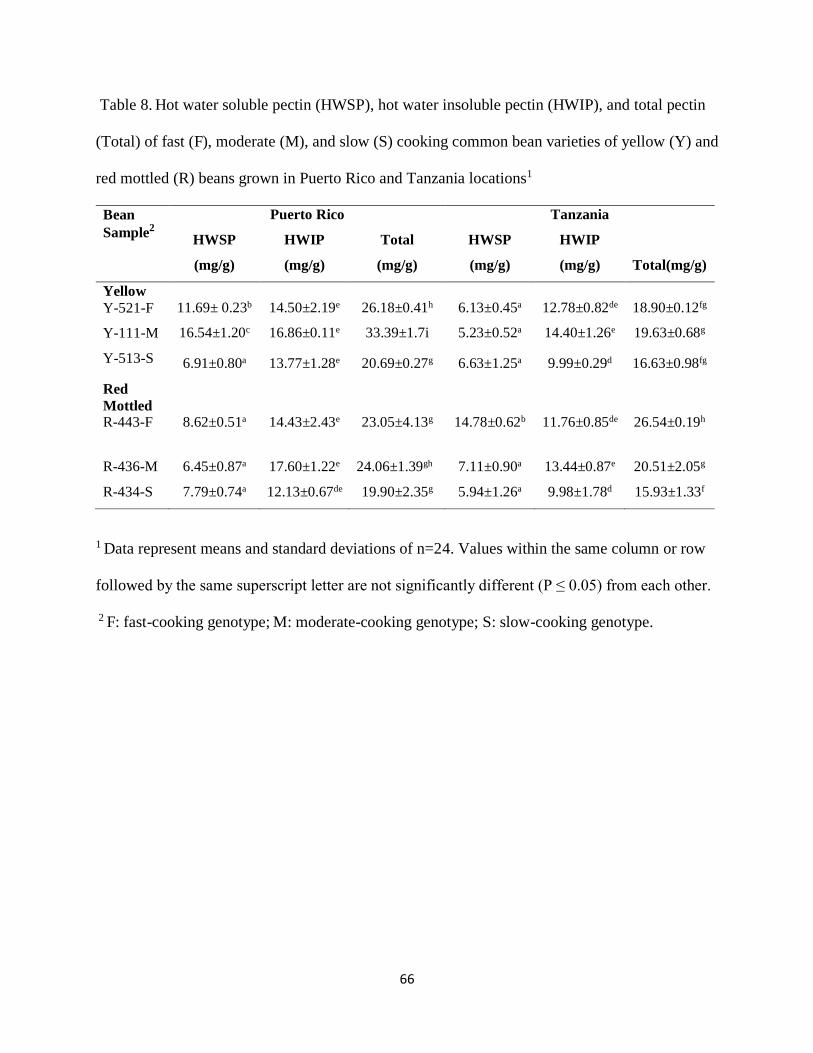
66
Table 8. Hot water soluble pectin (HWSP), hot water insoluble pectin (HWIP), and total pectin
(Total) of fast (F), moderate (M), and slow (S) cooking common bean varieties of yellow (Y) and
red mottled (R) beans grown in Puerto Rico and Tanzania locations1
1 Data represent means and standard deviations of n=24. Values within the same column or row
followed by the same superscript letter are not significantly different (P ≤ 0.05) from each other.
2 F: fast-cooking genotype; M: moderate-cooking genotype; S: slow-cooking genotype.
Bean
Sample2
Puerto Rico Tanzania
HWSP
(mg/g)
HWIP
(mg/g)
Total
(mg/g)
HWSP
(mg/g)
HWIP
(mg/g) Total(mg/g)
Yellow
Y-521-F 11.69± 0.23b 14.50±2.19e 26.18±0.41h 6.13±0.45a 12.78±0.82de 18.90±0.12fg
Y-111-M 16.54±1.20c 16.86±0.11e 33.39±1.7i 5.23±0.52a 14.40±1.26e 19.63±0.68g
Y-513-S 6.91±0.80a 13.77±1.28e 20.69±0.27g 6.63±1.25a 9.99±0.29d 16.63±0.98fg
Red
Mottled
R-443-F 8.62±0.51a 14.43±2.43e 23.05±4.13g 14.78±0.62b 11.76±0.85de 26.54±0.19h
R-436-M 6.45±0.87a 17.60±1.22e 24.06±1.39gh 7.11±0.90a 13.44±0.87e 20.51±2.05g
R-434-S 7.79±0.74a 12.13±0.67de 19.90±2.35g 5.94±1.26a 9.98±1.78d 15.93±1.33f
67
4.8. Hot water insoluble pectin (HWIP) content
The HWIP of the studied raw beans ranged between 9.98±1.78 mg/g and 17.60±1.22 mg/g (Table
8). Except for R-443-F, each of the bean varieties of both yellow and red mottled beans from
Puerto Rico and Tanzania had a greater HWIP content than HWSP content. The HWIP contents
of fast, moderate and slow-cooking beans of both market classes within one location were
generally not significantly different from each other (P>0.05). This could mean that HWIP is
formed at a more uniform rate during bean growth, and these beans were all about the same “age”
therefore they had similar amounts of HWIP. If some had been stored longer, then perhaps they
would have higher HWIP contents.
There was a slight negative correlation 34.6% (P>0.05) between HWIP and cooking time (Table
4). This implies that cooking time increased with decrease in HWIP. These results are not in line
with the findings of Bernal-Lugo and others (1996) who reported that the slow cooking beans had
a higher HWIP pectin content than fast cooking beans. Some pectin molecules are tightly bound
to other polysaccharides like hemicellulose, wall proteins and phenolic compounds (Caffall and
Mohnen, 2009). Perhaps most of the HWIP in the hard to cook beans in the present study were
tightly bound to other polysaccharides like hemicellulose, wall proteins and phenolic compounds
making it hard to be extracted. Further research with a larger sample size should be conducted to
verify these findings.
68
4.9. Total Pectin
The total pectin of the studied raw beans ranged between 15.92 mg/g and 33.39 mg/g (Table 8).
The total pectin contents of yellow beans from Puerto Rico were significantly different with Y-
111-M having the highest pectin and Y-513 having the lowest pectin content. On the contrary, TP
of yellow beans from Tanzania was not significantly different. Also, TP of yellow beans from
Puerto Rico were slightly higher than their counterparts from Tanzania.
The red mottled fast, moderate and slow cooking beans from Puerto Rico were not significantly
different (P>0.05) from each other. On the contrary, the red mottled fast, moderate and slow
cooking beans from Tanzania were significantly different (P<0.05) from each other. The genotype
R-443-F had 5 mg and 10 mg higher TP content than genotypes R-436-M and R-434-S,
respectively. For both market classes in both locations, fast cooking beans were associated with a
high total pectin content. There was a 66.8% (P<0.05) negative correlation between cooking time
and total pectin (Table 4) and it made the largest contribution to cooking time (beta coefficient =
3.987) (P<0.05). Since the largest composition of TP is HWIP, it could mean that most of the
pectin polymers in the slow cooking beans are tightly bound to the cell wall polymers like
hemicellulose, phenolic compounds and wall proteins making it hard to extract enough of it. These
results also imply that no matter the amount of pectin present, its soluble fraction is what is
associated with the cooking time. Total pectin in this study is the sum of HWSP and HWIP so the
strong negative correlation of TP with cooking time could be largely influenced by HWSP which
has been reported in this study to also have a strong negative correlation with cooking time.

69
4.10. Starch gelatinization temperature
Starch gelatinization temperatures of the studied raw beans are presented in Table 9. Except for
genotype R-443-F from Puerto Rico, there were no significant differences in Tg (P>0.05) among
fast, moderate and slow cooking yellow and red mottled beans from Puerto Rico and Tanzania.
The Tg of genotype R-443-F from Puerto Rico was at least 10oC lower than genotypes R-436-M
and R-434-S. Except for R-443-F, each of the bean genotypes of both yellow and red mottled beans
from Puerto Rico had 5-6oC higher gelatinization temperature (Tg) than its counterpart from
Tanzania. This suggests that location could have an influence on the gelatinization temperatures
of these dry bean varieties.
These results are in agreement with Bernal-Lugo and others (1996) who reported that both fast
and slow cooking beans had similar gelatinization temperatures (86oC and 87oC, respectively) and
therefore that Tg did not have much contribution to cooking time. Their Tg values were 4 to 6oC
higher than Tg values in the present study probably because of the environmental difference in
which the beans were grown. Since the beans had similar gelatinization temperatures, it can be
concluded that Tg was not associated with their cooking time.
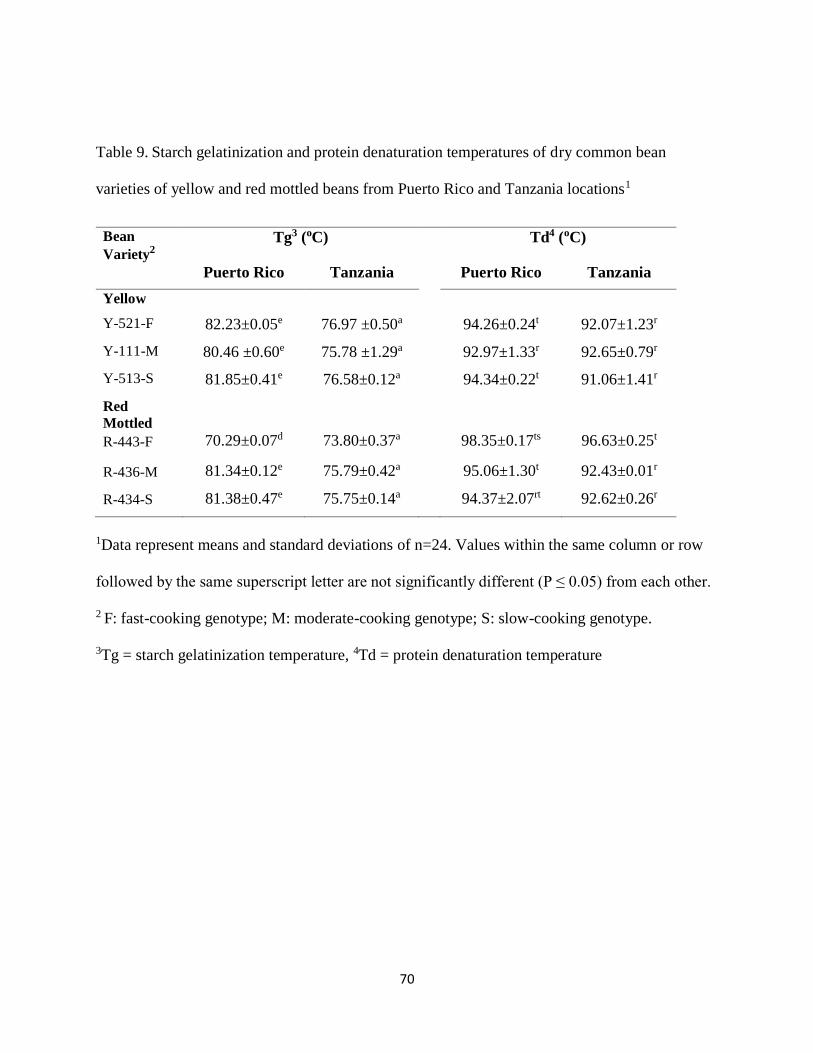
70
Table 9. Starch gelatinization and protein denaturation temperatures of dry common bean
varieties of yellow and red mottled beans from Puerto Rico and Tanzania locations1
Bean
Variety2
Tg3 (oC) Td4 (oC)
Puerto Rico Tanzania Puerto Rico Tanzania
Yellow
Y-521-F 82.23±0.05e 76.97 ±0.50a 94.26±0.24t 92.07±1.23r
Y-111-M 80.46 ±0.60e 75.78 ±1.29a 92.97±1.33r 92.65±0.79r
Y-513-S 81.85±0.41e 76.58±0.12a 94.34±0.22t 91.06±1.41r
Red
Mottled
R-443-F 70.29±0.07d 73.80±0.37a 98.35±0.17ts 96.63±0.25t
R-436-M 81.34±0.12e 75.79±0.42a 95.06±1.30t 92.43±0.01r
R-434-S 81.38±0.47e 75.75±0.14a 94.37±2.07rt 92.62±0.26r
1Data represent means and standard deviations of n=24. Values within the same column or row
followed by the same superscript letter are not significantly different (P ≤ 0.05) from each other.
2 F: fast-cooking genotype; M: moderate-cooking genotype; S: slow-cooking genotype.
3Tg = starch gelatinization temperature, 4Td = protein denaturation temperature
71
4.11. Protein denaturation temperature
Protein denaturation (Td) temperatures of the studied raw beans are presented in Table 9. There
were no significant differences in Td among fast, moderate and slow cooking yellow beans within
the Puerto Rico location and within the Tanzania location (P>0.05). For red mottled beans, with
the exception of R-443-F, there were also no significant differences in Td among fast, moderate
and slow cooking yellow beans within the Puerto Rico location and within the Tanzania location
(P>0.05). R-443-F had at least 3oC higher Td than other varieties in Puerto Rico. For both yellow
and red mottled beans, each genotype grown in Puerto Rico had a slightly significant higher Td
(2-3oC) than its counterpart grown in Tanzania.
Moreno and others (1994) reported that fast cooking beans (variety Michigan 800) had a lower
protein denaturation temperature (88.6±0.8oC) than that of slow cooking bean (variety Ojo de
Cabra, 95.3±0.7oC), and indicated that this affected the cooking time of beans. On the contrary,
Bernal-Lugo and others (1996) reported that both fast and slow cooking beans had similar protein
denaturation temperatures (103oC and 104oC, respectively) and that therefore denaturation
temperature does not contribute to cooking time. The results of this thesis, in Table 9, are in
agreement with Bernal-Lugo and others (1996) although the Td values for their bean varieties were
at least 11oC higher than those of the beans in the present study. The results imply that Td did not
have an association with cooking time of beans.
Based on results in the present study (Table 9), a difference in growing location had a slight effect
on protein denaturation temperature of most of the counterpart varieties. Due to a limited number
of bean varieties, further tests are needed from more different locations to verify the findings.
72
CHAPTER 5
CONCLUSIONS AND RECOMMENDATIONS
The findings of this study showed that yellow beans cooked slightly faster than red mottled beans
and location had no effect on the cooking time trend. There was no significant difference in
cooking times of soaked and dehulled beans, therefore soaking is as good as dehulling. Seed coat
thickness and starch content were positively correlated with cooking time. Hot water soluble pectin
and total pectin content were negatively correlated to cooking time. Starch gelatinization
temperature, protein denaturation temperature, protein content, and calcium and magnesium
contents each was not associated with cooking time of beans.
Households should always soak dry common beans before cooking to shorten cooking time. Also,
selecting for bean varieties with a thinner seed coat would be a good method of reducing cooking
time of beans; however, the seed coat is a protective mechanism against pests, and so maybe
selecting for thin but tough seed coats would result into varieties with a shorter cooking time.
Further investigation on the structure of the studied components of fast and slow cooking common
beans will provide more knowledge towards understanding the physicochemical properties
influencing cooking time of dry common beans. Also larger number of bean genotypes and market
classes should be used.
73
APPENDIX

74
Figure 11. The peak gelatinization (first peak) and peak denaturation (second peak) temperatures
of dry common beans from Tanzania.
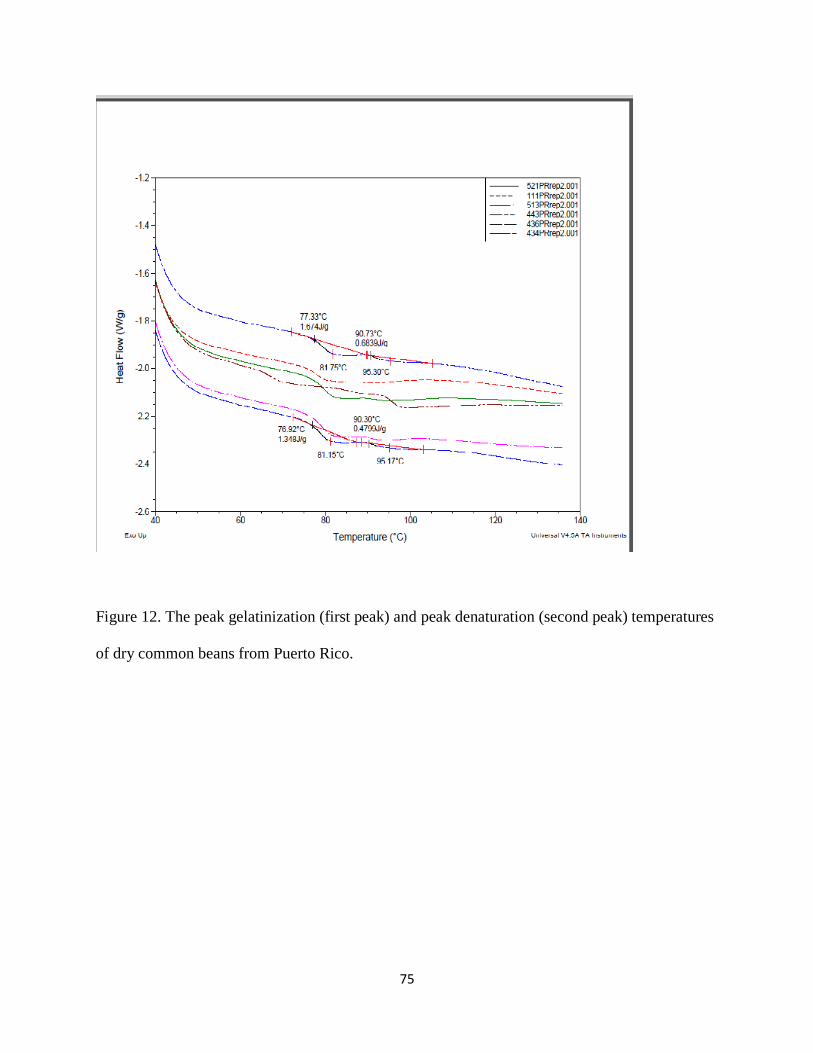
75
Figure 12. The peak gelatinization (first peak) and peak denaturation (second peak) temperatures
of dry common beans from Puerto Rico.
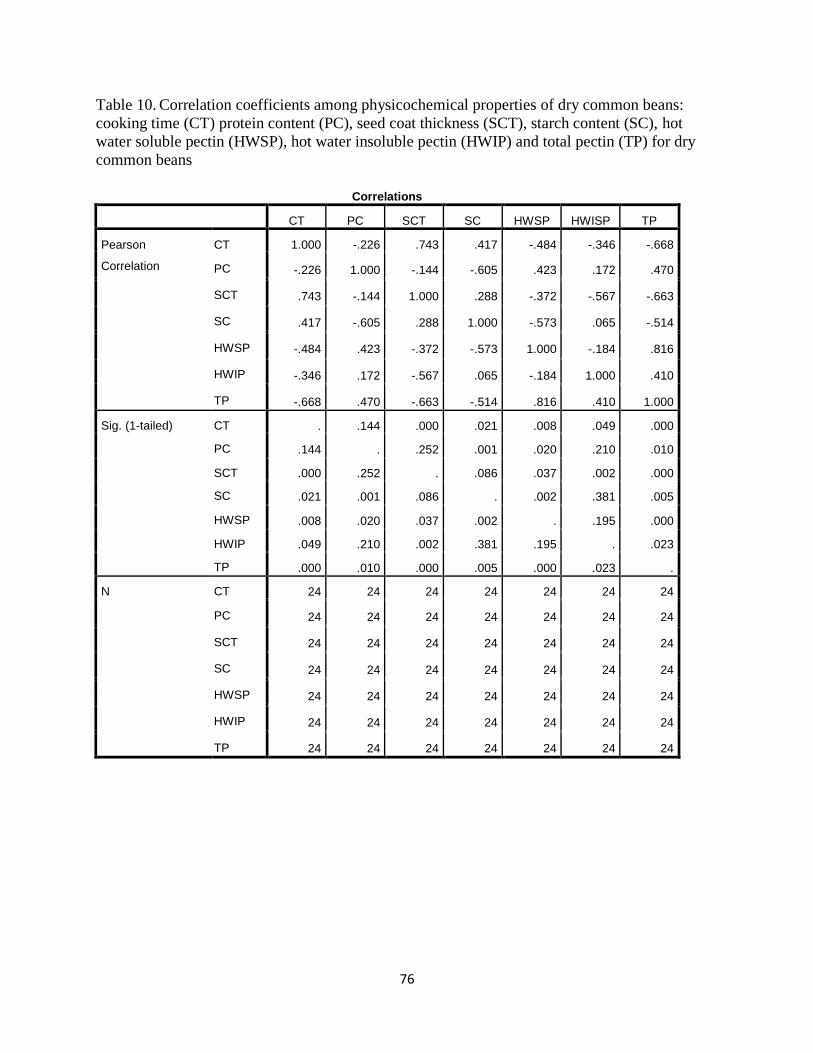
76
Table 10. Correlation coefficients among physicochemical properties of dry common beans:
cooking time (CT) protein content (PC), seed coat thickness (SCT), starch content (SC), hot
water soluble pectin (HWSP), hot water insoluble pectin (HWIP) and total pectin (TP) for dry
common beans
Correlations
CT PC SCT SC HWSP HWISP TP
Pearson
Correlation
CT 1.000 -.226 .743 .417 -.484 -.346 -.668
PC -.226 1.000 -.144 -.605 .423 .172 .470
SCT .743 -.144 1.000 .288 -.372 -.567 -.663
SC .417 -.605 .288 1.000 -.573 .065 -.514
HWSP -.484 .423 -.372 -.573 1.000 -.184 .816
HWIP -.346 .172 -.567 .065 -.184 1.000 .410
TP -.668 .470 -.663 -.514 .816 .410 1.000
Sig. (1-tailed) CT . .144 .000 .021 .008 .049 .000
PC .144 . .252 .001 .020 .210 .010
SCT .000 .252 . .086 .037 .002 .000
SC .021 .001 .086 . .002 .381 .005
HWSP .008 .020 .037 .002 . .195 .000
HWIP .049 .210 .002 .381 .195 . .023
TP .000 .010 .000 .005 .000 .023 .
N CT 24 24 24 24 24 24 24
PC 24 24 24 24 24 24 24
SCT 24 24 24 24 24 24 24
SC 24 24 24 24 24 24 24
HWSP 24 24 24 24 24 24 24
HWIP 24 24 24 24 24 24 24
TP 24 24 24 24 24 24 24
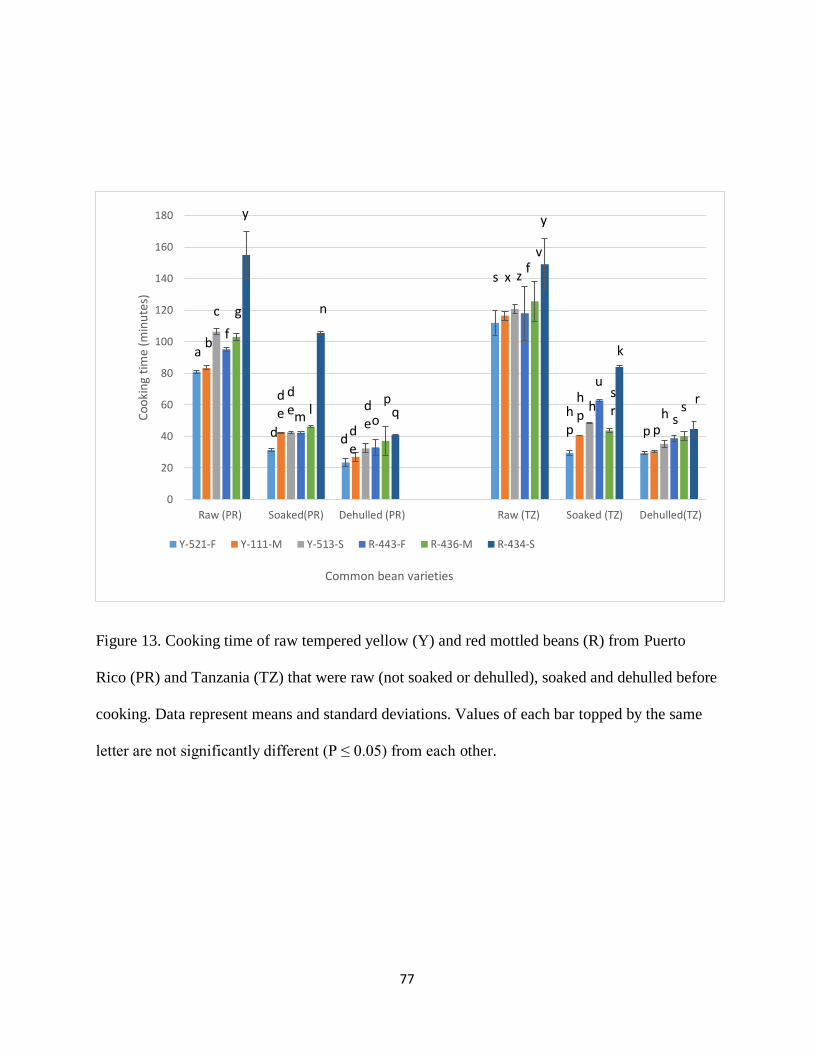
77
Figure 13. Cooking time of raw tempered yellow (Y) and red mottled beans (R) from Puerto
Rico (PR) and Tanzania (TZ) that were raw (not soaked or dehulled), soaked and dehulled before
cooking. Data represent means and standard deviations. Values of each bar topped by the same
letter are not significantly different (P ≤ 0.05) from each other.
0
20
40
60
80
100
120
140
160
180
Raw (PR) Soaked(PR) Dehulled (PR) Raw (TZ) Soaked (TZ) Dehulled(TZ)
Co
oki
ng
tim
e (m
inu
tes)
Common bean varieties
Y-521-F Y-111-M Y-513-S R-443-F R-436-M R-434-S
ab
c
f
g
y
d
de
dem
l
n
dde
deo
pq
s x zf
v
y
hp
hp
h
usr
k
p ph s
sr
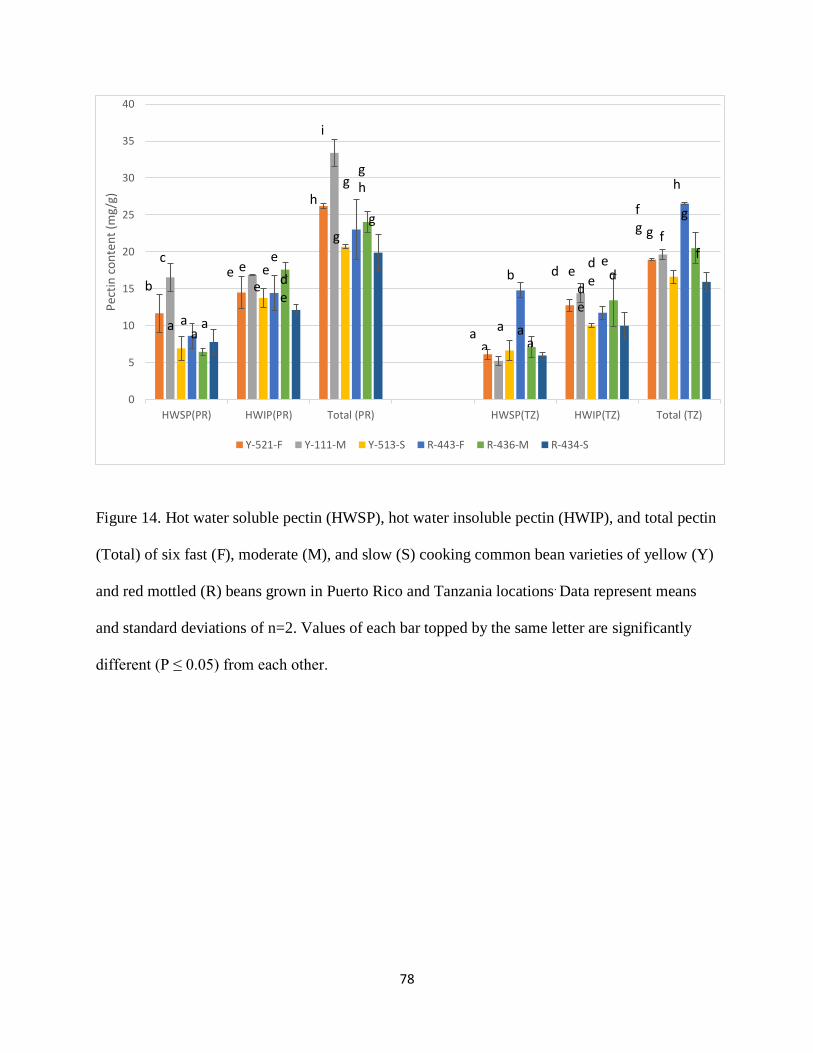
78
Figure 14. Hot water soluble pectin (HWSP), hot water insoluble pectin (HWIP), and total pectin
(Total) of six fast (F), moderate (M), and slow (S) cooking common bean varieties of yellow (Y)
and red mottled (R) beans grown in Puerto Rico and Tanzania locations. Data represent means
and standard deviations of n=2. Values of each bar topped by the same letter are significantly
different (P ≤ 0.05) from each other.
0
5
10
15
20
25
30
35
40
HWSP(PR) HWIP(PR) Total (PR) HWSP(TZ) HWIP(TZ) Total (TZ)
Pec
tin
co
nte
nt
(mg/
g)
Y-521-F Y-111-M Y-513-S R-443-F R-436-M R-434-S
b
c
a aa
a
e e
ee
e
de
h
i
g
ggh
g
aa
a
b
aa
d ede
de
ed
fg g f
h
g
f
79
REFERENCES
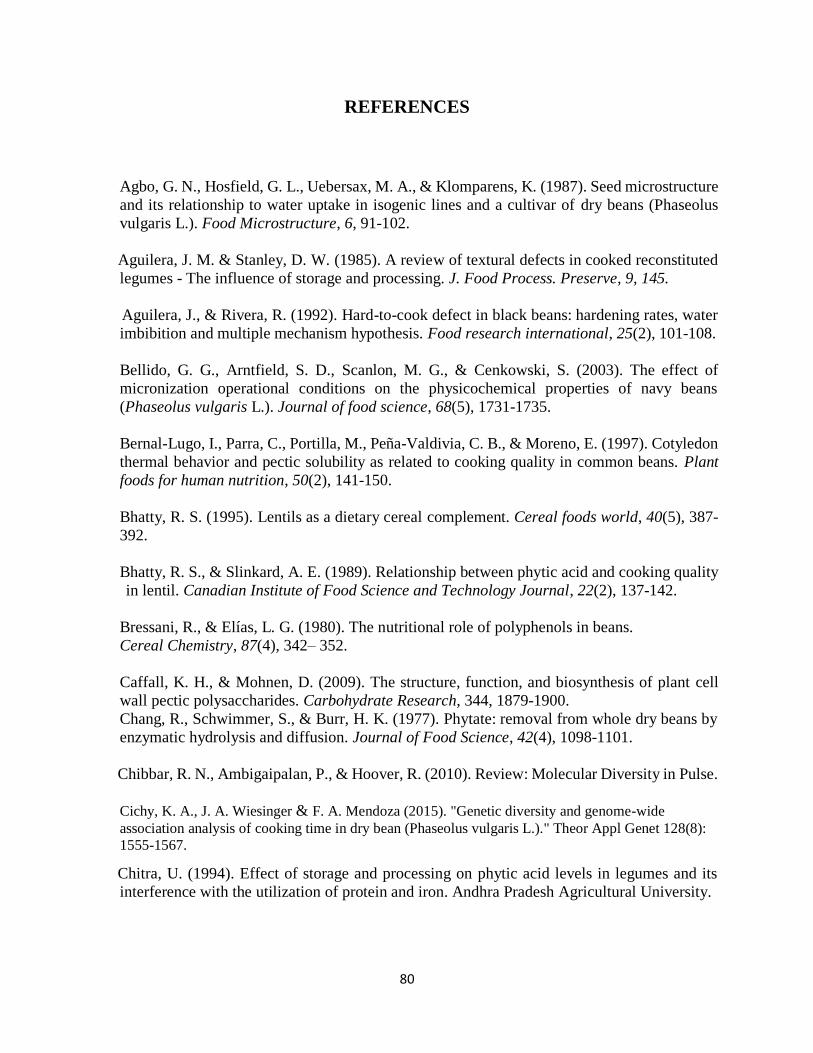
80
REFERENCES
Agbo, G. N., Hosfield, G. L., Uebersax, M. A., & Klomparens, K. (1987). Seed microstructure
and its relationship to water uptake in isogenic lines and a cultivar of dry beans (Phaseolus
vulgaris L.). Food Microstructure, 6, 91-102.
Aguilera, J. M. & Stanley, D. W. (1985). A review of textural defects in cooked reconstituted
legumes - The influence of storage and processing. J. Food Process. Preserve, 9, 145.
Aguilera, J., & Rivera, R. (1992). Hard-to-cook defect in black beans: hardening rates, water
imbibition and multiple mechanism hypothesis. Food research international, 25(2), 101-108.
Bellido, G. G., Arntfield, S. D., Scanlon, M. G., & Cenkowski, S. (2003). The effect of
micronization operational conditions on the physicochemical properties of navy beans
(Phaseolus vulgaris L.). Journal of food science, 68(5), 1731-1735.
Bernal-Lugo, I., Parra, C., Portilla, M., Peña-Valdivia, C. B., & Moreno, E. (1997). Cotyledon
thermal behavior and pectic solubility as related to cooking quality in common beans. Plant
foods for human nutrition, 50(2), 141-150.
Bhatty, R. S. (1995). Lentils as a dietary cereal complement. Cereal foods world, 40(5), 387-
392.
Bhatty, R. S., & Slinkard, A. E. (1989). Relationship between phytic acid and cooking quality
in lentil. Canadian Institute of Food Science and Technology Journal, 22(2), 137-142.
Bressani, R., & Elías, L. G. (1980). The nutritional role of polyphenols in beans.
Cereal Chemistry, 87(4), 342– 352.
Caffall, K. H., & Mohnen, D. (2009). The structure, function, and biosynthesis of plant cell
wall pectic polysaccharides. Carbohydrate Research, 344, 1879-1900.
Chang, R., Schwimmer, S., & Burr, H. K. (1977). Phytate: removal from whole dry beans by
enzymatic hydrolysis and diffusion. Journal of Food Science, 42(4), 1098-1101.
Chibbar, R. N., Ambigaipalan, P., & Hoover, R. (2010). Review: Molecular Diversity in Pulse.
Cichy, K. A., J. A. Wiesinger & F. A. Mendoza (2015). "Genetic diversity and genome-wide
association analysis of cooking time in dry bean (Phaseolus vulgaris L.)." Theor Appl Genet 128(8):
1555-1567.
Chitra, U. (1994). Effect of storage and processing on phytic acid levels in legumes and its
interference with the utilization of protein and iron. Andhra Pradesh Agricultural University.

81
Chung, H. J., Shin, D. H., & Lim, S. T. (2008). In vitro starch digestibility and estimated
glycemic index of chemically modified corn starches. Food Research International, 41(6),
579-585.
Coelho, S. R. M., Prudêncio, S. H., Christ, D., & Sampaio, S. C. (2011). Storage-induced
changes in protein interactions and protein solubility in common beans. Journal of Food,
Agriculture & Environment, 9(3&4), 44-48.
Curtis, H. (1991). The Effect of Soaking and Pectin Composition on the Hardness of Dried
Legumes (phaseolus Vulgaris) (Doctoral dissertation, Brigham Young University. Department
of Food and Science and Nutrition.).
De Leo n, L. F., Elias, L. G., & Bressani, R. (1992). Effect of salt solutions on the cooking
time, nutritional and sensory characteristics of common beans (Phaseolus vulgaris). Food
Research International, 25, 131±136.
Del Valle, J. M., & Stanley, D. W. (1995). Reversible and irreversible components of bean
hardening. Food research international, 28(5), 455-463.
Diaz, A.M.; Caldas, G.V.; Blair, M.W. Concentrations of condensed tannins and anthocyanins
in common bean seed coats. Food Res. Int. 2010, 43, 595–601.
El‐Tabey Shehata, A. M. (1992). Hard‐to‐cook phenomenon in legumes. Food Reviews
International, 8(2), 191-221.
Fasina, O., Tyler, B., Pickard, M., Zheng, G. H., & Wang, N. (2001). Effect of infrared heating
on the properties of legume seeds*. International journal of food science & technology, 36(1),
79-90.
Garcia, E., Filisetti, T. M., Udaeta, J. E., & Lajolo, F. M. (1998). Hard-to-cook beans
(Phaseolus vulgaris): involvement of phenolic compounds and pectates. Journal of
Agricultural and Food Chemistry, 46(6), 2110-2116.
Guillon, F., & Champ, M. J. (2002). Carbohydrate fractions of legumes: uses in human
nutrition and potential for health. British Journal of Nutrition, 88(S3), 293-306.
Hentges, D. L., Weaver, C. M., & Nielsen, S. S. (1991). Changes of Selected Physical and
Chemical Components in the Development of the Hard‐to‐Cook Bean Defect. Journal of Food Science, 56(2), 436-442.
Hincks, M. J., & Stanley, D. W. (1987). Lignification: evidence for a role in hard‐to‐cook beans. Journal of Food Biochemistry, 11(1), 41-58.
Jane, J. L. (2000). Carbohydrates: basic concepts. Food chemistry: Principles and applications.
California: Science technology systems, 43.
82
Jane, J. L. (2012). Carbohydrates: basic concepts. Food chemistry: Principles and applications.
California: Science technology systems, 43.
Jane, J., Chen, Y., Lee, L., McPherson, E., Wong, K., Radosavlijevic, M., & Kasemsuwan, T.
(1999). Effects of amylopectin branch chain length and amylose content on the morphology,
molecular structure, and physicochemical properties of starches from newly released chickpea
(Cicer arietinum L.) cultivars grown in Canada. Food Research
Jones, P. M. B., & Boulter, D. (1983). The cause of reduced cooking rate in Phaseolus vulgaris
following adverse storage conditions. Journal of Food Science, 48(2), 623-626.
Journal of Cereal Science, 39,151-165.
Kadam S.S., Deshpande S.S., & Jambhale D.N. (1991). Seed structure and composition. In:
Ng, P. K. W. Book Review-- Handbook of World Food Legumes: Nutritional Chemistry,
Processing Technology, and Utilization (Vol. I).
Kaur, A., Kaur, P., Singh, N., Virdi, A. S., Singh, P., & Rana, J. C. (2013). Grains, starch and
protein characteristics of rice bean (Vigna umbellata) grown in Indian Himalaya regions.
Food Research International, 54(1), 102–110.
Ken, S., Brown. A.H., Ohanneson. J.G., and Booth, A.N. 1973.Split peeled beans: Preparation
and some properties. J. Food Sci.38: 496.
Kon, S., & Sanshuck, D. W. (1981). Phytate content and its effect on cooking quality of beans.
Journal of Food Processing and Preservation, 5(3), 169-178.
Kutoš, T., Golob, T., Kač, M., & Plestenjak, A. (2003). Dietary fiber content of dry and
processed beans. Food chemistry, 80(2), 231-235.
Kyriakidis, N. B., Apostolidis, A., Papazoglou, L. E., & Karathanos, V. T. (1997).
Physicochemical Studies of Hard‐to‐Cook Beans (Phaseolus vulgaris). Journal of the Science of Food and Agriculture, 74(2), 186-192.
Liu, K., Shewfelt, R. L., Phillips, R. D., & Hung, Y. C. (1992). Hard‐to‐cook state in cowpeas‐ influence of pretreatment and cooking on electrolyte leakage solids‐loss and water absorption. International journal of food science & technology, 27(6), 683-690.
Martínez‐Manrique, E., Jacinto‐Hernández, C., Garza‐García, R., Campos, A., Moreno, E., &
Bernal‐Lugo, I. (2011). Enzymatic changes in pectic polysaccharides related to the beneficial
effect of soaking on bean cooking time. Journal of the Science of Food and Agriculture, 91(13),
2394-2398.
Maryange, M., Msolla, N., Sawargaonkar, S. L., Hudge, B. V., & Thanki, H. P.
(2010).Screening of 30 advanced common bean (P. vulgaris, L) lines for short cooking time
using two different methods. Electronic Journal of Plant Breeding, 1(4), 505-511.
83
Mkanda, A. V., Minnaar, A., & De Kock, H. L. (2007). Relating consumer preferences to
sensory and physicochemical properties of dry beans (Phaseolus vulgaris). Journal of the
Science of Food and Agriculture, 87(15), 2868-2879.
Mohan, J. R, Sangeetha, A., Narasimha, V. H and Tiwari, K. B. (2011).Chapter 7:Post-harvest
technology of pulses. In Tiwari, K. B., Gowen, A. and Mckenna, B. (2011).Pulse Foods:
Processing, Quality and Nutraceutical Applications.
Mohnen, D. (2008). Pectin structure and biosynthesis. Current Opinion in Plant Biology, 11,
266-277.
Moscoso, W., Bourne, M. C., & Hood, L. F. (1984). Relationships between the Hard‐to‐Cook
Phenomenon in Red Kidney Beans and Water Absorption, Puncture Force, Pectin, Phytic Acid,
and Minerals. Journal of Food Science, 49(6), 1577-1583.
Mwangwela, A. M., Waniska, R. D., & Minnaar, A. (2007). Effect of micronization
temperature (130 and 170 C) on functional properties of cowpea flour. Food chemistry,
104(2), 650-657.
Nasar-Abbas, S. M., Plummer, J. A., Siddique, K. H., White, P., Harris, D., & Dods, K. (2008).
Cooking quality of faba bean after storage at high temperature and the role of lignins and other
phenolics in bean hardening. LWT-Food Science and Technology, 41(7), 1260-1267.
Njoroge, M. D., Kinyanjui, K. P., Makokha, O. A., Christiaens, S., Shpigelman, A., Sila, N.
D., & Hendrickx, E. M. (2014). Extraction and characterization of pectic polysaccharides from
easy- and hard-to-cook common beans (Phaseolus vulgaris). Food Research International 64,
314-322
Nozzolillo, C., & Bezada, M. D. (1984). Browning of lentil seeds, concomitant loss of viability,
and the possible role of soluble tannins in both phenomena. Canadian journal of plant science,
64(4), 815-824.
Ovando-Martínez, M., Bello-Pérez, L. A., Whitney, K., Osorio-Díaz, P., & Simsek, S. (2011).
Starch characteristics of bean (Phaseolus vulgaris L.) grown in different localities.
Carbohydrate polymers, 85(1), 54-64.
Petry, N., Boy, E., Wirth, J. P., & Hurrell, R. F. (2015). Review: The Potential of the Common
Bean (Phaseolus vulgaris) as a Vehicle for Iron Bio fortification. Nutrients, 7(2), 1144-1173.
Pirhayati, M., Soltanizadeh, N., & Kadivar, M. (2011). Chemical and microstructural
evaluation of ‘hard‐to‐cook phenomenon in legumes (pinto bean and small‐type lentil). International Journal of Food Science & Technology, 46(9), 1884-1890.
84
Reddy, N.R.; Pierson, M.D.; Sathe, S.K.; Salunkhe, D.K. Dry bean tannins: A review of
nutritional implications. J. Am. Oil Chem. Soc. 1985, 62, 541–549.
Reyes-Moreno, C., Cárabez-Trejo, A., Paredes-López, O., & Ordorica-Falomir, C. (1994).
Physicochemical and structural properties of two bean varieties which differ in cooking time
and the HTC characteristic. LWT-Food Science and Technology, 27(4), 331-336.
Reyes‐Moreno, C., Paredes‐López, O., & Gonzalez, E. (1993). Hard‐to‐cook phenomenon in common beans— A review. Critical Reviews in Food Science & Nutrition, 33(3), 227-286.
Reyes‐Moreno, C., Rouzaud‐Sandez, O., Milán‐Carrillo, J., Garzón‐Tiznado, J. A., &
Camacho‐Hernández, L. (2001). Hard‐to‐cook tendency of chickpea (Cicer arietinum L) varieties. Journal of the Science of Food and Agriculture, 81(10), 1008-1012.
Salunkhe, D. K., & Kadam, S. S. (1989). Handbook of world food legumes: nutritional
chemistry, processing technology, and utilization. Volume 1. CRC Press, Inc.
Salvador, B. D. V. (2007). Improvement in the cooking and physico-chemical characteristics
of hard-to-cook cowpeas by pre-conditioning and micronization (Doctoral dissertation,
University of Pretoria).
Sathe, S.K. and Deshpande, S.S. (2003). Beans. Encyclopedia of Food Science and Nutrition,
2nd Ed. Vol.1.Pp 403-412.
Sefa-Dedeh, S., & Stanley, D. W. (1979a). The relationship of microstructure of cowpeas to
water absorption and dehulling properties. Cereal Chem, 56(4), 379-386.
Sefa-Dedeh, S., & Stanley, D. W. (1979b). The relationship of microstructure of cowpeas to
water absorption and dehulling properties. Cereal Chem, 56(4), 379-386.
Shiga, T. M., Cordenunsi, B. R., & Lajolo, F. M. (2006). Cell wall polysaccharides of
common beans (Phaseolus vulgaris L.) composition and structure. Carbohydrate Polymers
63(1)1-12
Shiga, T. M., Cordenunsi, B. R., & Lajolo, F. M. (2009). Effect of cooking on non-starch
polysaccharides of hard-to-cook beans. Carbohydrate polymers, 76(1), 100-109.
Shiga, T. M., Cordenunsi, B. R., & Lajolo, F. M. (2011). The effect of storage on the
solubilization pattern of bean hull non-starch polysaccharides. Carbohydrate Polymers, 83(2),
362-367.
Singh, U. (1999). Cooking quality of pulses. J. Food Sci. Technol. Mysore 36, 1–14.
Stanley, D. W. & Aguilera, J. M. (1985). A review of textural defects in cooked reconstituted
legumes ~ the influence of structure and composition. J. Food Biochem. 9. 277-323.
85
Stanley, D. W. (1992). A possible role for condensed tannins in bean hardening. Food Research
International, 25, 187-92.
Stanley, D. W., Wu, X., & Plhak, L. C. (1989). Seed coat effects in cooked reconstituted bean
texture. Journal of texture studies, 20(4), 419-429.
Taiwo, K. A., Akanbi, C. T., & Ajibola, O. O. (1998). Regression relationships for the soaking
and cooking properties of two cowpea varieties. Journal of food engineering, 37(3), 331-344.
Tester, R., Karkalas, J., & Qi, X. (2004). Starch—composition, fine structure and architecture.
Tiwari, B. K., Gowen, A., & McKenna, B. (Eds.). (2011). Pulse foods: processing, quality and
nutraceutical applications. Academic Press.
Valle, J., Stanley, D. W., & Bourne, M. C. (1992). Water absorption and swelling in dry bean
seeds. Journal of Food Processing and Preservation, 16(2), 75-98.
Van Laar, H., Tamminga, S., Williams, B. A., Verstegen, M. W., & Engels, F. M. (1999).
Fermentation characteristics of cell-wall sugars from soya bean meal, and from separated
endosperm and hulls of soya beans. Animal feed science and technology, 79(3), 179-193.
Vindiola C, O. L. (1986). Accelerated development of the hard-to-cook state in beans (Master's
thesis, Kansas State University).
Wang, N., Hatcher, D. W., & Gawalko, E. J. (2008). Effect of variety and processing of
nutrients and certain anti-nutrients in field peas (Pisum sativum). Food Chemistry, 111(1),
132-138.
Wang, N., Hatcher, D. W., Toews, R., & Gawalko, E. J. (2009). Influence of cooking and
dehulling on nutritional composition of several varieties of lentils (Lens culinaris). LWT-Food
Science and Technology, 42(4), 842-848.
Wang N., Daun J. K. (2005). Determination of cooking times of pulses using an automated
Mattson cooker apparatus. Journal of Sci Food Agric 85:1631–1635.


![Syllabus as per AICTE - Pharma Inspireclassification, physicochemical properties, mode of action [MOA], structure activity relationships [SAR], wherever applicable, synthesis of simple](https://img.pdfslide.us/doc/110x75/5e5db036f2b68e71e9026262/syllabus-as-per-aicte-pharma-inspire-classification-physicochemical-properties.jpg)