Embed Size (px)
Citation preview

RELATIONSHIPSBETWEEN
MAINTENANCE & SERVICEPLANNING
Lexcie Lu, Transit Analyst
Dorchester, Mass.
© 1980, 2002 Steve Zabel/Joe Testagrose
© 2003 Robert Mencher
Assisted by

Lexcie Lu TRB #04-2697 – The Relationship between Maintenance and Service Planning
Slide 2 of 18
Outline
1. Problem Statement2. Social Externalities of
Maintenance3. Decision Support Framework4. Discussion
a. Inspection v.s. Repair Costsb. Consumer Perception of Service
Failuresc. Stochasticity of Transit Operationsd. Effect of Reduced Maintenance on
MDBF
5. Conclusions/Recommendationsa. Maintenance Standards Fault
Managementb. Maintenance Schedulingc. Engineering Research

Lexcie Lu TRB #04-2697 – The Relationship between Maintenance and Service Planning
Slide 3 of 18
Problem Statement
“How do we maximize the benefits provided
by fixed resources on a crowded transit corridor, considering such
user benefits as frequency, timeliness, reliability, safety, and agency traincrew, maintenance,
capital costs?”
or
“Should you run your EMU’s till they drop in their tracks?”
Lexcie Lu TRB #04-2697 – The Relationship between Maintenance and Service Planning
Slide 4 of 18
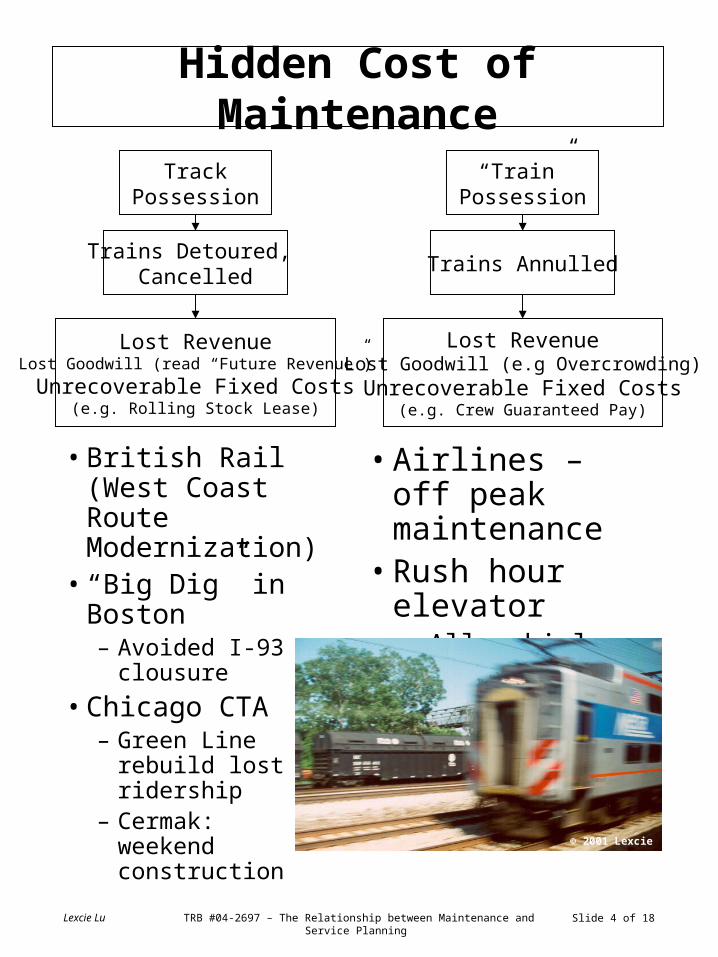
Hidden Cost of Maintenance
TrackPossession
Trains Detoured, Cancelled
Lost RevenueLost Goodwill (read “Future Revenue”)
Unrecoverable Fixed Costs(e.g. Rolling Stock Lease)
• British Rail (West Coast Route Modernization)
• “Big Dig” in Boston– Avoided I-93
clousure
• Chicago CTA – Green Line
rebuild lost ridership
– Cermak: weekendconstruction
“Train”Possession
Trains Annulled
Lost RevenueLost Goodwill (e.g Overcrowding)
Unrecoverable Fixed Costs(e.g. Crew Guaranteed Pay)
• Airlines – off peak maintenance
• Rush hour elevator– All vehicles
used!
© 2001 Lexcie

Lexcie Lu TRB #04-2697 – The Relationship between Maintenance and Service Planning
Slide 5 of 18
OverMaintenance(asset underuse)
High residual
component life (High
costs)
Maintenance Planning is a Balancing Act
UnderMaintenance
(asset overuse)
Low utilization
Overcrowding
Loss of Benefits
Complaints
Low Ridership
Christmas Trees
High labor costs Indifference
Poor ride quality,
poor appearan
ce
Lost Revenue
Loss of Goodwill
High costs“Deferred
maintenance”
Low reliability
Unsafe conditio
ns
Line Chiefs have to walk a tightro
pe!
Complaints
DelaysLoss of Benefits
Loss ofRevenue
DecisionSupport
Tool
Lexcie Lu TRB #04-2697 – The Relationship between Maintenance and Service Planning
Slide 6 of 18
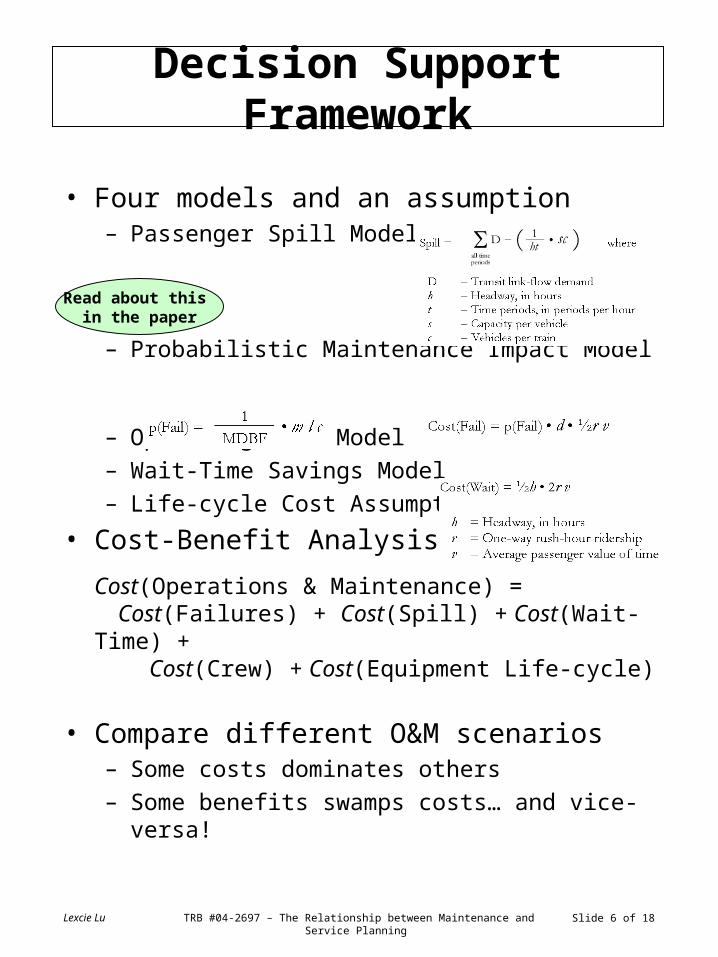
Decision Support Framework
• Four models and an assumption– Passenger Spill Model
– Probabilistic Maintenance Impact Model
– Operating Cost Model– Wait-Time Savings Model– Life-cycle Cost Assumption
• Cost-Benefit Analysis Framework
Cost(Operations & Maintenance) = Cost(Failures) + Cost(Spill) + Cost(Wait-Time) + Cost(Crew) + Cost(Equipment Life-cycle)
• Compare different O&M scenarios– Some costs dominates others– Some benefits swamps costs… and vice-
versa!
Read about this in the paper
Lexcie Lu TRB #04-2697 – The Relationship between Maintenance and Service Planning
Slide 7 of 18
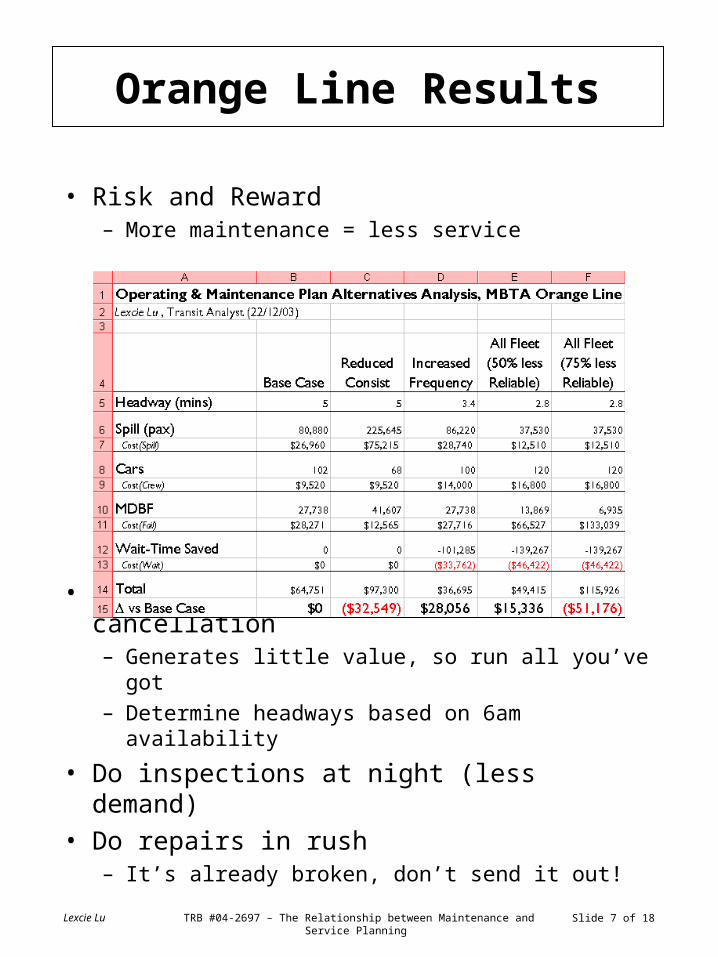
Orange Line Results
• Risk and Reward– More maintenance = less service
• ‘Protect’ set is a scheduled cancellation– Generates little value, so run all you’ve got– Determine headways based on 6am
availability
• Do inspections at night (less demand)• Do repairs in rush
– It’s already broken, don’t send it out!

Lexcie Lu TRB #04-2697 – The Relationship between Maintenance and Service Planning
Slide 8 of 18
Discussion:Inspection v.s. Repair
• Deferred maintenance leads to additional repair maintenance in the longer term
or does it?
Classical Relationship: Repair & PM Expenses
0 1 2 3 4 5 6 7 8 9 10
Planned Number of Protect/PM Sets
Eco
no
mic
Co
st (
Fle
et,
Th
ou
san
ds)
PM expense Repair expense TOTAL
CONCEPTUAL
Source: Haven (1980), p.15
The curve might be remarkably flat…

Lexcie Lu TRB #04-2697 – The Relationship between Maintenance and Service Planning
Slide 9 of 18
Trainset Utilization Economic Value Analysis
0 1 2 3 4 5 6 7 8 9 10
Planned Number of Protect/PM Sets
Eco
no
mic
Co
st (
Fle
et,
Th
ou
san
ds)
Frequency loss E($) Rush hour failures
Traincrew Passenger spill
Mileage-related maintenance PM expense
Repair expense TOTAL
Inspection + Repair + Operating + Customer
Costs• If PM takes a trainset out of rush
use, think hard about how you might break the job into two sessions, or defer it!
Sources: Railcar Maintenance Model, MBTA Budget 2001
MBTA Orange Line
Must recalibrate for each line, each transit authority,
each maintenance operationand operating plan
CONCEPTUAL
Lexcie Lu TRB #04-2697 – The Relationship between Maintenance and Service Planning
Slide 10 of 18
© 2003 Chuchubob
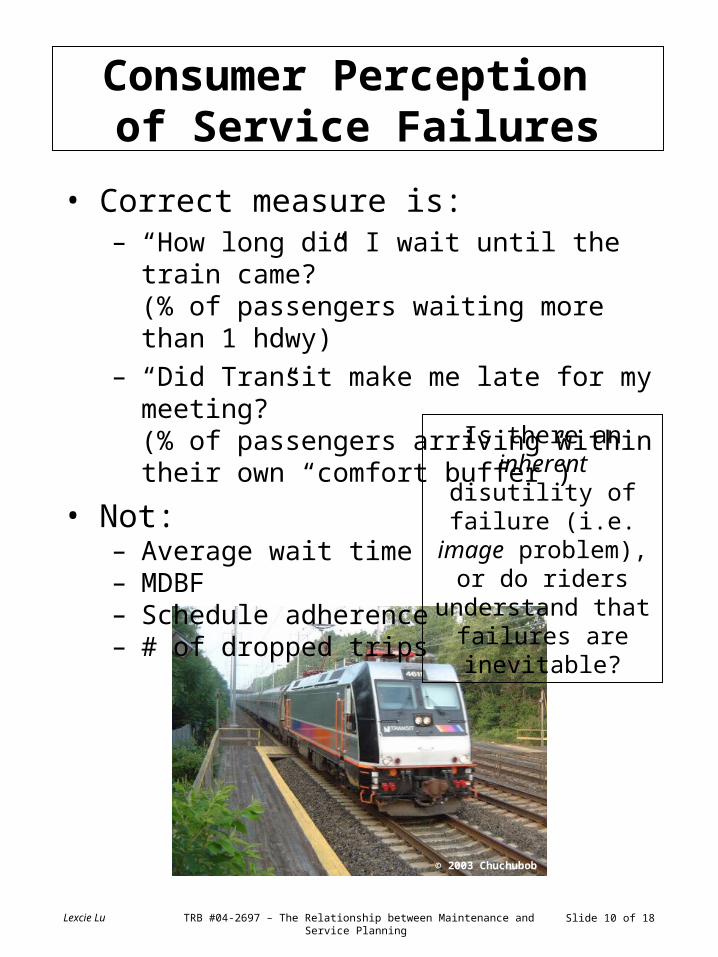
Consumer Perception of Service Failures
• Correct measure is:– “How long did I wait until the train
came?”(% of passengers waiting more than 1 hdwy)
– “Did Transit make me late for my meeting?”(% of passengers arriving within their own “comfort buffer”)
• Not:– Average wait time– MDBF– Schedule adherence– # of dropped trips
Is there an inherent disutility
of failure (i.e. image problem),
or do riders understand that
failures are inevitable?

Lexcie Lu TRB #04-2697 – The Relationship between Maintenance and Service Planning
Slide 11 of 18
Customer Requirement/ Performance Interaction
• Passengers will tolerate different amounts of delay, depending on trip purpose
• On-time performance distribution will vary, depending on railcar reliability (& other things)
Passenger Ontime Requirement Distribution
0.00
0.01
0.02
0.03
0.04
0.05
0.06
0.07
0.08
0.09
0.10
0.11
0 2 4 6 8 10 12 14 16 18 20
Maximum Tolerable Minutes Delay
Per
cen
tag
e o
f P
asse
ng
ers
Trip Ontime Performance Distribution (Normal)
0.00
0.02
0.04
0.06
0.08
0.10
0.12
0.14
0.16
0.18
-6 -4 -2 0 2 4 6 8 10 12 14 16 18 20
Headway Adherence (Minutes Delay)
Per
cen
tag
e o
f Tr
ips
Trip Ontime Performance Distribution(Erratic)
0.00
0.02
0.04
0.06
0.08
0.10
0.12
0.14
0.16
0.18
-6 -4 -2 0 2 4 6 8 10 12 14 16 18 20
Headway Adherence (Minutes Delay)
Per
cen
tag
e o
f Tr
ips
Cat
chin
g an
Am
trak
tra
in
Mee
ting
a da
te
Den
tist
appo
intm
ent
Job
inte
rvie
w
Com
mut
e
Goi
ng t
o sc
hool
Schedule allows 50% of trains to arrive on-time
(MBTA practice)
If trains are unreliable, mechanical/longer delays will increase
Ask me about this:Not in the paper
CONCEPTUAL
Rai
l exc
ursi
ons

Lexcie Lu TRB #04-2697 – The Relationship between Maintenance and Service Planning
Slide 12 of 18
Lost Productivity Associated with
Mechanical Delays• If customers have to leave earlier for the
same appointment to have 95% confidence of arriving on-time, precious time is lost.
• To calculate the social disbenefit of reliability loss, the correct measure is “increase in average buffer time”
• Decrease in on-time performance (to within four minutes) from 85% to 78% increased average buffer by… 47 seconds!
Contribution to Average Buffer Requiredfor 95% Confidence, by Type of Customer
0.00
0.10
0.20
0.30
0.40
0.50
0.60
0.70
0.80
0.90
0 2 4 6 8 10
Maximum Tolerable Minutes Delay
Co
ntr
ibu
tio
n t
o A
vera
ge
Bu
ffer
(M
inu
tes)
Normal
Erratic
Lost productivity (between the two curves)
CONCEPTUAL

Lexcie Lu TRB #04-2697 – The Relationship between Maintenance and Service Planning
Slide 13 of 18
Stochasticity of Transit Operations
• What’s really causing the delays?
• Cancelling one train due to maintenance difficulties is better than sloppy headways– Except for people on that train, and one
after– ‘Spreading out’ will further reduce delays
Effect of Operating Scenario on Average Passenger Wait Time
0.0
0.1
0.2
0.3
0.4
0.5
0.6
0.7
0.8
2.50 2.60 2.70 2.80 2.90 3.00 3.10 3.20
Average Passenger Wait (Minutes)
Hea
dw
ay C
oef
fici
ent
of
Var
iati
on
Base Case No Hdw y Mgmt (Allow Bunching) Annull 0700 Annull Any Train (No Intervention)
Ask me about this:Not in the paper
Ineq
uit
y o
f D
ela
ys
Quantity of Delays
Source: Headway Degradation Model
Lexcie Lu TRB #04-2697 – The Relationship between Maintenance and Service Planning
Slide 14 of 18
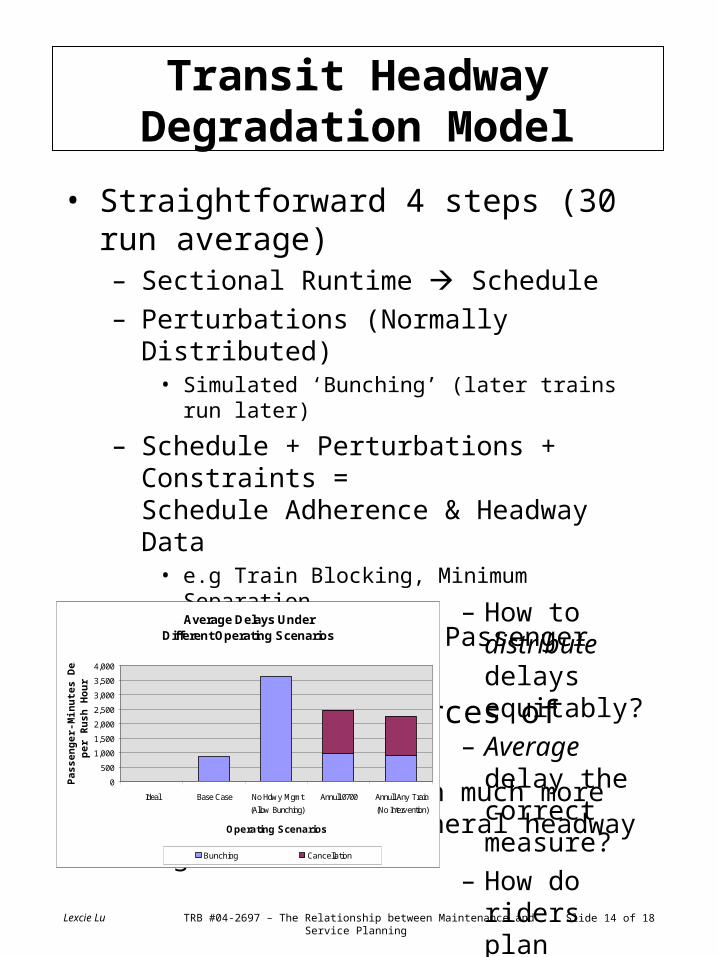
Transit Headway Degradation Model
• Straightforward 4 steps (30 run average)– Sectional Runtime Schedule– Perturbations (Normally Distributed)
• Simulated ‘Bunching’ (later trains run later)
– Schedule + Perturbations + Constraints = Schedule Adherence & Headway Data
• e.g Train Blocking, Minimum Separation
– Demand + Headway = Passenger Wait Times
• Determine the sources of delays– Forced cancellation much more
manageable than general headway degradation
Average Delays Under Different Operating Scenarios
0
500
1,000
1,500
2,000
2,500
3,000
3,500
4,000
Ideal Base Case No Hdw y Mgmt
(Allow Bunching)
Annull 0700 Annull Any Train
(No Interv ention)
Operating Scenarios
Pas
sen
ger
-Min
ute
s D
elay
p
er R
ush
Ho
ur
Bunching Cancellation
– How to distribute delaysequitably?
– Average delay the correct measure?
– How do riders plan trips?
Lexcie Lu TRB #04-2697 – The Relationship between Maintenance and Service Planning
Slide 15 of 18
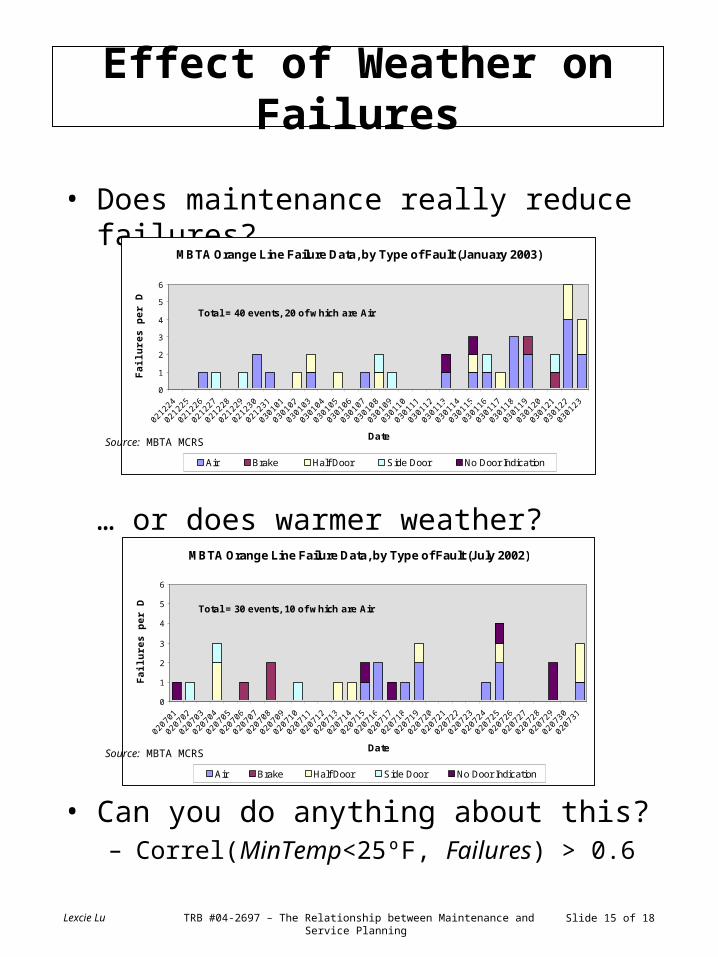
Effect of Weather on Failures
• Does maintenance really reduce failures?
… or does warmer weather?
• Can you do anything about this?– Correl(MinTemp<25ºF, Failures) > 0.6
MBTA Orange Line Failure Data, by Type of Fault (July 2002)
0
1
2
3
4
5
6
0207
01
0207
02
0207
03
0207
04
0207
05
0207
06
0207
07
0207
08
0207
09
0207
10
0207
11
0207
12
0207
13
0207
14
0207
15
0207
16
0207
17
0207
18
0207
19
0207
20
0207
21
0207
22
0207
23
0207
24
0207
25
0207
26
0207
27
0207
28
0207
29
0207
30
0207
31
Date
Fai
lure
s p
er D
ay
Air Brake Half Door Side Door No Door Indication
Total = 30 events, 10 of which are Air
MBTA Orange Line Failure Data, by Type of Fault (January 2003)
0
1
2
3
4
5
6
0212
24
0212
25
0212
26
0212
27
0212
28
0212
29
0212
30
0212
31
0301
01
0301
02
0301
03
0301
04
0301
05
0301
06
0301
07
0301
08
0301
09
0301
10
0301
11
0301
12
0301
13
0301
14
0301
15
0301
16
0301
17
0301
18
0301
19
0301
20
0301
21
0301
22
0301
23
Date
Fai
lure
s p
er D
ay
Air Brake Half Door Side Door No Door Indication
Total = 40 events, 20 of which are Air
Source: MBTA MCRS
Source: MBTA MCRS
Lexcie Lu TRB #04-2697 – The Relationship between Maintenance and Service Planning
Slide 16 of 18
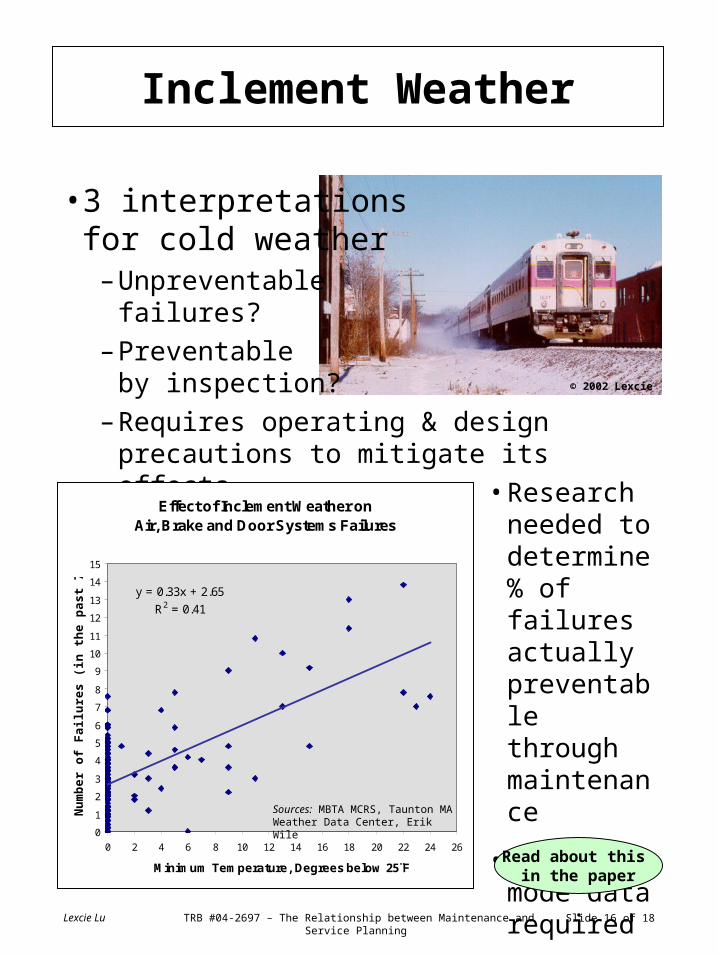
Inclement Weather
•3 interpretations for cold weather
– Unpreventable failures?
– Preventable by inspection?
– Requires operating & design precautions to mitigate its effects
Effect of Inclement Weather on Air, Brake and Door Systems Failures
y = 0.33x + 2.65
R2 = 0.41
0
1
2
3
4
5
6
7
8
9
10
11
12
13
14
15
0 2 4 6 8 10 12 14 16 18 20 22 24 26
Minimum Temperature, Degrees below 25¨F
Nu
mb
er o
f F
ailu
res
(in
th
e p
ast
7 d
ays)
•Research needed to determine % of failures actually preventable through maintenance
•Failure mode data required
Read about this in the paper
Sources: MBTA MCRS, Taunton MA Weather Data Center, Erik Wile
© 2002 Lexcie
Lexcie Lu TRB #04-2697 – The Relationship between Maintenance and Service Planning
Slide 17 of 18
Conclusions & Recommendations
• Light Maintenance Standards: The Old Way– Valve rebuild every x days;
Bearings greased every y miles
• Fault Management: The New Way– Opportunistic inspection (preventative)– Measure maintenance effectiveness through
railcar-related passenger minutes lost
• Some Standards Should Remain: Safety– Articulated joints on MBTA Type 7 cars,
dismantled, cleaned and greased every 6 years
• Maintenance Scheduling: Service Impacts– Maint. not ‘constraint’ – consumer of asset time– Scheduling to evaluate impact on service levels– Determine serv. & maint. schedule concurrently
• Engineering Research: Test, Get Data– Collect failure mode data accurately– Do post-mortems for in-service failures– Test things; test it again; test it different ways

Lexcie Lu TRB #04-2697 – The Relationship between Maintenance and Service Planning
Slide 18 of 18
Acknowledgements
• Research assisted by individuals from: Massachusetts Bay Transportation Authority, MIT Department of Civil & Environmental Engineering, and Reebie Associates
• Funded haphazardly by a variety of sources
Lexcie Lu, Transit Analyst, ([email protected])26 Grant St., Unit #3, Dorchester, Mass. 02125-1223
Freight Train in Harmony
All photos © 2001 Lexcie Lu unless otherwise specified
© 2003 Lexcie