Embed Size (px)
Citation preview
FRESNO COUNTY REGIONAL ACTIVE TRANSPORTATION PLAN C-1
Appendix C
RELATIONSHIP TO STATE AND FEDERAL PLANS AND POLICIES
Th e ATP was developed with consideration of the following plans, policies, and other documents
CALIFORNIA STATE BICYCLE AND PEDESTRIAN PLAN
In June 2017, Caltrans fi nalized Toward an Active California, the State Bicycle and Pedestrian Plan. Th e plan sets targets to greatly increase walking and bicycling in California and identifi es objectives and strategies to achieve these targets.
CALIFORNIA GREEN BUILDING CODE
Th e 2013 California Green Building Standards contain specifi c requirements for the amount and type of both short-term and long-term bicycle parking.
CALIFORNIA ASSEMBLY BILL 32 & SENATE BILL 375
Senate Bill (SB) 375 is the implementation legislation for Assembly Bill (AB) 32. AB 32 requires the reduction of greenhouse gases (GHG) by 28 percent by the year 2020 and by 50 percent by the year 2050. Greenhouse gases are emissions - carbon dioxide chief among them – that accumulate in the atmosphere and trap solar energy in a way that can aff ect global climate patterns. Th e largest sources of these emissions related to human activity are combustion-powered machinery, internal combustion vehicle engines, and equipment used to generate power and heat. SB 375 tasks metropolitan and regional transportation planning agencies with achieving GHG reductions through their Regional Metropolitan Transportation Plans. Th e reduction of the use of the automobiles for trip making is
one method for reducing GHG emissions. Th is outcome can be achieved by use of modes other than the automobile such as walking, bicycling, or using transit.
CALIFORNIA ASSEMBLY BILL 1358
Assembly Bill 1358 is the Complete Streets Act. It calls for the inclusion of all modes (pedestrian, bicycle, transit, and automobile) into the design of roadways. AB 1358 stipulates that roadways should be accessible by all users.
CALIFORNIA SENATE BILL 743
Senate Bill 743 changes how transportation impact analysis is performed as part of compliance with the California Environmental Quality Act (CEQA). Th e new criteria, under development by the Governor’s Offi ce of Planning and Research, will promote the development of multimodal transportation networks.
US DOT POLICY STATEMENT ON BICYCLE AND PEDESTRIAN ACCOMMODATION REGULATIONS AND RECOMMENDATIONS
In 2010, the United States Department of Transportation (US DOT) issued a policy directive in support of walking and bicycling, encouraging transportation agencies to go beyond minimum standards in fully integrating active transportation into projects. As part of the statement, the US DOT encouraged agencies to adopt similar policy statements in support of walking and bicycling considerations such as:

FRESNO COUNTY REGIONAL ACTIVE TRANSPORTATION PLANC-2
• Considering walking and bicycling equal with other transportation modes
• Ensuring availability of transportation choices for people of all ages and abilities
• Going beyond minimum design standards
• Integrating bicycling and pedestrian accommodations on new, rehabilitated, and limited access bridges
• Collecting data on walking and bicycling trips
• Setting mode share for walking and bicycling and tracking them over time
• Removing snow from sidewalks and shared use paths
• Improving non-motorized facilities during maintenance projects
US AMERICANS WITH DISABILITIES ACT
Th e Americans with Disabilities Act Title III is legislation enacted in 1990 that provides thorough civil liberties protections to individuals with disabilities concerning employment, state and local government services, and access to public accommodations, transportation, and telecommunications. Title III of the Act requires places of public accommodation to be accessible and usable to all people, including those with disabilities. While the letter of the law applies to “public accommodations,” the spirit of the law applies not only to public agencies but also to all facilities serving the public, whether publicly or privately funded.
TITLE VI OF THE CIVIL RIGHTS ACT OF 1964
Title VI prohibits discrimination on the basis of race, color, and national origin in programs and activities receiving federal fi nancial assistance.
CALIFORNIA GOVERNMENT CODE SECTION 11135
Section 11135 provides protection from discrimination from any program or activity that is conducted, funded directly by, or receives any fi nancial assistance from the State.
EXECUTIVE ORDER 12898, “FEDERAL ACTIONS TO ADDRESS ENVIRONMENTAL JUSTICE IN MINORITY POPULATIONS AND LOW-INCOME POPULATIONS” (CLINTON 1994)
Executive Order 12898 directs federal agencies to identify and address the disproportionately high and adverse human health or environmental eff ects of their actions on minority and low-income populations, directs each agency to develop a strategy for implementing environmental justice, and promotes nondiscrimination in federal programs that aff ect human health and the environment.
U.S. DEPARTMENT OF TRANSPORTATION, UPDATED ENVIRONMENTAL JUSTICE ORDER 5610.2(A) (AMENDED 5/2/2012)
Order 5610.2(a)sets forth the U.S. DOT policy to consider environmental justice principles in all (U.S. DOT) programs, policies, and activities.
FEDERAL HIGHWAY ADMINISTRATION, ACTIONS TO ADDRESS ENVIRONMENTAL JUSTICE IN MINORITY POPULATIONS AND LOW-INCOME POPULATIONS, ORDER 6640.23A (6/14/2012)
Order 6640.23A establishes policies and procedures for the Federal Highway Administration (FHWA) to use in complying with Executive Order 12898.
FRESNO COUNTY REGIONAL ACTIVE TRANSPORTATION PLAN D-1
Appendix D
PROJECT PRIORITIES AND COST ESTIMATES
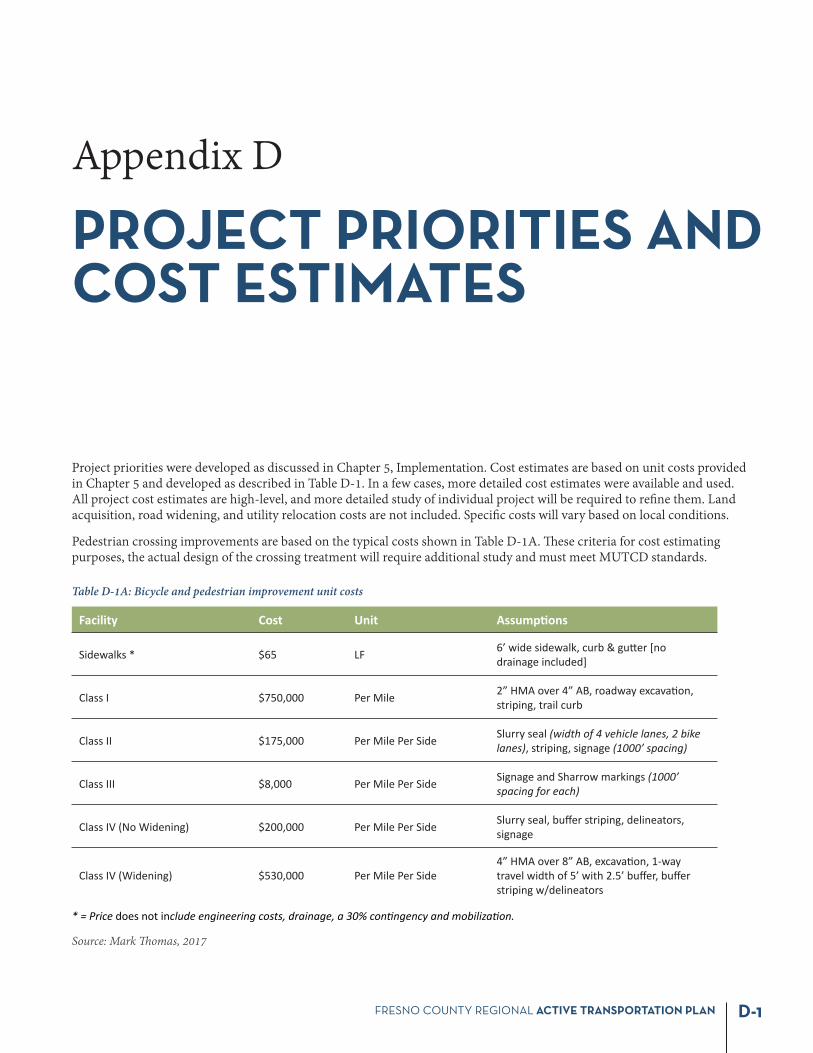
Project priorities were developed as discussed in Chapter 5, Implementation. Cost estimates are based on unit costs provided in Chapter 5 and developed as described in Table D-1. In a few cases, more detailed cost estimates were available and used. All project cost estimates are high-level, and more detailed study of individual project will be required to refi ne them. Land acquisition, road widening, and utility relocation costs are not included. Specifi c costs will vary based on local conditions.
Pedestrian crossing improvements are based on the typical costs shown in Table D-1A. Th ese criteria for cost estimating purposes, the actual design of the crossing treatment will require additional study and must meet MUTCD standards.
Table D-1A: Bicycle and pedestrian improvement unit costs
Facility Cost Unit Assump ons
Sidewalks * $65 LF 6’ wide sidewalk, curb & gu er [no drainage included]
Class I $750,000 Per Mile 2” HMA over 4” AB, roadway excava on, striping, trail curb
Class II $175,000 Per Mile Per Side Slurry seal (width of 4 vehicle lanes, 2 bike lanes), striping, signage (1000’ spacing)
Class III $8,000 Per Mile Per Side Signage and Sharrow markings (1000’ spacing for each)
Class IV (No Widening) $200,000 Per Mile Per Side Slurry seal, buff er striping, delineators, signage
Class IV (Widening) $530,000 Per Mile Per Side4” HMA over 8” AB, excava on, 1-way travel width of 5’ with 2.5’ buff er, buff er striping w/delineators
* = Price does not include engineering costs, drainage, a 30% con ngency and mobiliza on.
Source: Mark Th omas, 2017
FRESNO COUNTY REGIONAL ACTIVE TRANSPORTATION PLAND-2
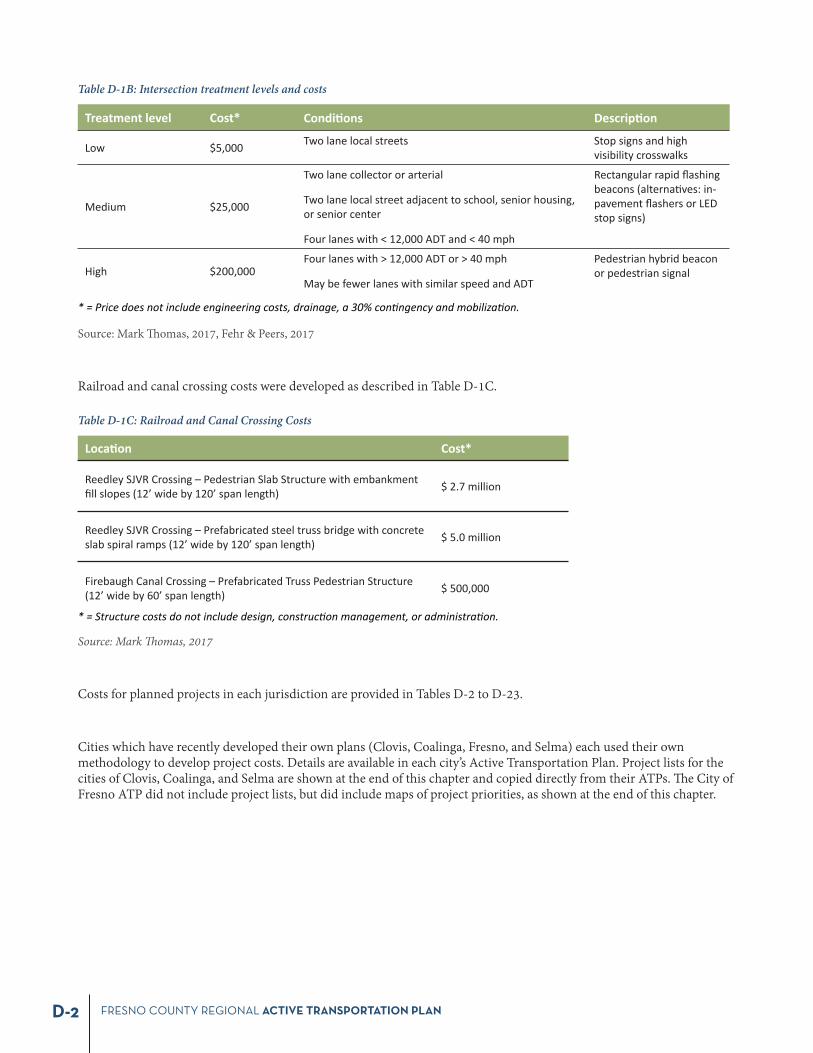
Table D-1B: Intersection treatment levels and costs
Treatment level Cost* Condi ons Descrip on
Low $5,000 Two lane local streets Stop signs and high visibility crosswalks
Medium $25,000
Two lane collector or arterial
Two lane local street adjacent to school, senior housing, or senior center
Four lanes with < 12,000 ADT and < 40 mph
Rectangular rapid fl ashing beacons (alterna ves: in-pavement fl ashers or LED stop signs)
High $200,000Four lanes with > 12,000 ADT or > 40 mph
May be fewer lanes with similar speed and ADT
Pedestrian hybrid beacon or pedestrian signal
* = Price does not include engineering costs, drainage, a 30% con ngency and mobiliza on.
Source: Mark Th omas, 2017, Fehr & Peers, 2017
Railroad and canal crossing costs were developed as described in Table D-1C.
Table D-1C: Railroad and Canal Crossing Costs
Loca on Cost*
Reedley SJVR Crossing – Pedestrian Slab Structure with embankment fi ll slopes (12’ wide by 120’ span length) $ 2.7 million
Reedley SJVR Crossing – Prefabricated steel truss bridge with concrete slab spiral ramps (12’ wide by 120’ span length) $ 5.0 million
Firebaugh Canal Crossing – Prefabricated Truss Pedestrian Structure (12’ wide by 60’ span length) $ 500,000
* = Structure costs do not include design, construc on management, or administra on.
Source: Mark Th omas, 2017
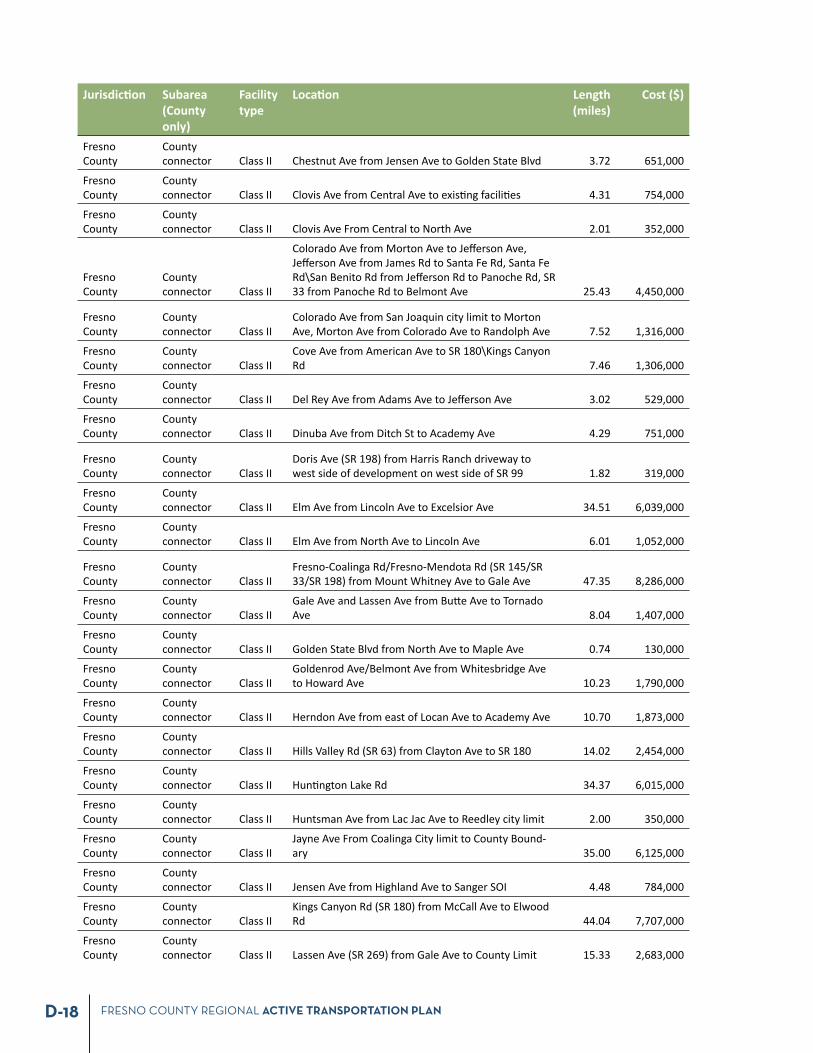
Costs for planned projects in ea ch jurisdiction are provided in Tables D-2 to D-23.
Cities which have recently developed their own plans (Clovis, Coalinga, Fresno, and Selma) each used their own methodology to develop project costs. Details are available in each city’s Active Transportation Plan. Project lists for the cities of Clovis, Coalinga, and Selma are shown at the end of this chapter and copied directly from their ATPs. Th e City of Fresno ATP did not include project lists, but did include maps of project priorities, as shown at the end of this chapter.
FRESNO COUNTY REGIONAL ACTIVE TRANSPORTATION PLAN D-3
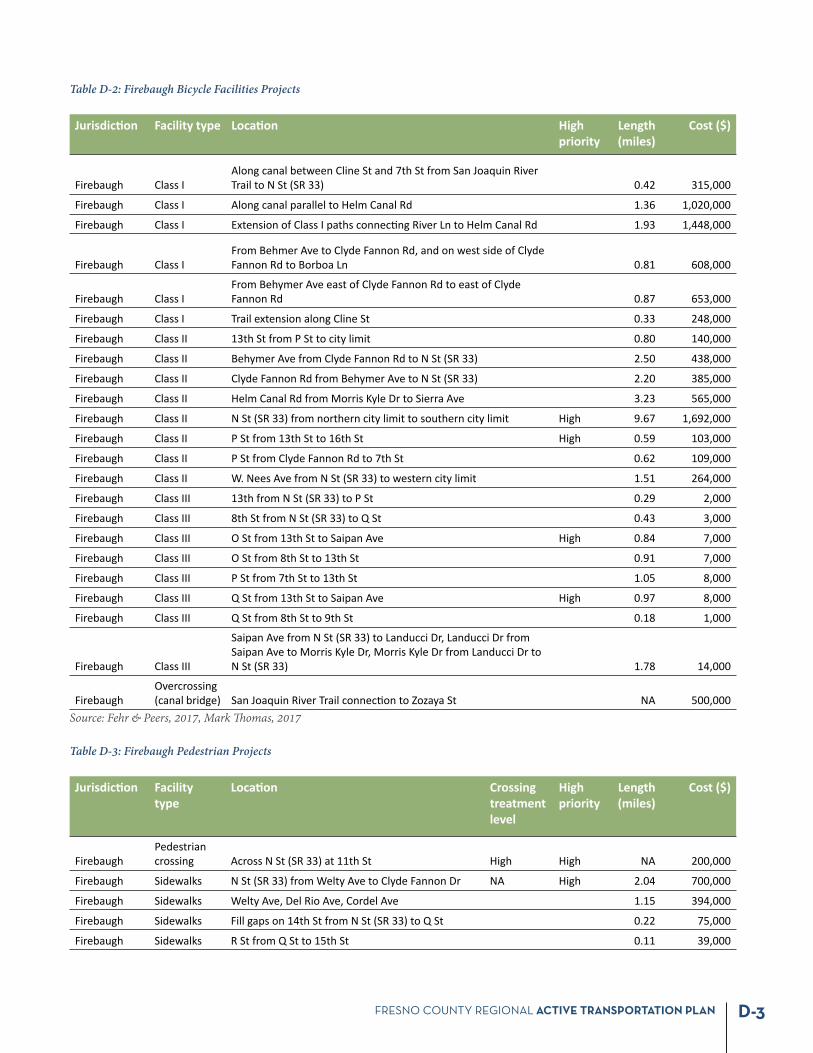
Table D-2: Firebaugh Bicycle Facilities Projects
Jurisdic on Facility type Loca on High priority
Length (miles)
Cost ($)
Firebaugh Class IAlong canal between Cline St and 7th St from San Joaquin River Trail to N St (SR 33) 0.42 315,000
Firebaugh Class I Along canal parallel to Helm Canal Rd 1.36 1,020,000
Firebaugh Class I Extension of Class I paths connec ng River Ln to Helm Canal Rd 1.93 1,448,000
Firebaugh Class IFrom Behmer Ave to Clyde Fannon Rd, and on west side of Clyde Fannon Rd to Borboa Ln 0.81 608,000
Firebaugh Class IFrom Behymer Ave east of Clyde Fannon Rd to east of Clyde Fannon Rd 0.87 653,000
Firebaugh Class I Trail extension along Cline St 0.33 248,000
Firebaugh Class II 13th St from P St to city limit 0.80 140,000
Firebaugh Class II Behymer Ave from Clyde Fannon Rd to N St (SR 33) 2.50 438,000
Firebaugh Class II Clyde Fannon Rd from Behymer Ave to N St (SR 33) 2.20 385,000
Firebaugh Class II Helm Canal Rd from Morris Kyle Dr to Sierra Ave 3.23 565,000
Firebaugh Class II N St (SR 33) from northern city limit to southern city limit High 9.67 1,692,000
Firebaugh Class II P St from 13th St to 16th St High 0.59 103,000
Firebaugh Class II P St from Clyde Fannon Rd to 7th St 0.62 109,000
Firebaugh Class II W. Nees Ave from N St (SR 33) to western city limit 1.51 264,000
Firebaugh Class III 13th from N St (SR 33) to P St 0.29 2,000
Firebaugh Class III 8th St from N St (SR 33) to Q St 0.43 3,000
Firebaugh Class III O St from 13th St to Saipan Ave High 0.84 7,000
Firebaugh Class III O St from 8th St to 13th St 0.91 7,000
Firebaugh Class III P St from 7th St to 13th St 1.05 8,000
Firebaugh Class III Q St from 13th St to Saipan Ave High 0.97 8,000
Firebaugh Class III Q St from 8th St to 9th St 0.18 1,000
Firebaugh Class III
Saipan Ave from N St (SR 33) to Landucci Dr, Landucci Dr from Saipan Ave to Morris Kyle Dr, Morris Kyle Dr from Landucci Dr to N St (SR 33) 1.78 14,000
FirebaughOvercrossing (canal bridge) San Joaquin River Trail connec on to Zozaya St NA 500,000
Source: Fehr & Peers, 2017, Mark Th omas, 2017
Table D-3: Firebaugh Pedestrian Projects
Jurisdic on Facility type
Loca on Crossing treatment level
High priority
Length (miles)
Cost ($)
FirebaughPedestrian crossing Across N St (SR 33) at 11th St High High NA 200,000
Firebaugh Sidewalks N St (SR 33) from Welty Ave to Clyde Fannon Dr NA High 2.04 700,000
Firebaugh Sidewalks Welty Ave, Del Rio Ave, Cordel Ave 1.15 394,000
Firebaugh Sidewalks Fill gaps on 14th St from N St (SR 33) to Q St 0.22 75,000
Firebaugh Sidewalks R St from Q St to 15th St 0.11 39,000
FRESNO COUNTY REGIONAL ACTIVE TRANSPORTATION PLAND-4
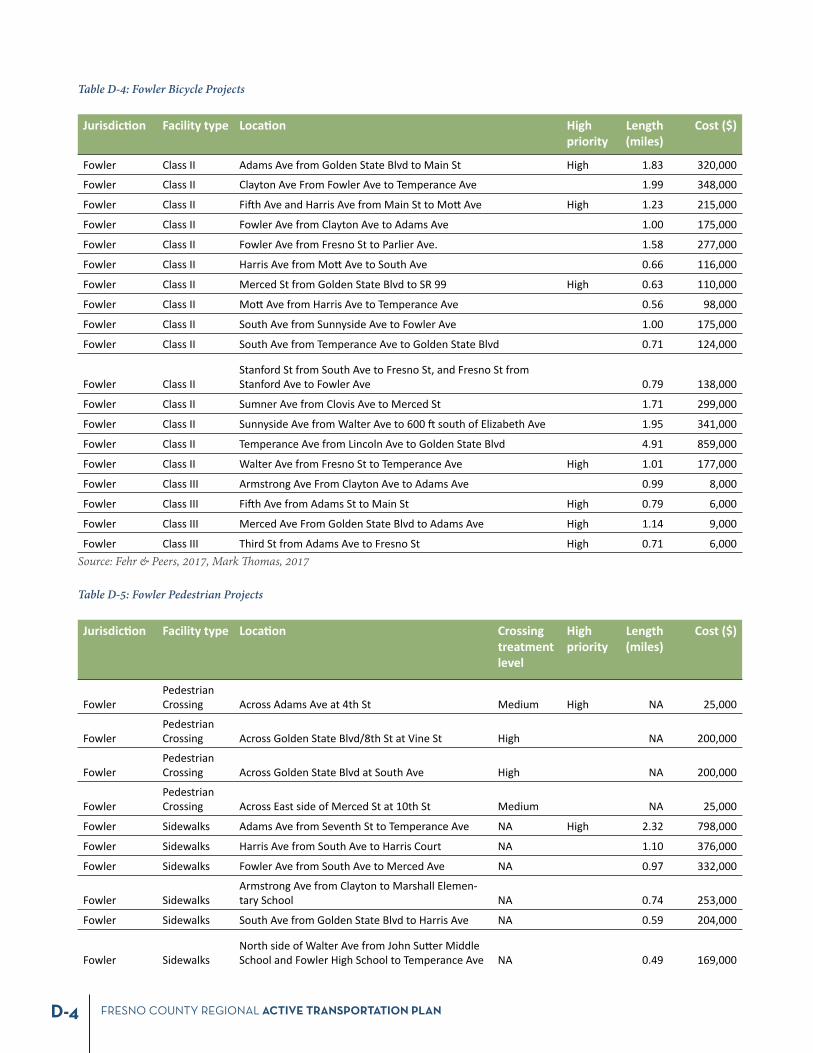
Table D-4: Fowler Bicycle Projects
Jurisdic on Facility type Loca on High priority
Length (miles)
Cost ($)
Fowler Class II Adams Ave from Golden State Blvd to Main St High 1.83 320,000
Fowler Class II Clayton Ave From Fowler Ave to Temperance Ave 1.99 348,000
Fowler Class II Fi h Ave and Harris Ave from Main St to Mo Ave High 1.23 215,000
Fowler Class II Fowler Ave from Clayton Ave to Adams Ave 1.00 175,000
Fowler Class II Fowler Ave from Fresno St to Parlier Ave. 1.58 277,000
Fowler Class II Harris Ave from Mo Ave to South Ave 0.66 116,000
Fowler Class II Merced St from Golden State Blvd to SR 99 High 0.63 110,000
Fowler Class II Mo Ave from Harris Ave to Temperance Ave 0.56 98,000
Fowler Class II South Ave from Sunnyside Ave to Fowler Ave 1.00 175,000
Fowler Class II South Ave from Temperance Ave to Golden State Blvd 0.71 124,000
Fowler Class IIStanford St from South Ave to Fresno St, and Fresno St from Stanford Ave to Fowler Ave 0.79 138,000
Fowler Class II Sumner Ave from Clovis Ave to Merced St 1.71 299,000
Fowler Class II Sunnyside Ave from Walter Ave to 600 south of Elizabeth Ave 1.95 341,000
Fowler Class II Temperance Ave from Lincoln Ave to Golden State Blvd 4.91 859,000
Fowler Class II Walter Ave from Fresno St to Temperance Ave High 1.01 177,000
Fowler Class III Armstrong Ave From Clayton Ave to Adams Ave 0.99 8,000
Fowler Class III Fi h Ave from Adams St to Main St High 0.79 6,000
Fowler Class III Merced Ave From Golden State Blvd to Adams Ave High 1.14 9,000
Fowler Class III Third St from Adams Ave to Fresno St High 0.71 6,000 Source: Fehr & Peers, 2017, Mark Th omas, 2017
Table D-5: Fowler Pedestrian Projects
Jurisdic on Facility type Loca on Crossing treatment level
High priority
Length (miles)
Cost ($)
FowlerPedestrian Crossing Across Adams Ave at 4th St Medium High NA 25,000
FowlerPedestrian Crossing Across Golden State Blvd/8th St at Vine St High NA 200,000
FowlerPedestrian Crossing Across Golden State Blvd at South Ave High NA 200,000
FowlerPedestrian Crossing Across East side of Merced St at 10th St Medium NA 25,000
Fowler Sidewalks Adams Ave from Seventh St to Temperance Ave NA High 2.32 798,000
Fowler Sidewalks Harris Ave from South Ave to Harris Court NA 1.10 376,000
Fowler Sidewalks Fowler Ave from South Ave to Merced Ave NA 0.97 332,000
Fowler SidewalksArmstrong Ave from Clayton to Marshall Elemen-tary School NA 0.74 253,000
Fowler Sidewalks South Ave from Golden State Blvd to Harris Ave NA 0.59 204,000
Fowler SidewalksNorth side of Walter Ave from John Su er Middle School and Fowler High School to Temperance Ave NA 0.49 169,000
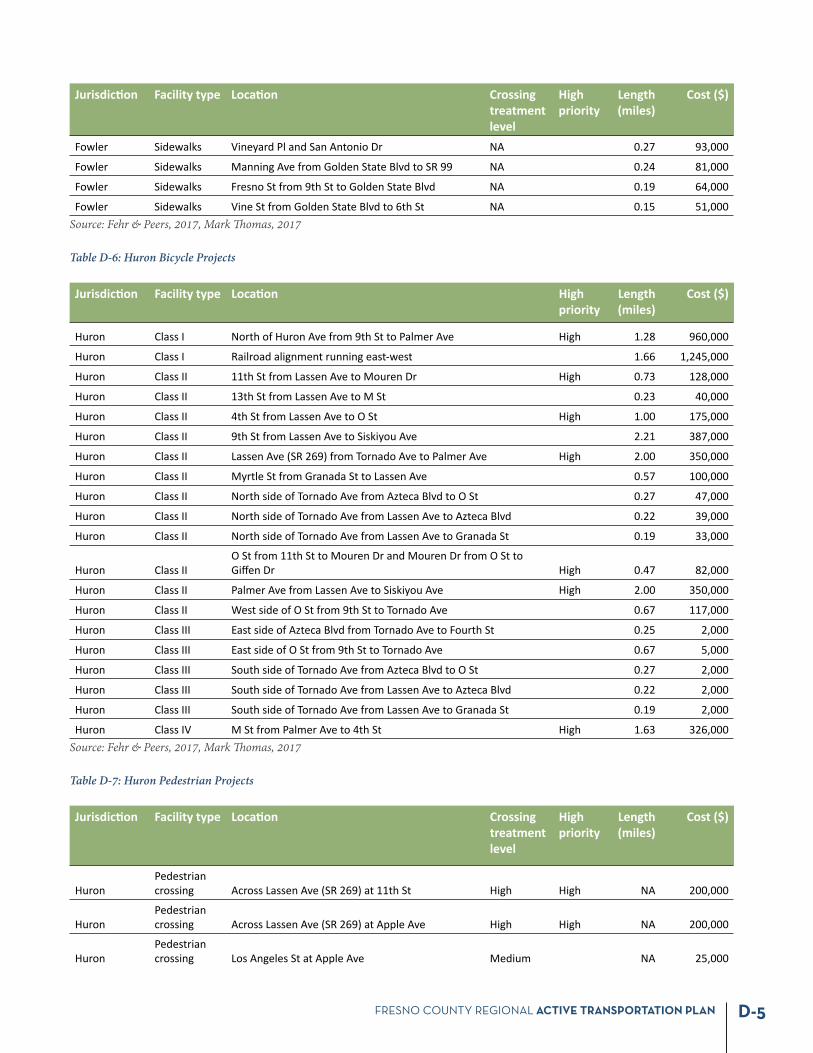
FRESNO COUNTY REGIONAL ACTIVE TRANSPORTATION PLAN D-5
Jurisdic on Facility type Loca on Crossing treatment level
High priority
Length (miles)
Cost ($)
Fowler Sidewalks Vineyard Pl and San Antonio Dr NA 0.27 93,000
Fowler Sidewalks Manning Ave from Golden State Blvd to SR 99 NA 0.24 81,000
Fowler Sidewalks Fresno St from 9th St to Golden State Blvd NA 0.19 64,000
Fowler Sidewalks Vine St from Golden State Blvd to 6th St NA 0.15 51,000 Source: Fehr & Peers, 2017, Mark Th omas, 2017
Table D-6: Huron Bicycle Projects
Jurisdic on Facility type Loca on High priority
Length (miles)
Cost ($)
Huron Class I North of Huron Ave from 9th St to Palmer Ave High 1.28 960,000
Huron Class I Railroad alignment running east-west 1.66 1,245,000
Huron Class II 11th St from Lassen Ave to Mouren Dr High 0.73 128,000
Huron Class II 13th St from Lassen Ave to M St 0.23 40,000
Huron Class II 4th St from Lassen Ave to O St High 1.00 175,000
Huron Class II 9th St from Lassen Ave to Siskiyou Ave 2.21 387,000
Huron Class II Lassen Ave (SR 269) from Tornado Ave to Palmer Ave High 2.00 350,000
Huron Class II Myrtle St from Granada St to Lassen Ave 0.57 100,000
Huron Class II North side of Tornado Ave from Azteca Blvd to O St 0.27 47,000
Huron Class II North side of Tornado Ave from Lassen Ave to Azteca Blvd 0.22 39,000
Huron Class II North side of Tornado Ave from Lassen Ave to Granada St 0.19 33,000
Huron Class IIO St from 11th St to Mouren Dr and Mouren Dr from O St to Giff en Dr High 0.47 82,000
Huron Class II Palmer Ave from Lassen Ave to Siskiyou Ave High 2.00 350,000
Huron Class II West side of O St from 9th St to Tornado Ave 0.67 117,000
Huron Class III East side of Azteca Blvd from Tornado Ave to Fourth St 0.25 2,000
Huron Class III East side of O St from 9th St to Tornado Ave 0.67 5,000
Huron Class III South side of Tornado Ave from Azteca Blvd to O St 0.27 2,000
Huron Class III South side of Tornado Ave from Lassen Ave to Azteca Blvd 0.22 2,000
Huron Class III South side of Tornado Ave from Lassen Ave to Granada St 0.19 2,000
Huron Class IV M St from Palmer Ave to 4th St High 1.63 326,000 Source: Fehr & Peers, 2017, Mark Th omas, 2017
Table D-7: Huron Pedestrian Projects
Jurisdic on Facility type Loca on Crossing treatment level
High priority
Length (miles)
Cost ($)
HuronPedestrian crossing Across Lassen Ave (SR 269) at 11th St High High NA
200,000
HuronPedestrian crossing Across Lassen Ave (SR 269) at Apple Ave High High NA
200,000
HuronPedestrian crossing Los Angeles St at Apple Ave Medium NA
25,000
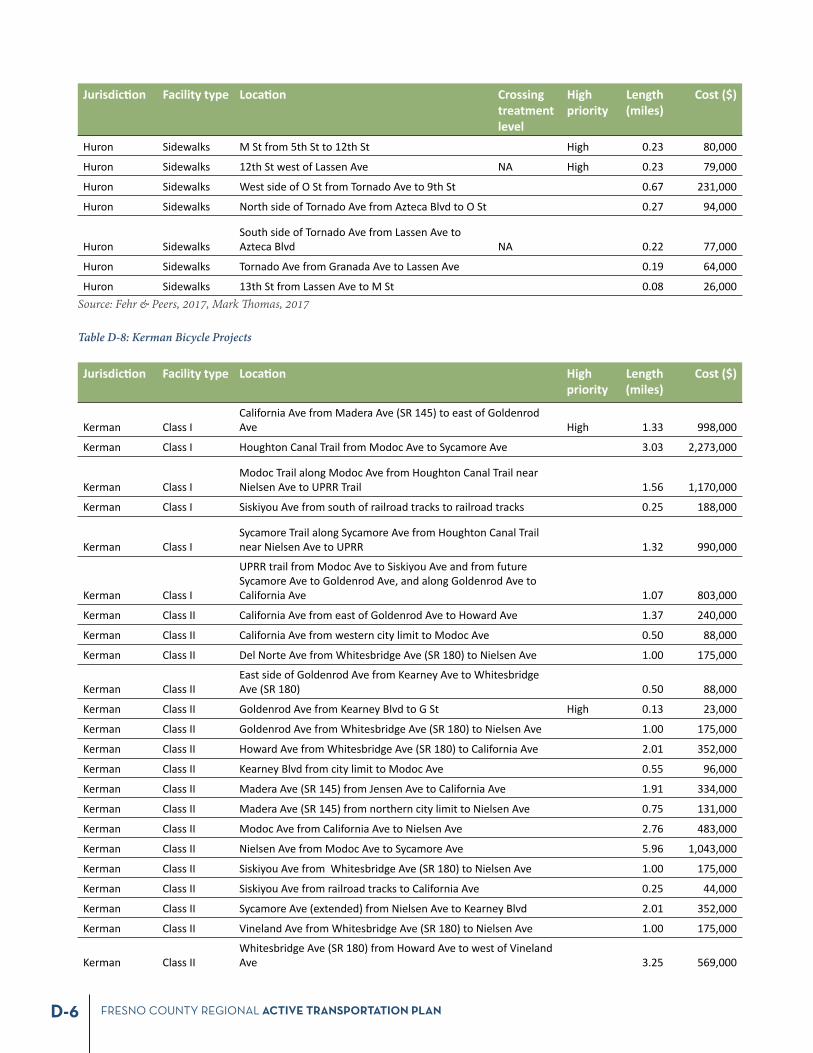
FRESNO COUNTY REGIONAL ACTIVE TRANSPORTATION PLAND-6
Jurisdic on Facility type Loca on Crossing treatment level
High priority
Length (miles)
Cost ($)
Huron Sidewalks M St from 5th St to 12th St High 0.23 80,000
Huron Sidewalks 12th St west of Lassen Ave NA High 0.23 79,000
Huron Sidewalks West side of O St from Tornado Ave to 9th St 0.67 231,000
Huron Sidewalks North side of Tornado Ave from Azteca Blvd to O St 0.27 94,000
Huron SidewalksSouth side of Tornado Ave from Lassen Ave to Azteca Blvd NA 0.22 77,000
Huron Sidewalks Tornado Ave from Granada Ave to Lassen Ave 0.19 64,000
Huron Sidewalks 13th St from Lassen Ave to M St 0.08 26,000 Source: Fehr & Peers, 2017, Mark Th omas, 2017
Table D-8: Kerman Bicycle Projects
Jurisdic on Facility type Loca on High priority
Length (miles)
Cost ($)
Kerman Class ICalifornia Ave from Madera Ave (SR 145) to east of Goldenrod Ave High 1.33 998,000
Kerman Class I Houghton Canal Trail from Modoc Ave to Sycamore Ave 3.03 2,273,000
Kerman Class IModoc Trail along Modoc Ave from Houghton Canal Trail near Nielsen Ave to UPRR Trail 1.56 1,170,000
Kerman Class I Siskiyou Ave from south of railroad tracks to railroad tracks 0.25 188,000
Kerman Class ISycamore Trail along Sycamore Ave from Houghton Canal Trail near Nielsen Ave to UPRR 1.32 990,000
Kerman Class I
UPRR trail from Modoc Ave to Siskiyou Ave and from future Sycamore Ave to Goldenrod Ave, and along Goldenrod Ave to California Ave 1.07 803,000
Kerman Class II California Ave from east of Goldenrod Ave to Howard Ave 1.37 240,000
Kerman Class II California Ave from western city limit to Modoc Ave 0.50 88,000
Kerman Class II Del Norte Ave from Whitesbridge Ave (SR 180) to Nielsen Ave 1.00 175,000
Kerman Class IIEast side of Goldenrod Ave from Kearney Ave to Whitesbridge Ave (SR 180) 0.50 88,000
Kerman Class II Goldenrod Ave from Kearney Blvd to G St High 0.13 23,000
Kerman Class II Goldenrod Ave from Whitesbridge Ave (SR 180) to Nielsen Ave 1.00 175,000
Kerman Class II Howard Ave from Whitesbridge Ave (SR 180) to California Ave 2.01 352,000
Kerman Class II Kearney Blvd from city limit to Modoc Ave 0.55 96,000
Kerman Class II Madera Ave (SR 145) from Jensen Ave to California Ave 1.91 334,000
Kerman Class II Madera Ave (SR 145) from northern city limit to Nielsen Ave 0.75 131,000
Kerman Class II Modoc Ave from California Ave to Nielsen Ave 2.76 483,000
Kerman Class II Nielsen Ave from Modoc Ave to Sycamore Ave 5.96 1,043,000
Kerman Class II Siskiyou Ave from Whitesbridge Ave (SR 180) to Nielsen Ave 1.00 175,000
Kerman Class II Siskiyou Ave from railroad tracks to California Ave 0.25 44,000
Kerman Class II Sycamore Ave (extended) from Nielsen Ave to Kearney Blvd 2.01 352,000
Kerman Class II Vineland Ave from Whitesbridge Ave (SR 180) to Nielsen Ave 1.00 175,000
Kerman Class IIWhitesbridge Ave (SR 180) from Howard Ave to west of Vineland Ave 3.25 569,000
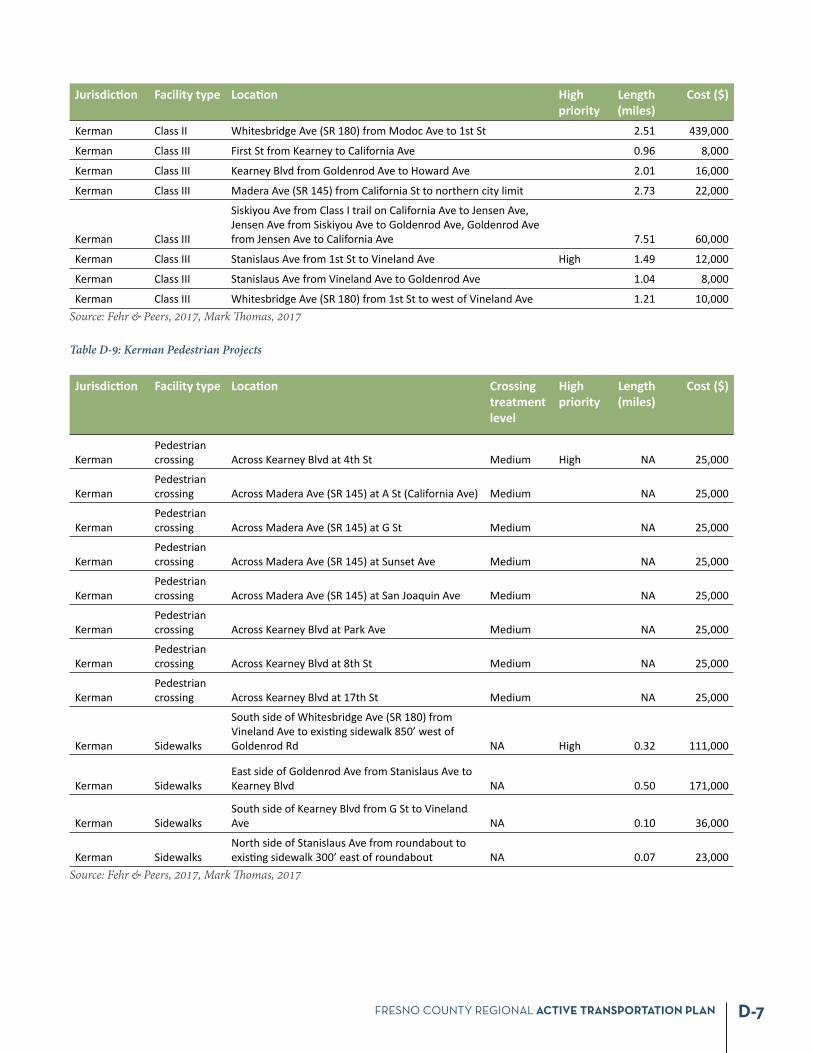
FRESNO COUNTY REGIONAL ACTIVE TRANSPORTATION PLAN D-7
Jurisdic on Facility type Loca on High priority
Length (miles)
Cost ($)
Kerman Class II Whitesbridge Ave (SR 180) from Modoc Ave to 1st St 2.51 439,000
Kerman Class III First St from Kearney to California Ave 0.96 8,000
Kerman Class III Kearney Blvd from Goldenrod Ave to Howard Ave 2.01 16,000
Kerman Class III Madera Ave (SR 145) from California St to northern city limit 2.73 22,000
Kerman Class III
Siskiyou Ave from Class I trail on California Ave to Jensen Ave, Jensen Ave from Siskiyou Ave to Goldenrod Ave, Goldenrod Ave from Jensen Ave to California Ave 7.51 60,000
Kerman Class III Stanislaus Ave from 1st St to Vineland Ave High 1.49 12,000
Kerman Class III Stanislaus Ave from Vineland Ave to Goldenrod Ave 1.04 8,000
Kerman Class III Whitesbridge Ave (SR 180) from 1st St to west of Vineland Ave 1.21 10,000 Source: Fehr & Peers, 2017, Mark Th omas, 2017
Table D-9: Kerman Pedestrian Projects
Jurisdic on Facility type Loca on Crossing treatment level
High priority
Length (miles)
Cost ($)
KermanPedestrian crossing Across Kearney Blvd at 4th St Medium High NA 25,000
KermanPedestrian crossing Across Madera Ave (SR 145) at A St (California Ave) Medium NA 25,000
KermanPedestrian crossing Across Madera Ave (SR 145) at G St Medium NA
25,000
KermanPedestrian crossing Across Madera Ave (SR 145) at Sunset Ave Medium NA
25,000
KermanPedestrian crossing Across Madera Ave (SR 145) at San Joaquin Ave Medium NA
25,000
KermanPedestrian crossing Across Kearney Blvd at Park Ave Medium NA
25,000
KermanPedestrian crossing Across Kearney Blvd at 8th St Medium NA
25,000
KermanPedestrian crossing Across Kearney Blvd at 17th St Medium NA
25,000
Kerman Sidewalks
South side of Whitesbridge Ave (SR 180) from Vineland Ave to exis ng sidewalk 850’ west of Goldenrod Rd NA High 0.32 111,000
Kerman SidewalksEast side of Goldenrod Ave from Stanislaus Ave to Kearney Blvd NA 0.50 171,000
Kerman SidewalksSouth side of Kearney Blvd from G St to Vineland Ave NA 0.10 36,000
Kerman SidewalksNorth side of Stanislaus Ave from roundabout to exis ng sidewalk 300’ east of roundabout NA 0.07 23,000
Source: Fehr & Peers, 2017, Mark Th omas, 2017
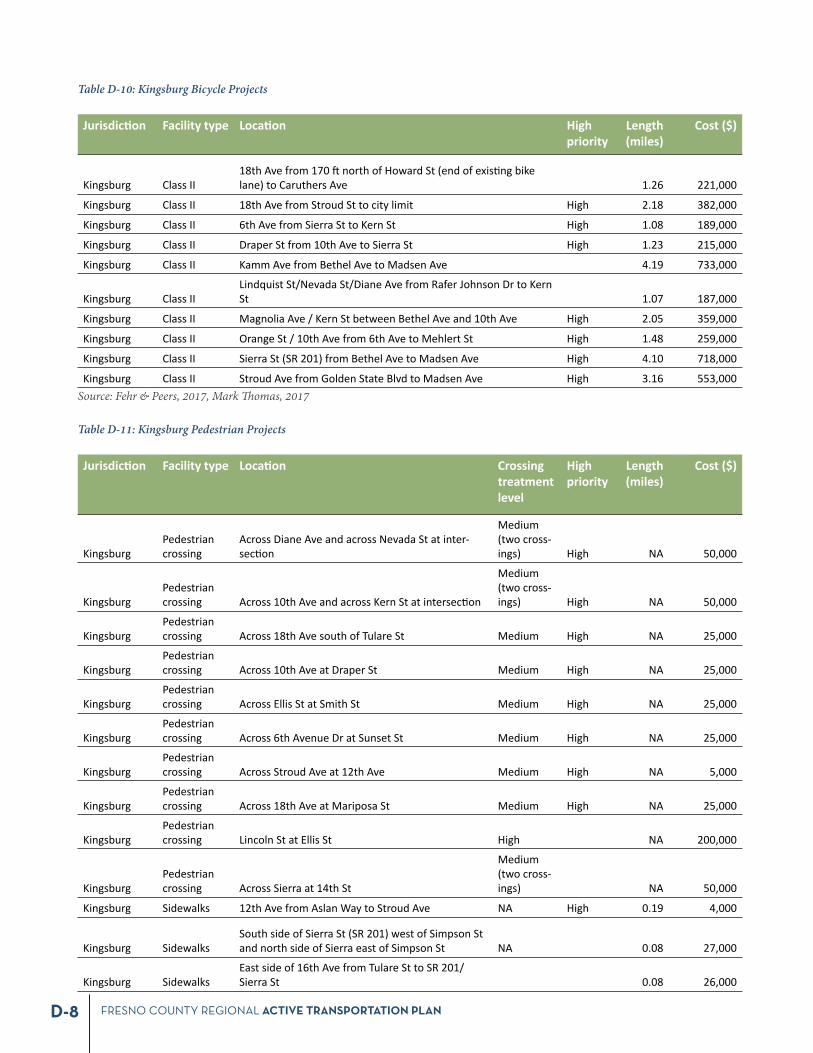
FRESNO COUNTY REGIONAL ACTIVE TRANSPORTATION PLAND-8
Table D-10: Kingsburg Bicycle Projects
Jurisdic on Facility type Loca on High priority
Length (miles)
Cost ($)
Kingsburg Class II18th Ave from 170 north of Howard St (end of exis ng bike lane) to Caruthers Ave 1.26
221,000
Kingsburg Class II 18th Ave from Stroud St to city limit High 2.18 382,000
Kingsburg Class II 6th Ave from Sierra St to Kern St High 1.08 189,000
Kingsburg Class II Draper St from 10th Ave to Sierra St High 1.23 215,000
Kingsburg Class II Kamm Ave from Bethel Ave to Madsen Ave 4.19 733,000
Kingsburg Class IILindquist St/Nevada St/Diane Ave from Rafer Johnson Dr to Kern St 1.07 187,000
Kingsburg Class II Magnolia Ave / Kern St between Bethel Ave and 10th Ave High 2.05 359,000
Kingsburg Class II Orange St / 10th Ave from 6th Ave to Mehlert St High 1.48 259,000
Kingsburg Class II Sierra St (SR 201) from Bethel Ave to Madsen Ave High 4.10 718,000
Kingsburg Class II Stroud Ave from Golden State Blvd to Madsen Ave High 3.16 553,000 Source: Fehr & Peers, 2017, Mark Th omas, 2017
Table D-11: Kingsburg Pedestrian Projects
Jurisdic on Facility type Loca on Crossing treatment level
High priority
Length (miles)
Cost ($)
KingsburgPedestrian crossing
Across Diane Ave and across Nevada St at inter-sec on
Medium (two cross-ings) High NA 50,000
KingsburgPedestrian crossing Across 10th Ave and across Kern St at intersec on
Medium (two cross-ings) High NA 50,000
KingsburgPedestrian crossing Across 18th Ave south of Tulare St Medium High NA 25,000
KingsburgPedestrian crossing Across 10th Ave at Draper St Medium High NA 25,000
KingsburgPedestrian crossing Across Ellis St at Smith St Medium High NA 25,000
KingsburgPedestrian crossing Across 6th Avenue Dr at Sunset St Medium High NA 25,000
KingsburgPedestrian crossing Across Stroud Ave at 12th Ave Medium High NA 5,000
KingsburgPedestrian crossing Across 18th Ave at Mariposa St Medium High NA
25,000
KingsburgPedestrian crossing Lincoln St at Ellis St High NA 200,000
KingsburgPedestrian crossing Across Sierra at 14th St
Medium (two cross-ings) NA 50,000
Kingsburg Sidewalks 12th Ave from Aslan Way to Stroud Ave NA High 0.19 4,000
Kingsburg SidewalksSouth side of Sierra St (SR 201) west of Simpson St and north side of Sierra east of Simpson St NA 0.08 27,000
Kingsburg SidewalksEast side of 16th Ave from Tulare St to SR 201/Sierra St 0.08 26,000
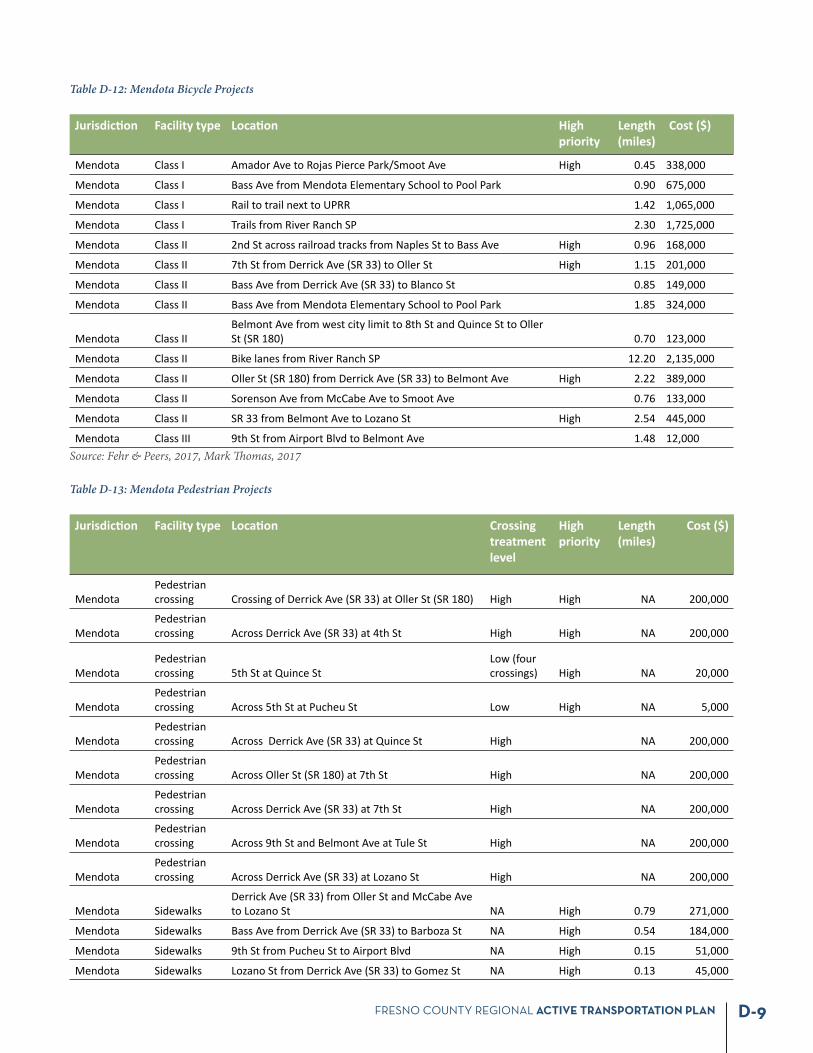
FRESNO COUNTY REGIONAL ACTIVE TRANSPORTATION PLAN D-9
Table D-12: Mendota Bicycle Projects
Jurisdic on Facility type Loca on High priority
Length (miles)
Cost ($)
Mendota Class I Amador Ave to Rojas Pierce Park/Smoot Ave High 0.45 338,000
Mendota Class I Bass Ave from Mendota Elementary School to Pool Park 0.90 675,000
Mendota Class I Rail to trail next to UPRR 1.42 1,065,000
Mendota Class I Trails from River Ranch SP 2.30 1,725,000
Mendota Class II 2nd St across railroad tracks from Naples St to Bass Ave High 0.96 168,000
Mendota Class II 7th St from Derrick Ave (SR 33) to Oller St High 1.15 201,000
Mendota Class II Bass Ave from Derrick Ave (SR 33) to Blanco St 0.85 149,000
Mendota Class II Bass Ave from Mendota Elementary School to Pool Park 1.85 324,000
Mendota Class IIBelmont Ave from west city limit to 8th St and Quince St to Oller St (SR 180) 0.70 123,000
Mendota Class II Bike lanes from River Ranch SP 12.20 2,135,000
Mendota Class II Oller St (SR 180) from Derrick Ave (SR 33) to Belmont Ave High 2.22 389,000
Mendota Class II Sorenson Ave from McCabe Ave to Smoot Ave 0.76 133,000
Mendota Class II SR 33 from Belmont Ave to Lozano St High 2.54 445,000
Mendota Class III 9th St from Airport Blvd to Belmont Ave 1.48 12,000 Source: Fehr & Peers, 2017, Mark Th omas, 2017
Table D-13: Mendota Pedestrian Projects
Jurisdic on Facility type Loca on Crossing treatment level
High priority
Length (miles)
Cost ($)
MendotaPedestrian crossing Crossing of Derrick Ave (SR 33) at Oller St (SR 180) High High NA 200,000
MendotaPedestrian crossing Across Derrick Ave (SR 33) at 4th St High High NA
200,000
MendotaPedestrian crossing 5th St at Quince St
Low (four crossings) High NA
20,000
MendotaPedestrian crossing Across 5th St at Pucheu St Low High NA
5,000
MendotaPedestrian crossing Across Derrick Ave (SR 33) at Quince St High NA
200,000
MendotaPedestrian crossing Across Oller St (SR 180) at 7th St High NA
200,000
MendotaPedestrian crossing Across Derrick Ave (SR 33) at 7th St High NA
200,000
MendotaPedestrian crossing Across 9th St and Belmont Ave at Tule St High NA
200,000
MendotaPedestrian crossing Across Derrick Ave (SR 33) at Lozano St High NA
200,000
Mendota SidewalksDerrick Ave (SR 33) from Oller St and McCabe Ave to Lozano St NA High 0.79 271,000
Mendota Sidewalks Bass Ave from Derrick Ave (SR 33) to Barboza St NA High 0.54 184,000
Mendota Sidewalks 9th St from Pucheu St to Airport Blvd NA High 0.15 51,000
Mendota Sidewalks Lozano St from Derrick Ave (SR 33) to Gomez St NA High 0.13 45,000
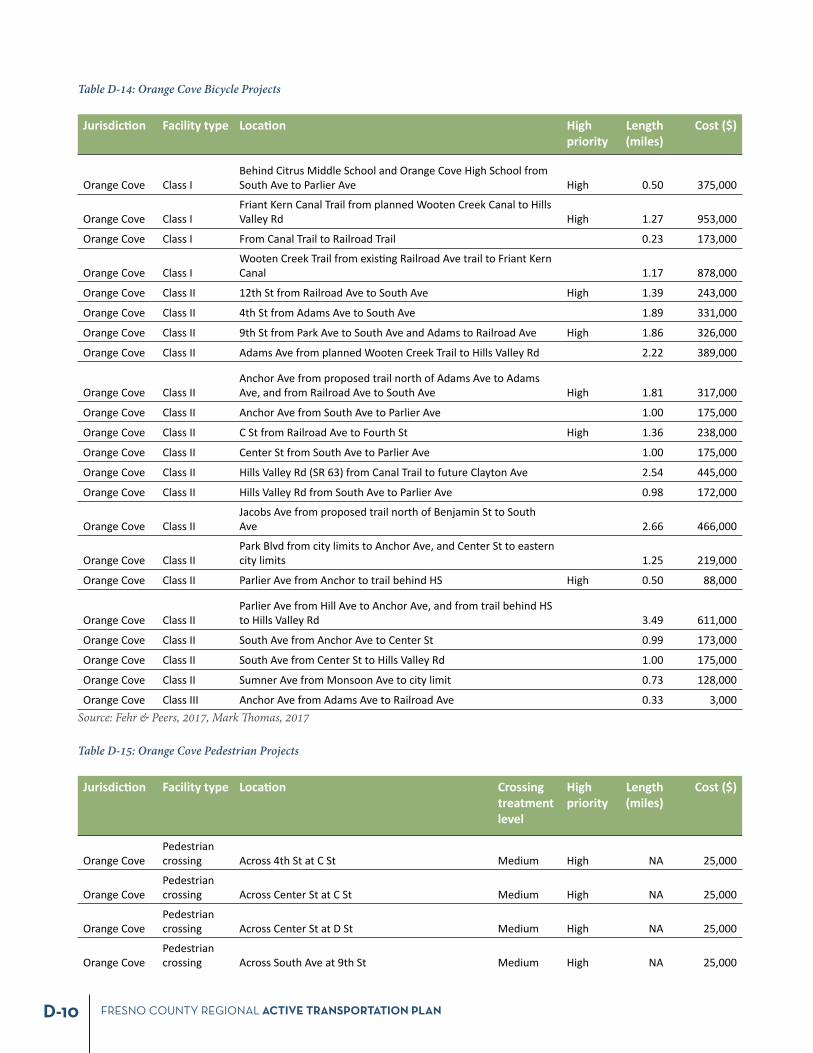
FRESNO COUNTY REGIONAL ACTIVE TRANSPORTATION PLAND-10
Table D-14: Orange Cove Bicycle Projects
Jurisdic on Facility type Loca on High priority
Length (miles)
Cost ($)
Orange Cove Class IBehind Citrus Middle School and Orange Cove High School from South Ave to Parlier Ave High 0.50
375,000
Orange Cove Class IFriant Kern Canal Trail from planned Wooten Creek Canal to Hills Valley Rd High 1.27
953,000
Orange Cove Class I From Canal Trail to Railroad Trail 0.23 173,000
Orange Cove Class IWooten Creek Trail from exis ng Railroad Ave trail to Friant Kern Canal 1.17 878,000
Orange Cove Class II 12th St from Railroad Ave to South Ave High 1.39 243,000
Orange Cove Class II 4th St from Adams Ave to South Ave 1.89 331,000
Orange Cove Class II 9th St from Park Ave to South Ave and Adams to Railroad Ave High 1.86 326,000
Orange Cove Class II Adams Ave from planned Wooten Creek Trail to Hills Valley Rd 2.22 389,000
Orange Cove Class IIAnchor Ave from proposed trail north of Adams Ave to Adams Ave, and from Railroad Ave to South Ave High 1.81 317,000
Orange Cove Class II Anchor Ave from South Ave to Parlier Ave 1.00 175,000
Orange Cove Class II C St from Railroad Ave to Fourth St High 1.36 238,000
Orange Cove Class II Center St from South Ave to Parlier Ave 1.00 175,000
Orange Cove Class II Hills Valley Rd (SR 63) from Canal Trail to future Clayton Ave 2.54 445,000
Orange Cove Class II Hills Valley Rd from South Ave to Parlier Ave 0.98 172,000
Orange Cove Class IIJacobs Ave from proposed trail north of Benjamin St to South Ave 2.66 466,000
Orange Cove Class IIPark Blvd from city limits to Anchor Ave, and Center St to eastern city limits 1.25 219,000
Orange Cove Class II Parlier Ave from Anchor to trail behind HS High 0.50 88,000
Orange Cove Class IIParlier Ave from Hill Ave to Anchor Ave, and from trail behind HS to Hills Valley Rd 3.49 611,000
Orange Cove Class II South Ave from Anchor Ave to Center St 0.99 173,000
Orange Cove Class II South Ave from Center St to Hills Valley Rd 1.00 175,000
Orange Cove Class II Sumner Ave from Monsoon Ave to city limit 0.73 128,000
Orange Cove Class III Anchor Ave from Adams Ave to Railroad Ave 0.33 3,000 Source: Fehr & Peers, 2017, Mark Th omas, 2017
Table D-15: Orange Cove Pedestrian Projects
Jurisdic on Facility type Loca on Crossing treatment level
High priority
Length (miles)
Cost ($)
Orange CovePedestrian crossing Across 4th St at C St Medium High NA 25,000
Orange CovePedestrian crossing Across Center St at C St Medium High NA
25,000
Orange CovePedestrian crossing Across Center St at D St Medium High NA
25,000
Orange CovePedestrian crossing Across South Ave at 9th St Medium High NA
25,000
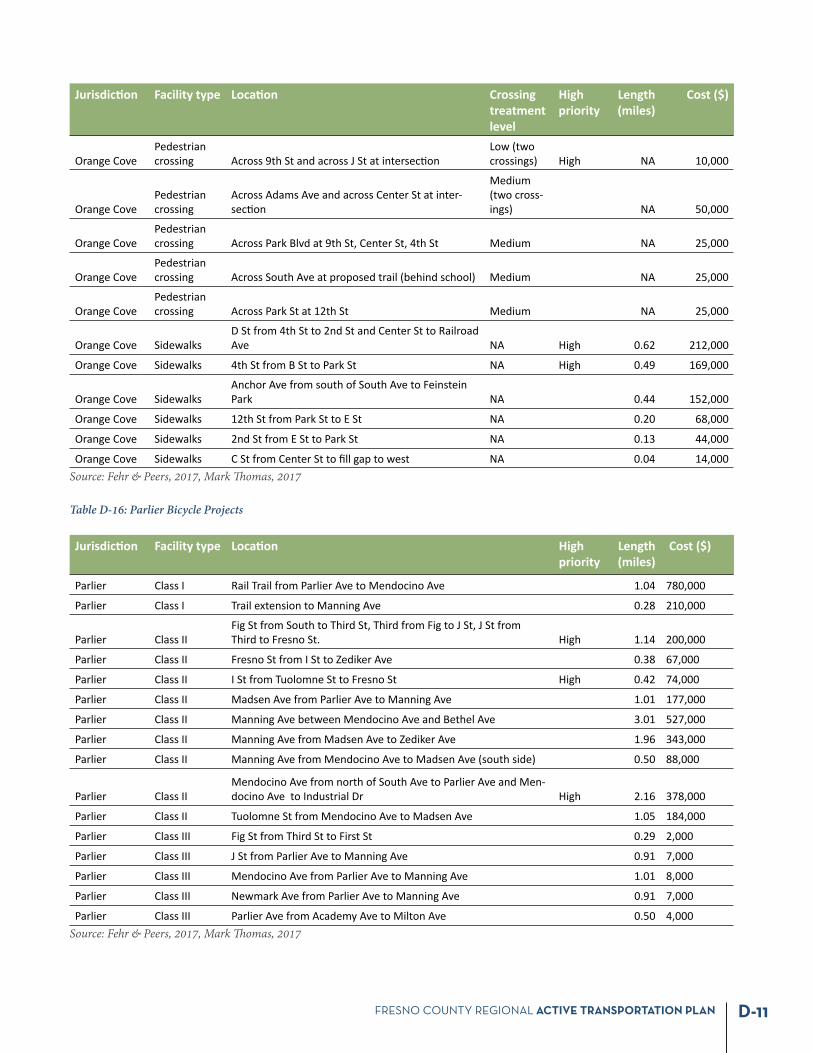
FRESNO COUNTY REGIONAL ACTIVE TRANSPORTATION PLAN D-11
Jurisdic on Facility type Loca on Crossing treatment level
High priority
Length (miles)
Cost ($)
Orange CovePedestrian crossing Across 9th St and across J St at intersec on
Low (two crossings) High NA 10,000
Orange CovePedestrian crossing
Across Adams Ave and across Center St at inter-sec on
Medium (two cross-ings) NA 50,000
Orange CovePedestrian crossing Across Park Blvd at 9th St, Center St, 4th St Medium NA 25,000
Orange CovePedestrian crossing Across South Ave at proposed trail (behind school) Medium NA 25,000
Orange CovePedestrian crossing Across Park St at 12th St Medium NA 25,000
Orange Cove SidewalksD St from 4th St to 2nd St and Center St to Railroad Ave NA High 0.62 212,000
Orange Cove Sidewalks 4th St from B St to Park St NA High 0.49 169,000
Orange Cove SidewalksAnchor Ave from south of South Ave to Feinstein Park NA 0.44 152,000
Orange Cove Sidewalks 12th St from Park St to E St NA 0.20 68,000
Orange Cove Sidewalks 2nd St from E St to Park St NA 0.13 44,000
Orange Cove Sidewalks C St from Center St to fi ll gap to west NA 0.04 14,000 Source: Fehr & Peers, 2017, Mark Th omas, 2017
Table D-16: Parlier Bicycle Projects
Jurisdic on Facility type Loca on High priority
Length (miles)
Cost ($)
Parlier Class I Rail Trail from Parlier Ave to Mendocino Ave 1.04 780,000
Parlier Class I Trail extension to Manning Ave 0.28 210,000
Parlier Class IIFig St from South to Third St, Third from Fig to J St, J St from Third to Fresno St. High 1.14 200,000
Parlier Class II Fresno St from I St to Zediker Ave 0.38 67,000
Parlier Class II I St from Tuolomne St to Fresno St High 0.42 74,000
Parlier Class II Madsen Ave from Parlier Ave to Manning Ave 1.01 177,000
Parlier Class II Manning Ave between Mendocino Ave and Bethel Ave 3.01 527,000
Parlier Class II Manning Ave from Madsen Ave to Zediker Ave 1.96 343,000
Parlier Class II Manning Ave from Mendocino Ave to Madsen Ave (south side) 0.50 88,000
Parlier Class IIMendocino Ave from north of South Ave to Parlier Ave and Men-docino Ave to Industrial Dr High 2.16 378,000
Parlier Class II Tuolomne St from Mendocino Ave to Madsen Ave 1.05 184,000
Parlier Class III Fig St from Third St to First St 0.29 2,000
Parlier Class III J St from Parlier Ave to Manning Ave 0.91 7,000
Parlier Class III Mendocino Ave from Parlier Ave to Manning Ave 1.01 8,000
Parlier Class III Newmark Ave from Parlier Ave to Manning Ave 0.91 7,000
Parlier Class III Parlier Ave from Academy Ave to Milton Ave 0.50 4,000 Source: Fehr & Peers, 2017, Mark Th omas, 2017
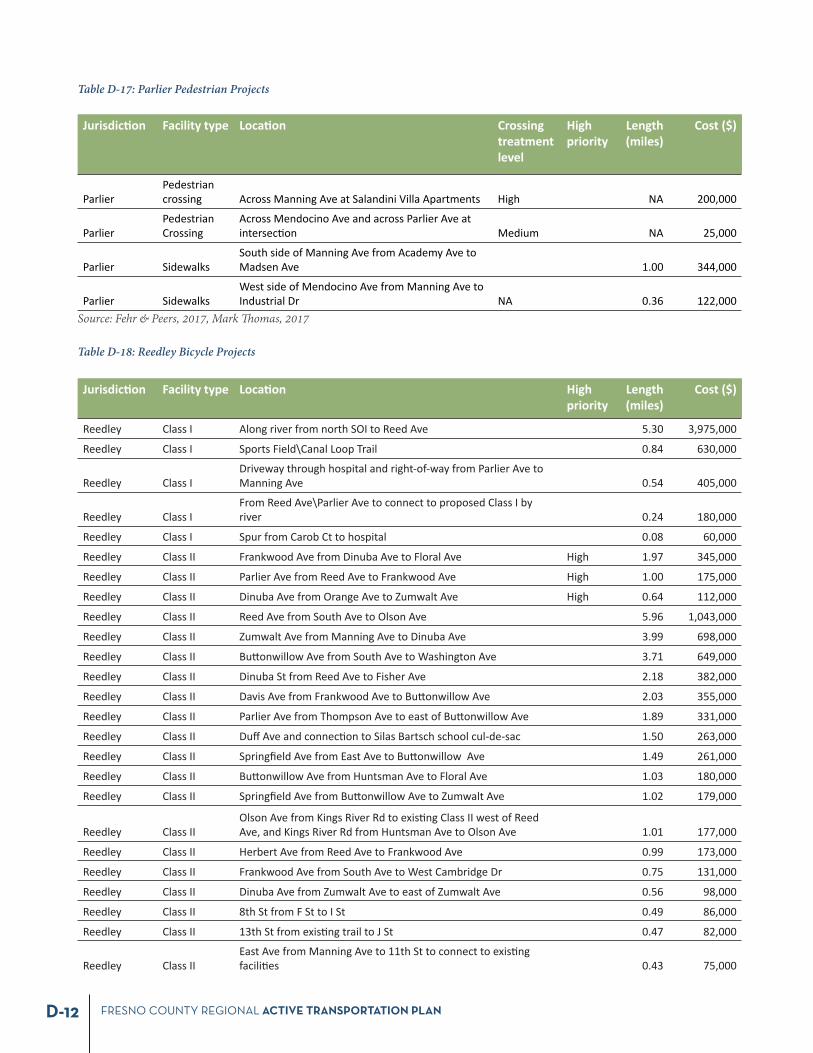
FRESNO COUNTY REGIONAL ACTIVE TRANSPORTATION PLAND-12
Table D-17: Parlier Pedestrian Projects
Jurisdic on Facility type Loca on Crossing treatment level
High priority
Length (miles)
Cost ($)
ParlierPedestrian crossing Across Manning Ave at Salandini Villa Apartments High NA
200,000
ParlierPedestrian Crossing
Across Mendocino Ave and across Parlier Ave at intersec on Medium NA
25,000
Parlier SidewalksSouth side of Manning Ave from Academy Ave to Madsen Ave 1.00 344,000
Parlier SidewalksWest side of Mendocino Ave from Manning Ave to Industrial Dr NA 0.36 122,000
Source: Fehr & Peers, 2017, Mark Th omas, 2017
Table D-18: Reedley Bicycle Projects
Jurisdic on Facility type Loca on High priority
Length (miles)
Cost ($)
Reedley Class I Along river from north SOI to Reed Ave 5.30 3,975,000
Reedley Class I Sports Field\Canal Loop Trail 0.84 630,000
Reedley Class IDriveway through hospital and right-of-way from Parlier Ave to Manning Ave 0.54 405,000
Reedley Class IFrom Reed Ave\Parlier Ave to connect to proposed Class I by river 0.24 180,000
Reedley Class I Spur from Carob Ct to hospital 0.08 60,000
Reedley Class II Frankwood Ave from Dinuba Ave to Floral Ave High 1.97 345,000
Reedley Class II Parlier Ave from Reed Ave to Frankwood Ave High 1.00 175,000
Reedley Class II Dinuba Ave from Orange Ave to Zumwalt Ave High 0.64 112,000
Reedley Class II Reed Ave from South Ave to Olson Ave 5.96 1,043,000
Reedley Class II Zumwalt Ave from Manning Ave to Dinuba Ave 3.99 698,000
Reedley Class II Bu onwillow Ave from South Ave to Washington Ave 3.71 649,000
Reedley Class II Dinuba St from Reed Ave to Fisher Ave 2.18 382,000
Reedley Class II Davis Ave from Frankwood Ave to Bu onwillow Ave 2.03 355,000
Reedley Class II Parlier Ave from Thompson Ave to east of Bu onwillow Ave 1.89 331,000
Reedley Class II Duff Ave and connec on to Silas Bartsch school cul-de-sac 1.50 263,000
Reedley Class II Springfi eld Ave from East Ave to Bu onwillow Ave 1.49 261,000
Reedley Class II Bu onwillow Ave from Huntsman Ave to Floral Ave 1.03 180,000
Reedley Class II Springfi eld Ave from Bu onwillow Ave to Zumwalt Ave 1.02 179,000
Reedley Class IIOlson Ave from Kings River Rd to exis ng Class II west of Reed Ave, and Kings River Rd from Huntsman Ave to Olson Ave 1.01 177,000
Reedley Class II Herbert Ave from Reed Ave to Frankwood Ave 0.99 173,000
Reedley Class II Frankwood Ave from South Ave to West Cambridge Dr 0.75 131,000
Reedley Class II Dinuba Ave from Zumwalt Ave to east of Zumwalt Ave 0.56 98,000
Reedley Class II 8th St from F St to I St 0.49 86,000
Reedley Class II 13th St from exis ng trail to J St 0.47 82,000
Reedley Class IIEast Ave from Manning Ave to 11th St to connect to exis ng facili es 0.43
75,000

FRESNO COUNTY REGIONAL ACTIVE TRANSPORTATION PLAN D-13
Jurisdic on Facility type Loca on High priority
Length (miles)
Cost ($)
Reedley Class III
Haney Ave from Springfi eld Ave to Evening Glow Ave, Evening Glow Ave from Haney Ave to Columbia Ave, Columbia Ave from Evening Glow Ave to Dinuba Ave High 1.49 12,000
Reedley Class III North Ave from Columbia Ave to Haney Ave High 0.50 4,000
Reedley Class III Washington Ave from East Ave to Columbia Ave High 0.50 4,000
Reedley Class III Sunset Ave from Springfi eld Ave to exis ng Class I High 0.25 2,000
Reedley Class III Columbia Rd from South Ave to Manning Ave 1.99 16,000
Reedley Class III Haney Ave from Manning Ave to Springfi eld Ave 1.06 8,000
Reedley Class III Olson Ave from Hope Ave to Frankwood Ave 0.75 6,000
Reedley Class III Acacia Ave from Manning Ave to North Ave 0.47 4,000
Reedley Class IIISunset Ave from Springfi eld Ave to Evening Glow Ave, Evening Glow Ave from Suset Ave to Columbia Ave 0.51 4,000
Reedley Class IV Manning Ave From Kings River Rd to Zumwalt Ave 5.48 1,096,000
ReedleyOvercrossing (railroad) Over UPRR tracks between Dinuba Ave and Floral Ave NA 2,700,000
Source: Fehr & Peers, 2017, Mark Th omas, 2017
Table D-19: Reedley Pedestrian Projects
Jurisdic on Facility type Loca on Crossing treatment level
High priority
Length (miles)
Cost ($)
ReedleyPedestrian crossing
Across Manning Ave at sidewalk east of Reedley High School pool High High NA 200,000
ReedleyPedestrian crossing Across Frankwood Ave at Myrtle Ave Low High NA 5,000
ReedleyPedestrian crossing Across Manning Ave at Fisher Ave High NA 200,000
Reedley SidewalksZumwalt Ave from Manning Ave to Evening Glow Ave NA High 1.29
441,000
Reedley Sidewalks Frankwood Ave from 10th St to North Ave NA High 0.07 23,000
Reedley Sidewalks Jus ne Ave north of Springfi eld Ave 0.23 600,000
Reedley Sidewalks East Ave from Lincoln Ave to August Ave 0.69 550,000
Reedley Sidewalks Washington Ave from East Ave to Columbia Ave 0.50 150,000
Reedley Sidewalks Lincoln Ave from East Ave to Columbia Ave 0.50 150,000
Reedley Sidewalks Jeff erson Ave from East Ave to Columbia Ave 0.49 150,000
Reedley Sidewalks Manning Ave from Rio Vista Ave to Kings River Rd NA 0.41 139,000
Reedley Sidewalks Myrtle Ave from Del Altair Ave to East Ave 0.12 75,000 Source: Fehr & Peers, 2017, Mark Th omas, 2017
FRESNO COUNTY REGIONAL ACTIVE TRANSPORTATION PLAND-14
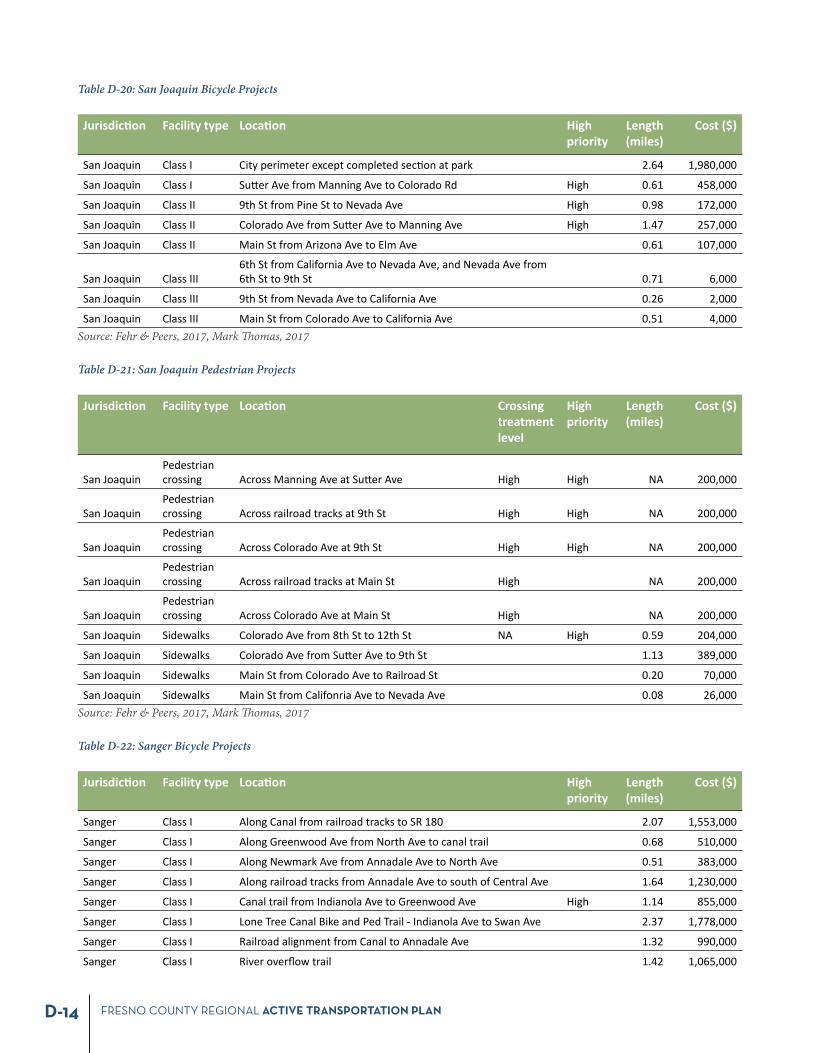
Table D-20: San Joaquin Bicycle Projects
Jurisdic on Facility type Loca on High priority
Length (miles)
Cost ($)
San Joaquin Class I City perimeter except completed sec on at park 2.64 1,980,000
San Joaquin Class I Su er Ave from Manning Ave to Colorado Rd High 0.61 458,000
San Joaquin Class II 9th St from Pine St to Nevada Ave High 0.98 172,000
San Joaquin Class II Colorado Ave from Su er Ave to Manning Ave High 1.47 257,000
San Joaquin Class II Main St from Arizona Ave to Elm Ave 0.61 107,000
San Joaquin Class III6th St from California Ave to Nevada Ave, and Nevada Ave from 6th St to 9th St 0.71 6,000
San Joaquin Class III 9th St from Nevada Ave to California Ave 0.26 2,000
San Joaquin Class III Main St from Colorado Ave to California Ave 0.51 4,000 Source: Fehr & Peers, 2017, Mark Th omas, 2017
Table D-21: San Joaquin Pedestrian Projects
Jurisdic on Facility type Loca on Crossing treatment level
High priority
Length (miles)
Cost ($)
San JoaquinPedestrian crossing Across Manning Ave at Su er Ave High High NA 200,000
San JoaquinPedestrian crossing Across railroad tracks at 9th St High High NA 200,000
San JoaquinPedestrian crossing Across Colorado Ave at 9th St High High NA 200,000
San JoaquinPedestrian crossing Across railroad tracks at Main St High NA
200,000
San JoaquinPedestrian crossing Across Colorado Ave at Main St High NA
200,000
San Joaquin Sidewalks Colorado Ave from 8th St to 12th St NA High 0.59 204,000
San Joaquin Sidewalks Colorado Ave from Su er Ave to 9th St 1.13 389,000
San Joaquin Sidewalks Main St from Colorado Ave to Railroad St 0.20 70,000
San Joaquin Sidewalks Main St from Califonria Ave to Nevada Ave 0.08 26,000 Source: Fehr & Peers, 2017, Mark Th omas, 2017
Table D-22: Sanger Bicycle Projects
Jurisdic on Facility type Loca on High priority
Length (miles)
Cost ($)
Sanger Class I Along Canal from railroad tracks to SR 180 2.07 1,553,000
Sanger Class I Along Greenwood Ave from North Ave to canal trail 0.68 510,000
Sanger Class I Along Newmark Ave from Annadale Ave to North Ave 0.51 383,000
Sanger Class I Along railroad tracks from Annadale Ave to south of Central Ave 1.64 1,230,000
Sanger Class I Canal trail from Indianola Ave to Greenwood Ave High 1.14 855,000
Sanger Class I Lone Tree Canal Bike and Ped Trail - Indianola Ave to Swan Ave 2.37 1,778,000
Sanger Class I Railroad alignment from Canal to Annadale Ave 1.32 990,000
Sanger Class I River overfl ow trail 1.42 1,065,000
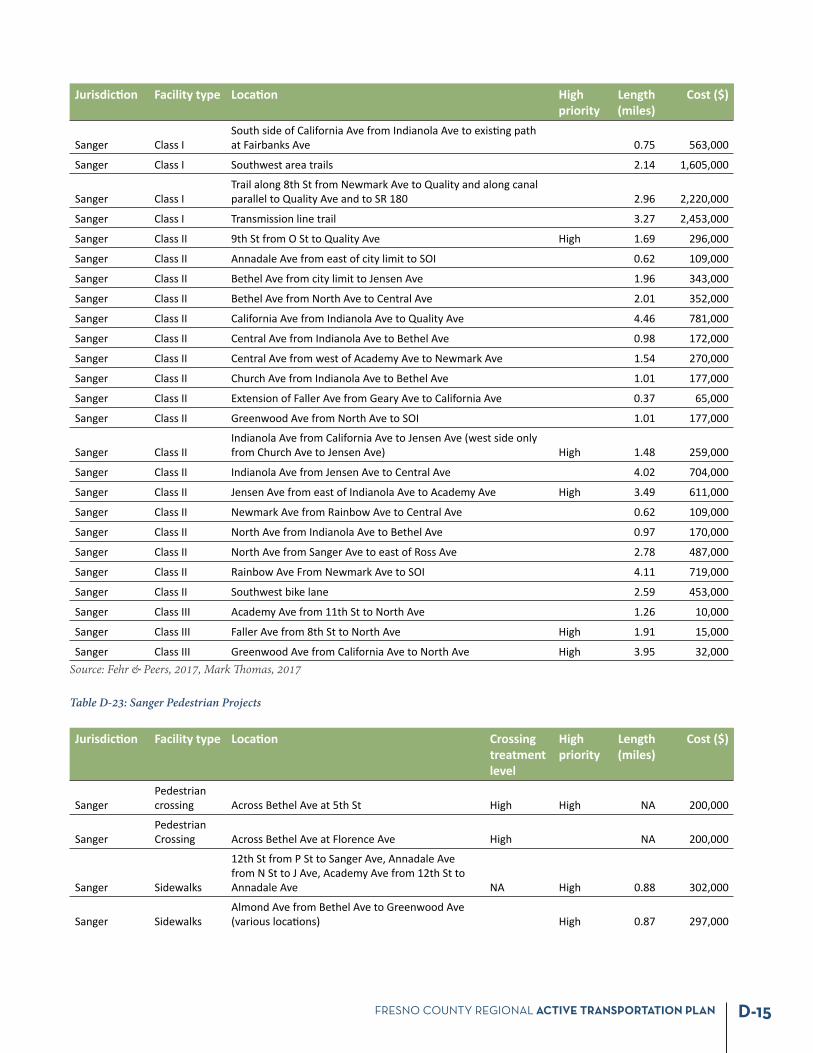
FRESNO COUNTY REGIONAL ACTIVE TRANSPORTATION PLAN D-15
Jurisdic on Facility type Loca on High priority
Length (miles)
Cost ($)
Sanger Class ISouth side of California Ave from Indianola Ave to exis ng path at Fairbanks Ave 0.75 563,000
Sanger Class I Southwest area trails 2.14 1,605,000
Sanger Class ITrail along 8th St from Newmark Ave to Quality and along canal parallel to Quality Ave and to SR 180 2.96 2,220,000
Sanger Class I Transmission line trail 3.27 2,453,000
Sanger Class II 9th St from O St to Quality Ave High 1.69 296,000
Sanger Class II Annadale Ave from east of city limit to SOI 0.62 109,000
Sanger Class II Bethel Ave from city limit to Jensen Ave 1.96 343,000
Sanger Class II Bethel Ave from North Ave to Central Ave 2.01 352,000
Sanger Class II California Ave from Indianola Ave to Quality Ave 4.46 781,000
Sanger Class II Central Ave from Indianola Ave to Bethel Ave 0.98 172,000
Sanger Class II Central Ave from west of Academy Ave to Newmark Ave 1.54 270,000
Sanger Class II Church Ave from Indianola Ave to Bethel Ave 1.01 177,000
Sanger Class II Extension of Faller Ave from Geary Ave to California Ave 0.37 65,000
Sanger Class II Greenwood Ave from North Ave to SOI 1.01 177,000
Sanger Class IIIndianola Ave from California Ave to Jensen Ave (west side only from Church Ave to Jensen Ave) High 1.48 259,000
Sanger Class II Indianola Ave from Jensen Ave to Central Ave 4.02 704,000
Sanger Class II Jensen Ave from east of Indianola Ave to Academy Ave High 3.49 611,000
Sanger Class II Newmark Ave from Rainbow Ave to Central Ave 0.62 109,000
Sanger Class II North Ave from Indianola Ave to Bethel Ave 0.97 170,000
Sanger Class II North Ave from Sanger Ave to east of Ross Ave 2.78 487,000
Sanger Class II Rainbow Ave From Newmark Ave to SOI 4.11 719,000
Sanger Class II Southwest bike lane 2.59 453,000
Sanger Class III Academy Ave from 11th St to North Ave 1.26 10,000
Sanger Class III Faller Ave from 8th St to North Ave High 1.91 15,000
Sanger Class III Greenwood Ave from California Ave to North Ave High 3.95 32,000 Source: Fehr & Peers, 2017, Mark Th omas, 2017
Table D-23: Sanger Pedestrian Projects
Jurisdic on Facility type Loca on Crossing treatment level
High priority
Length (miles)
Cost ($)
SangerPedestrian crossing Across Bethel Ave at 5th St High High NA 200,000
SangerPedestrian Crossing Across Bethel Ave at Florence Ave High NA
200,000
Sanger Sidewalks
12th St from P St to Sanger Ave, Annadale Ave from N St to J Ave, Academy Ave from 12th St to Annadale Ave NA High
0.88
302,000
Sanger SidewalksAlmond Ave from Bethel Ave to Greenwood Ave (various loca ons) High
0.87
297,000
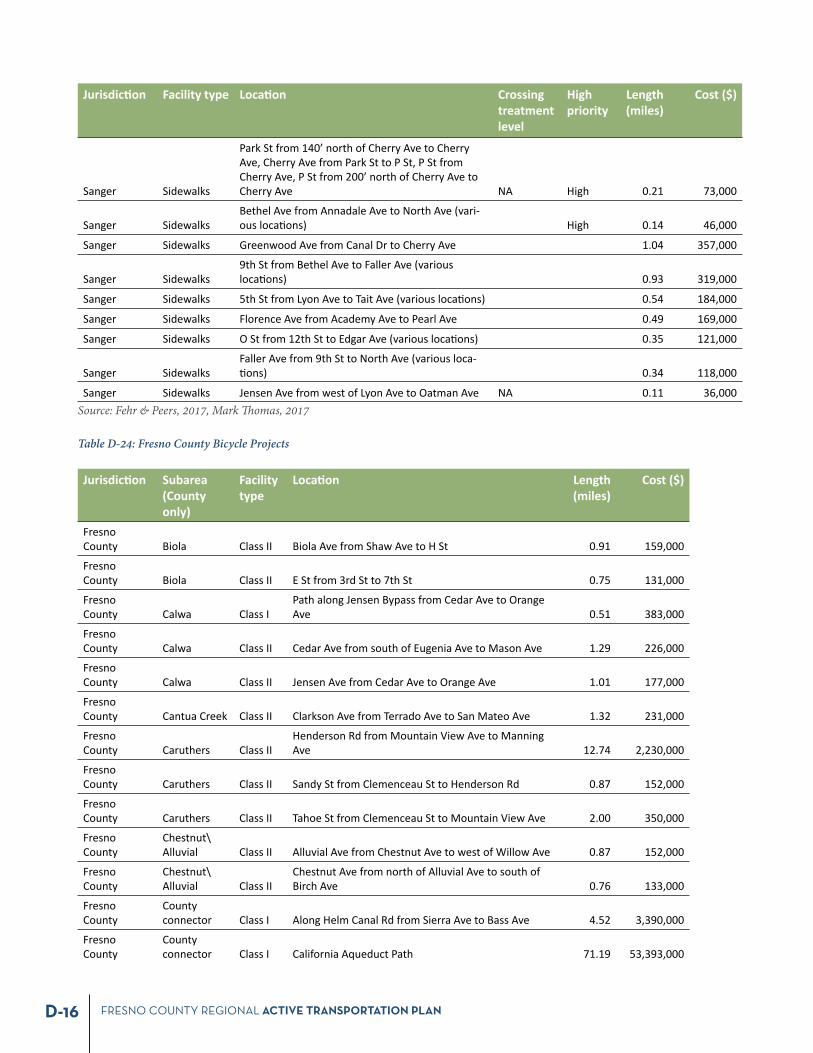
FRESNO COUNTY REGIONAL ACTIVE TRANSPORTATION PLAND-16
Jurisdic on Facility type Loca on Crossing treatment level
High priority
Length (miles)
Cost ($)
Sanger Sidewalks
Park St from 140’ north of Cherry Ave to Cherry Ave, Cherry Ave from Park St to P St, P St from Cherry Ave, P St from 200’ north of Cherry Ave to Cherry Ave NA High
0.21
73,000
Sanger SidewalksBethel Ave from Annadale Ave to North Ave (vari-ous loca ons) High
0.14
46,000
Sanger Sidewalks Greenwood Ave from Canal Dr to Cherry Ave 1.04 357,000
Sanger Sidewalks9th St from Bethel Ave to Faller Ave (various loca ons) 0.93 319,000
Sanger Sidewalks 5th St from Lyon Ave to Tait Ave (various loca ons) 0.54 184,000
Sanger Sidewalks Florence Ave from Academy Ave to Pearl Ave 0.49 169,000
Sanger Sidewalks O St from 12th St to Edgar Ave (various loca ons) 0.35 121,000
Sanger SidewalksFaller Ave from 9th St to North Ave (various loca- ons)
0.34
118,000
Sanger Sidewalks Jensen Ave from west of Lyon Ave to Oatman Ave NA 0.11 36,000 Source: Fehr & Peers, 2017, Mark Th omas, 2017
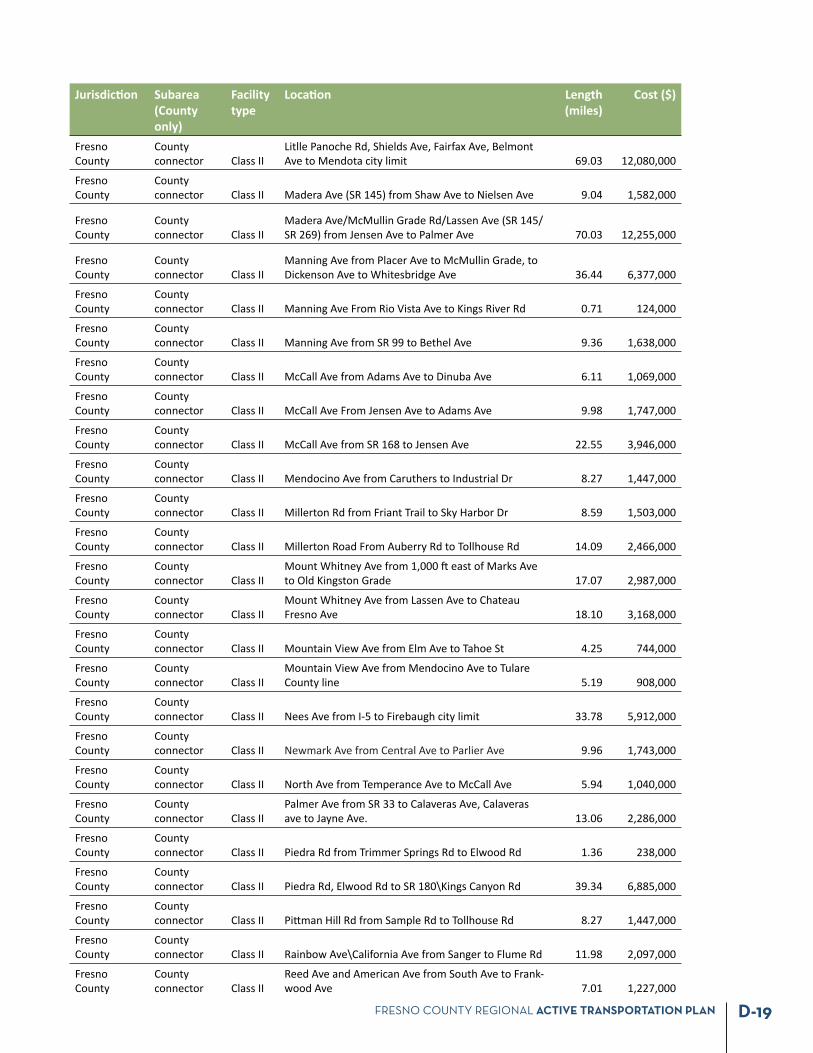
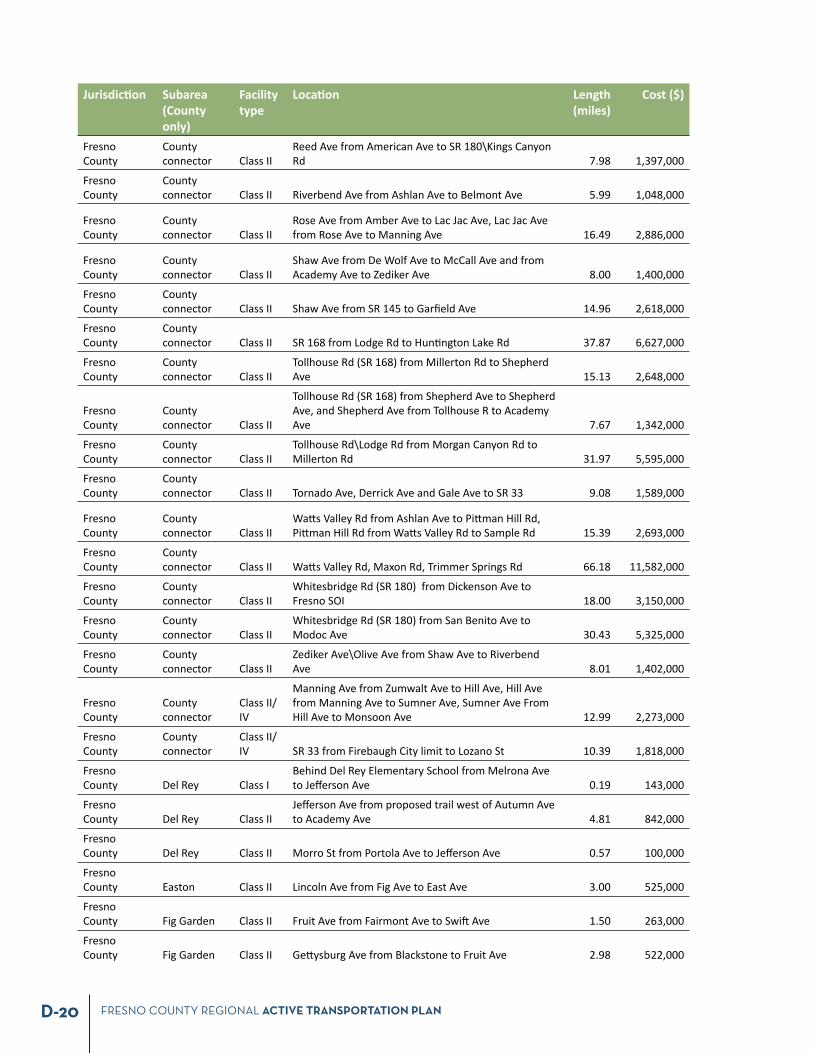
Table D-24: Fresno County Bicycle Projects
Jurisdic on Subarea (County only)
Facility type
Loca on Length (miles)
Cost ($)
Fresno County Biola Class II Biola Ave from Shaw Ave to H St 0.91
159,000
Fresno County Biola Class II E St from 3rd St to 7th St 0.75
131,000
Fresno County Calwa Class I
Path along Jensen Bypass from Cedar Ave to Orange Ave 0.51
383,000
Fresno County Calwa Class II Cedar Ave from south of Eugenia Ave to Mason Ave 1.29
226,000
Fresno County Calwa Class II Jensen Ave from Cedar Ave to Orange Ave 1.01
177,000
Fresno County Cantua Creek Class II Clarkson Ave from Terrado Ave to San Mateo Ave 1.32
231,000
Fresno County Caruthers Class II
Henderson Rd from Mountain View Ave to Manning Ave 12.74
2,230,000
Fresno County Caruthers Class II Sandy St from Clemenceau St to Henderson Rd 0.87
152,000
Fresno County Caruthers Class II Tahoe St from Clemenceau St to Mountain View Ave 2.00
350,000
Fresno County
Chestnut\Alluvial Class II Alluvial Ave from Chestnut Ave to west of Willow Ave 0.87
152,000
Fresno County
Chestnut\Alluvial Class II
Chestnut Ave from north of Alluvial Ave to south of Birch Ave 0.76
133,000
Fresno County
County connector Class I Along Helm Canal Rd from Sierra Ave to Bass Ave 4.52
3,390,000
Fresno County
County connector Class I California Aqueduct Path 71.19
53,393,000
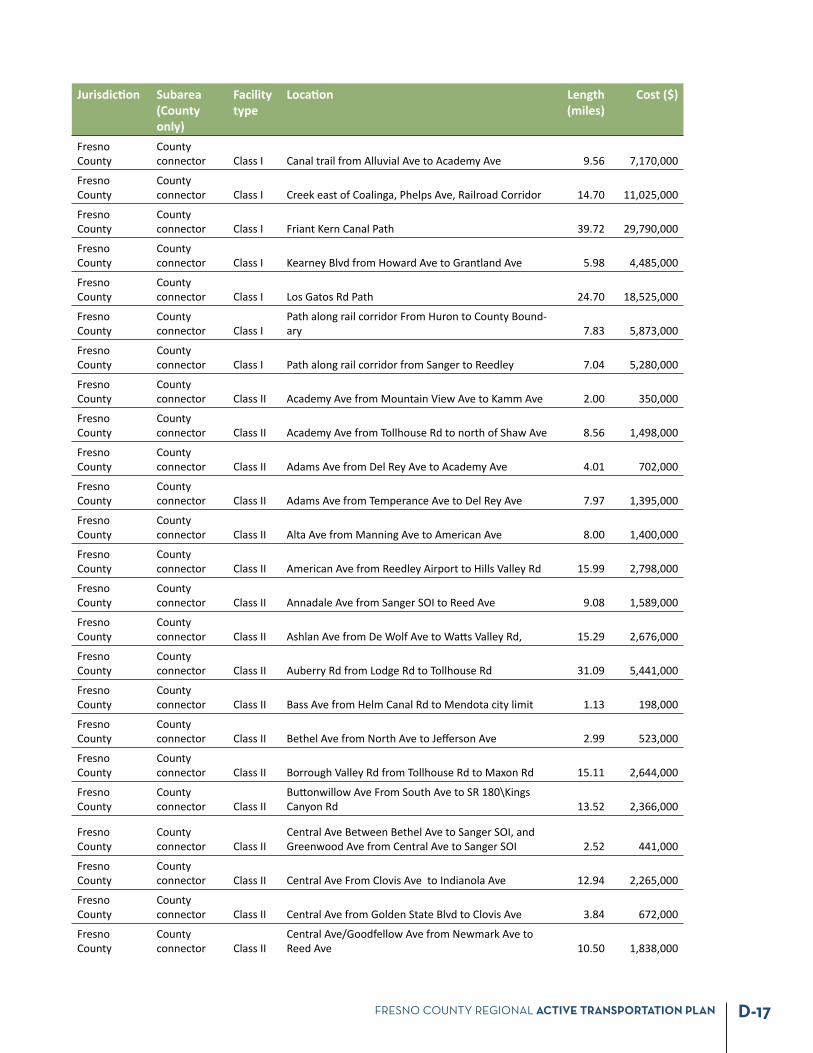
FRESNO COUNTY REGIONAL ACTIVE TRANSPORTATION PLAN D-17
Jurisdic on Subarea (County only)
Facility type
Loca on Length (miles)
Cost ($)
Fresno County
County connector Class I Canal trail from Alluvial Ave to Academy Ave 9.56
7,170,000
Fresno County
County connector Class I Creek east of Coalinga, Phelps Ave, Railroad Corridor 14.70
11,025,000
Fresno County
County connector Class I Friant Kern Canal Path 39.72
29,790,000
Fresno County
County connector Class I Kearney Blvd from Howard Ave to Grantland Ave 5.98
4,485,000
Fresno County
County connector Class I Los Gatos Rd Path 24.70
18,525,000
Fresno County
County connector Class I
Path along rail corridor From Huron to County Bound-ary 7.83
5,873,000
Fresno County
County connector Class I Path along rail corridor from Sanger to Reedley 7.04
5,280,000
Fresno County
County connector Class II Academy Ave from Mountain View Ave to Kamm Ave 2.00
350,000
Fresno County
County connector Class II Academy Ave from Tollhouse Rd to north of Shaw Ave 8.56
1,498,000
Fresno County
County connector Class II Adams Ave from Del Rey Ave to Academy Ave 4.01
702,000
Fresno County
County connector Class II Adams Ave from Temperance Ave to Del Rey Ave 7.97
1,395,000
Fresno County
County connector Class II Alta Ave from Manning Ave to American Ave 8.00
1,400,000
Fresno County
County connector Class II American Ave from Reedley Airport to Hills Valley Rd 15.99
2,798,000
Fresno County
County connector Class II Annadale Ave from Sanger SOI to Reed Ave 9.08
1,589,000
Fresno County
County connector Class II Ashlan Ave from De Wolf Ave to Wa s Valley Rd, 15.29
2,676,000
Fresno County
County connector Class II Auberry Rd from Lodge Rd to Tollhouse Rd 31.09
5,441,000
Fresno County
County connector Class II Bass Ave from Helm Canal Rd to Mendota city limit 1.13
198,000
Fresno County
County connector Class II Bethel Ave from North Ave to Jeff erson Ave 2.99
523,000
Fresno County
County connector Class II Borrough Valley Rd from Tollhouse Rd to Maxon Rd 15.11
2,644,000
Fresno County
County connector Class II
Bu onwillow Ave From South Ave to SR 180\Kings Canyon Rd 13.52
2,366,000
Fresno County
County connector Class II
Central Ave Between Bethel Ave to Sanger SOI, and Greenwood Ave from Central Ave to Sanger SOI 2.52
441,000
Fresno County
County connector Class II Central Ave From Clovis Ave to Indianola Ave 12.94
2,265,000
Fresno County
County connector Class II Central Ave from Golden State Blvd to Clovis Ave 3.84
672,000
Fresno County
County connector Class II
Central Ave/Goodfellow Ave from Newmark Ave to Reed Ave 10.50
1,838,000
FRESNO COUNTY REGIONAL ACTIVE TRANSPORTATION PLAND-18
Jurisdic on Subarea (County only)
Facility type
Loca on Length (miles)
Cost ($)
Fresno County
County connector Class II Chestnut Ave from Jensen Ave to Golden State Blvd 3.72
651,000
Fresno County
County connector Class II Clovis Ave from Central Ave to exis ng facili es 4.31
754,000
Fresno County
County connector Class II Clovis Ave From Central to North Ave 2.01
352,000
Fresno County
County connector Class II
Colorado Ave from Morton Ave to Jeff erson Ave, Jeff erson Ave from James Rd to Santa Fe Rd, Santa Fe Rd\San Benito Rd from Jeff erson Rd to Panoche Rd, SR 33 from Panoche Rd to Belmont Ave 25.43
4,450,000
Fresno County
County connector Class II
Colorado Ave from San Joaquin city limit to Morton Ave, Morton Ave from Colorado Ave to Randolph Ave 7.52
1,316,000
Fresno County
County connector Class II
Cove Ave from American Ave to SR 180\Kings Canyon Rd 7.46
1,306,000
Fresno County
County connector Class II Del Rey Ave from Adams Ave to Jeff erson Ave 3.02
529,000
Fresno County
County connector Class II Dinuba Ave from Ditch St to Academy Ave 4.29
751,000
Fresno County
County connector Class II
Doris Ave (SR 198) from Harris Ranch driveway to west side of development on west side of SR 99 1.82
319,000
Fresno County
County connector Class II Elm Ave from Lincoln Ave to Excelsior Ave 34.51
6,039,000
Fresno County
County connector Class II Elm Ave from North Ave to Lincoln Ave 6.01
1,052,000
Fresno County
County connector Class II
Fresno-Coalinga Rd/Fresno-Mendota Rd (SR 145/SR 33/SR 198) from Mount Whitney Ave to Gale Ave 47.35
8,286,000
Fresno County
County connector Class II
Gale Ave and Lassen Ave from Bu e Ave to Tornado Ave 8.04
1,407,000
Fresno County
County connector Class II Golden State Blvd from North Ave to Maple Ave 0.74
130,000
Fresno County
County connector Class II
Goldenrod Ave/Belmont Ave from Whitesbridge Ave to Howard Ave 10.23
1,790,000
Fresno County
County connector Class II Herndon Ave from east of Locan Ave to Academy Ave 10.70
1,873,000
Fresno County
County connector Class II Hills Valley Rd (SR 63) from Clayton Ave to SR 180 14.02
2,454,000
Fresno County
County connector Class II Hun ngton Lake Rd 34.37
6,015,000
Fresno County
County connector Class II Huntsman Ave from Lac Jac Ave to Reedley city limit 2.00
350,000
Fresno County
County connector Class II
Jayne Ave From Coalinga City limit to County Bound-ary 35.00
6,125,000
Fresno County
County connector Class II Jensen Ave from Highland Ave to Sanger SOI 4.48
784,000
Fresno County
County connector Class II
Kings Canyon Rd (SR 180) from McCall Ave to Elwood Rd 44.04
7,707,000
Fresno County
County connector Class II Lassen Ave (SR 269) from Gale Ave to County Limit 15.33
2,683,000
FRESNO COUNTY REGIONAL ACTIVE TRANSPORTATION PLAN D-19
Jurisdic on Subarea (County only)
Facility type
Loca on Length (miles)
Cost ($)
Fresno County
County connector Class II
Litlle Panoche Rd, Shields Ave, Fairfax Ave, Belmont Ave to Mendota city limit 69.03
12,080,000
Fresno County
County connector Class II Madera Ave (SR 145) from Shaw Ave to Nielsen Ave 9.04
1,582,000
Fresno County
County connector Class II
Madera Ave/McMullin Grade Rd/Lassen Ave (SR 145/SR 269) from Jensen Ave to Palmer Ave 70.03
12,255,000
Fresno County
County connector Class II
Manning Ave from Placer Ave to McMullin Grade, to Dickenson Ave to Whitesbridge Ave 36.44
6,377,000
Fresno County
County connector Class II Manning Ave From Rio Vista Ave to Kings River Rd 0.71
124,000
Fresno County
County connector Class II Manning Ave from SR 99 to Bethel Ave 9.36
1,638,000
Fresno County
County connector Class II McCall Ave from Adams Ave to Dinuba Ave 6.11
1,069,000
Fresno County
County connector Class II McCall Ave From Jensen Ave to Adams Ave 9.98
1,747,000
Fresno County
County connector Class II McCall Ave from SR 168 to Jensen Ave 22.55
3,946,000
Fresno County
County connector Class II Mendocino Ave from Caruthers to Industrial Dr 8.27
1,447,000
Fresno County
County connector Class II Millerton Rd from Friant Trail to Sky Harbor Dr 8.59
1,503,000
Fresno County
County connector Class II Millerton Road From Auberry Rd to Tollhouse Rd 14.09
2,466,000
Fresno County
County connector Class II
Mount Whitney Ave from 1,000 east of Marks Ave to Old Kingston Grade 17.07
2,987,000
Fresno County
County connector Class II
Mount Whitney Ave from Lassen Ave to Chateau Fresno Ave 18.10
3,168,000
Fresno County
County connector Class II Mountain View Ave from Elm Ave to Tahoe St 4.25
744,000
Fresno County
County connector Class II
Mountain View Ave from Mendocino Ave to Tulare County line 5.19
908,000
Fresno County
County connector Class II Nees Ave from I-5 to Firebaugh city limit 33.78
5,912,000
Fresno County
County connector Class II Newmark Ave from Central Ave to Parlier Ave 9.96 1,743,000
Fresno County
County connector Class II North Ave from Temperance Ave to McCall Ave 5.94
1,040,000
Fresno County
County connector Class II
Palmer Ave from SR 33 to Calaveras Ave, Calaveras ave to Jayne Ave. 13.06
2,286,000
Fresno County
County connector Class II Piedra Rd from Trimmer Springs Rd to Elwood Rd 1.36
238,000
Fresno County
County connector Class II Piedra Rd, Elwood Rd to SR 180\Kings Canyon Rd 39.34
6,885,000
Fresno County
County connector Class II Pi man Hill Rd from Sample Rd to Tollhouse Rd 8.27
1,447,000
Fresno County
County connector Class II Rainbow Ave\California Ave from Sanger to Flume Rd 11.98
2,097,000
Fresno County
County connector Class II
Reed Ave and American Ave from South Ave to Frank-wood Ave 7.01
1,227,000
FRESNO COUNTY REGIONAL ACTIVE TRANSPORTATION PLAND-20
Jurisdic on Subarea (County only)
Facility type
Loca on Length (miles)
Cost ($)
Fresno County
County connector Class II
Reed Ave from American Ave to SR 180\Kings Canyon Rd 7.98
1,397,000
Fresno County
County connector Class II Riverbend Ave from Ashlan Ave to Belmont Ave 5.99
1,048,000
Fresno County
County connector Class II
Rose Ave from Amber Ave to Lac Jac Ave, Lac Jac Ave from Rose Ave to Manning Ave 16.49
2,886,000
Fresno County
County connector Class II
Shaw Ave from De Wolf Ave to McCall Ave and from Academy Ave to Zediker Ave 8.00
1,400,000
Fresno County
County connector Class II Shaw Ave from SR 145 to Garfi eld Ave 14.96
2,618,000
Fresno County
County connector Class II SR 168 from Lodge Rd to Hun ngton Lake Rd 37.87
6,627,000
Fresno County
County connector Class II
Tollhouse Rd (SR 168) from Millerton Rd to Shepherd Ave 15.13
2,648,000
Fresno County
County connector Class II
Tollhouse Rd (SR 168) from Shepherd Ave to Shepherd Ave, and Shepherd Ave from Tollhouse R to Academy Ave 7.67
1,342,000
Fresno County
County connector Class II
Tollhouse Rd\Lodge Rd from Morgan Canyon Rd to Millerton Rd 31.97
5,595,000
Fresno County
County connector Class II Tornado Ave, Derrick Ave and Gale Ave to SR 33 9.08
1,589,000
Fresno County
County connector Class II
Wa s Valley Rd from Ashlan Ave to Pi man Hill Rd, Pi man Hill Rd from Wa s Valley Rd to Sample Rd 15.39
2,693,000
Fresno County
County connector Class II Wa s Valley Rd, Maxon Rd, Trimmer Springs Rd 66.18
11,582,000
Fresno County
County connector Class II
Whitesbridge Rd (SR 180) from Dickenson Ave to Fresno SOI 18.00
3,150,000
Fresno County
County connector Class II
Whitesbridge Rd (SR 180) from San Benito Ave to Modoc Ave 30.43
5,325,000
Fresno County
County connector Class II
Zediker Ave\Olive Ave from Shaw Ave to Riverbend Ave 8.01
1,402,000
Fresno County
County connector
Class II/IV
Manning Ave from Zumwalt Ave to Hill Ave, Hill Ave from Manning Ave to Sumner Ave, Sumner Ave From Hill Ave to Monsoon Ave 12.99
2,273,000
Fresno County
County connector
Class II/IV SR 33 from Firebaugh City limit to Lozano St 10.39
1,818,000
Fresno County Del Rey Class I
Behind Del Rey Elementary School from Melrona Ave to Jeff erson Ave 0.19
143,000
Fresno County Del Rey Class II
Jeff erson Ave from proposed trail west of Autumn Ave to Academy Ave 4.81
842,000
Fresno County Del Rey Class II Morro St from Portola Ave to Jeff erson Ave 0.57
100,000
Fresno County Easton Class II Lincoln Ave from Fig Ave to East Ave 3.00
525,000
Fresno County Fig Garden Class II Fruit Ave from Fairmont Ave to Swi Ave 1.50
263,000
Fresno County Fig Garden Class II Ge ysburg Ave from Blackstone to Fruit Ave 2.98
522,000
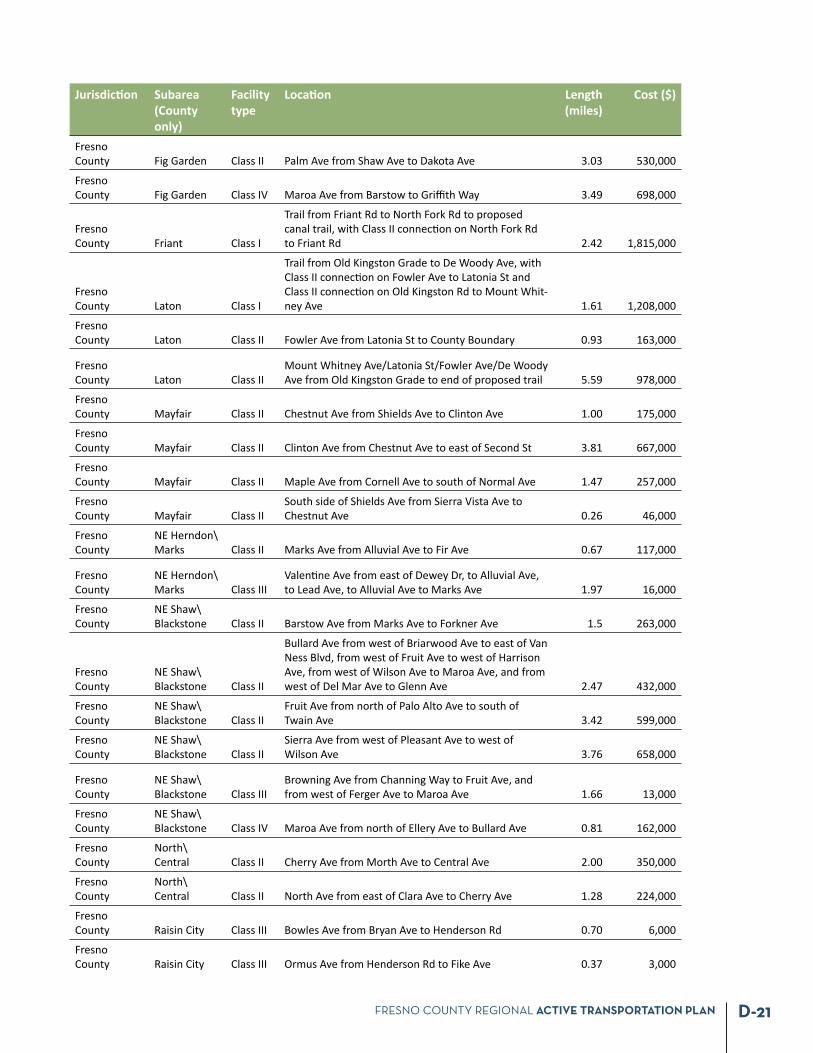
FRESNO COUNTY REGIONAL ACTIVE TRANSPORTATION PLAN D-21
Jurisdic on Subarea (County only)
Facility type
Loca on Length (miles)
Cost ($)
Fresno County Fig Garden Class II Palm Ave from Shaw Ave to Dakota Ave 3.03
530,000
Fresno County Fig Garden Class IV Maroa Ave from Barstow to Griffi th Way 3.49
698,000
Fresno County Friant Class I
Trail from Friant Rd to North Fork Rd to proposed canal trail, with Class II connec on on North Fork Rd to Friant Rd 2.42
1,815,000
Fresno County Laton Class I
Trail from Old Kingston Grade to De Woody Ave, with Class II connec on on Fowler Ave to Latonia St and Class II connec on on Old Kingston Rd to Mount Whit-ney Ave 1.61
1,208,000
Fresno County Laton Class II Fowler Ave from Latonia St to County Boundary 0.93
163,000
Fresno County Laton Class II
Mount Whitney Ave/Latonia St/Fowler Ave/De Woody Ave from Old Kingston Grade to end of proposed trail 5.59
978,000
Fresno County Mayfair Class II Chestnut Ave from Shields Ave to Clinton Ave 1.00
175,000
Fresno County Mayfair Class II Clinton Ave from Chestnut Ave to east of Second St 3.81
667,000
Fresno County Mayfair Class II Maple Ave from Cornell Ave to south of Normal Ave 1.47
257,000
Fresno County Mayfair Class II
South side of Shields Ave from Sierra Vista Ave to Chestnut Ave 0.26
46,000
Fresno County
NE Herndon\Marks Class II Marks Ave from Alluvial Ave to Fir Ave 0.67
117,000
Fresno County
NE Herndon\Marks Class III
Valen ne Ave from east of Dewey Dr, to Alluvial Ave, to Lead Ave, to Alluvial Ave to Marks Ave 1.97
16,000
Fresno County
NE Shaw\Blackstone Class II Barstow Ave from Marks Ave to Forkner Ave 1.5
263,000
Fresno County
NE Shaw\Blackstone Class II
Bullard Ave from west of Briarwood Ave to east of Van Ness Blvd, from west of Fruit Ave to west of Harrison Ave, from west of Wilson Ave to Maroa Ave, and from west of Del Mar Ave to Glenn Ave 2.47
432,000
Fresno County
NE Shaw\Blackstone Class II
Fruit Ave from north of Palo Alto Ave to south of Twain Ave 3.42
599,000
Fresno County
NE Shaw\Blackstone Class II
Sierra Ave from west of Pleasant Ave to west of Wilson Ave 3.76
658,000
Fresno County
NE Shaw\Blackstone Class III
Browning Ave from Channing Way to Fruit Ave, and from west of Ferger Ave to Maroa Ave 1.66
13,000
Fresno County
NE Shaw\Blackstone Class IV Maroa Ave from north of Ellery Ave to Bullard Ave 0.81
162,000
Fresno County
North\Central Class II Cherry Ave from Morth Ave to Central Ave 2.00
350,000
Fresno County
North\Central Class II North Ave from east of Clara Ave to Cherry Ave 1.28
224,000
Fresno County Raisin City Class III Bowles Ave from Bryan Ave to Henderson Rd 0.70
6,000
Fresno County Raisin City Class III Ormus Ave from Henderson Rd to Fike Ave 0.37
3,000
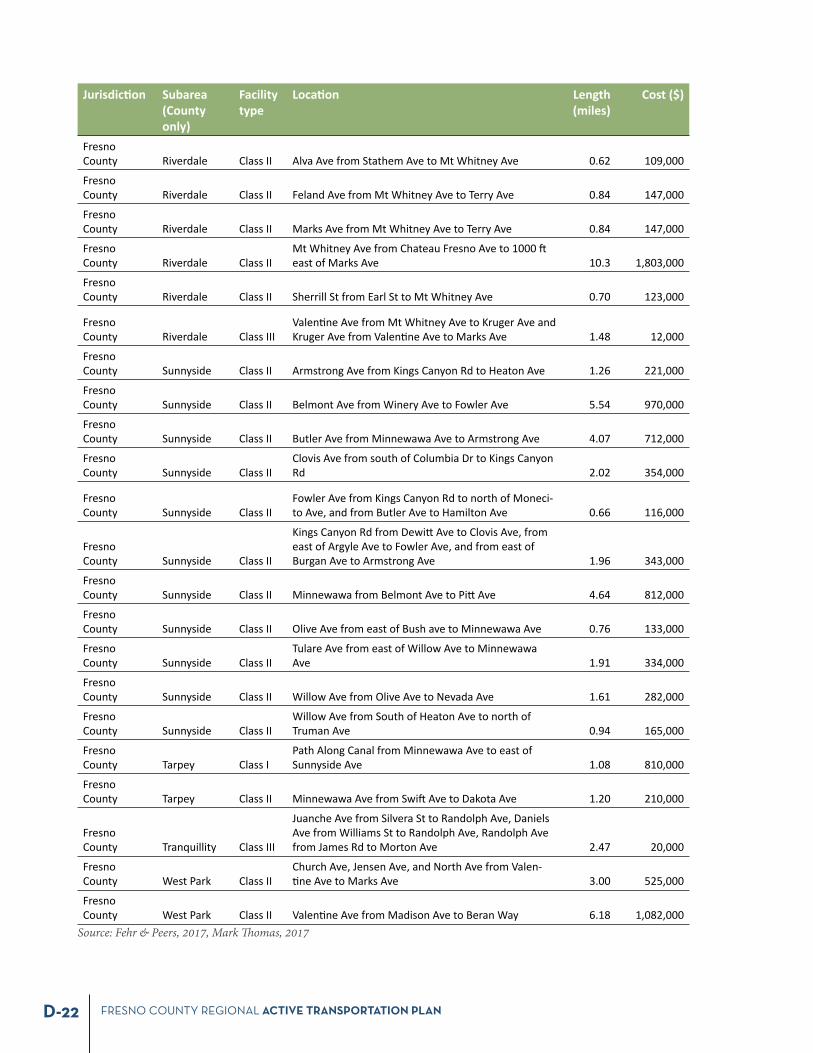
FRESNO COUNTY REGIONAL ACTIVE TRANSPORTATION PLAND-22
Jurisdic on Subarea (County only)
Facility type
Loca on Length (miles)
Cost ($)
Fresno County Riverdale Class II Alva Ave from Stathem Ave to Mt Whitney Ave 0.62
109,000
Fresno County Riverdale Class II Feland Ave from Mt Whitney Ave to Terry Ave 0.84
147,000
Fresno County Riverdale Class II Marks Ave from Mt Whitney Ave to Terry Ave 0.84
147,000
Fresno County Riverdale Class II
Mt Whitney Ave from Chateau Fresno Ave to 1000 east of Marks Ave 10.3
1,803,000
Fresno County Riverdale Class II Sherrill St from Earl St to Mt Whitney Ave 0.70
123,000
Fresno County Riverdale Class III
Valen ne Ave from Mt Whitney Ave to Kruger Ave and Kruger Ave from Valen ne Ave to Marks Ave 1.48
12,000
Fresno County Sunnyside Class II Armstrong Ave from Kings Canyon Rd to Heaton Ave 1.26
221,000
Fresno County Sunnyside Class II Belmont Ave from Winery Ave to Fowler Ave 5.54
970,000
Fresno County Sunnyside Class II Butler Ave from Minnewawa Ave to Armstrong Ave 4.07
712,000
Fresno County Sunnyside Class II
Clovis Ave from south of Columbia Dr to Kings Canyon Rd 2.02
354,000
Fresno County Sunnyside Class II
Fowler Ave from Kings Canyon Rd to north of Moneci-to Ave, and from Butler Ave to Hamilton Ave 0.66
116,000
Fresno County Sunnyside Class II
Kings Canyon Rd from Dewi Ave to Clovis Ave, from east of Argyle Ave to Fowler Ave, and from east of Burgan Ave to Armstrong Ave 1.96
343,000
Fresno County Sunnyside Class II Minnewawa from Belmont Ave to Pi Ave 4.64
812,000
Fresno County Sunnyside Class II Olive Ave from east of Bush ave to Minnewawa Ave 0.76
133,000
Fresno County Sunnyside Class II
Tulare Ave from east of Willow Ave to Minnewawa Ave 1.91
334,000
Fresno County Sunnyside Class II Willow Ave from Olive Ave to Nevada Ave 1.61
282,000
Fresno County Sunnyside Class II
Willow Ave from South of Heaton Ave to north of Truman Ave 0.94
165,000
Fresno County Tarpey Class I
Path Along Canal from Minnewawa Ave to east of Sunnyside Ave 1.08
810,000
Fresno County Tarpey Class II Minnewawa Ave from Swi Ave to Dakota Ave 1.20
210,000
Fresno County Tranquillity Class III
Juanche Ave from Silvera St to Randolph Ave, Daniels Ave from Williams St to Randolph Ave, Randolph Ave from James Rd to Morton Ave 2.47
20,000
Fresno County West Park Class II
Church Ave, Jensen Ave, and North Ave from Valen- ne Ave to Marks Ave 3.00
525,000
Fresno County West Park Class II Valen ne Ave from Madison Ave to Beran Way 6.18
1,082,000
Source: Fehr & Peers, 2017, Mark Th omas, 2017
FRESNO COUNTY REGIONAL ACTIVE TRANSPORTATION PLAN D-23
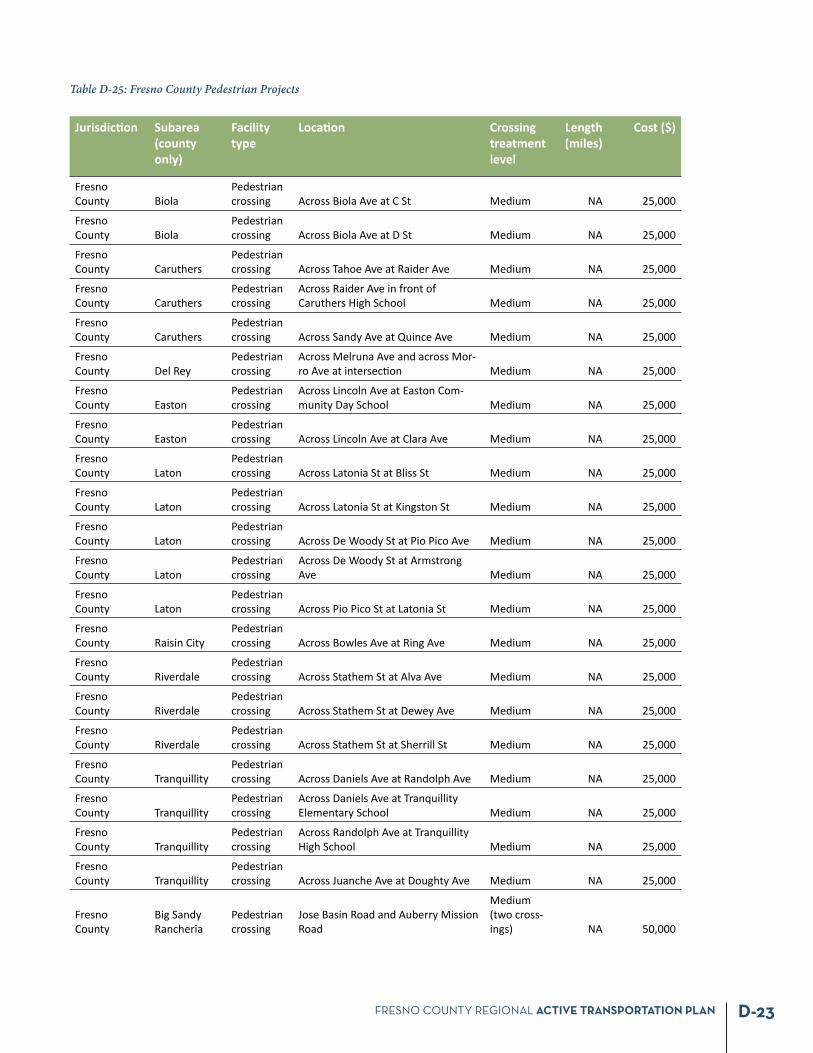
Table D-25: Fresno County Pedestrian Projects
Jurisdic on Subarea (county only)
Facility type
Loca on Crossing treatment level
Length (miles)
Cost ($)
Fresno County Biola
Pedestrian crossing Across Biola Ave at C St Medium NA
25,000
Fresno County Biola
Pedestrian crossing Across Biola Ave at D St Medium NA
25,000
Fresno County Caruthers
Pedestrian crossing Across Tahoe Ave at Raider Ave Medium NA
25,000
Fresno County Caruthers
Pedestrian crossing
Across Raider Ave in front of Caruthers High School Medium NA
25,000
Fresno County Caruthers
Pedestrian crossing Across Sandy Ave at Quince Ave Medium NA
25,000
Fresno County Del Rey
Pedestrian crossing
Across Melruna Ave and across Mor-ro Ave at intersec on Medium NA
25,000
Fresno County Easton
Pedestrian crossing
Across Lincoln Ave at Easton Com-munity Day School Medium NA
25,000
Fresno County Easton
Pedestrian crossing Across Lincoln Ave at Clara Ave Medium NA
25,000
Fresno County Laton
Pedestrian crossing Across Latonia St at Bliss St Medium NA
25,000
Fresno County Laton
Pedestrian crossing Across Latonia St at Kingston St Medium NA
25,000
Fresno County Laton
Pedestrian crossing Across De Woody St at Pio Pico Ave Medium NA
25,000
Fresno County Laton
Pedestrian crossing
Across De Woody St at Armstrong Ave Medium NA
25,000
Fresno County Laton
Pedestrian crossing Across Pio Pico St at Latonia St Medium NA
25,000
Fresno County Raisin City
Pedestrian crossing Across Bowles Ave at Ring Ave Medium NA
25,000
Fresno County Riverdale
Pedestrian crossing Across Stathem St at Alva Ave Medium NA
25,000
Fresno County Riverdale
Pedestrian crossing Across Stathem St at Dewey Ave Medium NA
25,000
Fresno County Riverdale
Pedestrian crossing Across Stathem St at Sherrill St Medium NA
25,000
Fresno County Tranquillity
Pedestrian crossing Across Daniels Ave at Randolph Ave Medium NA
25,000
Fresno County Tranquillity
Pedestrian crossing
Across Daniels Ave at Tranquillity Elementary School Medium NA
25,000
Fresno County Tranquillity
Pedestrian crossing
Across Randolph Ave at Tranquillity High School Medium NA
25,000
Fresno County Tranquillity
Pedestrian crossing Across Juanche Ave at Doughty Ave Medium NA
25,000
Fresno County
Big Sandy Rancheria
Pedestrian crossing
Jose Basin Road and Auberry Mission Road
Medium (two cross-ings) NA
50,000
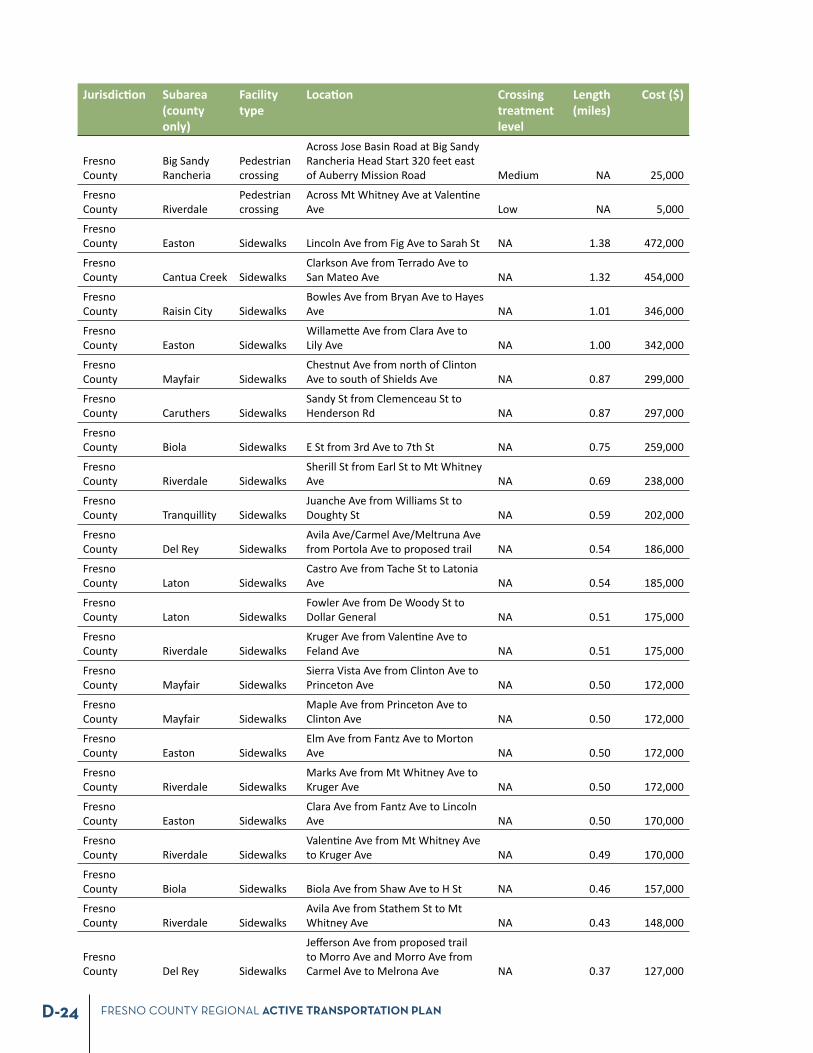
FRESNO COUNTY REGIONAL ACTIVE TRANSPORTATION PLAND-24
Jurisdic on Subarea (county only)
Facility type
Loca on Crossing treatment level
Length (miles)
Cost ($)
Fresno County
Big Sandy Rancheria
Pedestrian crossing
Across Jose Basin Road at Big Sandy Rancheria Head Start 320 feet east of Auberry Mission Road Medium NA
25,000
Fresno County Riverdale
Pedestrian crossing
Across Mt Whitney Ave at Valen ne Ave Low NA
5,000
Fresno County Easton Sidewalks Lincoln Ave from Fig Ave to Sarah St NA
1.38
472,000
Fresno County Cantua Creek Sidewalks
Clarkson Ave from Terrado Ave to San Mateo Ave NA
1.32
454,000
Fresno County Raisin City Sidewalks
Bowles Ave from Bryan Ave to Hayes Ave NA
1.01
346,000
Fresno County Easton Sidewalks
Willame e Ave from Clara Ave to Lily Ave NA
1.00
342,000
Fresno County Mayfair Sidewalks
Chestnut Ave from north of Clinton Ave to south of Shields Ave NA
0.87
299,000
Fresno County Caruthers Sidewalks
Sandy St from Clemenceau St to Henderson Rd NA
0.87
297,000
Fresno County Biola Sidewalks E St from 3rd Ave to 7th St NA
0.75
259,000
Fresno County Riverdale Sidewalks
Sherill St from Earl St to Mt Whitney Ave NA
0.69
238,000
Fresno County Tranquillity Sidewalks
Juanche Ave from Williams St to Doughty St NA
0.59
202,000
Fresno County Del Rey Sidewalks
Avila Ave/Carmel Ave/Meltruna Ave from Portola Ave to proposed trail NA
0.54
186,000
Fresno County Laton Sidewalks
Castro Ave from Tache St to Latonia Ave NA
0.54
185,000
Fresno County Laton Sidewalks
Fowler Ave from De Woody St to Dollar General NA
0.51
175,000
Fresno County Riverdale Sidewalks
Kruger Ave from Valen ne Ave to Feland Ave NA
0.51
175,000
Fresno County Mayfair Sidewalks
Sierra Vista Ave from Clinton Ave to Princeton Ave NA
0.50
172,000
Fresno County Mayfair Sidewalks
Maple Ave from Princeton Ave to Clinton Ave NA
0.50
172,000
Fresno County Easton Sidewalks
Elm Ave from Fantz Ave to Morton Ave NA
0.50
172,000
Fresno County Riverdale Sidewalks
Marks Ave from Mt Whitney Ave to Kruger Ave NA
0.50
172,000
Fresno County Easton Sidewalks
Clara Ave from Fantz Ave to Lincoln Ave NA
0.50
170,000
Fresno County Riverdale Sidewalks
Valen ne Ave from Mt Whitney Ave to Kruger Ave NA
0.49
170,000
Fresno County Biola Sidewalks Biola Ave from Shaw Ave to H St NA
0.46
157,000
Fresno County Riverdale Sidewalks
Avila Ave from Stathem St to Mt Whitney Ave NA
0.43
148,000
Fresno County Del Rey Sidewalks
Jeff erson Ave from proposed trail to Morro Ave and Morro Ave from Carmel Ave to Melrona Ave NA
0.37
127,000
FRESNO COUNTY REGIONAL ACTIVE TRANSPORTATION PLAN D-25
Jurisdic on Subarea (county only)
Facility type
Loca on Crossing treatment level
Length (miles)
Cost ($)
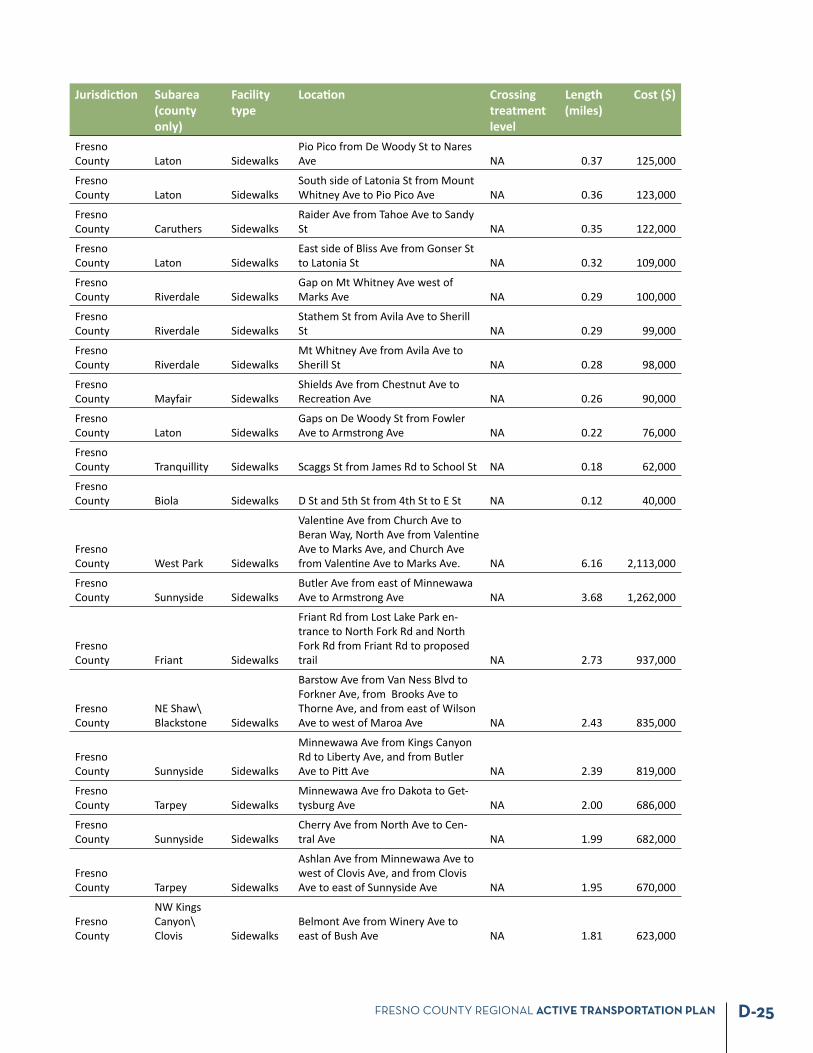
Fresno County Laton Sidewalks
Pio Pico from De Woody St to Nares Ave NA
0.37
125,000
Fresno County Laton Sidewalks
South side of Latonia St from Mount Whitney Ave to Pio Pico Ave NA
0.36
123,000
Fresno County Caruthers Sidewalks
Raider Ave from Tahoe Ave to Sandy St NA
0.35
122,000
Fresno County Laton Sidewalks
East side of Bliss Ave from Gonser St to Latonia St NA
0.32
109,000
Fresno County Riverdale Sidewalks
Gap on Mt Whitney Ave west of Marks Ave NA
0.29
100,000
Fresno County Riverdale Sidewalks
Stathem St from Avila Ave to Sherill St NA
0.29
99,000
Fresno County Riverdale Sidewalks
Mt Whitney Ave from Avila Ave to Sherill St NA
0.28
98,000
Fresno County Mayfair Sidewalks
Shields Ave from Chestnut Ave to Recrea on Ave NA
0.26
90,000
Fresno County Laton Sidewalks
Gaps on De Woody St from Fowler Ave to Armstrong Ave NA
0.22
76,000
Fresno County Tranquillity Sidewalks Scaggs St from James Rd to School St NA
0.18
62,000
Fresno County Biola Sidewalks D St and 5th St from 4th St to E St NA
0.12
40,000
Fresno County West Park Sidewalks
Valen ne Ave from Church Ave to Beran Way, North Ave from Valen ne Ave to Marks Ave, and Church Ave from Valen ne Ave to Marks Ave. NA
6.16
2,113,000
Fresno County Sunnyside Sidewalks
Butler Ave from east of Minnewawa Ave to Armstrong Ave NA
3.68
1,262,000
Fresno County Friant Sidewalks
Friant Rd from Lost Lake Park en-trance to North Fork Rd and North Fork Rd from Friant Rd to proposed trail NA
2.73
937,000
Fresno County
NE Shaw\Blackstone Sidewalks
Barstow Ave from Van Ness Blvd to Forkner Ave, from Brooks Ave to Thorne Ave, and from east of Wilson Ave to west of Maroa Ave NA
2.43
835,000
Fresno County Sunnyside Sidewalks
Minnewawa Ave from Kings Canyon Rd to Liberty Ave, and from Butler Ave to Pi Ave NA
2.39
819,000
Fresno County Tarpey Sidewalks
Minnewawa Ave fro Dakota to Get-tysburg Ave NA
2.00
686,000
Fresno County Sunnyside Sidewalks
Cherry Ave from North Ave to Cen-tral Ave NA
1.99
682,000
Fresno County Tarpey Sidewalks
Ashlan Ave from Minnewawa Ave to west of Clovis Ave, and from Clovis Ave to east of Sunnyside Ave NA
1.95
670,000
Fresno County
NW Kings Canyon\Clovis Sidewalks
Belmont Ave from Winery Ave to east of Bush Ave NA
1.81
623,000
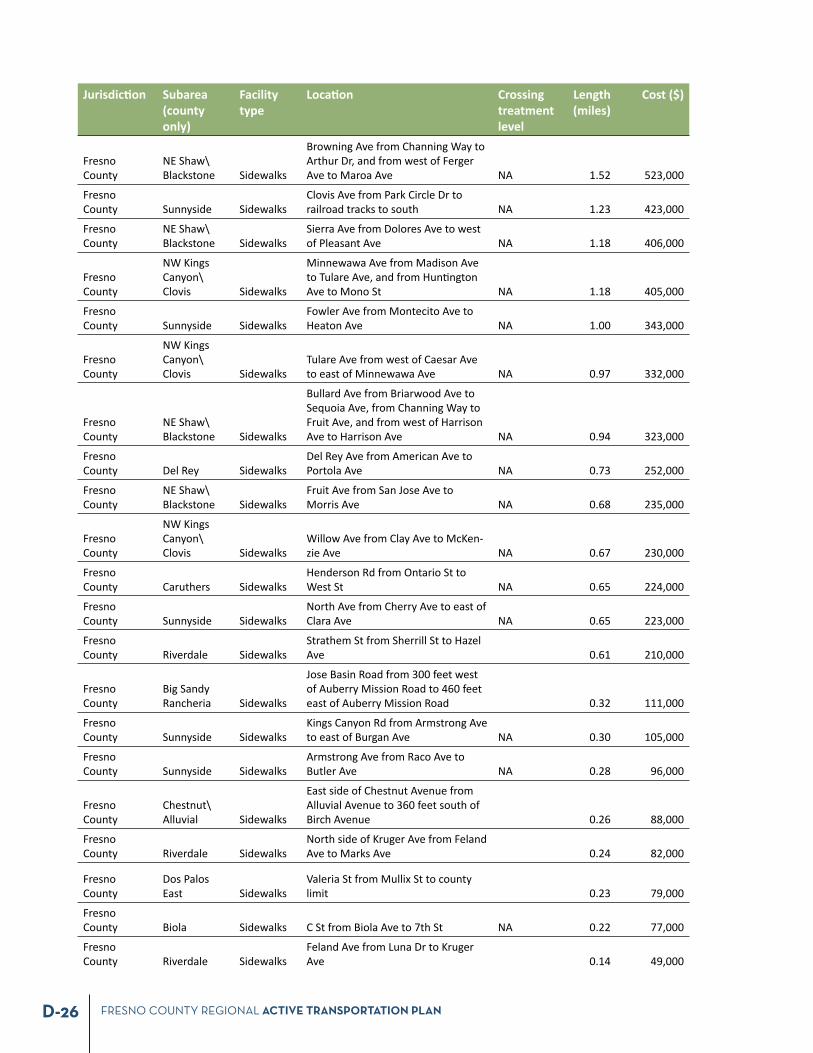
FRESNO COUNTY REGIONAL ACTIVE TRANSPORTATION PLAND-26
Jurisdic on Subarea (county only)
Facility type
Loca on Crossing treatment level
Length (miles)
Cost ($)
Fresno County
NE Shaw\Blackstone Sidewalks
Browning Ave from Channing Way to Arthur Dr, and from west of Ferger Ave to Maroa Ave NA
1.52
523,000
Fresno County Sunnyside Sidewalks
Clovis Ave from Park Circle Dr to railroad tracks to south NA
1.23
423,000
Fresno County
NE Shaw\Blackstone Sidewalks
Sierra Ave from Dolores Ave to west of Pleasant Ave NA
1.18
406,000
Fresno County
NW Kings Canyon\Clovis Sidewalks
Minnewawa Ave from Madison Ave to Tulare Ave, and from Hun ngton Ave to Mono St NA
1.18
405,000
Fresno County Sunnyside Sidewalks
Fowler Ave from Montecito Ave to Heaton Ave NA
1.00
343,000
Fresno County
NW Kings Canyon\Clovis Sidewalks
Tulare Ave from west of Caesar Ave to east of Minnewawa Ave NA
0.97
332,000
Fresno County
NE Shaw\Blackstone Sidewalks
Bullard Ave from Briarwood Ave to Sequoia Ave, from Channing Way to Fruit Ave, and from west of Harrison Ave to Harrison Ave NA
0.94
323,000
Fresno County Del Rey Sidewalks
Del Rey Ave from American Ave to Portola Ave NA
0.73
252,000
Fresno County
NE Shaw\Blackstone Sidewalks
Fruit Ave from San Jose Ave to Morris Ave NA
0.68
235,000
Fresno County
NW Kings Canyon\Clovis Sidewalks
Willow Ave from Clay Ave to McKen-zie Ave NA
0.67
230,000
Fresno County Caruthers Sidewalks
Henderson Rd from Ontario St to West St NA
0.65
224,000
Fresno County Sunnyside Sidewalks
North Ave from Cherry Ave to east of Clara Ave NA
0.65
223,000
Fresno County Riverdale Sidewalks
Strathem St from Sherrill St to Hazel Ave
0.61
210,000
Fresno County
Big Sandy Rancheria Sidewalks
Jose Basin Road from 300 feet west of Auberry Mission Road to 460 feet east of Auberry Mission Road
0.32
111,000
Fresno County Sunnyside Sidewalks
Kings Canyon Rd from Armstrong Ave to east of Burgan Ave NA
0.30
105,000
Fresno County Sunnyside Sidewalks
Armstrong Ave from Raco Ave to Butler Ave NA
0.28
96,000
Fresno County
Chestnut\Alluvial Sidewalks
East side of Chestnut Avenue from Alluvial Avenue to 360 feet south of Birch Avenue
0.26
88,000
Fresno County Riverdale Sidewalks
North side of Kruger Ave from Feland Ave to Marks Ave
0.24
82,000
Fresno County
Dos Palos East Sidewalks
Valeria St from Mullix St to county limit
0.23
79,000
Fresno County Biola Sidewalks C St from Biola Ave to 7th St NA
0.22
77,000
Fresno County Riverdale Sidewalks
Feland Ave from Luna Dr to Kruger Ave
0.14
49,000
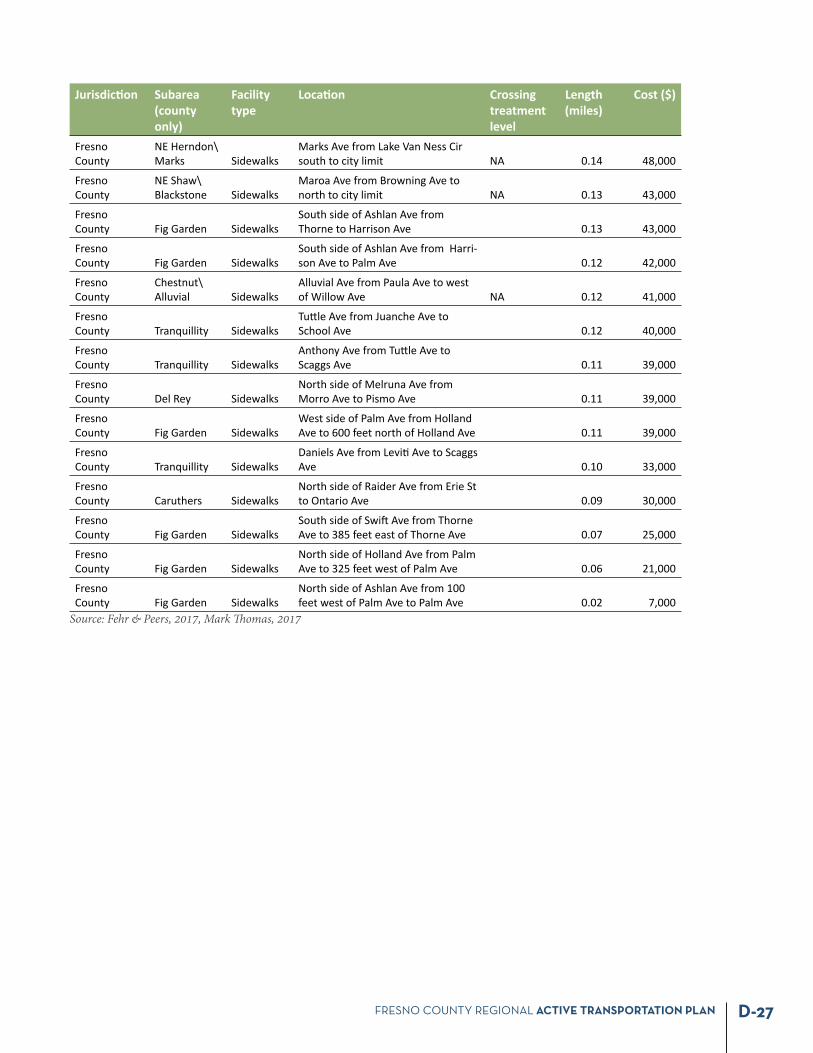
FRESNO COUNTY REGIONAL ACTIVE TRANSPORTATION PLAN D-27
Jurisdic on Subarea (county only)
Facility type
Loca on Crossing treatment level
Length (miles)
Cost ($)
Fresno County
NE Herndon\Marks Sidewalks
Marks Ave from Lake Van Ness Cir south to city limit NA
0.14
48,000
Fresno County
NE Shaw\Blackstone Sidewalks
Maroa Ave from Browning Ave to north to city limit NA
0.13
43,000
Fresno County Fig Garden Sidewalks
South side of Ashlan Ave from Thorne to Harrison Ave
0.13
43,000
Fresno County Fig Garden Sidewalks
South side of Ashlan Ave from Harri-son Ave to Palm Ave
0.12
42,000
Fresno County
Chestnut\Alluvial Sidewalks
Alluvial Ave from Paula Ave to west of Willow Ave NA
0.12
41,000
Fresno County Tranquillity Sidewalks
Tu le Ave from Juanche Ave to School Ave
0.12
40,000
Fresno County Tranquillity Sidewalks
Anthony Ave from Tu le Ave to Scaggs Ave
0.11
39,000
Fresno County Del Rey Sidewalks
North side of Melruna Ave from Morro Ave to Pismo Ave
0.11
39,000
Fresno County Fig Garden Sidewalks
West side of Palm Ave from Holland Ave to 600 feet north of Holland Ave
0.11
39,000
Fresno County Tranquillity Sidewalks
Daniels Ave from Levi Ave to Scaggs Ave
0.10
33,000
Fresno County Caruthers Sidewalks
North side of Raider Ave from Erie St to Ontario Ave
0.09
30,000
Fresno County Fig Garden Sidewalks
South side of Swi Ave from Thorne Ave to 385 feet east of Thorne Ave
0.07
25,000
Fresno County Fig Garden Sidewalks
North side of Holland Ave from Palm Ave to 325 feet west of Palm Ave
0.06
21,000
Fresno County Fig Garden Sidewalks
North side of Ashlan Ave from 100 feet west of Palm Ave to Palm Ave
0.02
7,000
Source: Fehr & Peers, 2017, Mark Th omas, 2017
CITY OF CLOVIS ACTIVE
TRANSPORTATION PLAN2015
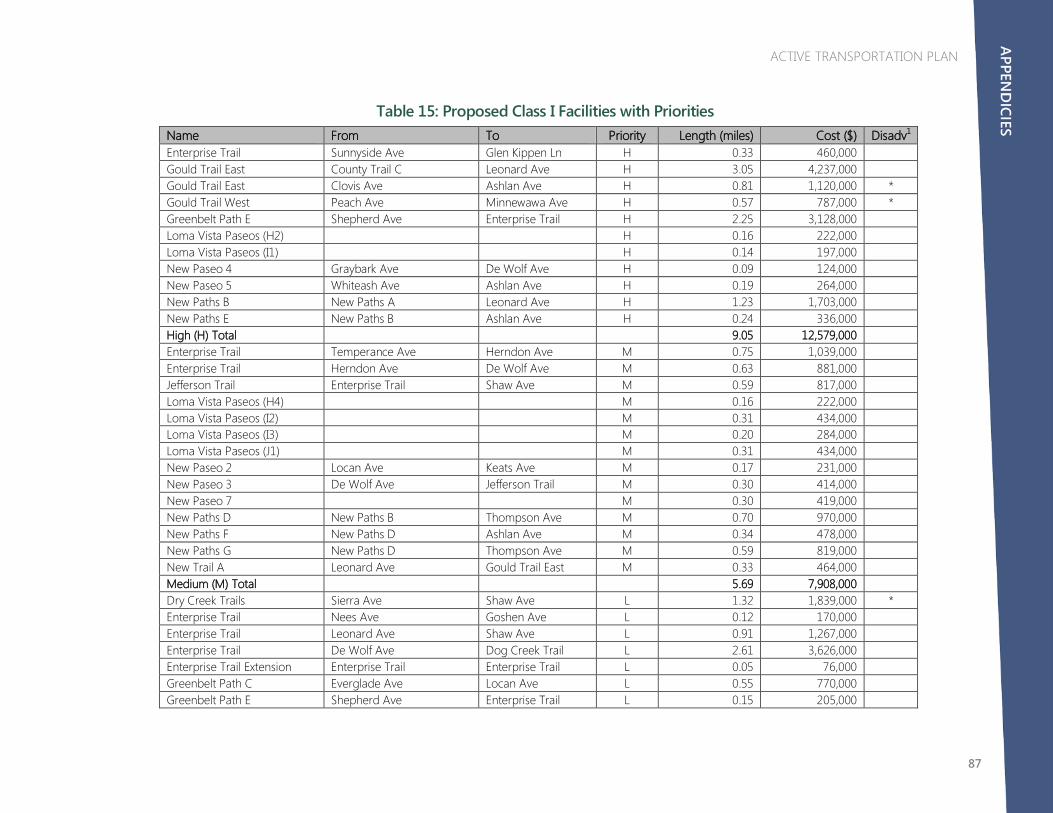
ACTIVE TRANSPORTATION PLAN
87
Name From To Priority Length (miles) Cost ($) Disadv1
Enterprise Trail Sunnyside Ave Glen Kippen Ln H 0.33 460,000
Gould Trail East County Trail C Leonard Ave H 3.05 4,237,000
Gould Trail East Clovis Ave Ashlan Ave H 0.81 1,120,000 * Gould Trail West Peach Ave Minnewawa Ave H 0.57 787,000 * Greenbelt Path E Shepherd Ave Enterprise Trail H 2.25 3,128,000
Loma Vista Paseos (H2) H 0.16 222,000
Loma Vista Paseos (I1) H 0.14 197,000
New Paseo 4 Graybark Ave De Wolf Ave H 0.09 124,000
New Paseo 5 Whiteash Ave Ashlan Ave H 0.19 264,000
New Paths B New Paths A Leonard Ave H 1.23 1,703,000
New Paths E New Paths B Ashlan Ave H 0.24 336,000
High (H) Total
9.05 12,579,000
Enterprise Trail Temperance Ave Herndon Ave M 0.75 1,039,000
Enterprise Trail Herndon Ave De Wolf Ave M 0.63 881,000
Jefferson Trail Enterprise Trail Shaw Ave M 0.59 817,000
Loma Vista Paseos (H4) M 0.16 222,000
Loma Vista Paseos (I2) M 0.31 434,000 Loma Vista Paseos (I3) M 0.20 284,000
Loma Vista Paseos (J1) M 0.31 434,000
New Paseo 2 Locan Ave Keats Ave M 0.17 231,000
New Paseo 3 De Wolf Ave Jefferson Trail M 0.30 414,000
New Paseo 7 M 0.30 419,000
New Paths D New Paths B Thompson Ave M 0.70 970,000
New Paths F New Paths D Ashlan Ave M 0.34 478,000
New Paths G New Paths D Thompson Ave M 0.59 819,000
New Trail A Leonard Ave Gould Trail East M 0.33 464,000
Medium (M) Total
5.69 7,908,000
Dry Creek Trails Sierra Ave Shaw Ave L 1.32 1,839,000 * Enterprise Trail Nees Ave Goshen Ave L 0.12 170,000
Enterprise Trail Leonard Ave Shaw Ave L 0.91 1,267,000
Enterprise Trail De Wolf Ave Dog Creek Trail L 2.61 3,626,000
Enterprise Trail Extension Enterprise Trail Enterprise Trail L 0.05 76,000
Greenbelt Path C Everglade Ave Locan Ave L 0.55 770,000
Greenbelt Path E Shepherd Ave Enterprise Trail L 0.15 205,000
Table 15: Proposed Class I Facilities with Priorities
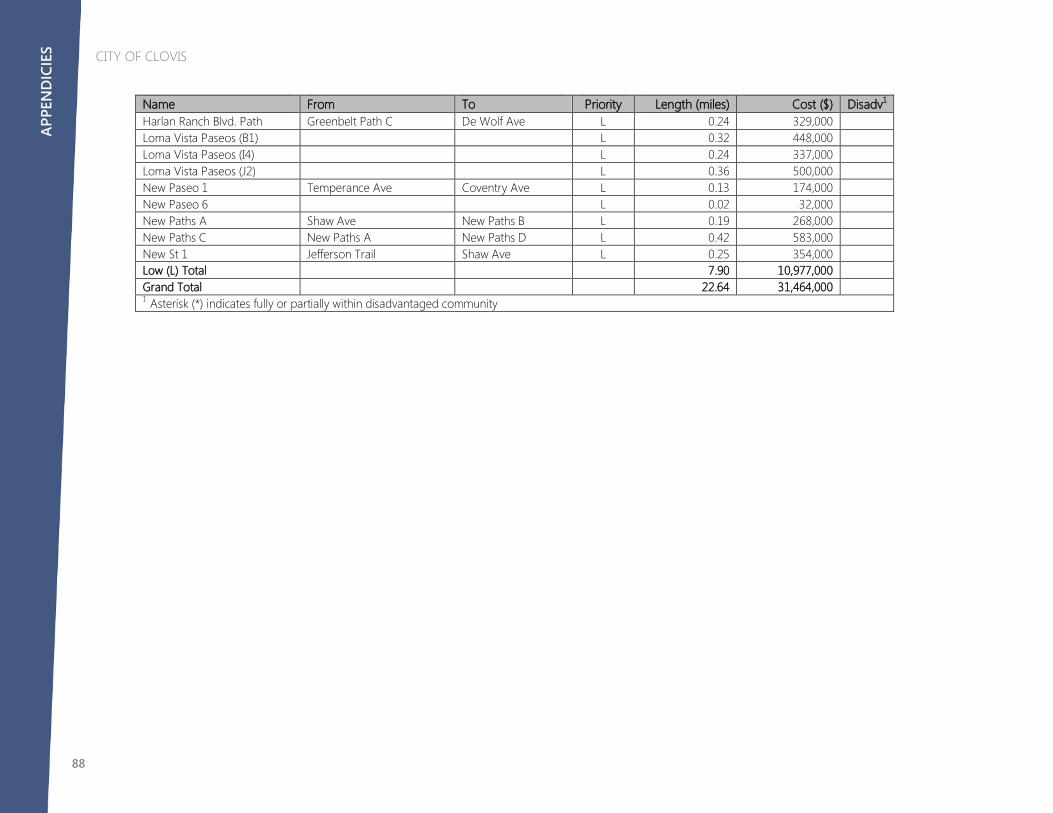
CITY OF CLOVIS
88
Name From To Priority Length (miles) Cost ($) Disadv1
Harlan Ranch Blvd. Path Greenbelt Path C De Wolf Ave L 0.24 329,000
Loma Vista Paseos (B1) L 0.32 448,000
Loma Vista Paseos (I4) L 0.24 337,000
Loma Vista Paseos (J2) L 0.36 500,000
New Paseo 1 Temperance Ave Coventry Ave L 0.13 174,000
New Paseo 6 L 0.02 32,000
New Paths A Shaw Ave New Paths B L 0.19 268,000
New Paths C New Paths A New Paths D L 0.42 583,000 New St 1 Jefferson Trail Shaw Ave L 0.25 354,000 Low (L) Total
7.90 10,977,000
Grand Total
22.64 31,464,000
1 Asterisk (*) indicates fully or partially within disadvantaged community
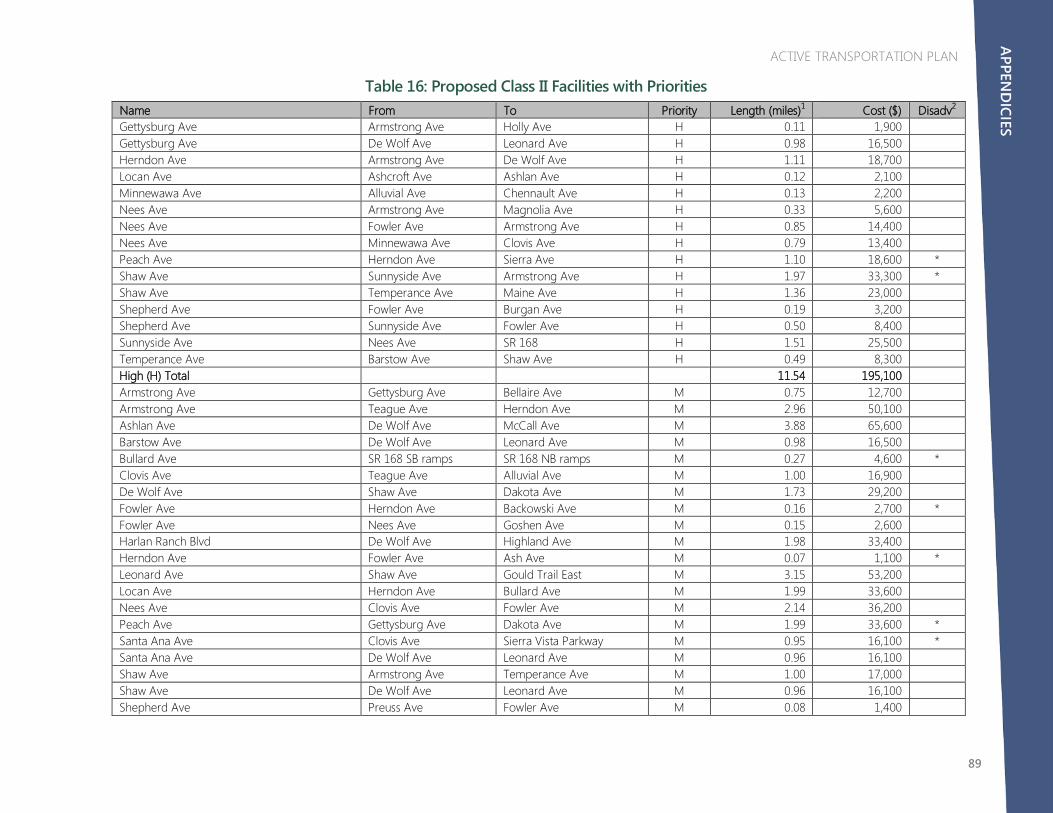
ACTIVE TRANSPORTATION PLAN
89
Name From To Priority Length (miles)1 Cost ($) Disadv2
Gettysburg Ave Armstrong Ave Holly Ave H 0.11 1,900
Gettysburg Ave De Wolf Ave Leonard Ave H 0.98 16,500
Herndon Ave Armstrong Ave De Wolf Ave H 1.11 18,700
Locan Ave Ashcroft Ave Ashlan Ave H 0.12 2,100
Minnewawa Ave Alluvial Ave Chennault Ave H 0.13 2,200
Nees Ave Armstrong Ave Magnolia Ave H 0.33 5,600
Nees Ave Fowler Ave Armstrong Ave H 0.85 14,400
Nees Ave Minnewawa Ave Clovis Ave H 0.79 13,400
Peach Ave Herndon Ave Sierra Ave H 1.10 18,600 * Shaw Ave Sunnyside Ave Armstrong Ave H 1.97 33,300 * Shaw Ave Temperance Ave Maine Ave H 1.36 23,000
Shepherd Ave Fowler Ave Burgan Ave H 0.19 3,200
Shepherd Ave Sunnyside Ave Fowler Ave H 0.50 8,400
Sunnyside Ave Nees Ave SR 168 H 1.51 25,500
Temperance Ave Barstow Ave Shaw Ave H 0.49 8,300
High (H) Total
11.54 195,100
Armstrong Ave Gettysburg Ave Bellaire Ave M 0.75 12,700
Armstrong Ave Teague Ave Herndon Ave M 2.96 50,100
Ashlan Ave De Wolf Ave McCall Ave M 3.88 65,600
Barstow Ave De Wolf Ave Leonard Ave M 0.98 16,500
Bullard Ave SR 168 SB ramps SR 168 NB ramps M 0.27 4,600 * Clovis Ave Teague Ave Alluvial Ave M 1.00 16,900
De Wolf Ave Shaw Ave Dakota Ave M 1.73 29,200
Fowler Ave Herndon Ave Backowski Ave M 0.16 2,700 * Fowler Ave Nees Ave Goshen Ave M 0.15 2,600 Harlan Ranch Blvd De Wolf Ave Highland Ave M 1.98 33,400
Herndon Ave Fowler Ave Ash Ave M 0.07 1,100 * Leonard Ave Shaw Ave Gould Trail East M 3.15 53,200
Locan Ave Herndon Ave Bullard Ave M 1.99 33,600
Nees Ave Clovis Ave Fowler Ave M 2.14 36,200
Peach Ave Gettysburg Ave Dakota Ave M 1.99 33,600 * Santa Ana Ave Clovis Ave Sierra Vista Parkway M 0.95 16,100 * Santa Ana Ave De Wolf Ave Leonard Ave M 0.96 16,100
Shaw Ave Armstrong Ave Temperance Ave M 1.00 17,000
Shaw Ave De Wolf Ave Leonard Ave M 0.96 16,100
Shepherd Ave Preuss Ave Fowler Ave M 0.08 1,400
Table 16: Proposed Class II Facilities with Priorities
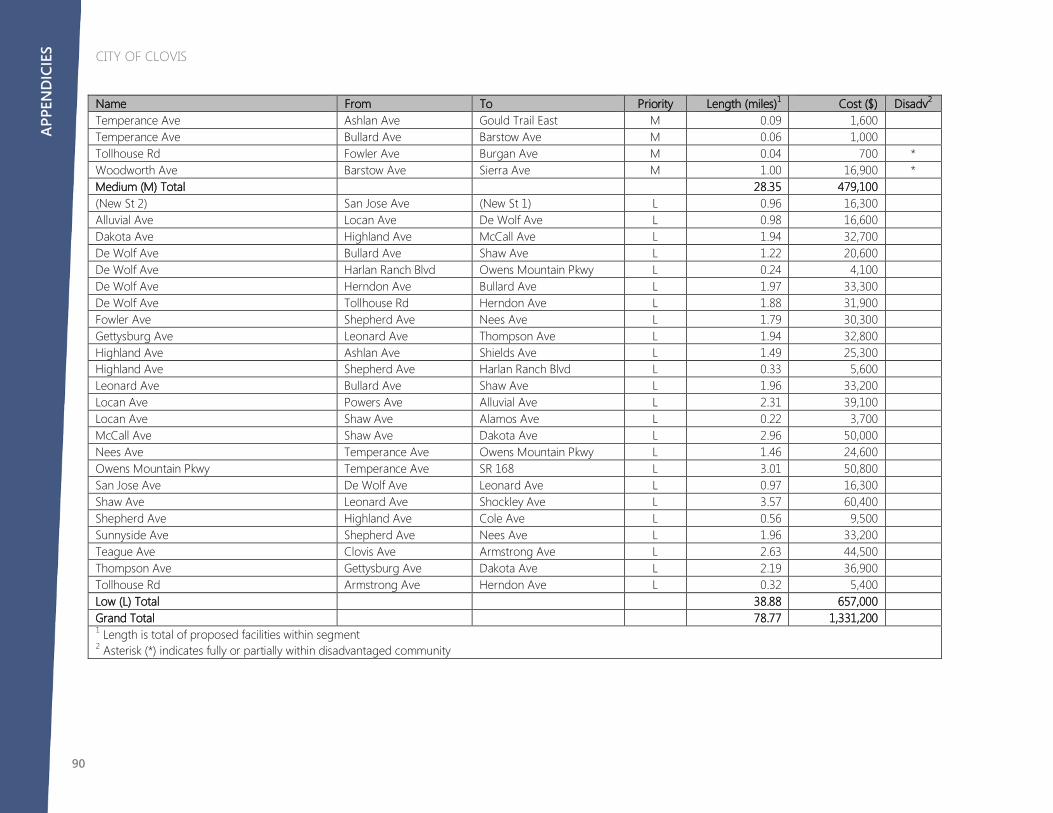
CITY OF CLOVIS
90
Name From To Priority Length (miles)1 Cost ($) Disadv2
Temperance Ave Ashlan Ave Gould Trail East M 0.09 1,600
Temperance Ave Bullard Ave Barstow Ave M 0.06 1,000
Tollhouse Rd Fowler Ave Burgan Ave M 0.04 700 * Woodworth Ave Barstow Ave Sierra Ave M 1.00 16,900 * Medium (M) Total
28.35 479,100
(New St 2) San Jose Ave (New St 1) L 0.96 16,300
Alluvial Ave Locan Ave De Wolf Ave L 0.98 16,600
Dakota Ave Highland Ave McCall Ave L 1.94 32,700
De Wolf Ave Bullard Ave Shaw Ave L 1.22 20,600
De Wolf Ave Harlan Ranch Blvd Owens Mountain Pkwy L 0.24 4,100
De Wolf Ave Herndon Ave Bullard Ave L 1.97 33,300
De Wolf Ave Tollhouse Rd Herndon Ave L 1.88 31,900
Fowler Ave Shepherd Ave Nees Ave L 1.79 30,300
Gettysburg Ave Leonard Ave Thompson Ave L 1.94 32,800 Highland Ave Ashlan Ave Shields Ave L 1.49 25,300 Highland Ave Shepherd Ave Harlan Ranch Blvd L 0.33 5,600
Leonard Ave Bullard Ave Shaw Ave L 1.96 33,200
Locan Ave Powers Ave Alluvial Ave L 2.31 39,100
Locan Ave Shaw Ave Alamos Ave L 0.22 3,700
McCall Ave Shaw Ave Dakota Ave L 2.96 50,000
Nees Ave Temperance Ave Owens Mountain Pkwy L 1.46 24,600
Owens Mountain Pkwy Temperance Ave SR 168 L 3.01 50,800
San Jose Ave De Wolf Ave Leonard Ave L 0.97 16,300
Shaw Ave Leonard Ave Shockley Ave L 3.57 60,400
Shepherd Ave Highland Ave Cole Ave L 0.56 9,500
Sunnyside Ave Shepherd Ave Nees Ave L 1.96 33,200
Teague Ave Clovis Ave Armstrong Ave L 2.63 44,500
Thompson Ave Gettysburg Ave Dakota Ave L 2.19 36,900
Tollhouse Rd Armstrong Ave Herndon Ave L 0.32 5,400
Low (L) Total
38.88 657,000
Grand Total
78.77 1,331,200
1 Length is total of proposed facilities within segment 2 Asterisk (*) indicates fully or partially within disadvantaged community
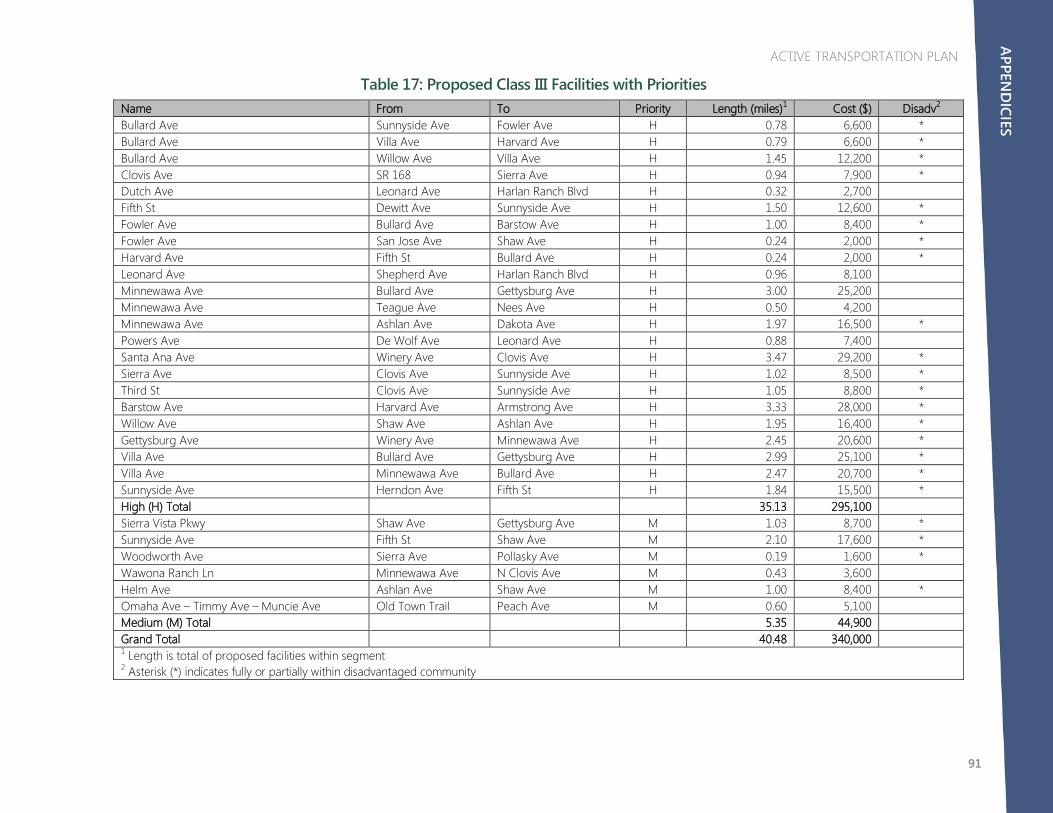
ACTIVE TRANSPORTATION PLAN
91
Name From To Priority Length (miles)1 Cost ($) Disadv2
Bullard Ave Sunnyside Ave Fowler Ave H 0.78 6,600 * Bullard Ave Villa Ave Harvard Ave H 0.79 6,600 * Bullard Ave Willow Ave Villa Ave H 1.45 12,200 * Clovis Ave SR 168 Sierra Ave H 0.94 7,900 * Dutch Ave Leonard Ave Harlan Ranch Blvd H 0.32 2,700 Fifth St Dewitt Ave Sunnyside Ave H 1.50 12,600 * Fowler Ave Bullard Ave Barstow Ave H 1.00 8,400 * Fowler Ave San Jose Ave Shaw Ave H 0.24 2,000 * Harvard Ave Fifth St Bullard Ave H 0.24 2,000 * Leonard Ave Shepherd Ave Harlan Ranch Blvd H 0.96 8,100 Minnewawa Ave Bullard Ave Gettysburg Ave H 3.00 25,200 Minnewawa Ave Teague Ave Nees Ave H 0.50 4,200 Minnewawa Ave Ashlan Ave Dakota Ave H 1.97 16,500 * Powers Ave De Wolf Ave Leonard Ave H 0.88 7,400 Santa Ana Ave Winery Ave Clovis Ave H 3.47 29,200 * Sierra Ave Clovis Ave Sunnyside Ave H 1.02 8,500 * Third St Clovis Ave Sunnyside Ave H 1.05 8,800 * Barstow Ave Harvard Ave Armstrong Ave H 3.33 28,000 * Willow Ave Shaw Ave Ashlan Ave H 1.95 16,400 * Gettysburg Ave Winery Ave Minnewawa Ave H 2.45 20,600 * Villa Ave Bullard Ave Gettysburg Ave H 2.99 25,100 * Villa Ave Minnewawa Ave Bullard Ave H 2.47 20,700 * Sunnyside Ave Herndon Ave Fifth St H 1.84 15,500 * High (H) Total
35.13 295,100
Sierra Vista Pkwy Shaw Ave Gettysburg Ave M 1.03 8,700 * Sunnyside Ave Fifth St Shaw Ave M 2.10 17,600 * Woodworth Ave Sierra Ave Pollasky Ave M 0.19 1,600 * Wawona Ranch Ln Minnewawa Ave N Clovis Ave M 0.43 3,600 Helm Ave Ashlan Ave Shaw Ave M 1.00 8,400 * Omaha Ave – Timmy Ave – Muncie Ave Old Town Trail Peach Ave M 0.60 5,100 Medium (M) Total
5.35 44,900
Grand Total
40.48 340,000 1 Length is total of proposed facilities within segment 2 Asterisk (*) indicates fully or partially within disadvantaged community
Table 17: Proposed Class III Facilities with Priorities
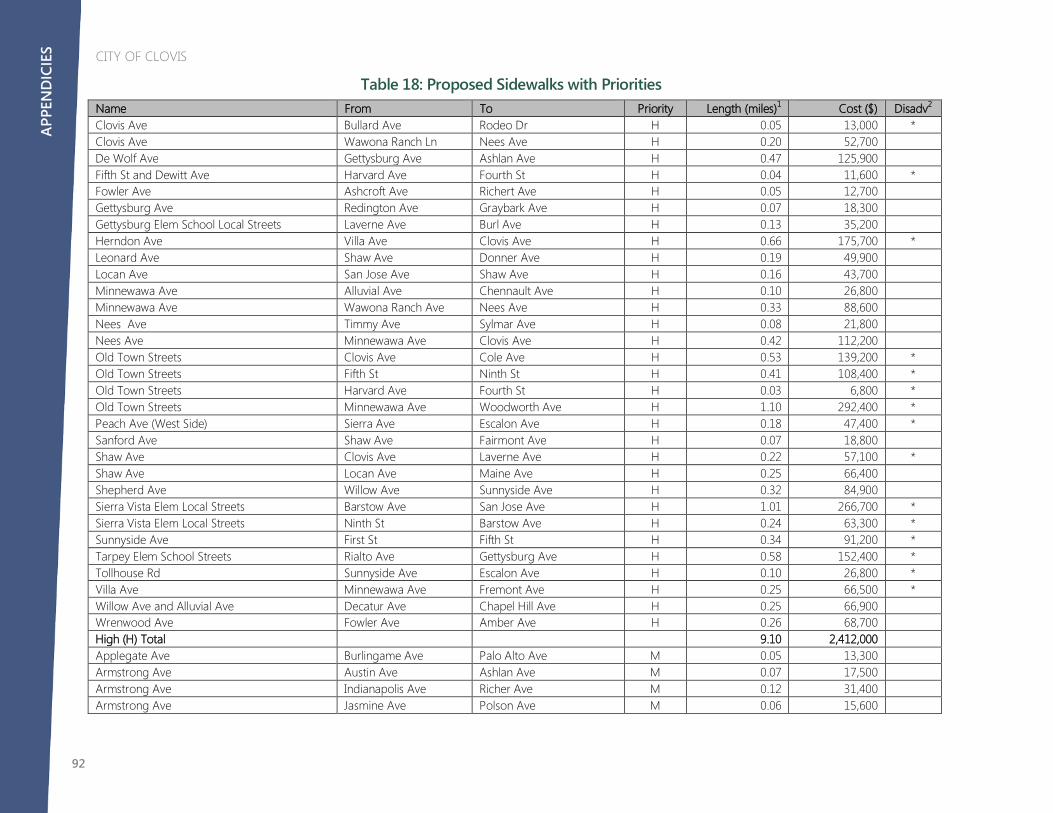
CITY OF CLOVIS
92
Name From To Priority Length (miles)1 Cost ($) Disadv2
Clovis Ave Bullard Ave Rodeo Dr H 0.05 13,000 * Clovis Ave Wawona Ranch Ln Nees Ave H 0.20 52,700
De Wolf Ave Gettysburg Ave Ashlan Ave H 0.47 125,900 Fifth St and Dewitt Ave Harvard Ave Fourth St H 0.04 11,600 * Fowler Ave Ashcroft Ave Richert Ave H 0.05 12,700
Gettysburg Ave Redington Ave Graybark Ave H 0.07 18,300
Gettysburg Elem School Local Streets Laverne Ave Burl Ave H 0.13 35,200
Herndon Ave Villa Ave Clovis Ave H 0.66 175,700 * Leonard Ave Shaw Ave Donner Ave H 0.19 49,900
Locan Ave San Jose Ave Shaw Ave H 0.16 43,700
Minnewawa Ave Alluvial Ave Chennault Ave H 0.10 26,800
Minnewawa Ave Wawona Ranch Ave Nees Ave H 0.33 88,600
Nees Ave Timmy Ave Sylmar Ave H 0.08 21,800
Nees Ave Minnewawa Ave Clovis Ave H 0.42 112,200
Old Town Streets Clovis Ave Cole Ave H 0.53 139,200 * Old Town Streets Fifth St Ninth St H 0.41 108,400 * Old Town Streets Harvard Ave Fourth St H 0.03 6,800 * Old Town Streets Minnewawa Ave Woodworth Ave H 1.10 292,400 * Peach Ave (West Side) Sierra Ave Escalon Ave H 0.18 47,400 * Sanford Ave Shaw Ave Fairmont Ave H 0.07 18,800
Shaw Ave Clovis Ave Laverne Ave H 0.22 57,100 * Shaw Ave Locan Ave Maine Ave H 0.25 66,400
Shepherd Ave Willow Ave Sunnyside Ave H 0.32 84,900
Sierra Vista Elem Local Streets Barstow Ave San Jose Ave H 1.01 266,700 * Sierra Vista Elem Local Streets Ninth St Barstow Ave H 0.24 63,300 * Sunnyside Ave First St Fifth St H 0.34 91,200 * Tarpey Elem School Streets Rialto Ave Gettysburg Ave H 0.58 152,400 * Tollhouse Rd Sunnyside Ave Escalon Ave H 0.10 26,800 * Villa Ave Minnewawa Ave Fremont Ave H 0.25 66,500 * Willow Ave and Alluvial Ave Decatur Ave Chapel Hill Ave H 0.25 66,900 Wrenwood Ave Fowler Ave Amber Ave H 0.26 68,700
High (H) Total
9.10 2,412,000
Applegate Ave Burlingame Ave Palo Alto Ave M 0.05 13,300
Armstrong Ave Austin Ave Ashlan Ave M 0.07 17,500
Armstrong Ave Indianapolis Ave Richer Ave M 0.12 31,400
Armstrong Ave Jasmine Ave Polson Ave M 0.06 15,600
Table 18: Proposed Sidewalks with Priorities
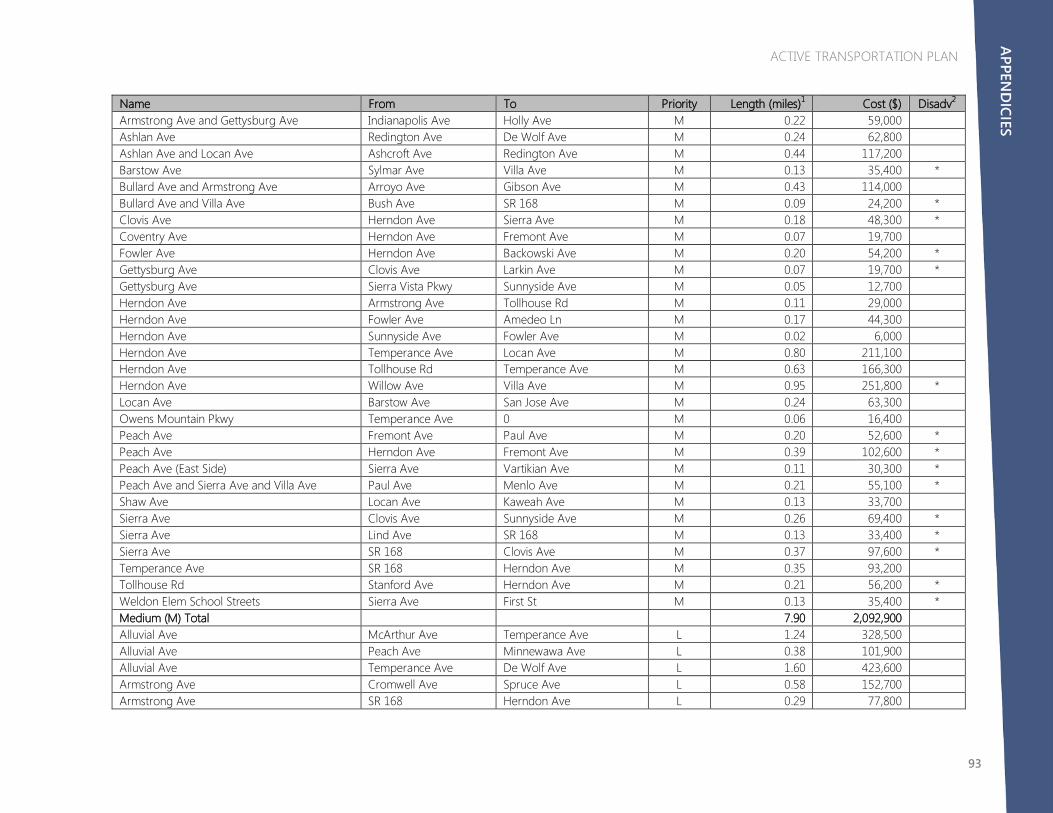
ACTIVE TRANSPORTATION PLAN
93
Name From To Priority Length (miles)1 Cost ($) Disadv2
Armstrong Ave and Gettysburg Ave Indianapolis Ave Holly Ave M 0.22 59,000
Ashlan Ave Redington Ave De Wolf Ave M 0.24 62,800
Ashlan Ave and Locan Ave Ashcroft Ave Redington Ave M 0.44 117,200
Barstow Ave Sylmar Ave Villa Ave M 0.13 35,400 * Bullard Ave and Armstrong Ave Arroyo Ave Gibson Ave M 0.43 114,000
Bullard Ave and Villa Ave Bush Ave SR 168 M 0.09 24,200 * Clovis Ave Herndon Ave Sierra Ave M 0.18 48,300 * Coventry Ave Herndon Ave Fremont Ave M 0.07 19,700
Fowler Ave Herndon Ave Backowski Ave M 0.20 54,200 * Gettysburg Ave Clovis Ave Larkin Ave M 0.07 19,700 * Gettysburg Ave Sierra Vista Pkwy Sunnyside Ave M 0.05 12,700
Herndon Ave Armstrong Ave Tollhouse Rd M 0.11 29,000
Herndon Ave Fowler Ave Amedeo Ln M 0.17 44,300
Herndon Ave Sunnyside Ave Fowler Ave M 0.02 6,000 Herndon Ave Temperance Ave Locan Ave M 0.80 211,100 Herndon Ave Tollhouse Rd Temperance Ave M 0.63 166,300
Herndon Ave Willow Ave Villa Ave M 0.95 251,800 * Locan Ave Barstow Ave San Jose Ave M 0.24 63,300
Owens Mountain Pkwy Temperance Ave 0 M 0.06 16,400
Peach Ave Fremont Ave Paul Ave M 0.20 52,600 * Peach Ave Herndon Ave Fremont Ave M 0.39 102,600 * Peach Ave (East Side) Sierra Ave Vartikian Ave M 0.11 30,300 * Peach Ave and Sierra Ave and Villa Ave Paul Ave Menlo Ave M 0.21 55,100 * Shaw Ave Locan Ave Kaweah Ave M 0.13 33,700
Sierra Ave Clovis Ave Sunnyside Ave M 0.26 69,400 * Sierra Ave Lind Ave SR 168 M 0.13 33,400 * Sierra Ave SR 168 Clovis Ave M 0.37 97,600 * Temperance Ave SR 168 Herndon Ave M 0.35 93,200
Tollhouse Rd Stanford Ave Herndon Ave M 0.21 56,200 * Weldon Elem School Streets Sierra Ave First St M 0.13 35,400 * Medium (M) Total
7.90 2,092,900
Alluvial Ave McArthur Ave Temperance Ave L 1.24 328,500 Alluvial Ave Peach Ave Minnewawa Ave L 0.38 101,900 Alluvial Ave Temperance Ave De Wolf Ave L 1.60 423,600 Armstrong Ave Cromwell Ave Spruce Ave L 0.58 152,700 Armstrong Ave SR 168 Herndon Ave L 0.29 77,800
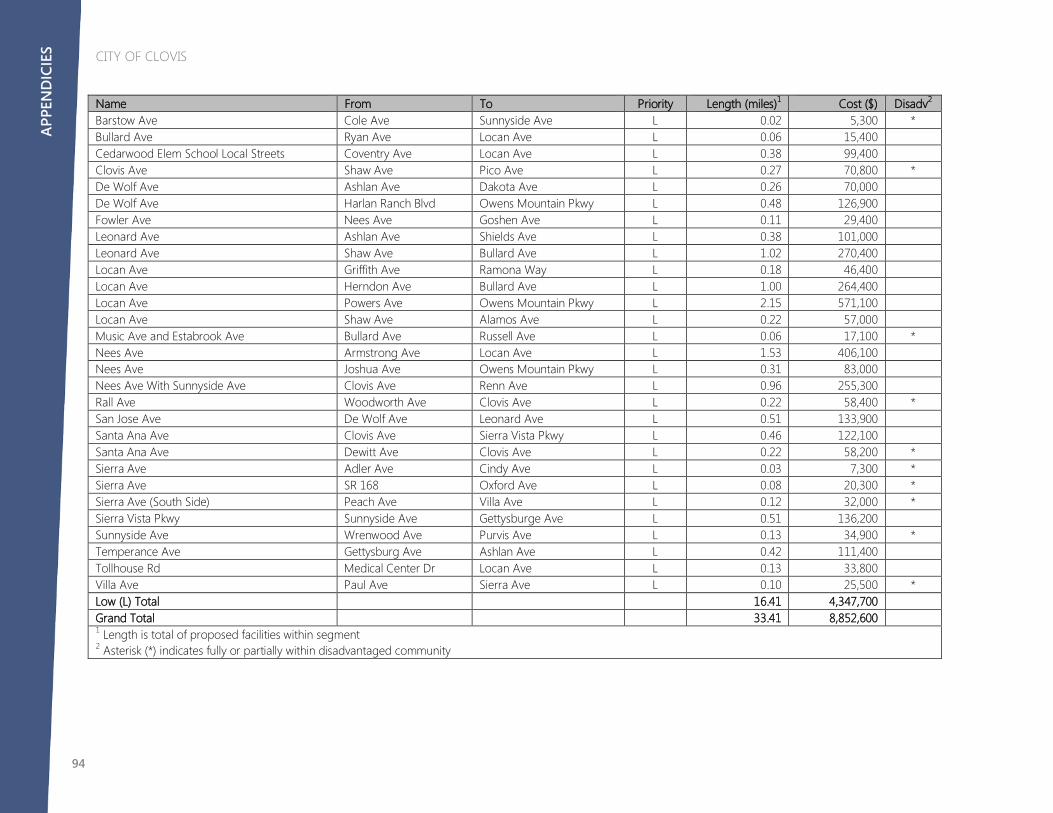
CITY OF CLOVIS
94
Name From To Priority Length (miles)1 Cost ($) Disadv2
Barstow Ave Cole Ave Sunnyside Ave L 0.02 5,300 * Bullard Ave Ryan Ave Locan Ave L 0.06 15,400 Cedarwood Elem School Local Streets Coventry Ave Locan Ave L 0.38 99,400 Clovis Ave Shaw Ave Pico Ave L 0.27 70,800 * De Wolf Ave Ashlan Ave Dakota Ave L 0.26 70,000 De Wolf Ave Harlan Ranch Blvd Owens Mountain Pkwy L 0.48 126,900 Fowler Ave Nees Ave Goshen Ave L 0.11 29,400 Leonard Ave Ashlan Ave Shields Ave L 0.38 101,000 Leonard Ave Shaw Ave Bullard Ave L 1.02 270,400 Locan Ave Griffith Ave Ramona Way L 0.18 46,400 Locan Ave Herndon Ave Bullard Ave L 1.00 264,400 Locan Ave Powers Ave Owens Mountain Pkwy L 2.15 571,100 Locan Ave Shaw Ave Alamos Ave L 0.22 57,000 Music Ave and Estabrook Ave Bullard Ave Russell Ave L 0.06 17,100 * Nees Ave Armstrong Ave Locan Ave L 1.53 406,100 Nees Ave Joshua Ave Owens Mountain Pkwy L 0.31 83,000 Nees Ave With Sunnyside Ave Clovis Ave Renn Ave L 0.96 255,300 Rall Ave Woodworth Ave Clovis Ave L 0.22 58,400 * San Jose Ave De Wolf Ave Leonard Ave L 0.51 133,900 Santa Ana Ave Clovis Ave Sierra Vista Pkwy L 0.46 122,100 Santa Ana Ave Dewitt Ave Clovis Ave L 0.22 58,200 * Sierra Ave Adler Ave Cindy Ave L 0.03 7,300 * Sierra Ave SR 168 Oxford Ave L 0.08 20,300 * Sierra Ave (South Side) Peach Ave Villa Ave L 0.12 32,000 * Sierra Vista Pkwy Sunnyside Ave Gettysburge Ave L 0.51 136,200 Sunnyside Ave Wrenwood Ave Purvis Ave L 0.13 34,900 * Temperance Ave Gettysburg Ave Ashlan Ave L 0.42 111,400 Tollhouse Rd Medical Center Dr Locan Ave L 0.13 33,800 Villa Ave Paul Ave Sierra Ave L 0.10 25,500 * Low (L) Total 16.41 4,347,700 Grand Total
33.41 8,852,600
1 Length is total of proposed facilities within segment 2 Asterisk (*) indicates fully or partially within disadvantaged community
CITY OF COALINGA ACTIVE TRANSPORTATION
PLAN2017
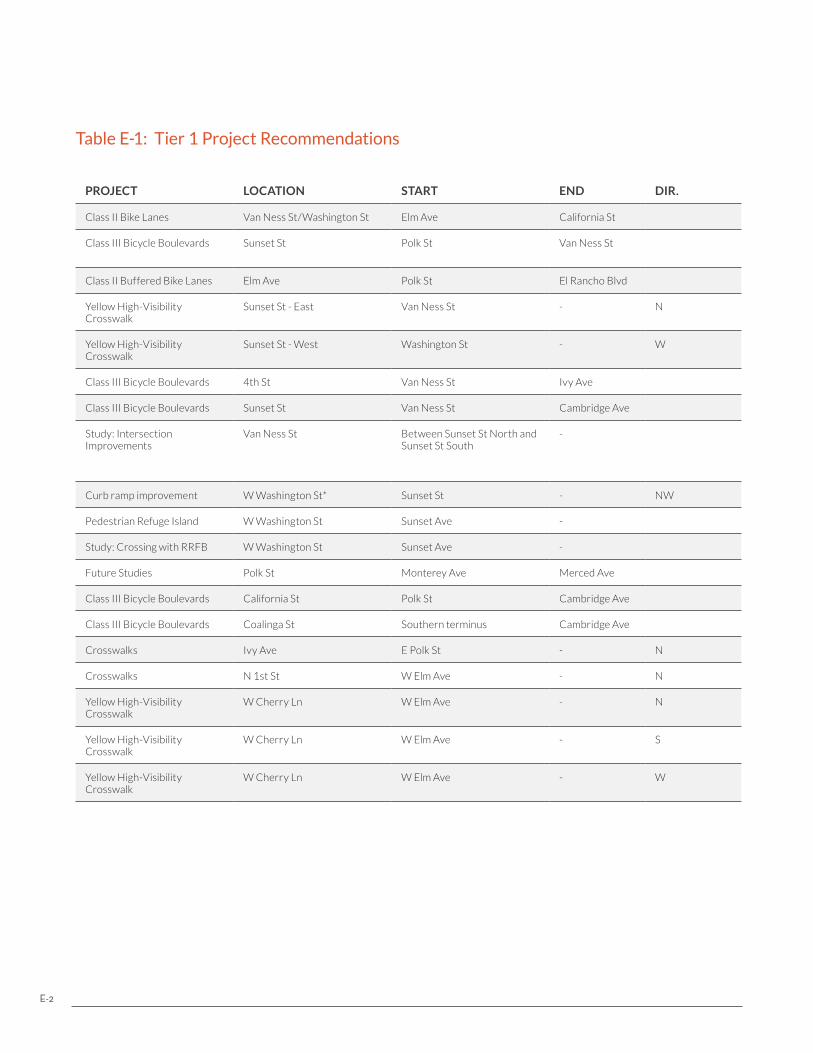
Table E-1: Tier 1 Project Recommendations
PROJECT LOCATION START END DIR. NOTESREAD- INESS SAFETY
ACTIVITY GENERATOR
MAIN- TENANCE
TOTAL SCORE
LENGTH (FEET)
COST ESTIMATE
Class II Bike Lanes Van Ness St/Washington St Elm Ave California St 35 25 25 15 100 2710.1 $5,400
Class III Bicycle Boulevards Sunset St Polk St Van Ness St Consider roundabout at 5th St/Birch Ave
35 25 25 15 100 2611.3 $700
Class II Buffered Bike Lanes Elm Ave Polk St El Rancho Blvd 35 25 25 15 100 8336.1 $50,000
Yellow High-Visibility Crosswalk
Sunset St - East Van Ness St - N Existing faded transverse markings
35 16 25 15 91 54.0 $1,100
Yellow High-Visibility Crosswalk
Sunset St - West Washington St - W Existing faded transverse markings
35 16 25 15 91 76.9 $1,600
Class III Bicycle Boulevards 4th St Van Ness St Ivy Ave 35 16 25 15 91 3354.2 $800
Class III Bicycle Boulevards Sunset St Van Ness St Cambridge Ave 35 16 25 15 91 2603.5 $700
Study: Intersection Improvements
Van Ness St Between Sunset St North and Sunset St South
- Chaotic close-set and irregular intersections, very challenging at school dismissal
35 25 25 0 85 - $20,000
Curb ramp improvement W Washington St* Sunset St - NW 35 25 25 0 85 - $1,000
Pedestrian Refuge Island W Washington St Sunset Ave - 35 25 25 0 85 - $15,000
Study: Crossing with RRFB W Washington St Sunset Ave - 35 25 25 0 85 - $20,000
Future Studies Polk St Monterey Ave Merced Ave 35 25 25 0 85 8474.9 $20,000
Class III Bicycle Boulevards California St Polk St Cambridge Ave 35 8 25 15 83 5281.3 $1,300
Class III Bicycle Boulevards Coalinga St Southern terminus Cambridge Ave 35 8 25 15 83 7921.1 $2,000
Crosswalks Ivy Ave E Polk St - N 35 8 25 15 83 96.6 $700
Crosswalks N 1st St W Elm Ave - N 35 8 25 15 83 110.7 $800
Yellow High-Visibility Crosswalk
W Cherry Ln W Elm Ave - N 35 8 25 15 83 73.8 $1,500
Yellow High-Visibility Crosswalk
W Cherry Ln W Elm Ave - S 35 8 25 15 83 69.5 $1,400
Yellow High-Visibility Crosswalk
W Cherry Ln W Elm Ave - W 35 8 25 15 83 81.4 $1,700
E-2
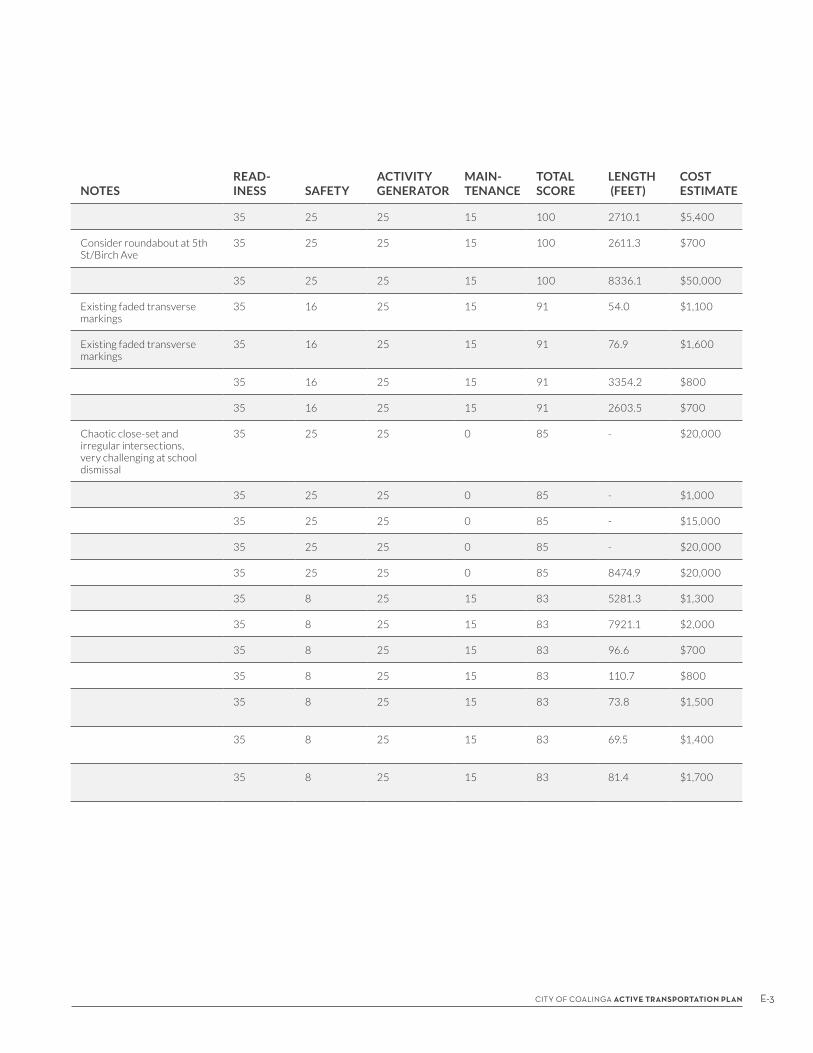
Table E-1: Tier 1 Project Recommendations
PROJECT LOCATION START END DIR. NOTESREAD- INESS SAFETY
ACTIVITY GENERATOR
MAIN- TENANCE
TOTAL SCORE
LENGTH (FEET)
COST ESTIMATE
Class II Bike Lanes Van Ness St/Washington St Elm Ave California St 35 25 25 15 100 2710.1 $5,400
Class III Bicycle Boulevards Sunset St Polk St Van Ness St Consider roundabout at 5th St/Birch Ave
35 25 25 15 100 2611.3 $700
Class II Buffered Bike Lanes Elm Ave Polk St El Rancho Blvd 35 25 25 15 100 8336.1 $50,000
Yellow High-Visibility Crosswalk
Sunset St - East Van Ness St - N Existing faded transverse markings
35 16 25 15 91 54.0 $1,100
Yellow High-Visibility Crosswalk
Sunset St - West Washington St - W Existing faded transverse markings
35 16 25 15 91 76.9 $1,600
Class III Bicycle Boulevards 4th St Van Ness St Ivy Ave 35 16 25 15 91 3354.2 $800
Class III Bicycle Boulevards Sunset St Van Ness St Cambridge Ave 35 16 25 15 91 2603.5 $700
Study: Intersection Improvements
Van Ness St Between Sunset St North and Sunset St South
- Chaotic close-set and irregular intersections, very challenging at school dismissal
35 25 25 0 85 - $20,000
Curb ramp improvement W Washington St* Sunset St - NW 35 25 25 0 85 - $1,000
Pedestrian Refuge Island W Washington St Sunset Ave - 35 25 25 0 85 - $15,000
Study: Crossing with RRFB W Washington St Sunset Ave - 35 25 25 0 85 - $20,000
Future Studies Polk St Monterey Ave Merced Ave 35 25 25 0 85 8474.9 $20,000
Class III Bicycle Boulevards California St Polk St Cambridge Ave 35 8 25 15 83 5281.3 $1,300
Class III Bicycle Boulevards Coalinga St Southern terminus Cambridge Ave 35 8 25 15 83 7921.1 $2,000
Crosswalks Ivy Ave E Polk St - N 35 8 25 15 83 96.6 $700
Crosswalks N 1st St W Elm Ave - N 35 8 25 15 83 110.7 $800
Yellow High-Visibility Crosswalk
W Cherry Ln W Elm Ave - N 35 8 25 15 83 73.8 $1,500
Yellow High-Visibility Crosswalk
W Cherry Ln W Elm Ave - S 35 8 25 15 83 69.5 $1,400
Yellow High-Visibility Crosswalk
W Cherry Ln W Elm Ave - W 35 8 25 15 83 81.4 $1,700
E-3CITY OF COALINGA ACTIVE TRANSPORTATION PLAN
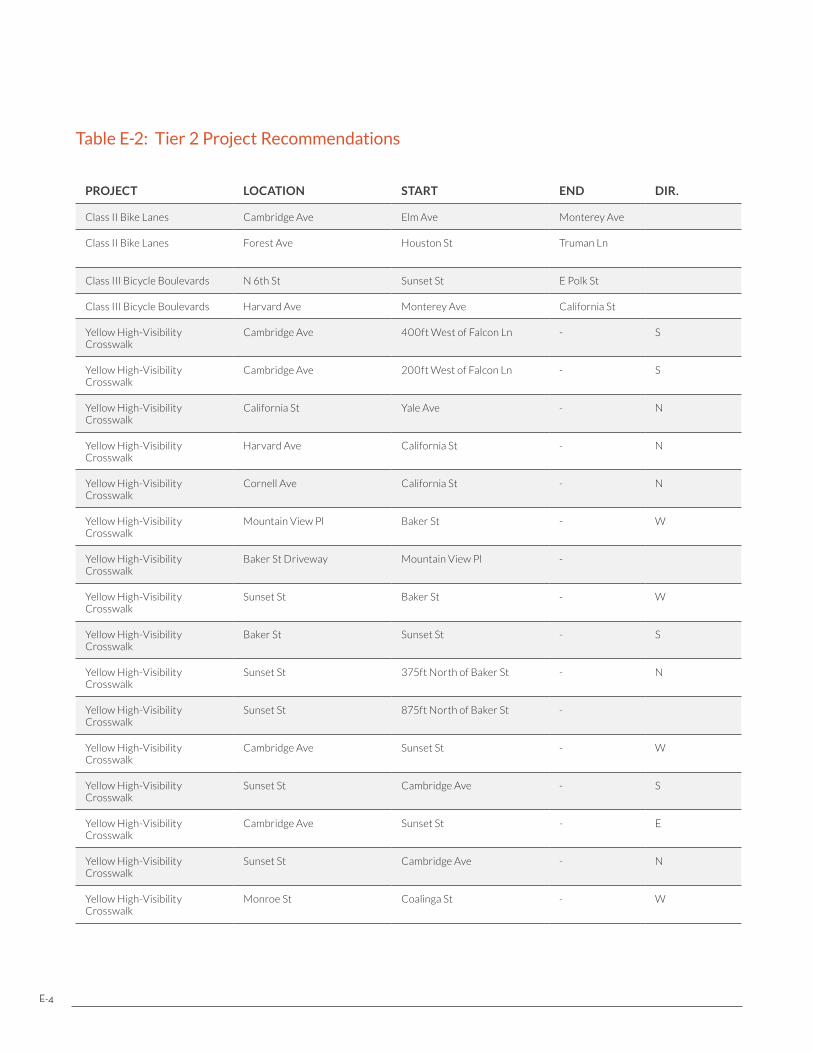
Table E-2: Tier 2 Project Recommendations
PROJECT LOCATION START END DIR. NOTESREAD- INESS SAFETY
ACTIVITY GENERATOR
MAIN- TENANCE
TOTAL SCORE
LENGTH (FEET)
COST ESTIMATE
Class II Bike Lanes Cambridge Ave Elm Ave Monterey Ave Stripe right side of bike lane 35 0 25 15 75 5293.8 $10,600
Class II Bike Lanes Forest Ave Houston St Truman Ln Alternate route to SR 198/33; 60' curb to curb.
35 0 25 15 75 4762.9 $9,500
Class III Bicycle Boulevards N 6th St Sunset St E Polk St 35 0 25 15 75 2261.8 $600
Class III Bicycle Boulevards Harvard Ave Monterey Ave California St 35 0 25 15 75 1990.4 $500
Yellow High-Visibility Crosswalk
Cambridge Ave 400ft West of Falcon Ln - S 35 0 25 15 75 35.2 $700
Yellow High-Visibility Crosswalk
Cambridge Ave 200ft West of Falcon Ln - S 35 0 25 15 75 38.8 $800
Yellow High-Visibility Crosswalk
California St Yale Ave - N 35 0 25 15 75 36.2 $700
Yellow High-Visibility Crosswalk
Harvard Ave California St - N 35 0 25 15 75 36.4 $700
Yellow High-Visibility Crosswalk
Cornell Ave California St - N 35 0 25 15 75 39.9 $800
Yellow High-Visibility Crosswalk
Mountain View Pl Baker St - W 35 0 25 15 75 41.8 $900
Yellow High-Visibility Crosswalk
Baker St Driveway Mountain View Pl - 35 0 25 15 75 21.1 $400
Yellow High-Visibility Crosswalk
Sunset St Baker St - W 35 0 25 15 75 52.9 $1,100
Yellow High-Visibility Crosswalk
Baker St Sunset St - S 35 0 25 15 75 40.4 $800
Yellow High-Visibility Crosswalk
Sunset St 375ft North of Baker St - N 35 0 25 15 75 33.8 $700
Yellow High-Visibility Crosswalk
Sunset St 875ft North of Baker St - 35 0 25 15 75 38.5 $800
Yellow High-Visibility Crosswalk
Cambridge Ave Sunset St - W 35 0 25 15 75 65.4 $1,300
Yellow High-Visibility Crosswalk
Sunset St Cambridge Ave - S 35 0 25 15 75 43.1 $900
Yellow High-Visibility Crosswalk
Cambridge Ave Sunset St - E 35 0 25 15 75 58.6 $1,200
Yellow High-Visibility Crosswalk
Sunset St Cambridge Ave - N 35 0 25 15 75 46.9 $1,000
Yellow High-Visibility Crosswalk
Monroe St Coalinga St - W 35 0 25 15 75 48.0 $1,000
E-4

Table E-2: Tier 2 Project Recommendations
PROJECT LOCATION START END DIR. NOTESREAD- INESS SAFETY
ACTIVITY GENERATOR
MAIN- TENANCE
TOTAL SCORE
LENGTH (FEET)
COST ESTIMATE
Class II Bike Lanes Cambridge Ave Elm Ave Monterey Ave Stripe right side of bike lane 35 0 25 15 75 5293.8 $10,600
Class II Bike Lanes Forest Ave Houston St Truman Ln Alternate route to SR 198/33; 60' curb to curb.
35 0 25 15 75 4762.9 $9,500
Class III Bicycle Boulevards N 6th St Sunset St E Polk St 35 0 25 15 75 2261.8 $600
Class III Bicycle Boulevards Harvard Ave Monterey Ave California St 35 0 25 15 75 1990.4 $500
Yellow High-Visibility Crosswalk
Cambridge Ave 400ft West of Falcon Ln - S 35 0 25 15 75 35.2 $700
Yellow High-Visibility Crosswalk
Cambridge Ave 200ft West of Falcon Ln - S 35 0 25 15 75 38.8 $800
Yellow High-Visibility Crosswalk
California St Yale Ave - N 35 0 25 15 75 36.2 $700
Yellow High-Visibility Crosswalk
Harvard Ave California St - N 35 0 25 15 75 36.4 $700
Yellow High-Visibility Crosswalk
Cornell Ave California St - N 35 0 25 15 75 39.9 $800
Yellow High-Visibility Crosswalk
Mountain View Pl Baker St - W 35 0 25 15 75 41.8 $900
Yellow High-Visibility Crosswalk
Baker St Driveway Mountain View Pl - 35 0 25 15 75 21.1 $400
Yellow High-Visibility Crosswalk
Sunset St Baker St - W 35 0 25 15 75 52.9 $1,100
Yellow High-Visibility Crosswalk
Baker St Sunset St - S 35 0 25 15 75 40.4 $800
Yellow High-Visibility Crosswalk
Sunset St 375ft North of Baker St - N 35 0 25 15 75 33.8 $700
Yellow High-Visibility Crosswalk
Sunset St 875ft North of Baker St - 35 0 25 15 75 38.5 $800
Yellow High-Visibility Crosswalk
Cambridge Ave Sunset St - W 35 0 25 15 75 65.4 $1,300
Yellow High-Visibility Crosswalk
Sunset St Cambridge Ave - S 35 0 25 15 75 43.1 $900
Yellow High-Visibility Crosswalk
Cambridge Ave Sunset St - E 35 0 25 15 75 58.6 $1,200
Yellow High-Visibility Crosswalk
Sunset St Cambridge Ave - N 35 0 25 15 75 46.9 $1,000
Yellow High-Visibility Crosswalk
Monroe St Coalinga St - W 35 0 25 15 75 48.0 $1,000
E-5CITY OF COALINGA ACTIVE TRANSPORTATION PLAN
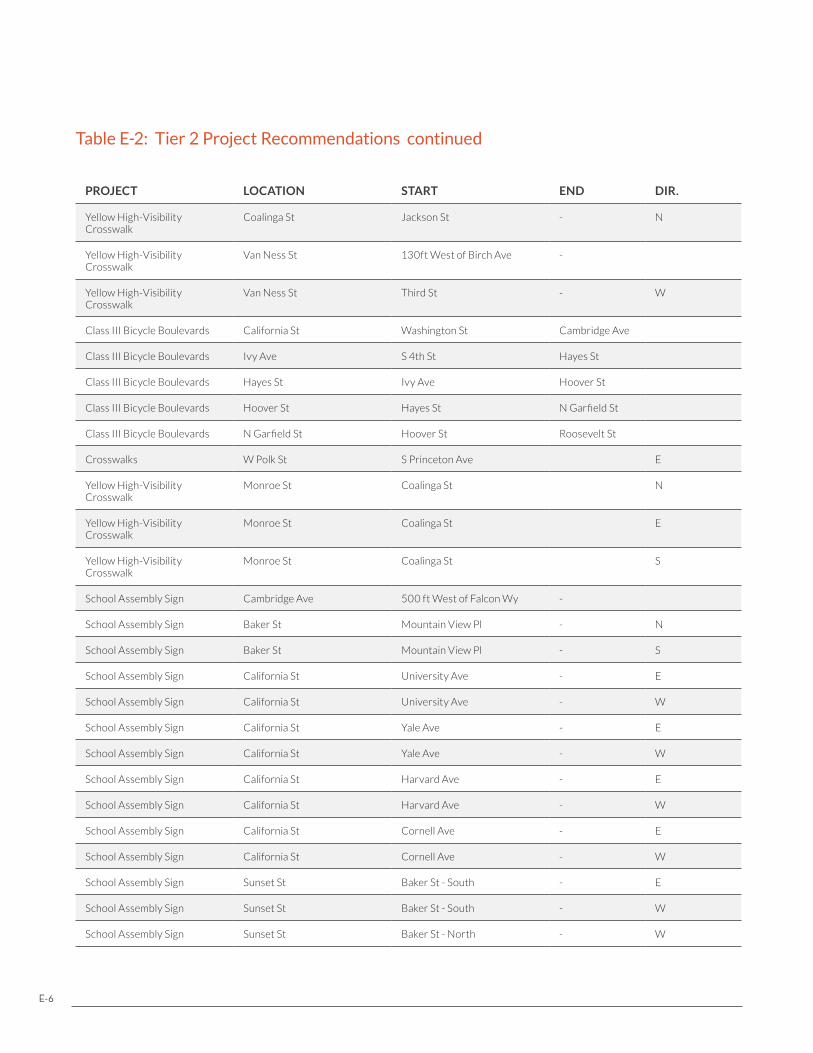
Table E-2: Tier 2 Project Recommendations
PROJECT LOCATION START END DIR. NOTESREAD- INESS SAFETY
ACTIVITY GENERATOR
MAIN- TENANCE
TOTAL SCORE
LENGTH (FEET)
COST ESTIMATE
Yellow High-Visibility Crosswalk
Coalinga St Jackson St - N 35 0 25 15 75 41.0 $800
Yellow High-Visibility Crosswalk
Van Ness St 130ft West of Birch Ave - Existing faded transverse markings
35 0 25 15 75 47.6 $1,000
Yellow High-Visibility Crosswalk
Van Ness St Third St - W Existing faded irregular crosswalk markings
35 0 25 15 75 44.5 $900
Class III Bicycle Boulevards California St Washington St Cambridge Ave 35 0 25 15 75 2611.4 $700
Class III Bicycle Boulevards Ivy Ave S 4th St Hayes St 35 0 25 15 75 204.5 $100
Class III Bicycle Boulevards Hayes St Ivy Ave Hoover St 35 0 25 15 75 57.7 $100
Class III Bicycle Boulevards Hoover St Hayes St N Garfield St 35 0 25 15 75 1454.9 $400
Class III Bicycle Boulevards N Garfield St Hoover St Roosevelt St 35 0 25 15 75 754.6 $200
Crosswalks W Polk St S Princeton Ave E 35 0 25 15 75 47.0 $400
Yellow High-Visibility Crosswalk
Monroe St Coalinga St N 35 0 25 15 75 48.6 $1,000
Yellow High-Visibility Crosswalk
Monroe St Coalinga St E 35 0 25 15 75 49.5 $1,000
Yellow High-Visibility Crosswalk
Monroe St Coalinga St S 35 0 25 15 75 47.9 $1,000
School Assembly Sign Cambridge Ave 500 ft West of Falcon Wy - 35 0 25 15 75 - $500
School Assembly Sign Baker St Mountain View Pl - N 35 0 25 15 75 - $500
School Assembly Sign Baker St Mountain View Pl - S 35 0 25 15 75 - $500
School Assembly Sign California St University Ave - E 35 0 25 15 75 - $500
School Assembly Sign California St University Ave - W 35 0 25 15 75 - $500
School Assembly Sign California St Yale Ave - E 35 0 25 15 75 - $500
School Assembly Sign California St Yale Ave - W 35 0 25 15 75 - $500
School Assembly Sign California St Harvard Ave - E 35 0 25 15 75 - $500
School Assembly Sign California St Harvard Ave - W 35 0 25 15 75 - $500
School Assembly Sign California St Cornell Ave - E 35 0 25 15 75 - $500
School Assembly Sign California St Cornell Ave - W 35 0 25 15 75 - $500
School Assembly Sign Sunset St Baker St - South - E 35 0 25 15 75 - $500
School Assembly Sign Sunset St Baker St - South - W 35 0 25 15 75 - $500
School Assembly Sign Sunset St Baker St - North - W 35 0 25 15 75 - $500
continued
E-6
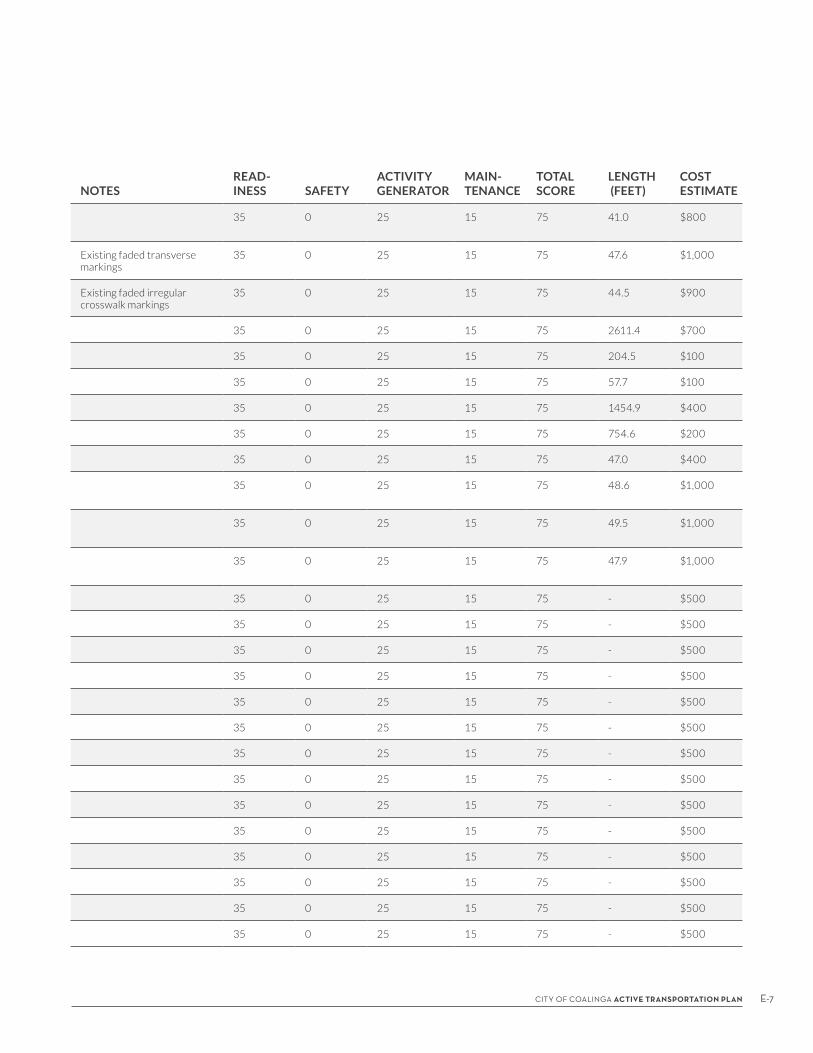
Table E-2: Tier 2 Project Recommendations
PROJECT LOCATION START END DIR. NOTESREAD- INESS SAFETY
ACTIVITY GENERATOR
MAIN- TENANCE
TOTAL SCORE
LENGTH (FEET)
COST ESTIMATE
Yellow High-Visibility Crosswalk
Coalinga St Jackson St - N 35 0 25 15 75 41.0 $800
Yellow High-Visibility Crosswalk
Van Ness St 130ft West of Birch Ave - Existing faded transverse markings
35 0 25 15 75 47.6 $1,000
Yellow High-Visibility Crosswalk
Van Ness St Third St - W Existing faded irregular crosswalk markings
35 0 25 15 75 44.5 $900
Class III Bicycle Boulevards California St Washington St Cambridge Ave 35 0 25 15 75 2611.4 $700
Class III Bicycle Boulevards Ivy Ave S 4th St Hayes St 35 0 25 15 75 204.5 $100
Class III Bicycle Boulevards Hayes St Ivy Ave Hoover St 35 0 25 15 75 57.7 $100
Class III Bicycle Boulevards Hoover St Hayes St N Garfield St 35 0 25 15 75 1454.9 $400
Class III Bicycle Boulevards N Garfield St Hoover St Roosevelt St 35 0 25 15 75 754.6 $200
Crosswalks W Polk St S Princeton Ave E 35 0 25 15 75 47.0 $400
Yellow High-Visibility Crosswalk
Monroe St Coalinga St N 35 0 25 15 75 48.6 $1,000
Yellow High-Visibility Crosswalk
Monroe St Coalinga St E 35 0 25 15 75 49.5 $1,000
Yellow High-Visibility Crosswalk
Monroe St Coalinga St S 35 0 25 15 75 47.9 $1,000
School Assembly Sign Cambridge Ave 500 ft West of Falcon Wy - 35 0 25 15 75 - $500
School Assembly Sign Baker St Mountain View Pl - N 35 0 25 15 75 - $500
School Assembly Sign Baker St Mountain View Pl - S 35 0 25 15 75 - $500
School Assembly Sign California St University Ave - E 35 0 25 15 75 - $500
School Assembly Sign California St University Ave - W 35 0 25 15 75 - $500
School Assembly Sign California St Yale Ave - E 35 0 25 15 75 - $500
School Assembly Sign California St Yale Ave - W 35 0 25 15 75 - $500
School Assembly Sign California St Harvard Ave - E 35 0 25 15 75 - $500
School Assembly Sign California St Harvard Ave - W 35 0 25 15 75 - $500
School Assembly Sign California St Cornell Ave - E 35 0 25 15 75 - $500
School Assembly Sign California St Cornell Ave - W 35 0 25 15 75 - $500
School Assembly Sign Sunset St Baker St - South - E 35 0 25 15 75 - $500
School Assembly Sign Sunset St Baker St - South - W 35 0 25 15 75 - $500
School Assembly Sign Sunset St Baker St - North - W 35 0 25 15 75 - $500
E-7CITY OF COALINGA ACTIVE TRANSPORTATION PLAN
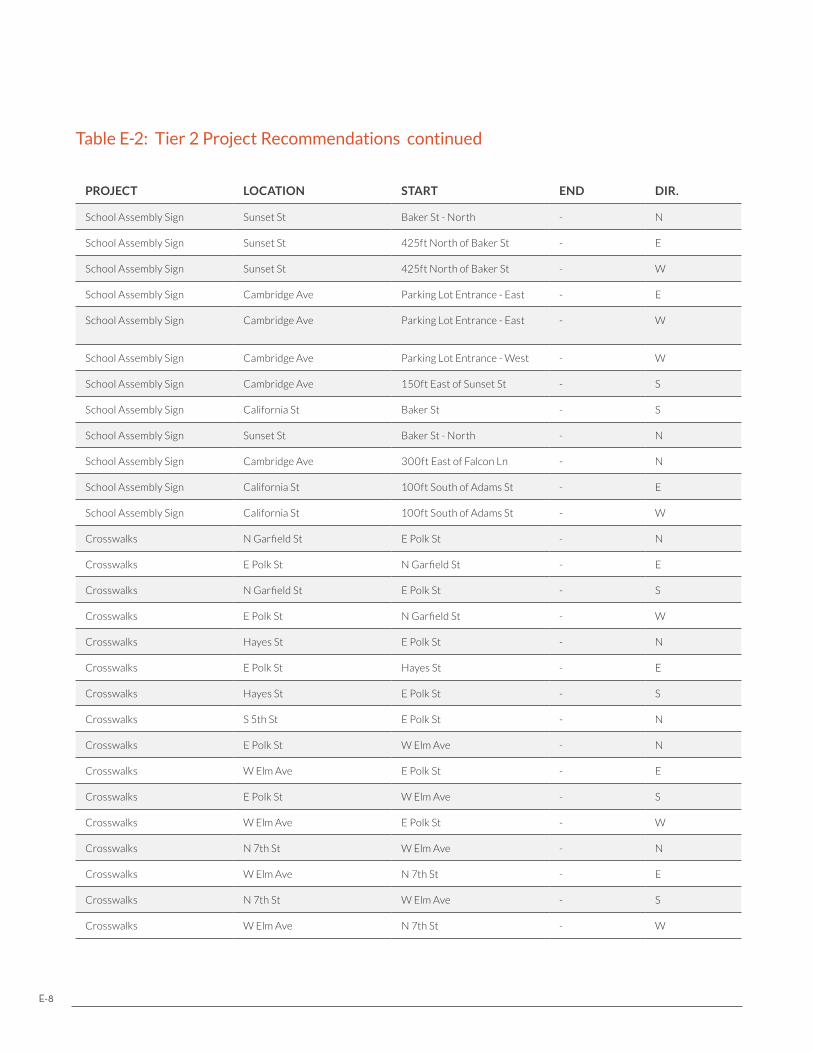
Table E-2: Tier 2 Project Recommendations
PROJECT LOCATION START END DIR. NOTESREAD- INESS SAFETY
ACTIVITY GENERATOR
MAIN- TENANCE
TOTAL SCORE
LENGTH (FEET)
COST ESTIMATE
School Assembly Sign Sunset St Baker St - North - N 35 0 25 15 75 - $500
School Assembly Sign Sunset St 425ft North of Baker St - E 35 0 25 15 75 - $500
School Assembly Sign Sunset St 425ft North of Baker St - W 35 0 25 15 75 - $500
School Assembly Sign Cambridge Ave Parking Lot Entrance - East - E Sign - "Exit Only" 35 0 25 15 75 - $500
School Assembly Sign Cambridge Ave Parking Lot Entrance - East - W Sign - Right turn only during school hours
35 0 25 15 75 - $500
School Assembly Sign Cambridge Ave Parking Lot Entrance - West - W Sign - "One Way" with arrow 35 0 25 15 75 - $500
School Assembly Sign Cambridge Ave 150ft East of Sunset St - S Sign - School Zone 35 0 25 15 75 - $500
School Assembly Sign California St Baker St - S Sign - School Zone 35 0 25 15 75 - $500
School Assembly Sign Sunset St Baker St - North - N Sign - School Zone 35 0 25 15 75 - $500
School Assembly Sign Cambridge Ave 300ft East of Falcon Ln - N Sign - School Zone 35 0 25 15 75 - $500
School Assembly Sign California St 100ft South of Adams St - E 35 0 25 15 75 - $500
School Assembly Sign California St 100ft South of Adams St - W 35 0 25 15 75 - $500
Crosswalks N Garfield St E Polk St - N 35 0 25 15 75 62.5 $500
Crosswalks E Polk St N Garfield St - E 35 0 25 15 75 65.1 $500
Crosswalks N Garfield St E Polk St - S 35 0 25 15 75 61.2 $500
Crosswalks E Polk St N Garfield St - W 35 0 25 15 75 63.9 $500
Crosswalks Hayes St E Polk St - N 35 0 25 15 75 65.1 $500
Crosswalks E Polk St Hayes St - E 35 0 25 15 75 62.9 $500
Crosswalks Hayes St E Polk St - S 35 0 25 15 75 66.2 $500
Crosswalks S 5th St E Polk St - N 35 0 25 15 75 135.2 $1,000
Crosswalks E Polk St W Elm Ave - N 35 0 25 15 75 98.7 $700
Crosswalks W Elm Ave E Polk St - E 35 0 25 15 75 104.6 $800
Crosswalks E Polk St W Elm Ave - S 35 0 25 15 75 117.2 $900
Crosswalks W Elm Ave E Polk St - W 35 0 25 15 75 124.4 $900
Crosswalks N 7th St W Elm Ave - N 35 0 25 15 75 76.6 $600
Crosswalks W Elm Ave N 7th St - E 35 0 25 15 75 74.2 $600
Crosswalks N 7th St W Elm Ave - S 35 0 25 15 75 75.3 $600
Crosswalks W Elm Ave N 7th St - W 35 0 25 15 75 76.0 $600
continued
E-8
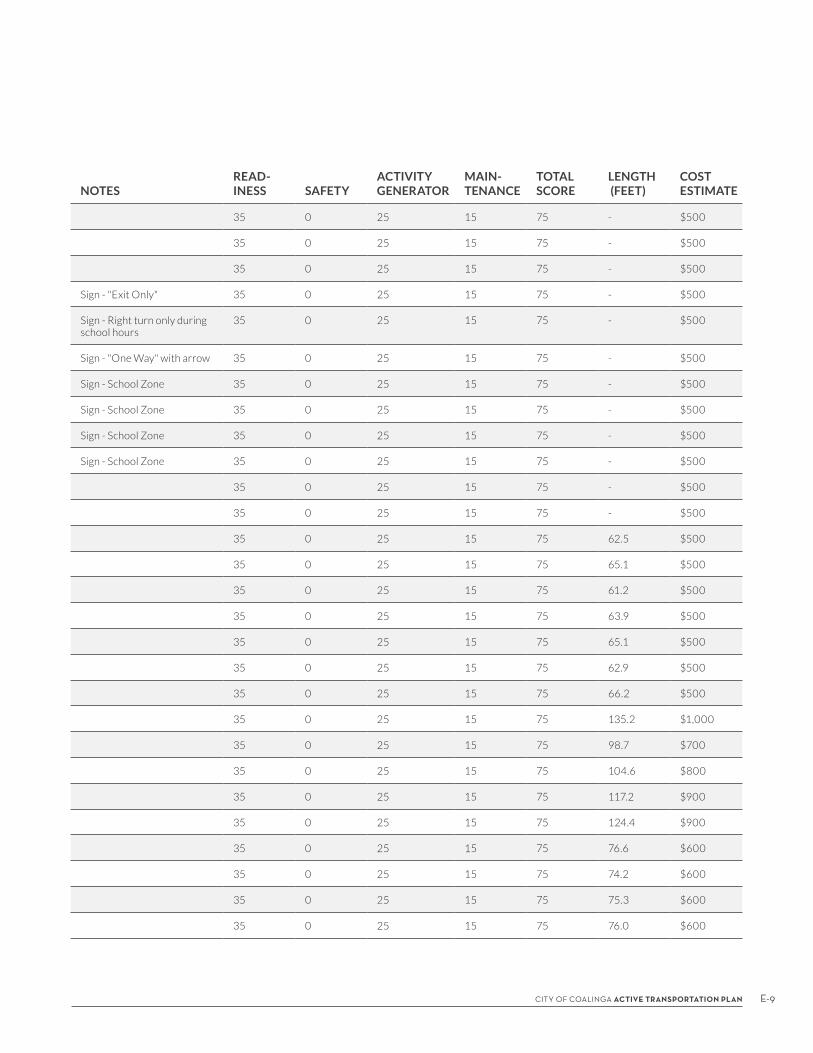
Table E-2: Tier 2 Project Recommendations
PROJECT LOCATION START END DIR. NOTESREAD- INESS SAFETY
ACTIVITY GENERATOR
MAIN- TENANCE
TOTAL SCORE
LENGTH (FEET)
COST ESTIMATE
School Assembly Sign Sunset St Baker St - North - N 35 0 25 15 75 - $500
School Assembly Sign Sunset St 425ft North of Baker St - E 35 0 25 15 75 - $500
School Assembly Sign Sunset St 425ft North of Baker St - W 35 0 25 15 75 - $500
School Assembly Sign Cambridge Ave Parking Lot Entrance - East - E Sign - "Exit Only" 35 0 25 15 75 - $500
School Assembly Sign Cambridge Ave Parking Lot Entrance - East - W Sign - Right turn only during school hours
35 0 25 15 75 - $500
School Assembly Sign Cambridge Ave Parking Lot Entrance - West - W Sign - "One Way" with arrow 35 0 25 15 75 - $500
School Assembly Sign Cambridge Ave 150ft East of Sunset St - S Sign - School Zone 35 0 25 15 75 - $500
School Assembly Sign California St Baker St - S Sign - School Zone 35 0 25 15 75 - $500
School Assembly Sign Sunset St Baker St - North - N Sign - School Zone 35 0 25 15 75 - $500
School Assembly Sign Cambridge Ave 300ft East of Falcon Ln - N Sign - School Zone 35 0 25 15 75 - $500
School Assembly Sign California St 100ft South of Adams St - E 35 0 25 15 75 - $500
School Assembly Sign California St 100ft South of Adams St - W 35 0 25 15 75 - $500
Crosswalks N Garfield St E Polk St - N 35 0 25 15 75 62.5 $500
Crosswalks E Polk St N Garfield St - E 35 0 25 15 75 65.1 $500
Crosswalks N Garfield St E Polk St - S 35 0 25 15 75 61.2 $500
Crosswalks E Polk St N Garfield St - W 35 0 25 15 75 63.9 $500
Crosswalks Hayes St E Polk St - N 35 0 25 15 75 65.1 $500
Crosswalks E Polk St Hayes St - E 35 0 25 15 75 62.9 $500
Crosswalks Hayes St E Polk St - S 35 0 25 15 75 66.2 $500
Crosswalks S 5th St E Polk St - N 35 0 25 15 75 135.2 $1,000
Crosswalks E Polk St W Elm Ave - N 35 0 25 15 75 98.7 $700
Crosswalks W Elm Ave E Polk St - E 35 0 25 15 75 104.6 $800
Crosswalks E Polk St W Elm Ave - S 35 0 25 15 75 117.2 $900
Crosswalks W Elm Ave E Polk St - W 35 0 25 15 75 124.4 $900
Crosswalks N 7th St W Elm Ave - N 35 0 25 15 75 76.6 $600
Crosswalks W Elm Ave N 7th St - E 35 0 25 15 75 74.2 $600
Crosswalks N 7th St W Elm Ave - S 35 0 25 15 75 75.3 $600
Crosswalks W Elm Ave N 7th St - W 35 0 25 15 75 76.0 $600
E-9CITY OF COALINGA ACTIVE TRANSPORTATION PLAN
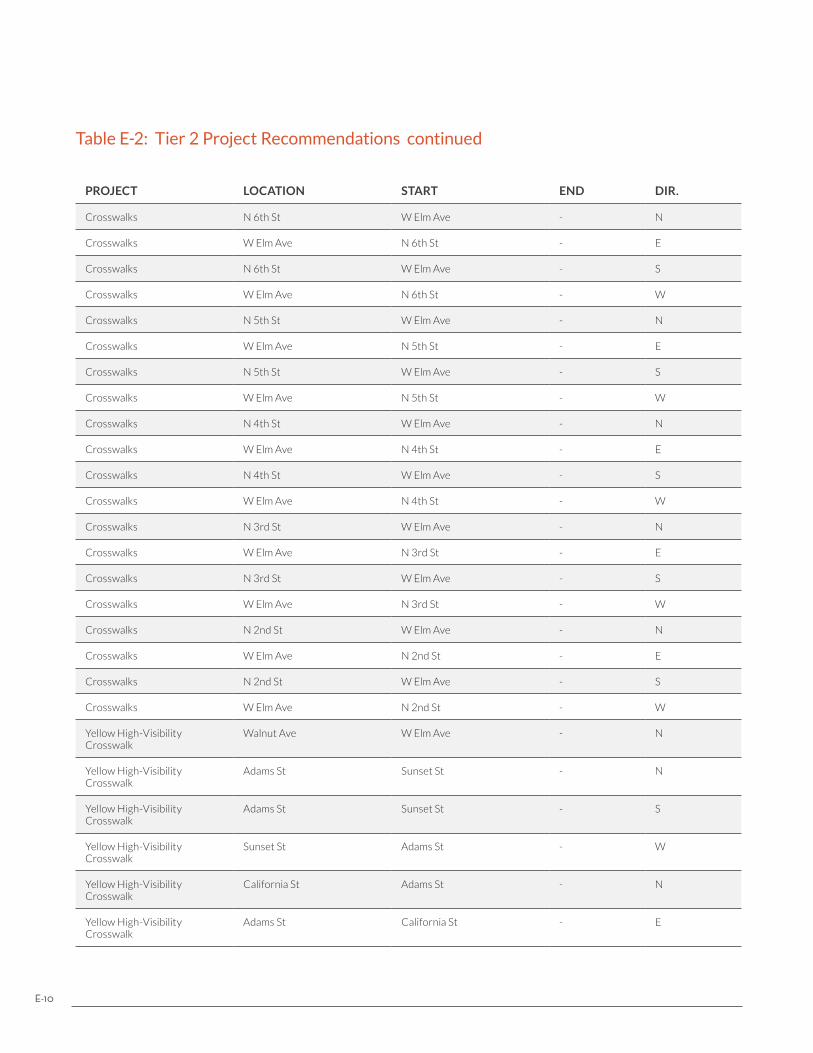
Table E-2: Tier 2 Project Recommendations
PROJECT LOCATION START END DIR. NOTESREAD- INESS SAFETY
ACTIVITY GENERATOR
MAIN- TENANCE
TOTAL SCORE
LENGTH (FEET)
COST ESTIMATE
Crosswalks N 6th St W Elm Ave - N 35 0 25 15 75 71.0 $500
Crosswalks W Elm Ave N 6th St - E 35 0 25 15 75 66.6 $500
Crosswalks N 6th St W Elm Ave - S 35 0 25 15 75 73.8 $600
Crosswalks W Elm Ave N 6th St - W 35 0 25 15 75 70.2 $500
Crosswalks N 5th St W Elm Ave - N 35 0 25 15 75 78.0 $600
Crosswalks W Elm Ave N 5th St - E 35 0 25 15 75 66.4 $500
Crosswalks N 5th St W Elm Ave - S 35 0 25 15 75 78.9 $600
Crosswalks W Elm Ave N 5th St - W 35 0 25 15 75 72.5 $500
Crosswalks N 4th St W Elm Ave - N 35 0 25 15 75 69.7 $500
Crosswalks W Elm Ave N 4th St - E 35 0 25 15 75 81.6 $600
Crosswalks N 4th St W Elm Ave - S 35 0 25 15 75 79.2 $600
Crosswalks W Elm Ave N 4th St - W 35 0 25 15 75 83.7 $600
Crosswalks N 3rd St W Elm Ave - N 35 0 25 15 75 82.0 $600
Crosswalks W Elm Ave N 3rd St - E 35 0 25 15 75 79.7 $600
Crosswalks N 3rd St W Elm Ave - S 35 0 25 15 75 85.1 $600
Crosswalks W Elm Ave N 3rd St - W 35 0 25 15 75 79.3 $600
Crosswalks N 2nd St W Elm Ave - N 35 0 25 15 75 84.2 $600
Crosswalks W Elm Ave N 2nd St - E 35 0 25 15 75 82.7 $600
Crosswalks N 2nd St W Elm Ave - S 35 0 25 15 75 84.0 $600
Crosswalks W Elm Ave N 2nd St - W 35 0 25 15 75 86.6 $600
Yellow High-Visibility Crosswalk
Walnut Ave W Elm Ave - N 35 0 25 15 75 72.7 $1,500
Yellow High-Visibility Crosswalk
Adams St Sunset St - N 35 0 25 15 75 52.1 $1,100
Yellow High-Visibility Crosswalk
Adams St Sunset St - S 35 0 25 15 75 52.1 $1,100
Yellow High-Visibility Crosswalk
Sunset St Adams St - W 35 0 25 15 75 60.8 $1,200
Yellow High-Visibility Crosswalk
California St Adams St - N 35 0 25 15 75 64.2 $1,300
Yellow High-Visibility Crosswalk
Adams St California St - E 35 0 25 15 75 57.3 $1,200
continued
E-10
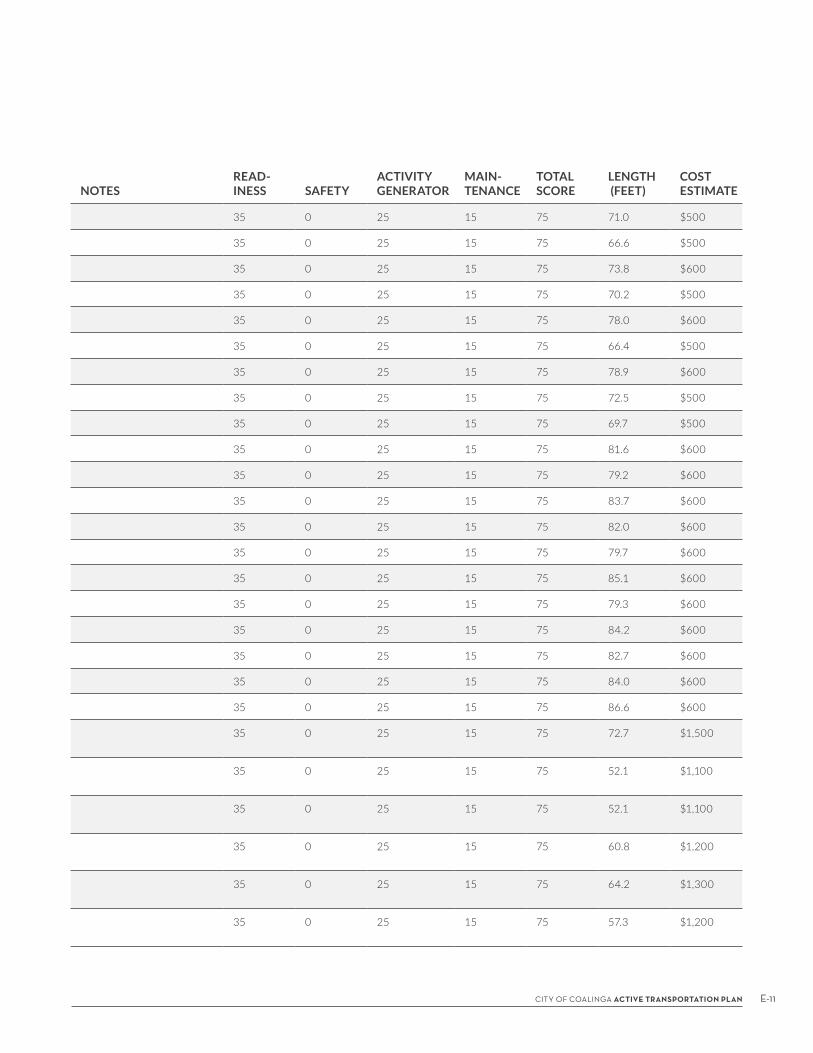
Table E-2: Tier 2 Project Recommendations
PROJECT LOCATION START END DIR. NOTESREAD- INESS SAFETY
ACTIVITY GENERATOR
MAIN- TENANCE
TOTAL SCORE
LENGTH (FEET)
COST ESTIMATE
Crosswalks N 6th St W Elm Ave - N 35 0 25 15 75 71.0 $500
Crosswalks W Elm Ave N 6th St - E 35 0 25 15 75 66.6 $500
Crosswalks N 6th St W Elm Ave - S 35 0 25 15 75 73.8 $600
Crosswalks W Elm Ave N 6th St - W 35 0 25 15 75 70.2 $500
Crosswalks N 5th St W Elm Ave - N 35 0 25 15 75 78.0 $600
Crosswalks W Elm Ave N 5th St - E 35 0 25 15 75 66.4 $500
Crosswalks N 5th St W Elm Ave - S 35 0 25 15 75 78.9 $600
Crosswalks W Elm Ave N 5th St - W 35 0 25 15 75 72.5 $500
Crosswalks N 4th St W Elm Ave - N 35 0 25 15 75 69.7 $500
Crosswalks W Elm Ave N 4th St - E 35 0 25 15 75 81.6 $600
Crosswalks N 4th St W Elm Ave - S 35 0 25 15 75 79.2 $600
Crosswalks W Elm Ave N 4th St - W 35 0 25 15 75 83.7 $600
Crosswalks N 3rd St W Elm Ave - N 35 0 25 15 75 82.0 $600
Crosswalks W Elm Ave N 3rd St - E 35 0 25 15 75 79.7 $600
Crosswalks N 3rd St W Elm Ave - S 35 0 25 15 75 85.1 $600
Crosswalks W Elm Ave N 3rd St - W 35 0 25 15 75 79.3 $600
Crosswalks N 2nd St W Elm Ave - N 35 0 25 15 75 84.2 $600
Crosswalks W Elm Ave N 2nd St - E 35 0 25 15 75 82.7 $600
Crosswalks N 2nd St W Elm Ave - S 35 0 25 15 75 84.0 $600
Crosswalks W Elm Ave N 2nd St - W 35 0 25 15 75 86.6 $600
Yellow High-Visibility Crosswalk
Walnut Ave W Elm Ave - N 35 0 25 15 75 72.7 $1,500
Yellow High-Visibility Crosswalk
Adams St Sunset St - N 35 0 25 15 75 52.1 $1,100
Yellow High-Visibility Crosswalk
Adams St Sunset St - S 35 0 25 15 75 52.1 $1,100
Yellow High-Visibility Crosswalk
Sunset St Adams St - W 35 0 25 15 75 60.8 $1,200
Yellow High-Visibility Crosswalk
California St Adams St - N 35 0 25 15 75 64.2 $1,300
Yellow High-Visibility Crosswalk
Adams St California St - E 35 0 25 15 75 57.3 $1,200
E-11CITY OF COALINGA ACTIVE TRANSPORTATION PLAN
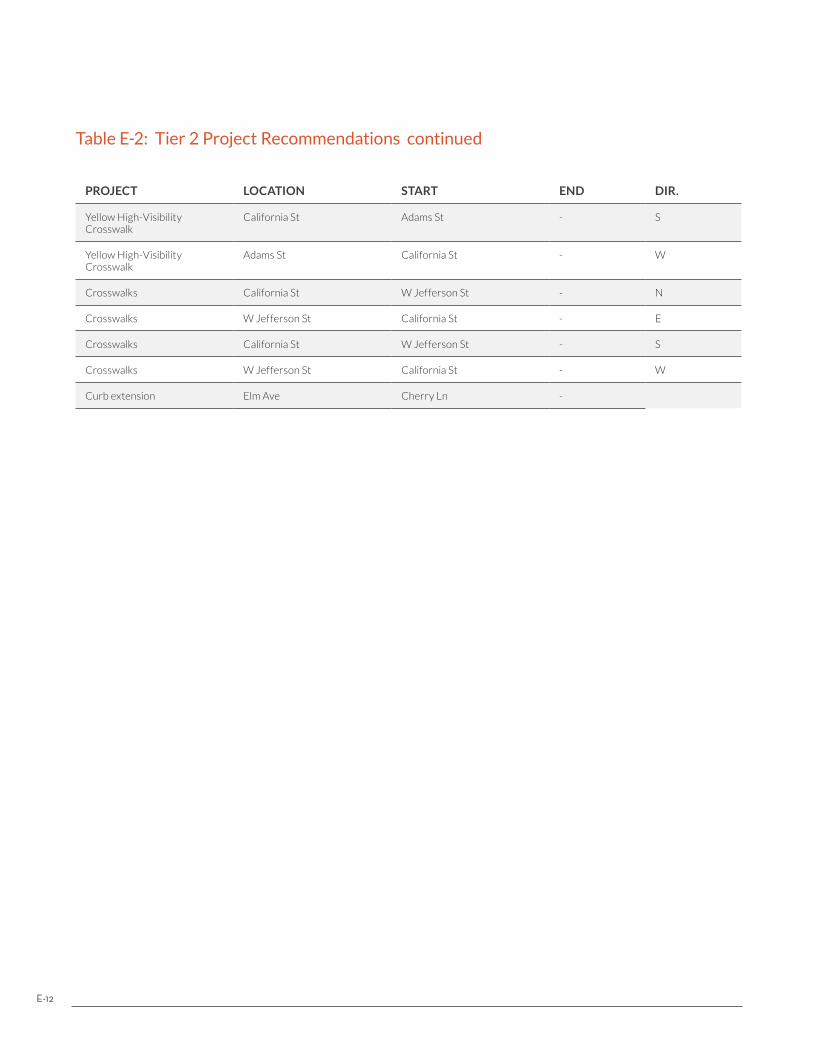
Table E-2: Tier 2 Project Recommendations
PROJECT LOCATION START END DIR. NOTESREAD- INESS SAFETY
ACTIVITY GENERATOR
MAIN- TENANCE
TOTAL SCORE
LENGTH (FEET)
COST ESTIMATE
Yellow High-Visibility Crosswalk
California St Adams St - S 35 0 25 15 75 62.1 $1,300
Yellow High-Visibility Crosswalk
Adams St California St - W 35 0 25 15 75 59.5 $1,200
Crosswalks California St W Jefferson St - N 35 0 25 15 75 64.3 $500
Crosswalks W Jefferson St California St - E 35 0 25 15 75 48.6 $400
Crosswalks California St W Jefferson St - S 35 0 25 15 75 64.3 $500
Crosswalks W Jefferson St California St - W 35 0 25 15 75 46.9 $400
Curb extension Elm Ave Cherry Ln - 35 13 25 0 73 - $20,000
continued
E-12

Table E-2: Tier 2 Project Recommendations
PROJECT LOCATION START END DIR. NOTESREAD- INESS SAFETY
ACTIVITY GENERATOR
MAIN- TENANCE
TOTAL SCORE
LENGTH (FEET)
COST ESTIMATE
Yellow High-Visibility Crosswalk
California St Adams St - S 35 0 25 15 75 62.1 $1,300
Yellow High-Visibility Crosswalk
Adams St California St - W 35 0 25 15 75 59.5 $1,200
Crosswalks California St W Jefferson St - N 35 0 25 15 75 64.3 $500
Crosswalks W Jefferson St California St - E 35 0 25 15 75 48.6 $400
Crosswalks California St W Jefferson St - S 35 0 25 15 75 64.3 $500
Crosswalks W Jefferson St California St - W 35 0 25 15 75 46.9 $400
Curb extension Elm Ave Cherry Ln - 35 13 25 0 73 - $20,000
E-13CITY OF COALINGA ACTIVE TRANSPORTATION PLAN
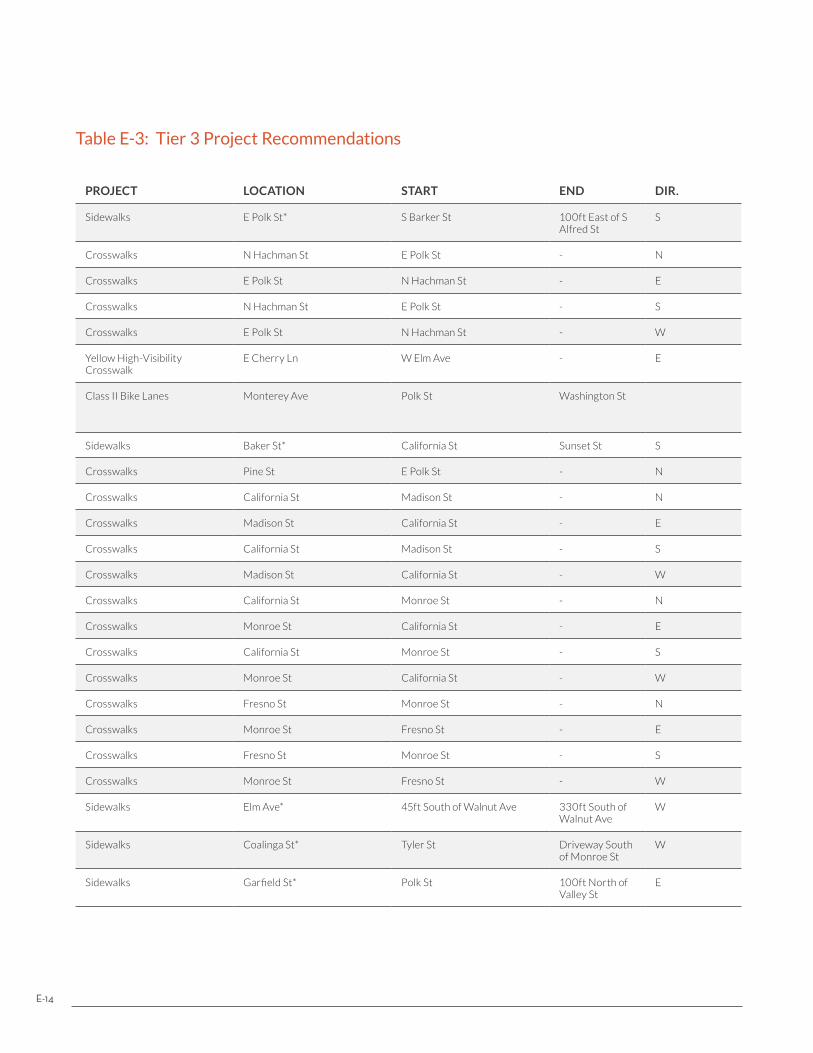
Table E-3: Tier 3 Project Recommendations
PROJECT LOCATION START END DIR. NOTESREAD- INESS SAFETY
ACTIVITY GENERATOR
MAIN- TENANCE
TOTAL SCORE
LENGTH (FEET)
COST ESTIMATE
Sidewalks E Polk St* S Barker St 100ft East of S Alfred St
S 35 8 25 0 68 247.4 $18,600
Crosswalks N Hachman St E Polk St - N 35 8 10 15 68 66.2 $500
Crosswalks E Polk St N Hachman St - E 35 8 10 15 68 66.2 $500
Crosswalks N Hachman St E Polk St - S 35 8 10 15 68 69.4 $500
Crosswalks E Polk St N Hachman St - W 35 8 10 15 68 69.4 $500
Yellow High-Visibility Crosswalk
E Cherry Ln W Elm Ave - E 35 8 10 15 68 56.4 $1,200
Class II Bike Lanes Monterey Ave Polk St Washington St Stripe right side of bike lane where on-street parking is present
35 0 10 15 60 2656.1 $5,300
Sidewalks Baker St* California St Sunset St S 35 0 25 0 60 501.9 $37,600
Crosswalks Pine St E Polk St - N 35 0 10 15 60 69.4 $500
Crosswalks California St Madison St - N 35 0 10 15 60 57.3 $400
Crosswalks Madison St California St - E 35 0 10 15 60 57.3 $400
Crosswalks California St Madison St - S 35 0 10 15 60 60.8 $500
Crosswalks Madison St California St - W 35 0 10 15 60 55.7 $400
Crosswalks California St Monroe St - N 35 0 10 15 60 64.3 $500
Crosswalks Monroe St California St - E 35 0 10 15 60 59.1 $400
Crosswalks California St Monroe St - S 35 0 10 15 60 64.2 $500
Crosswalks Monroe St California St - W 35 0 10 15 60 57.4 $400
Crosswalks Fresno St Monroe St - N 35 0 10 15 60 54.7 $400
Crosswalks Monroe St Fresno St - E 35 0 10 15 60 49.5 $400
Crosswalks Fresno St Monroe St - S 35 0 10 15 60 58.2 $400
Crosswalks Monroe St Fresno St - W 35 0 10 15 60 49.6 $400
Sidewalks Elm Ave* 45ft South of Walnut Ave 330ft South of Walnut Ave
W 35 0 25 0 60 290.9 $21,800
Sidewalks Coalinga St* Tyler St Driveway South of Monroe St
W 35 0 25 0 60 531.4 $39,900
Sidewalks Garfield St* Polk St 100ft North of Valley St
E 35 0 25 0 60 175.8 $13,200
E-14
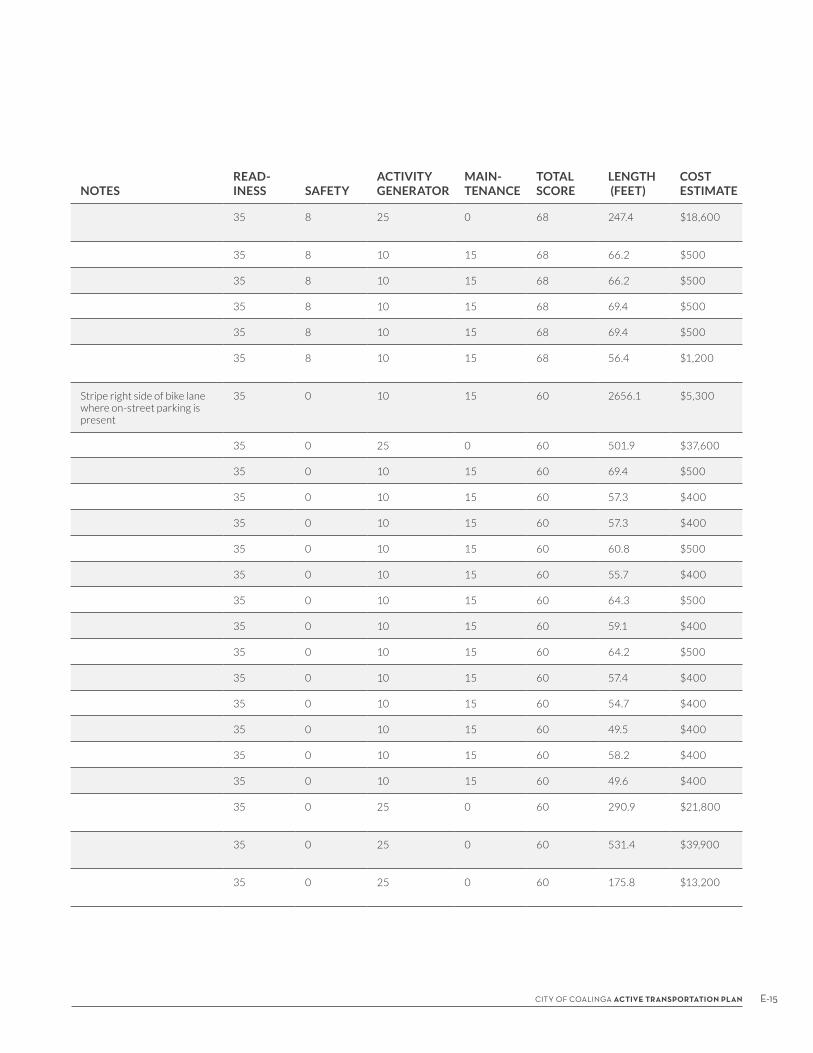
Table E-3: Tier 3 Project Recommendations
PROJECT LOCATION START END DIR. NOTESREAD- INESS SAFETY
ACTIVITY GENERATOR
MAIN- TENANCE
TOTAL SCORE
LENGTH (FEET)
COST ESTIMATE
Sidewalks E Polk St* S Barker St 100ft East of S Alfred St
S 35 8 25 0 68 247.4 $18,600
Crosswalks N Hachman St E Polk St - N 35 8 10 15 68 66.2 $500
Crosswalks E Polk St N Hachman St - E 35 8 10 15 68 66.2 $500
Crosswalks N Hachman St E Polk St - S 35 8 10 15 68 69.4 $500
Crosswalks E Polk St N Hachman St - W 35 8 10 15 68 69.4 $500
Yellow High-Visibility Crosswalk
E Cherry Ln W Elm Ave - E 35 8 10 15 68 56.4 $1,200
Class II Bike Lanes Monterey Ave Polk St Washington St Stripe right side of bike lane where on-street parking is present
35 0 10 15 60 2656.1 $5,300
Sidewalks Baker St* California St Sunset St S 35 0 25 0 60 501.9 $37,600
Crosswalks Pine St E Polk St - N 35 0 10 15 60 69.4 $500
Crosswalks California St Madison St - N 35 0 10 15 60 57.3 $400
Crosswalks Madison St California St - E 35 0 10 15 60 57.3 $400
Crosswalks California St Madison St - S 35 0 10 15 60 60.8 $500
Crosswalks Madison St California St - W 35 0 10 15 60 55.7 $400
Crosswalks California St Monroe St - N 35 0 10 15 60 64.3 $500
Crosswalks Monroe St California St - E 35 0 10 15 60 59.1 $400
Crosswalks California St Monroe St - S 35 0 10 15 60 64.2 $500
Crosswalks Monroe St California St - W 35 0 10 15 60 57.4 $400
Crosswalks Fresno St Monroe St - N 35 0 10 15 60 54.7 $400
Crosswalks Monroe St Fresno St - E 35 0 10 15 60 49.5 $400
Crosswalks Fresno St Monroe St - S 35 0 10 15 60 58.2 $400
Crosswalks Monroe St Fresno St - W 35 0 10 15 60 49.6 $400
Sidewalks Elm Ave* 45ft South of Walnut Ave 330ft South of Walnut Ave
W 35 0 25 0 60 290.9 $21,800
Sidewalks Coalinga St* Tyler St Driveway South of Monroe St
W 35 0 25 0 60 531.4 $39,900
Sidewalks Garfield St* Polk St 100ft North of Valley St
E 35 0 25 0 60 175.8 $13,200
E-15CITY OF COALINGA ACTIVE TRANSPORTATION PLAN
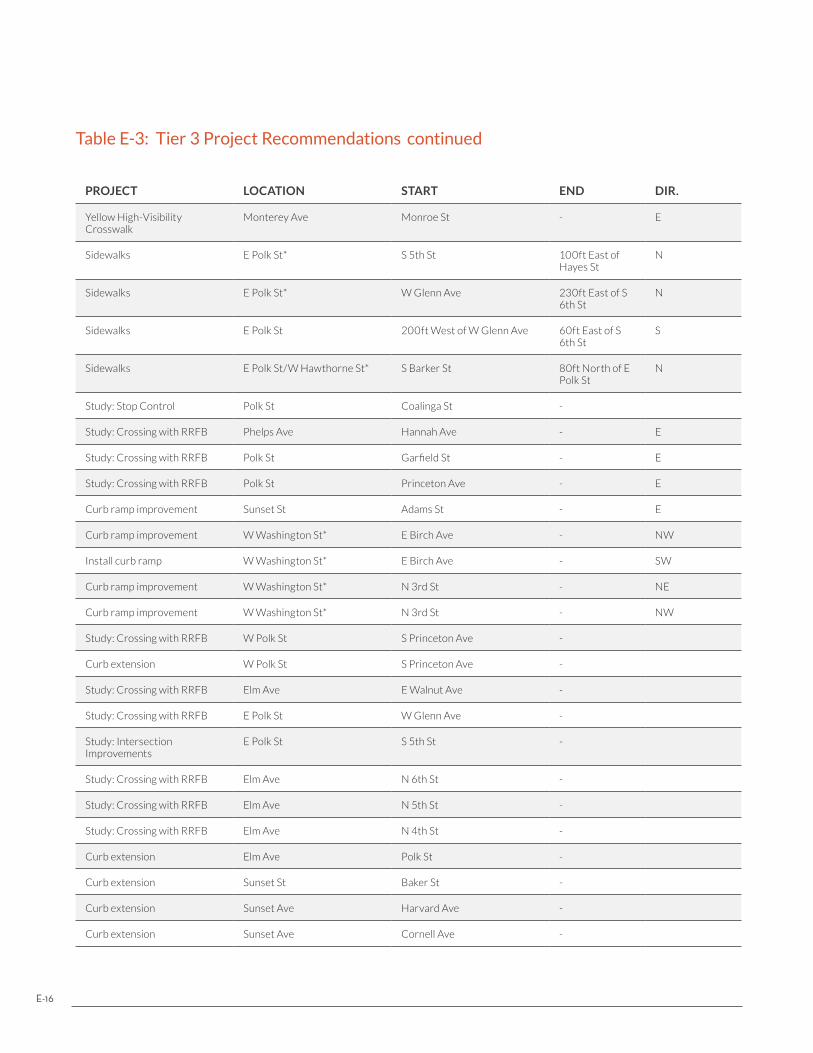
Table E-3: Tier 3 Project Recommendations
PROJECT LOCATION START END DIR. NOTESREAD- INESS SAFETY
ACTIVITY GENERATOR
MAIN- TENANCE
TOTAL SCORE
LENGTH (FEET)
COST ESTIMATE
Yellow High-Visibility Crosswalk
Monterey Ave Monroe St - E 35 0 10 15 60 58.2 $1,200
Sidewalks E Polk St* S 5th St 100ft East of Hayes St
N 35 0 25 0 60 85.1 $6,400
Sidewalks E Polk St* W Glenn Ave 230ft East of S 6th St
N 35 0 25 0 60 215.3 $16,100
Sidewalks E Polk St 200ft West of W Glenn Ave 60ft East of S 6th St
S 35 0 25 0 60 248.3 $18,600
Sidewalks E Polk St/W Hawthorne St* S Barker St 80ft North of E Polk St
N 35 0 25 0 60 134.2 $10,100
Study: Stop Control Polk St Coalinga St - 35 0 25 0 60 - $20,000
Study: Crossing with RRFB Phelps Ave Hannah Ave - E 35 0 25 0 60 - $20,000
Study: Crossing with RRFB Polk St Garfield St - E 35 0 25 0 60 - $20,000
Study: Crossing with RRFB Polk St Princeton Ave - E 35 0 25 0 60 - $20,000
Curb ramp improvement Sunset St Adams St - E Curb Ramp 35 0 25 0 60 - $1,000
Curb ramp improvement W Washington St* E Birch Ave - NW 35 0 25 0 60 - $1,000
Install curb ramp W Washington St* E Birch Ave - SW 35 0 25 0 60 - $3,500
Curb ramp improvement W Washington St* N 3rd St - NE 35 0 25 0 60 - $1,000
Curb ramp improvement W Washington St* N 3rd St - NW 35 0 25 0 60 - $1,000
Study: Crossing with RRFB W Polk St S Princeton Ave - 35 0 25 0 60 - $20,000
Curb extension W Polk St S Princeton Ave - 35 0 25 0 60 - $20,000
Study: Crossing with RRFB Elm Ave E Walnut Ave - 35 0 25 0 60 - $20,000
Study: Crossing with RRFB E Polk St W Glenn Ave - 35 0 25 0 60 - $20,000
Study: Intersection Improvements
E Polk St S 5th St - 35 0 25 0 60 - $20,000
Study: Crossing with RRFB Elm Ave N 6th St - 35 0 25 0 60 - $20,000
Study: Crossing with RRFB Elm Ave N 5th St - 35 0 25 0 60 - $20,000
Study: Crossing with RRFB Elm Ave N 4th St - 35 0 25 0 60 - $20,000
Curb extension Elm Ave Polk St - 35 0 25 0 60 - $20,000
Curb extension Sunset St Baker St - 35 0 25 0 60 - $20,000
Curb extension Sunset Ave Harvard Ave - 35 0 25 0 60 - $20,000
Curb extension Sunset Ave Cornell Ave - 35 0 25 0 60 - $20,000
continued
E-16

Table E-3: Tier 3 Project Recommendations
PROJECT LOCATION START END DIR. NOTESREAD- INESS SAFETY
ACTIVITY GENERATOR
MAIN- TENANCE
TOTAL SCORE
LENGTH (FEET)
COST ESTIMATE
Yellow High-Visibility Crosswalk
Monterey Ave Monroe St - E 35 0 10 15 60 58.2 $1,200
Sidewalks E Polk St* S 5th St 100ft East of Hayes St
N 35 0 25 0 60 85.1 $6,400
Sidewalks E Polk St* W Glenn Ave 230ft East of S 6th St
N 35 0 25 0 60 215.3 $16,100
Sidewalks E Polk St 200ft West of W Glenn Ave 60ft East of S 6th St
S 35 0 25 0 60 248.3 $18,600
Sidewalks E Polk St/W Hawthorne St* S Barker St 80ft North of E Polk St
N 35 0 25 0 60 134.2 $10,100
Study: Stop Control Polk St Coalinga St - 35 0 25 0 60 - $20,000
Study: Crossing with RRFB Phelps Ave Hannah Ave - E 35 0 25 0 60 - $20,000
Study: Crossing with RRFB Polk St Garfield St - E 35 0 25 0 60 - $20,000
Study: Crossing with RRFB Polk St Princeton Ave - E 35 0 25 0 60 - $20,000
Curb ramp improvement Sunset St Adams St - E Curb Ramp 35 0 25 0 60 - $1,000
Curb ramp improvement W Washington St* E Birch Ave - NW 35 0 25 0 60 - $1,000
Install curb ramp W Washington St* E Birch Ave - SW 35 0 25 0 60 - $3,500
Curb ramp improvement W Washington St* N 3rd St - NE 35 0 25 0 60 - $1,000
Curb ramp improvement W Washington St* N 3rd St - NW 35 0 25 0 60 - $1,000
Study: Crossing with RRFB W Polk St S Princeton Ave - 35 0 25 0 60 - $20,000
Curb extension W Polk St S Princeton Ave - 35 0 25 0 60 - $20,000
Study: Crossing with RRFB Elm Ave E Walnut Ave - 35 0 25 0 60 - $20,000
Study: Crossing with RRFB E Polk St W Glenn Ave - 35 0 25 0 60 - $20,000
Study: Intersection Improvements
E Polk St S 5th St - 35 0 25 0 60 - $20,000
Study: Crossing with RRFB Elm Ave N 6th St - 35 0 25 0 60 - $20,000
Study: Crossing with RRFB Elm Ave N 5th St - 35 0 25 0 60 - $20,000
Study: Crossing with RRFB Elm Ave N 4th St - 35 0 25 0 60 - $20,000
Curb extension Elm Ave Polk St - 35 0 25 0 60 - $20,000
Curb extension Sunset St Baker St - 35 0 25 0 60 - $20,000
Curb extension Sunset Ave Harvard Ave - 35 0 25 0 60 - $20,000
Curb extension Sunset Ave Cornell Ave - 35 0 25 0 60 - $20,000
E-17CITY OF COALINGA ACTIVE TRANSPORTATION PLAN
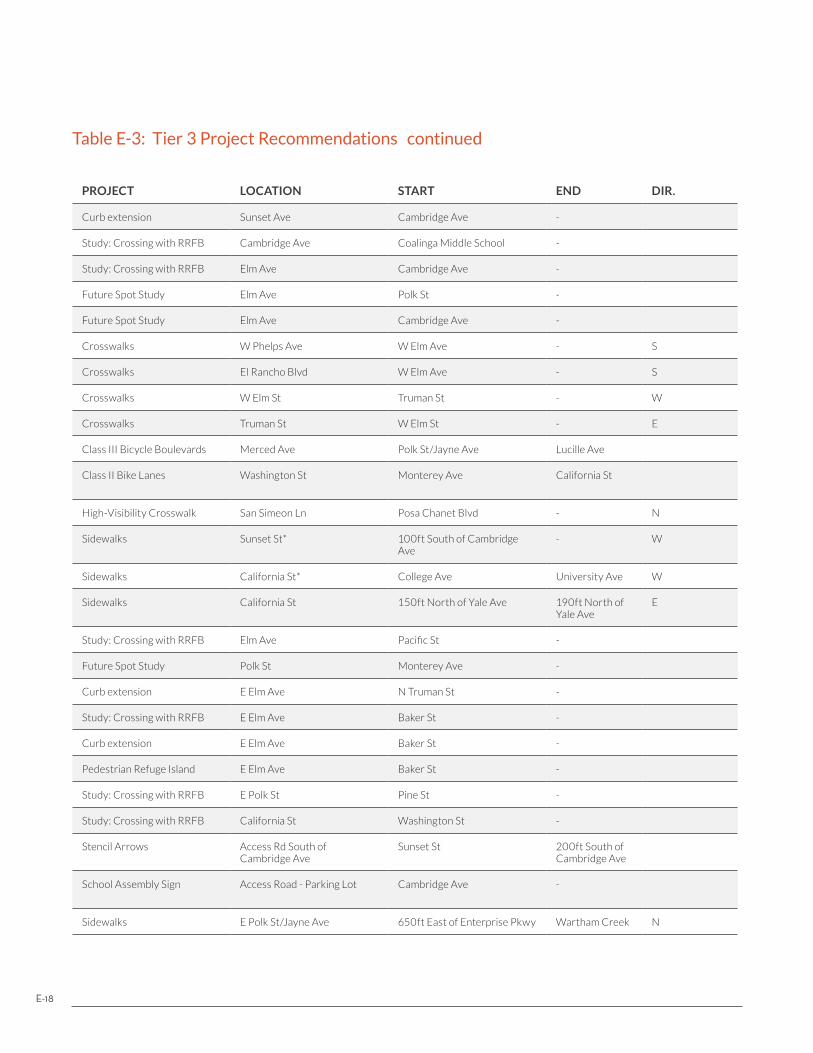
Table E-3: Tier 3 Project Recommendations
PROJECT LOCATION START END DIR. NOTESREAD- INESS SAFETY
ACTIVITY GENERATOR
MAIN- TENANCE
TOTAL SCORE
LENGTH (FEET)
COST ESTIMATE
Curb extension Sunset Ave Cambridge Ave - 35 0 25 0 60 - $20,000
Study: Crossing with RRFB Cambridge Ave Coalinga Middle School - 35 0 25 0 60 - $20,000
Study: Crossing with RRFB Elm Ave Cambridge Ave - 35 0 25 0 60 - $20,000
Future Spot Study Elm Ave Polk St - 35 0 25 0 60 - $20,000
Future Spot Study Elm Ave Cambridge Ave - 35 0 25 0 60 - $20,000
Crosswalks W Phelps Ave W Elm Ave - S 35 0 0 15 50 90.2 $700
Crosswalks El Rancho Blvd W Elm Ave - S 35 0 0 15 50 90.8 $700
Crosswalks W Elm St Truman St - W 35 0 0 15 50 74.8 $600
Crosswalks Truman St W Elm St - E 35 0 0 15 50 55.3 $400
Class III Bicycle Boulevards Merced Ave Polk St/Jayne Ave Lucille Ave 35 0 0 15 50 2641.9 $700
Class II Bike Lanes Washington St Monterey Ave California St Stripe right side of existing bike lanes
35 0 0 15 50 2001.6 $4,000
High-Visibility Crosswalk San Simeon Ln Posa Chanet Blvd - N 35 0 0 15 50 58.8 $1,200
Sidewalks Sunset St* 100ft South of Cambridge Ave
- W 25 0 25 0 50 537.2 $40,300
Sidewalks California St* College Ave University Ave W 25 0 25 0 50 261.4 $19,600
Sidewalks California St 150ft North of Yale Ave 190ft North of Yale Ave
E Curb ramp 25 0 25 0 50 40.5 $3,000
Study: Crossing with RRFB Elm Ave Pacific St - 35 13 0 0 48 - $20,000
Future Spot Study Polk St Monterey Ave - 35 0 10 0 45 - $20,000
Curb extension E Elm Ave N Truman St - 35 0 10 0 45 - $20,000
Study: Crossing with RRFB E Elm Ave Baker St - 35 0 10 0 45 - $20,000
Curb extension E Elm Ave Baker St - 35 0 10 0 45 - $20,000
Pedestrian Refuge Island E Elm Ave Baker St - 35 0 10 0 45 - $15,000
Study: Crossing with RRFB E Polk St Pine St - 35 0 10 0 45 - $20,000
Study: Crossing with RRFB California St Washington St - 35 0 10 0 45 - $20,000
Stencil Arrows Access Rd South of Cambridge Ave
Sunset St 200ft South of Cambridge Ave
"One Way" east/north bound 0 0 25 15 40 751.5 $100
School Assembly Sign Access Road - Parking Lot Cambridge Ave - Sign - Do Not Enter/Wrong Way
0 0 25 15 40 - $500
Sidewalks E Polk St/Jayne Ave 650ft East of Enterprise Pkwy Wartham Creek N 35 0 0 0 35 5995.6 $449,700
continued
E-18
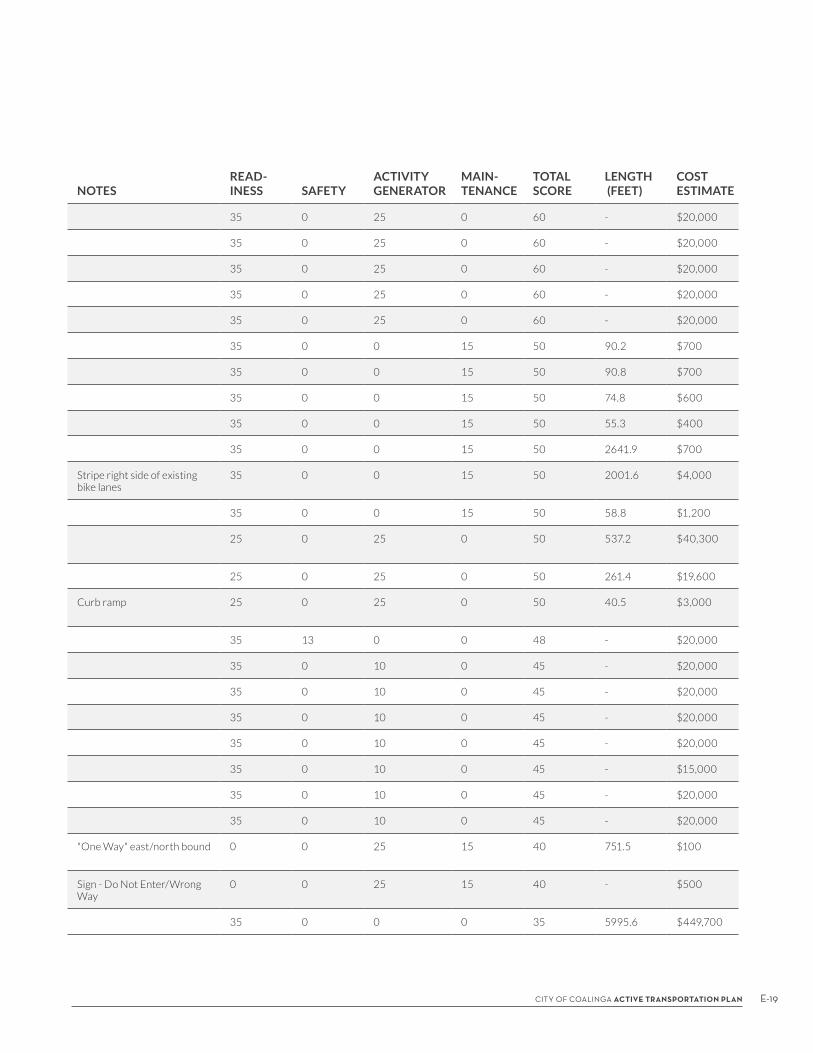
Table E-3: Tier 3 Project Recommendations
PROJECT LOCATION START END DIR. NOTESREAD- INESS SAFETY
ACTIVITY GENERATOR
MAIN- TENANCE
TOTAL SCORE
LENGTH (FEET)
COST ESTIMATE
Curb extension Sunset Ave Cambridge Ave - 35 0 25 0 60 - $20,000
Study: Crossing with RRFB Cambridge Ave Coalinga Middle School - 35 0 25 0 60 - $20,000
Study: Crossing with RRFB Elm Ave Cambridge Ave - 35 0 25 0 60 - $20,000
Future Spot Study Elm Ave Polk St - 35 0 25 0 60 - $20,000
Future Spot Study Elm Ave Cambridge Ave - 35 0 25 0 60 - $20,000
Crosswalks W Phelps Ave W Elm Ave - S 35 0 0 15 50 90.2 $700
Crosswalks El Rancho Blvd W Elm Ave - S 35 0 0 15 50 90.8 $700
Crosswalks W Elm St Truman St - W 35 0 0 15 50 74.8 $600
Crosswalks Truman St W Elm St - E 35 0 0 15 50 55.3 $400
Class III Bicycle Boulevards Merced Ave Polk St/Jayne Ave Lucille Ave 35 0 0 15 50 2641.9 $700
Class II Bike Lanes Washington St Monterey Ave California St Stripe right side of existing bike lanes
35 0 0 15 50 2001.6 $4,000
High-Visibility Crosswalk San Simeon Ln Posa Chanet Blvd - N 35 0 0 15 50 58.8 $1,200
Sidewalks Sunset St* 100ft South of Cambridge Ave
- W 25 0 25 0 50 537.2 $40,300
Sidewalks California St* College Ave University Ave W 25 0 25 0 50 261.4 $19,600
Sidewalks California St 150ft North of Yale Ave 190ft North of Yale Ave
E Curb ramp 25 0 25 0 50 40.5 $3,000
Study: Crossing with RRFB Elm Ave Pacific St - 35 13 0 0 48 - $20,000
Future Spot Study Polk St Monterey Ave - 35 0 10 0 45 - $20,000
Curb extension E Elm Ave N Truman St - 35 0 10 0 45 - $20,000
Study: Crossing with RRFB E Elm Ave Baker St - 35 0 10 0 45 - $20,000
Curb extension E Elm Ave Baker St - 35 0 10 0 45 - $20,000
Pedestrian Refuge Island E Elm Ave Baker St - 35 0 10 0 45 - $15,000
Study: Crossing with RRFB E Polk St Pine St - 35 0 10 0 45 - $20,000
Study: Crossing with RRFB California St Washington St - 35 0 10 0 45 - $20,000
Stencil Arrows Access Rd South of Cambridge Ave
Sunset St 200ft South of Cambridge Ave
"One Way" east/north bound 0 0 25 15 40 751.5 $100
School Assembly Sign Access Road - Parking Lot Cambridge Ave - Sign - Do Not Enter/Wrong Way
0 0 25 15 40 - $500
Sidewalks E Polk St/Jayne Ave 650ft East of Enterprise Pkwy Wartham Creek N 35 0 0 0 35 5995.6 $449,700
E-19CITY OF COALINGA ACTIVE TRANSPORTATION PLAN
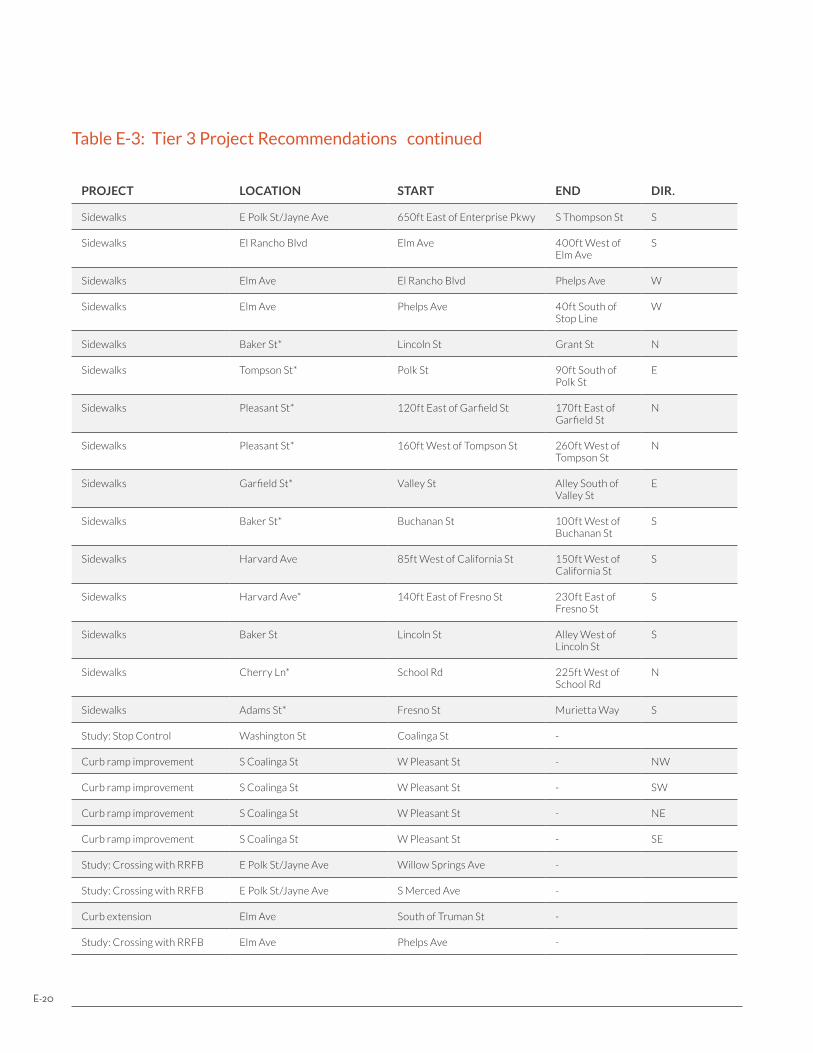
Table E-3: Tier 3 Project Recommendations
PROJECT LOCATION START END DIR. NOTESREAD- INESS SAFETY
ACTIVITY GENERATOR
MAIN- TENANCE
TOTAL SCORE
LENGTH (FEET)
COST ESTIMATE
Sidewalks E Polk St/Jayne Ave 650ft East of Enterprise Pkwy S Thompson St S 35 0 0 0 35 6411.1 $480,800
Sidewalks El Rancho Blvd Elm Ave 400ft West of Elm Ave
S 35 0 0 0 35 366.7 $27,500
Sidewalks Elm Ave El Rancho Blvd Phelps Ave W 35 0 0 0 35 863.4 $64,800
Sidewalks Elm Ave Phelps Ave 40ft South of Stop Line
W 35 0 0 0 35 43.6 $3,300
Sidewalks Baker St* Lincoln St Grant St N 35 0 0 0 35 321.3 $24,100
Sidewalks Tompson St* Polk St 90ft South of Polk St
E 35 0 0 0 35 60.9 $4,600
Sidewalks Pleasant St* 120ft East of Garfield St 170ft East of Garfield St
N 35 0 0 0 35 48.1 $3,600
Sidewalks Pleasant St* 160ft West of Tompson St 260ft West of Tompson St
N 35 0 0 0 35 96.0 $7,200
Sidewalks Garfield St* Valley St Alley South of Valley St
E 35 0 0 0 35 129.6 $9,700
Sidewalks Baker St* Buchanan St 100ft West of Buchanan St
S 35 0 0 0 35 79.4 $6,000
Sidewalks Harvard Ave 85ft West of California St 150ft West of California St
S 35 0 0 0 35 65.6 $4,900
Sidewalks Harvard Ave* 140ft East of Fresno St 230ft East of Fresno St
S 35 0 0 0 35 85.2 $6,400
Sidewalks Baker St Lincoln St Alley West of Lincoln St
S 35 0 0 0 35 151.3 $11,300
Sidewalks Cherry Ln* School Rd 225ft West of School Rd
N 35 0 0 0 35 263.1 $19,700
Sidewalks Adams St* Fresno St Murietta Way S 35 0 0 0 35 192.8 $14,500
Study: Stop Control Washington St Coalinga St - 35 0 0 0 35 - $20,000
Curb ramp improvement S Coalinga St W Pleasant St - NW 35 0 0 0 35 - $1,000
Curb ramp improvement S Coalinga St W Pleasant St - SW 35 0 0 0 35 - $1,000
Curb ramp improvement S Coalinga St W Pleasant St - NE 35 0 0 0 35 - $1,000
Curb ramp improvement S Coalinga St W Pleasant St - SE 35 0 0 0 35 - $1,000
Study: Crossing with RRFB E Polk St/Jayne Ave Willow Springs Ave - 35 0 0 0 35 - $20,000
Study: Crossing with RRFB E Polk St/Jayne Ave S Merced Ave - 35 0 0 0 35 - $20,000
Curb extension Elm Ave South of Truman St - 35 0 0 0 35 - $20,000
Study: Crossing with RRFB Elm Ave Phelps Ave - 35 0 0 0 35 - $20,000
continued
E-20
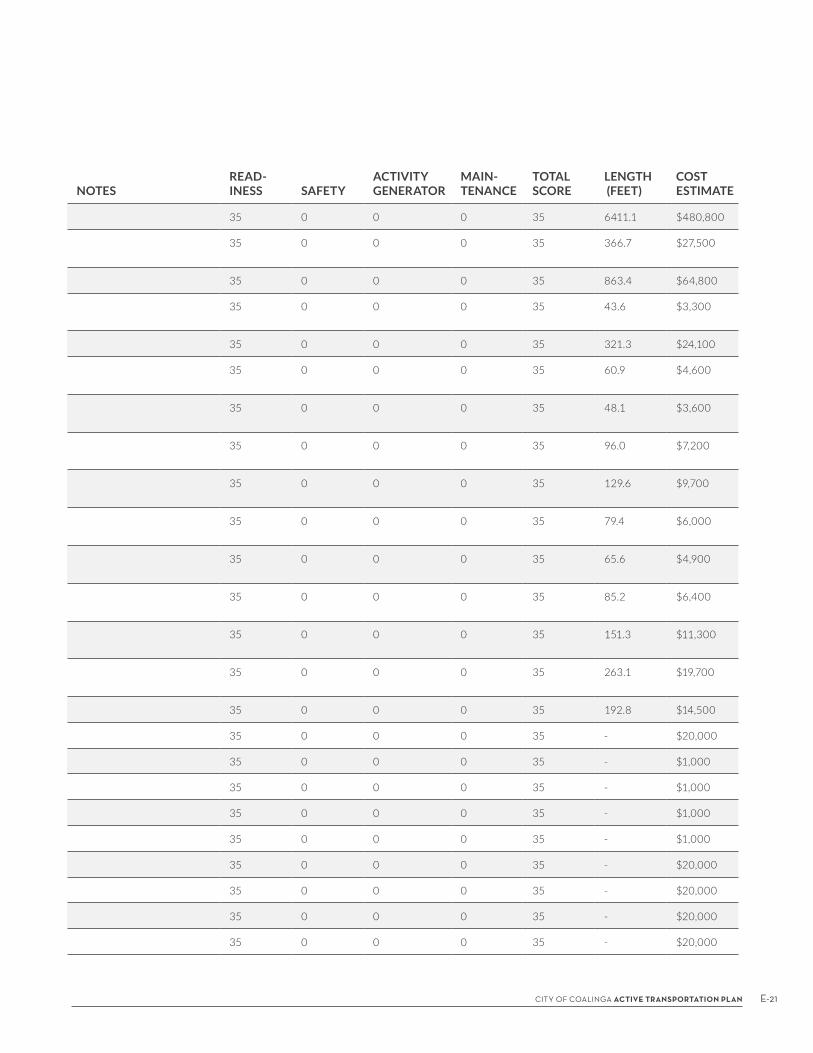
Table E-3: Tier 3 Project Recommendations
PROJECT LOCATION START END DIR. NOTESREAD- INESS SAFETY
ACTIVITY GENERATOR
MAIN- TENANCE
TOTAL SCORE
LENGTH (FEET)
COST ESTIMATE
Sidewalks E Polk St/Jayne Ave 650ft East of Enterprise Pkwy S Thompson St S 35 0 0 0 35 6411.1 $480,800
Sidewalks El Rancho Blvd Elm Ave 400ft West of Elm Ave
S 35 0 0 0 35 366.7 $27,500
Sidewalks Elm Ave El Rancho Blvd Phelps Ave W 35 0 0 0 35 863.4 $64,800
Sidewalks Elm Ave Phelps Ave 40ft South of Stop Line
W 35 0 0 0 35 43.6 $3,300
Sidewalks Baker St* Lincoln St Grant St N 35 0 0 0 35 321.3 $24,100
Sidewalks Tompson St* Polk St 90ft South of Polk St
E 35 0 0 0 35 60.9 $4,600
Sidewalks Pleasant St* 120ft East of Garfield St 170ft East of Garfield St
N 35 0 0 0 35 48.1 $3,600
Sidewalks Pleasant St* 160ft West of Tompson St 260ft West of Tompson St
N 35 0 0 0 35 96.0 $7,200
Sidewalks Garfield St* Valley St Alley South of Valley St
E 35 0 0 0 35 129.6 $9,700
Sidewalks Baker St* Buchanan St 100ft West of Buchanan St
S 35 0 0 0 35 79.4 $6,000
Sidewalks Harvard Ave 85ft West of California St 150ft West of California St
S 35 0 0 0 35 65.6 $4,900
Sidewalks Harvard Ave* 140ft East of Fresno St 230ft East of Fresno St
S 35 0 0 0 35 85.2 $6,400
Sidewalks Baker St Lincoln St Alley West of Lincoln St
S 35 0 0 0 35 151.3 $11,300
Sidewalks Cherry Ln* School Rd 225ft West of School Rd
N 35 0 0 0 35 263.1 $19,700
Sidewalks Adams St* Fresno St Murietta Way S 35 0 0 0 35 192.8 $14,500
Study: Stop Control Washington St Coalinga St - 35 0 0 0 35 - $20,000
Curb ramp improvement S Coalinga St W Pleasant St - NW 35 0 0 0 35 - $1,000
Curb ramp improvement S Coalinga St W Pleasant St - SW 35 0 0 0 35 - $1,000
Curb ramp improvement S Coalinga St W Pleasant St - NE 35 0 0 0 35 - $1,000
Curb ramp improvement S Coalinga St W Pleasant St - SE 35 0 0 0 35 - $1,000
Study: Crossing with RRFB E Polk St/Jayne Ave Willow Springs Ave - 35 0 0 0 35 - $20,000
Study: Crossing with RRFB E Polk St/Jayne Ave S Merced Ave - 35 0 0 0 35 - $20,000
Curb extension Elm Ave South of Truman St - 35 0 0 0 35 - $20,000
Study: Crossing with RRFB Elm Ave Phelps Ave - 35 0 0 0 35 - $20,000
E-21CITY OF COALINGA ACTIVE TRANSPORTATION PLAN
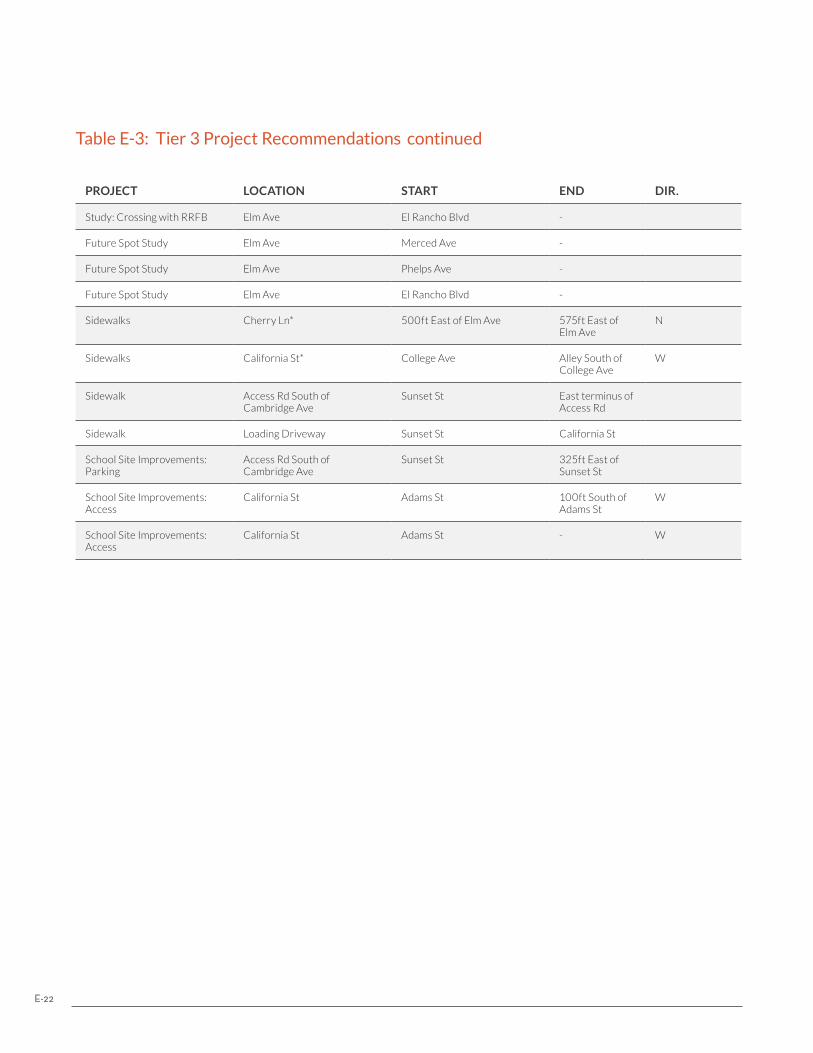
Table E-3: Tier 3 Project Recommendations
PROJECT LOCATION START END DIR. NOTESREAD- INESS SAFETY
ACTIVITY GENERATOR
MAIN- TENANCE
TOTAL SCORE
LENGTH (FEET)
COST ESTIMATE
Study: Crossing with RRFB Elm Ave El Rancho Blvd - 35 0 0 0 35 - $20,000
Future Spot Study Elm Ave Merced Ave - 35 0 0 0 35 - $20,000
Future Spot Study Elm Ave Phelps Ave - 35 0 0 0 35 - $20,000
Future Spot Study Elm Ave El Rancho Blvd - 35 0 0 0 35 - $20,000
Sidewalks Cherry Ln* 500ft East of Elm Ave 575ft East of Elm Ave
N 25 0 0 0 25 69.2 $5,200
Sidewalks California St* College Ave Alley South of College Ave
W 25 0 0 0 25 120.6 $9,000
Sidewalk Access Rd South of Cambridge Ave
Sunset St East terminus of Access Rd
Drainage impacts? DG path? 0 0 25 0 25 435.5 $32,700
Sidewalk Loading Driveway Sunset St California St 8 feet wide 0 0 25 0 25 471.6 $35,400
School Site Improvements: Parking
Access Rd South of Cambridge Ave
Sunset St 325ft East of Sunset St
Pave unpaved area 0 0 25 0 25 323.6 $24,300
School Site Improvements: Access
California St Adams St 100ft South of Adams St
W Path to access classrooms 0 0 25 0 25 64.6 $4,800
School Site Improvements: Access
California St Adams St - W Relocate access gate to corner
0 0 25 0 25 - $1,000
continued
E-22
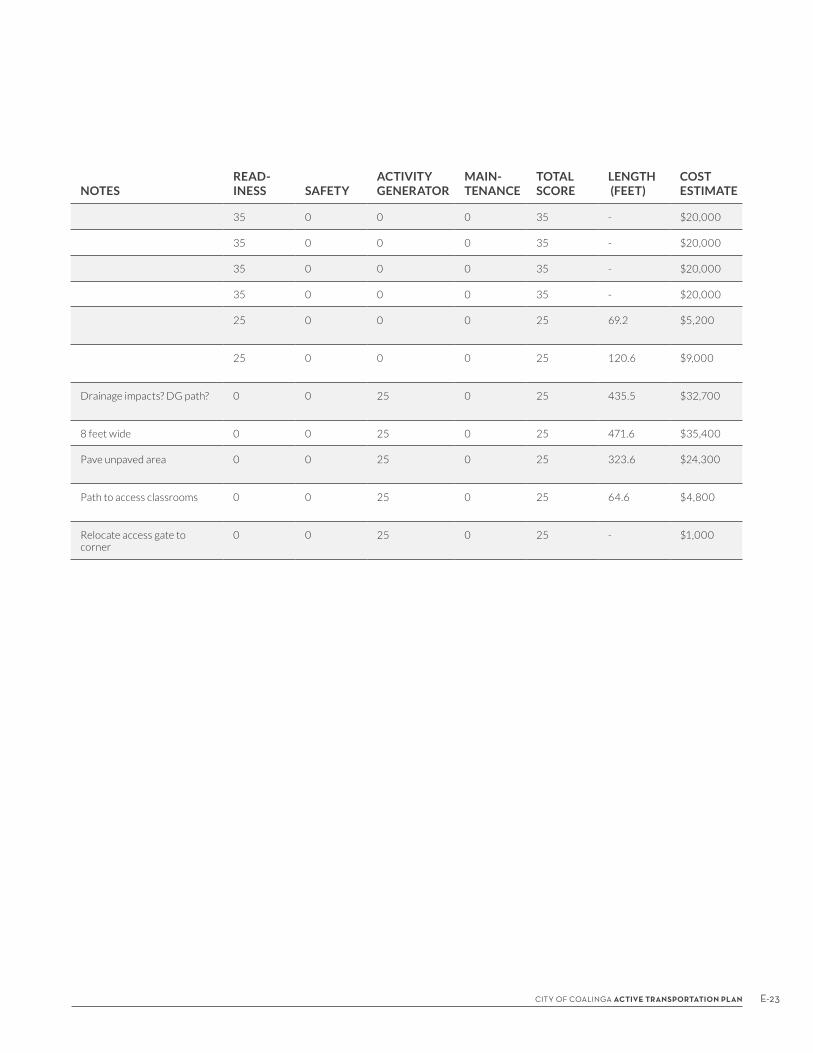
Table E-3: Tier 3 Project Recommendations
PROJECT LOCATION START END DIR. NOTESREAD- INESS SAFETY
ACTIVITY GENERATOR
MAIN- TENANCE
TOTAL SCORE
LENGTH (FEET)
COST ESTIMATE
Study: Crossing with RRFB Elm Ave El Rancho Blvd - 35 0 0 0 35 - $20,000
Future Spot Study Elm Ave Merced Ave - 35 0 0 0 35 - $20,000
Future Spot Study Elm Ave Phelps Ave - 35 0 0 0 35 - $20,000
Future Spot Study Elm Ave El Rancho Blvd - 35 0 0 0 35 - $20,000
Sidewalks Cherry Ln* 500ft East of Elm Ave 575ft East of Elm Ave
N 25 0 0 0 25 69.2 $5,200
Sidewalks California St* College Ave Alley South of College Ave
W 25 0 0 0 25 120.6 $9,000
Sidewalk Access Rd South of Cambridge Ave
Sunset St East terminus of Access Rd
Drainage impacts? DG path? 0 0 25 0 25 435.5 $32,700
Sidewalk Loading Driveway Sunset St California St 8 feet wide 0 0 25 0 25 471.6 $35,400
School Site Improvements: Parking
Access Rd South of Cambridge Ave
Sunset St 325ft East of Sunset St
Pave unpaved area 0 0 25 0 25 323.6 $24,300
School Site Improvements: Access
California St Adams St 100ft South of Adams St
W Path to access classrooms 0 0 25 0 25 64.6 $4,800
School Site Improvements: Access
California St Adams St - W Relocate access gate to corner
0 0 25 0 25 - $1,000
E-23CITY OF COALINGA ACTIVE TRANSPORTATION PLAN
CITY OF SELMA ACTIVE
TRANSPORTATION PLAN2017
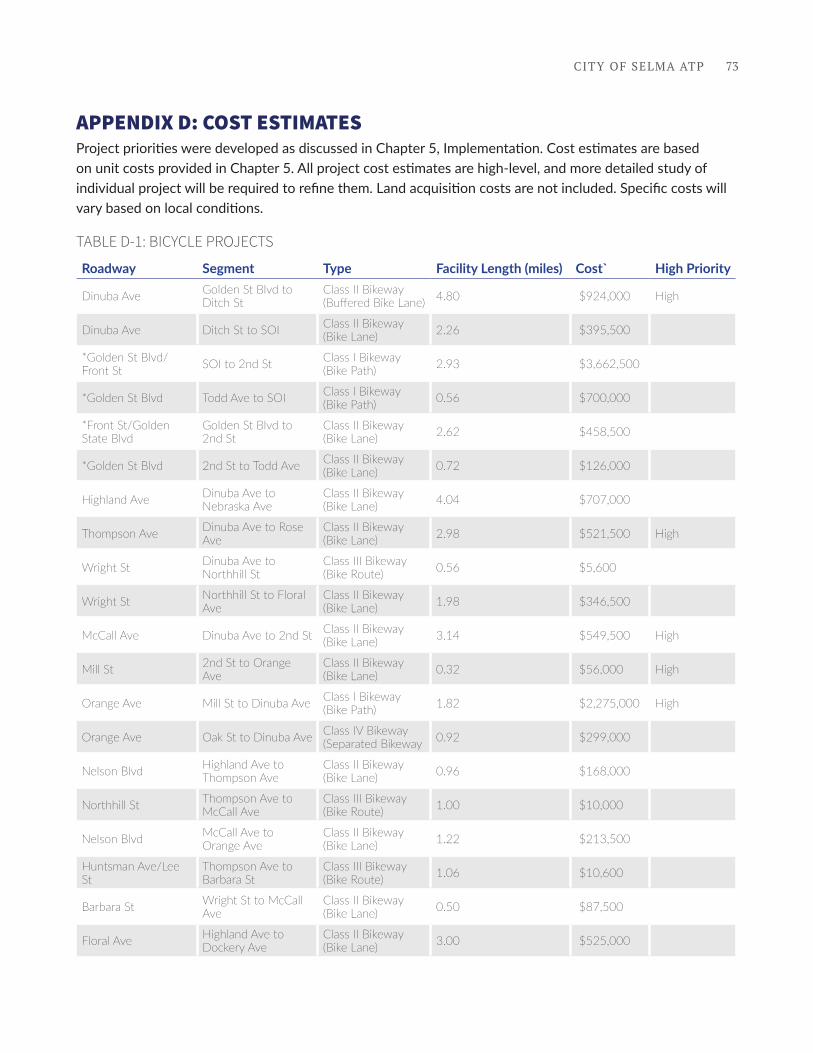
CITY OF SELMA ATP 73
APPENDIX D: COST ESTIMATESProject priorities were developed as discussed in Chapter 5, Implementation. Cost estimates are based on unit costs provided in Chapter 5. All project cost estimates are high-level, and more detailed study of individual project will be required to refine them. Land acquisition costs are not included. Specific costs will vary based on local conditions.
TABLE D-1: BICYCLE PROJECTS
Roadway Segment Type Facility Length (miles) Cost` High Priority
Dinuba Ave Golden St Blvd to Ditch St
Class II Bikeway (Buffered Bike Lane) 4.80 $924,000 High
Dinuba Ave Ditch St to SOI Class II Bikeway (Bike Lane) 2.26 $395,500
*Golden St Blvd/Front St SOI to 2nd St Class I Bikeway
(Bike Path) 2.93 $3,662,500
*Golden St Blvd Todd Ave to SOI Class I Bikeway (Bike Path) 0.56 $700,000
*Front St/Golden State Blvd
Golden St Blvd to 2nd St
Class II Bikeway (Bike Lane) 2.62 $458,500
*Golden St Blvd 2nd St to Todd Ave Class II Bikeway (Bike Lane) 0.72 $126,000
Highland Ave Dinuba Ave to Nebraska Ave
Class II Bikeway (Bike Lane) 4.04 $707,000
Thompson Ave Dinuba Ave to Rose Ave
Class II Bikeway (Bike Lane) 2.98 $521,500 High
Wright St Dinuba Ave to Northhill St
Class III Bikeway (Bike Route) 0.56 $5,600
Wright St Northhill St to Floral Ave
Class II Bikeway (Bike Lane) 1.98 $346,500
McCall Ave Dinuba Ave to 2nd St Class II Bikeway (Bike Lane) 3.14 $549,500 High
Mill St 2nd St to Orange Ave
Class II Bikeway (Bike Lane) 0.32 $56,000 High
Orange Ave Mill St to Dinuba Ave Class I Bikeway (Bike Path) 1.82 $2,275,000 High
Orange Ave Oak St to Dinuba Ave Class IV Bikeway (Separated Bikeway 0.92 $299,000
Nelson Blvd Highland Ave to Thompson Ave
Class II Bikeway (Bike Lane) 0.96 $168,000
Northhill St Thompson Ave to McCall Ave
Class III Bikeway (Bike Route) 1.00 $10,000
Nelson Blvd McCall Ave to Orange Ave
Class II Bikeway (Bike Lane) 1.22 $213,500
Huntsman Ave/Lee St
Thompson Ave to Barbara St
Class III Bikeway (Bike Route) 1.06 $10,600
Barbara St Wright St to McCall Ave
Class II Bikeway (Bike Lane) 0.50 $87,500
Floral Ave Highland Ave to Dockery Ave
Class II Bikeway (Bike Lane) 3.00 $525,000
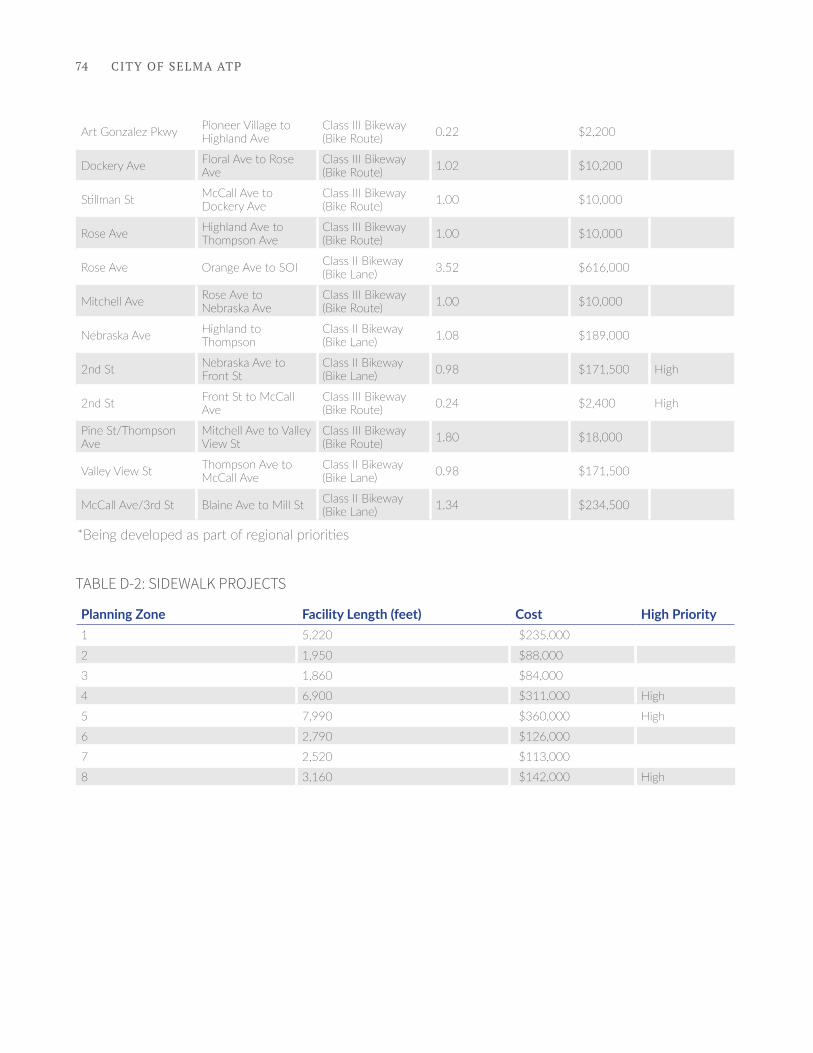
CITY OF SELMA ATP74
Art Gonzalez Pkwy Pioneer Village to Highland Ave
Class III Bikeway (Bike Route) 0.22 $2,200
Dockery Ave Floral Ave to Rose Ave
Class III Bikeway (Bike Route) 1.02 $10,200
Stillman St McCall Ave to Dockery Ave
Class III Bikeway (Bike Route) 1.00 $10,000
Rose Ave Highland Ave to Thompson Ave
Class III Bikeway (Bike Route) 1.00 $10,000
Rose Ave Orange Ave to SOI Class II Bikeway (Bike Lane) 3.52 $616,000
Mitchell Ave Rose Ave to Nebraska Ave
Class III Bikeway (Bike Route) 1.00 $10,000
Nebraska Ave Highland to Thompson
Class II Bikeway (Bike Lane) 1.08 $189,000
2nd St Nebraska Ave to Front St
Class II Bikeway (Bike Lane) 0.98 $171,500 High
2nd St Front St to McCall Ave
Class III Bikeway (Bike Route) 0.24 $2,400 High
Pine St/Thompson Ave
Mitchell Ave to Valley View St
Class III Bikeway (Bike Route) 1.80 $18,000
Valley View St Thompson Ave to McCall Ave
Class II Bikeway (Bike Lane) 0.98 $171,500
McCall Ave/3rd St Blaine Ave to Mill St Class II Bikeway (Bike Lane) 1.34 $234,500
TABLE D-2: SIDEWALK PROJECTS
Planning Zone Facility Length (feet) Cost High Priority1 5,220 $235,000
2 1,950 $88,000
3 1,860 $84,000
4 6,900 $311,000 High
5 7,990 $360,000 High
6 2,790 $126,000
7 2,520 $113,000
8 3,160 $142,000 High
*Being developed as part of regional priorities
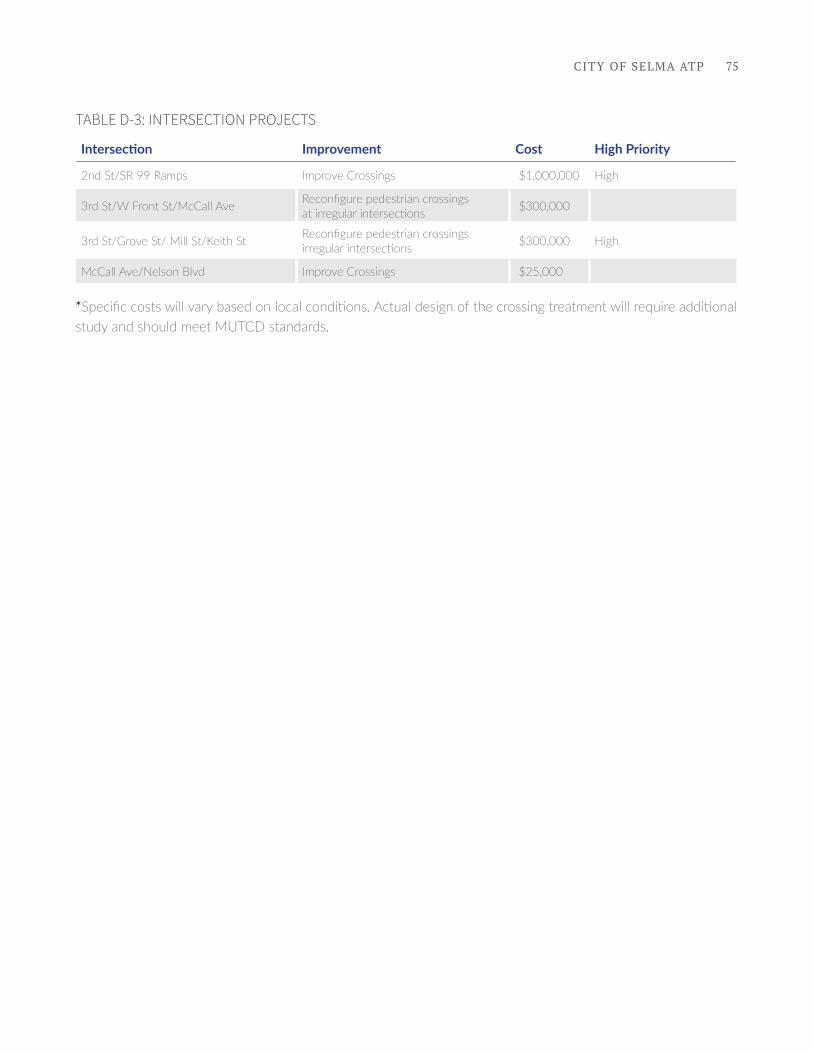
CITY OF SELMA ATP 75
TABLE D-3: INTERSECTION PROJECTS
Intersection Improvement Cost High Priority
2nd St/SR 99 Ramps Improve Crossings $1,000,000 High
3rd St/W Front St/McCall Ave Reconfigure pedestrian crossings at irregular intersections $300,000
3rd St/Grove St/ Mill St/Keith St Reconfigure pedestrian crossings irregular intersections $300,000 High
McCall Ave/Nelson Blvd Improve Crossings $25,000
*Specific costs will vary based on local conditions. Actual design of the crossing treatment will require additional study and should meet MUTCD standards.
CITY OF FRESNO ACTIVE
TRANSPORTATION PLAN2016
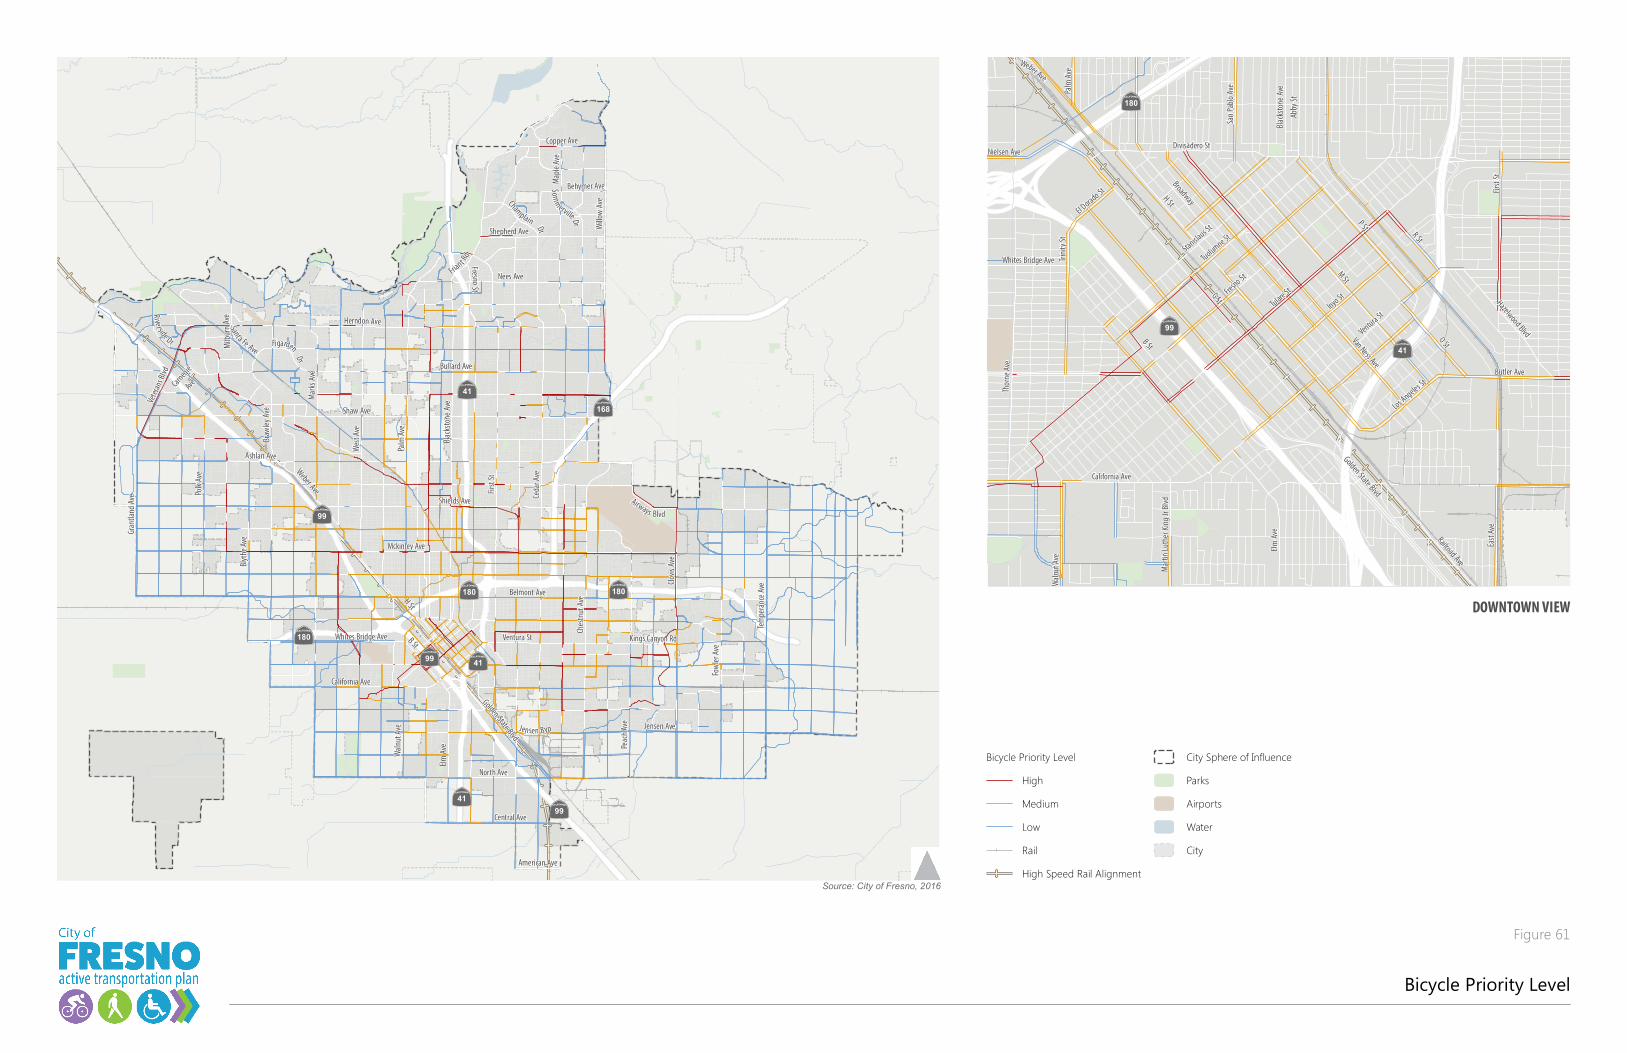
DOWNTOWN VIEW
|þ41
|þ168
|þ99
|þ180
|þ180
|þ99 |þ41
|þ180
|þ41|þ99
Wes
t Ave
Blyt
he A
ve
Palm
Ave
Firs
t St
Fow
ler A
ve
Belmont Ave
Shaw Ave
Bullard Ave
Ches
tnut
Ave
Ashlan Ave
Herndon Ave
Mckinley Ave
Ventura St Kings Canyon Rd
Jensen Ave
H St
North Ave
Shields Ave
California Ave
Polk
Ave
Friant Rd
Weber Ave
Braw
ley
Ave
Nees Ave
Shepherd Ave
Map
le A
ve
Golden State Blvd
Milb
urn
Ave
Vete
rans
Blvd
Tem
pera
nce
Ave
Whites Bridge Ave
Carneg
ieAve
B St
Copper Ave
Behymer Ave
Wal
nut A
ve
Gran
tland
Ave
Jen sen Byp
Sant a Fe Ave
Central Ave
River side Dr
American Ave
Ceda
r Ave
Clov
is Av
e
Mar
ks A
ve
Blac
ksto
ne A
ve
Figarden
Dr
Peac
h Av
e
So mm
erville Dr
Elm
Ave
FresnoSt
Will
ow A
veChamplain
Dr
Airways Blvd
Bicycle Priority Level
|þ99
|þ41
|þ180
Whites Bridge Ave
G St
Firs
t St
H St
Los Angeles S
t
Divisadero St
Van Ness Ave
Butler Ave
California Ave
R St
Ventura StTulare St
Trin
ity S
t
Tuolumne St
Stanislaus S
t
Inyo St
San
Pabl
o Av
e
Hazelwood Blvd
Mar
tin L
uthe
r Kin
g Jr
Blv
d
Blac
ksto
ne A
ve
El Dorado St
Weber Ave
Palm
Ave
M St
O St
B St
East
Ave
Abby
St
Elm
Ave
Wal
nut A
ve
Railroad Ave
Nielsen Ave
Golden State Blvd
Fresno St
Thor
ne A
ve
P St
Broadway
Source: City of Fresno, 2016
Bicycle Priority LevelHighMediumLowRailHigh Speed Rail Alignment
City Sphere of InfluenceParksAirportsWaterCity
Figure 61
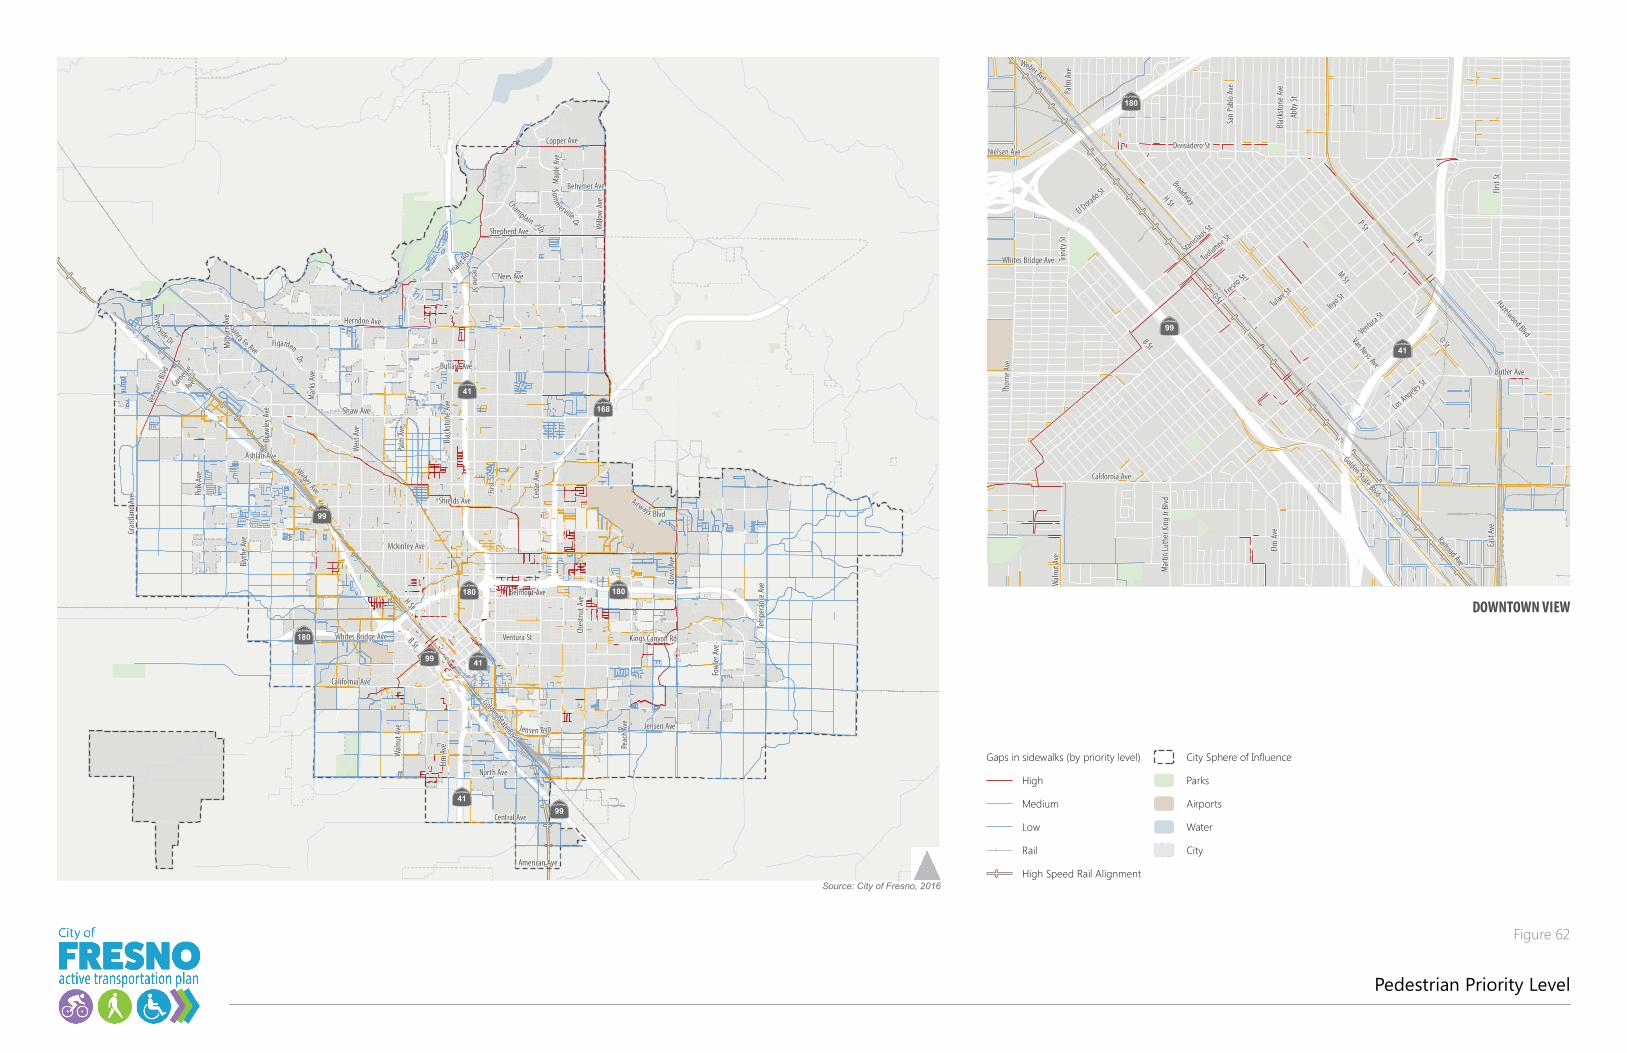
DOWNTOWN VIEW
|þ41
|þ168
|þ99
|þ180
|þ180
|þ99 |þ41
|þ180
|þ41|þ99
Wes
t Ave
Blyt
he A
ve
Palm
Ave
Firs
t St
Fow
ler A
ve
Belmont Ave
Shaw Ave
Bullard Ave
Ches
tnut
Ave
Ashlan Ave
Herndon Ave
Mckinley Ave
Ventura St Kings Canyon Rd
Jensen Ave
H St
North Ave
Shields Ave
California Ave
Polk
Ave
Friant Rd
Weber Ave
Braw
ley
Ave
Nees Ave
Shepherd Ave
Map
le A
ve
Golden State Blvd
Milb
urn
Ave
Vete
rans
Blvd
Tem
pera
nce
Ave
Whites Bridge Ave
Carneg
ieAve
B St
Copper Ave
Behymer Ave
Wal
nut A
ve
Gran
tland
Ave
Jen sen Byp
Sant a Fe Ave
Central Ave
River side Dr
American Ave
Ceda
r Ave
Clov
is Av
e
Mar
ks A
ve
Blac
ksto
ne A
ve
Figarden
Dr
Peac
h Av
e
So mm
erville Dr
Elm
Ave
FresnoSt
Will
ow A
veChamplain
Dr
Airways Blvd
Pedestrian Priority Level
|þ99
|þ41
|þ180
Whites Bridge Ave
G St
Firs
t St
H St
Los Angeles S
t
Divisadero St
Van Ness Ave
Butler Ave
California Ave
R St
Ventura StTulare St
Trin
ity S
t
Tuolumne St
Stanislaus S
t
Inyo St
San
Pabl
o Av
e
Hazelwood Blvd
Mar
tin L
uthe
r Kin
g Jr
Blv
d
Blac
ksto
ne A
ve
El Dorado St
Weber Ave
Palm
Ave
M St
O St
B St
East
Ave
Abby
St
Elm
Ave
Wal
nut A
ve
Railroad Ave
Nielsen Ave
Golden State Blvd
Fresno St
Thor
ne A
ve
P St
Broadway
Source: City of Fresno, 2016
Gaps in sidewalks (by priority level)HighMediumLowRailHigh Speed Rail Alignment
City Sphere of InfluenceParksAirportsWaterCity
Figure 62
FRESNO COUNTY REGIONAL ACTIVE TRANSPORTATION PLAN E-1
Appendix E
FUNDING SOURCES
Table 5-3, Funding Sources, listed many funding programs available for projects discussed in this plan. Th ese programs are further described below.
FEDERAL PROGRAMS
Th e majority of public funds for bicycle, pedestrian, and trails projects are derived through a core group of federal and state programs. Federal funding is authorized through the Surface Transportation Block Grant Program (STBGP). Th e STBGP provides fl exible funding that may be used by states and localities for projects on any federal-aid highway. In the past this funding was authorized by the Surface Transportation Program (STP) in the Moving Ahead for Progress in the 21st Century Act (MAP-21). Funding for STBGP is now authorized through the Fixing America’s Surface Transportation (FAST) Act, with the same goals as STP funding.
FAST continues the Highway Safety Improvement Program (HSIP). Th ese federal funds are allocated by Caltrans and described in further detail below.
Th e Transportation Alternatives Program (TAP), authorized through MAP-21, provides funding for programs and projects defi ned as transportation alternatives, including on- and off -road pedestrian and bicycle facilities, transit access, mobility, and recreation trails program. Th is program is now part of the STBGP in FAST instead of a stand-alone program as it was under MAP-21.
Th e Congestion Mitigation and Air Quality Improvement
Program (CMAQ) also authorizes federal funds, including education programs. FAST maintains the existing CMAQ program from MAP-21.
Federal funds from STBGP, TAP, and CMAQ programs are allocated to Fresno COG. Distribution is allocated either competitively or proportionally according to jurisdiction population. Fresno COG STBG program information: http://www.fresnocog.org/regional-surface-transportation-program
Th e HUD-DOT-EPA Interagency Partnership for Sustainable Communities periodically off ers funding opportunities. Previous programs have included Urban Circulator grants, TIGER grants, and Sustainable Communities Planning grants.
STATE PROGRAMS
Th ere are a number of statewide funding sources and regionally administered funds.
Active Transportation Program
Th e Active Transportation Program was created by SB 99 / Assembly Bill 101 to encourage increased use of active modes of transportation such as biking and walking. Th e program consolidates fi ve existing state funded programs: Transportation Alternatives Program, Recreational Trails program, Safe Routes to Schools, Environmental Enhancement and Mitigation Program and the Bicycle Transportation Account. It provides a comprehensive program that improves program planning and fl exibility
FRESNO COUNTY REGIONAL ACTIVE TRANSPORTATION PLANE-2
and is more effi cient than multiple programs. Another benefi t is that funds can be directed to multi-year projects to make greater long-term improvements to active transportation.
Th e Active Transportation Program mixes state and federal funds and provides approximately $130 million annually, with a focus on implementing active transportation improvements to support the goals of local SB 375 sustainable community strategies. Th is program is funded from a combination of federal and state funds from appropriations in the annual state budget act. Forty percent of the funding will go toward metropolitan planning organizations in urban areas with populations greater than 200,000. Ten percent of the funds go to small urban and rural regions. Th e remaining funds will go to the California Transportation Commission for statewide projects. Th e ATP ensures that disadvantaged communities fully share in the benefi ts of the program by requiring that a minimum of 25% of funds be distributed to disadvantaged communities.
In order to maximize the eff ectiveness of program funds and to encourage the aggregation of small projects into a comprehensive bundle of projects, the minimum request for statewide Active Transportation Program funds that will be considered is $250,000. Th is minimum does not apply to non-infrastructure projects, Safe Routes to Schools projects, and recreational trails projects.
Project types allowed under the ATP include: new bikeways serving major transportation corridors, new bikeways to improve bicycle commuting options, bicycle parking at transit and employment centers, traffi c control devices to improve pedestrian and bicycle safety, improving and maintaining safety on existing bikeways, recreational facilities, Safe Routes to School projects, Safe Routes To Transit projects, education programs, and other improvements to bicycle-transit connections and urban environments.
For a project to contribute toward the Safe Routes to School funding requirement, the project must directly increase safety and convenience for public school students to walk and/or bike to school. Safe Routes to Schools infrastructure projects must be located within two miles of a public school or within the vicinity of a public school bus stop. Other than traffi c education and enforcement activities, non-infrastructure projects do not have a location restriction.
Highway Safety Improvement Program
Caltrans administers the Highway Safety Improvement Program (HSIP) specifi ed as part of the FAST Act. Th is program uses cost-benefi t ratios as a primary factor in the awarding of applications. Because the program focuses on roadway safety, projects with documented collision history – through frequency of collision but particularly collision severity – are typically ranked higher. Roadways with
documented bicycle and pedestrian collision history may be well qualifi ed for HSIP applications, particularly since many of the proposed projects would improve bicyclist and pedestrian safety at a lower cost than many of the highway projects also eligible under this funding source.
While this funding source is oft en used for major roadway improvement projects, installation of traffi c signals, and most other cost-intensive projects, funding has routinely been awarded to bicycle and pedestrian projects. Successful projects have included:
• Median refuges and curb extensions
• Curb, gutter, and sidewalk
• Paved shoulders
• Upgraded traffi c signals with pedestrian countdown signals and pedestrian-scale lighting
• Bicycle lane striping
• Crosswalk striping
• In-pavement fl ashers and rectangular rapid fl ashing beacons (RRFB) at crossings
Many of these projects were applied for as standalone bicycle and pedestrian improvement projects; some bicycle and pedestrian improvements were included with a broader package of roadway improvement projects.
More information is available online: http://www.dot.ca.gov/hq/LocalPrograms/hsip.htm
Other Statewide Funding Programs
Caltrans Transportation Planning Grants are available to jurisdictions and can be used for planning or feasibility studies. Th e Division will award approximately $9.8 million in funding through two Grant Programs for Fiscal Year 2016-17. Th e maximum funding available per project is $500,000.
Limited amounts (2%) from the Local Transportation Fund (LTF), which is part of the Transportation Development Act (TDA) and derived from a ¼ cent of the general sales tax collected statewide, can be used for bicycle and pedestrian facilities. Article 3 funds for planning and construction of pedestrian and bicycle facilities are administered locally through Fresno COG and are allocated to member agencies based on population and taxable sales.
Th e California State Parks administers the state’s Recreational Trails Program (RTP). Th e RTP provides funds annually for recreational trails and trails-related projects. Cities are eligible applicants for the annual funding ($8.4 million in 2015). Th e program requires an applicant match of 12 percent of the total project cost.
FRESNO COUNTY REGIONAL ACTIVE TRANSPORTATION PLAN E-3
Th e National Park Service and California State Parks administer the Land and Water Conservation Fund (LWCP). Th e LWCF Program provides matching grants to states and local governments for the acquisition and development of public outdoor recreation areas and facilities. Grants require a 50 percent local match.
Th e Aff ordable Housing and Sustainable Communities (AHSC) Program is administered by the Strategic Growth Council. AHSC funds can be used for projects which demonstrate VMT reduction through fewer or shorter vehicle trips or mode shift to transit use, bicycling or walking within areas lacking high quality transit, with an emphasis on providing disadvantaged community benefi ts. Th e project area must be served by at least one transit stop. More information is available at https://www.sgc.ca.gov/s_ahscprogram.php.
Th e Offi ce of Traffi c Safety provides grants for safety outreach to schools and community groups. More information is available at http://ots.ca.gov/Grants/.
FRESNO COUNTY TRANSPORTATION AUTHORITY (FCTA) MEASURE C
In 1986, Fresno County voters passed Measure C, a 20-year, ½-cent sales tax aimed at improving the overall quality of Fresno County’s transportation system. In 2006, voters chose to extend Measure C for another 20 years until 2027. Th e Local Transportation Program can be used on pedestrian and bicycle facilities and trails. Funding may also be used for maintenance, with certain conditions. Funding is allocated to cities and the county based on population.
SAN JOAQUIN VALLEY AIR POLLUTION CONTROL DISTRICT (SJVAPCD) BIKEWAY INCENTIVE PROGRAM
SJVAPCD provides funds to increase commuter bicycle accessibility and utilization as an alternative transportation measure. Funds may be used for Class I, II, or III bikeways in amounts up to $150,000 (depending on bikeway type).
More information is available online: http://valleyair.org/grants/bikepaths.htm.
FRESNO COUNTY REGIONAL ACTIVE TRANSPORTATION PLANF-1
Appendix F
JURISDICTIONAL RESOLUTIONS ADOPTING THE PLAN
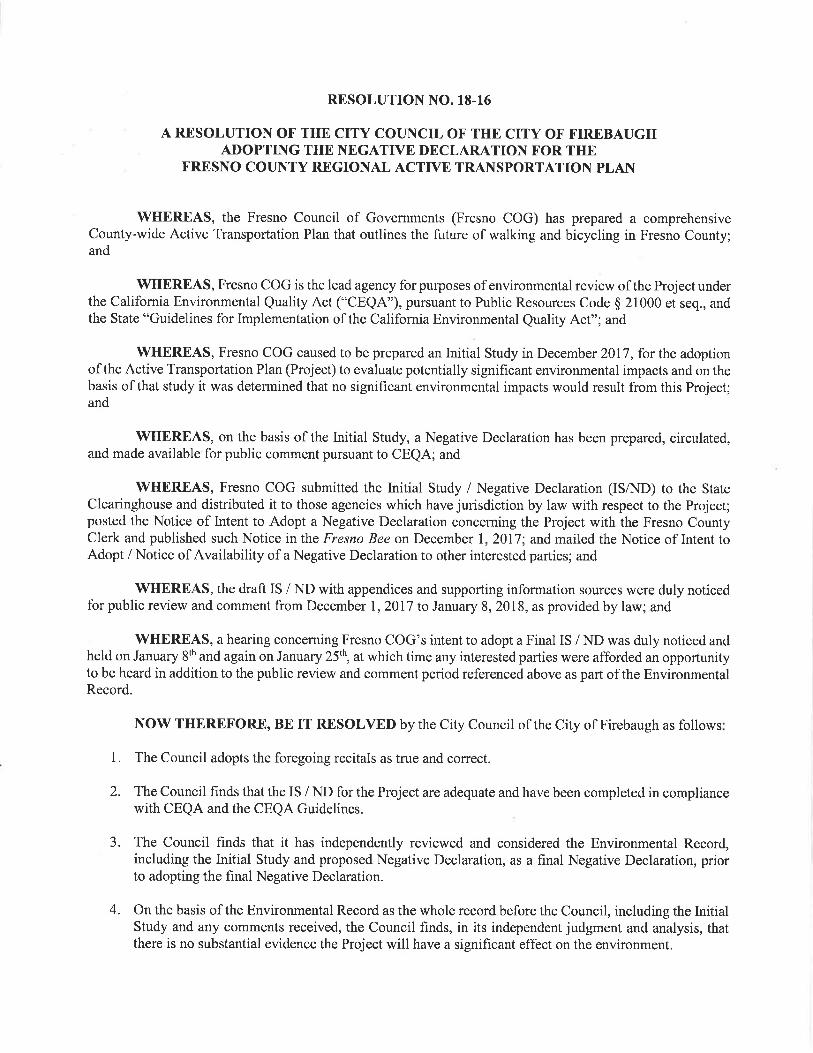
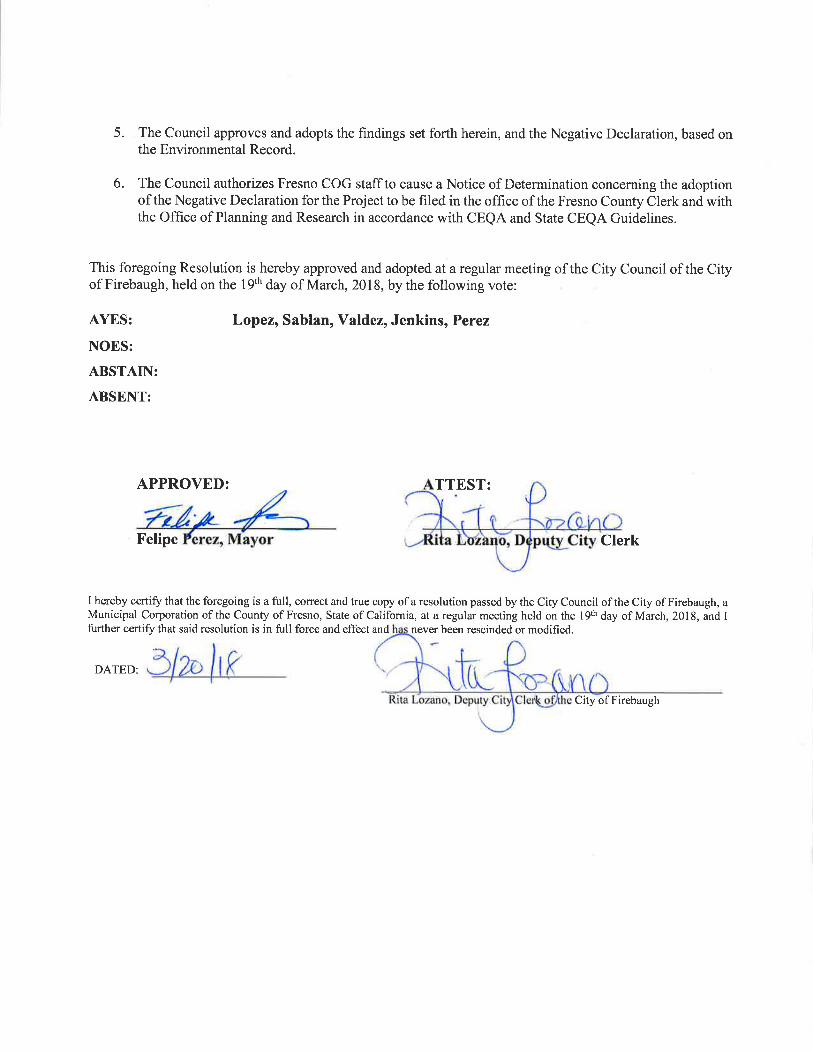

RESOLUTION NO. 18·14
A RESOLUTION OF THE CITY COUNCIL OF THE CITY OF KERMAN ADOPTINGTHE NEGATIVE DECLARATION FOR THE FRESNO COUNTY
REGIONAL ACTIVE TRANSPORTATION PLAN
WHEREAS, the Fresno Council of Governments (Fresno COG) has prepared a comprehensiveCounty-wide Active Transportation Plan that outlines the future of walking and bicycling in Fresno County;and
WHEREAS, Fresno COG is the lead agency for purposes of environmental review of the Projectunder the California Environmental Quality Act ("CEQA"), pursuant to Public Resources Code § 21000 etseq., and the State "Guidelines for Implementation of the California Environmental Quality Act"; and
WHEREAS, Fresno COG caused to be prepared an Initial Study in December 2017, for the adoptionof the Active Transportation Plan (Project) to evaluate potentially significant environmental impacts and onthe basis of that study it was determined that no significant environmental impacts would result from thisProject; and
WHEREAS, on the basis of the Initial Study, a Negative Declaration has been prepared, circulated,and made available for public comment pursuant to CEQA; and
WHEREAS, Fresno COG submitted the Initial Study I Negative Declaration (IS/ND) to the StateClearinghouse and distributed it to those agencies which have jurisdiction by law with respect to the Project;posted the Notice of Intent to Adopt a Negative Declaration concerning the Project with the Fresno CountyClerk and published such Notice in the Fresno Bee on December 1, 2017; and mailed the Notice of Intent toAdopt I Notice of Availability of a Negative Declaration to other interested parties; and
WHEREAS, the draft IS I ND with appendices and supporting information sources were duly noticedfor public review and comment from December 1, 2017 to January 8, 2018, as provided by law; and
WHEREAS, a hearing concerning Fresno COG's intent to adopt a Final IS I NDwas duly noticed andheld on January 8 and again on January 25, at which time any interested parties were afforded an opportunityto be heard in addition to the public review and comment period referenced above as part of the EnvironmentalRecord.
THEREFORE, BE IT RESOLVED that the City Council finds, determines and resolves as follows:
1. The Council adopts the foregoing recitals as true and correct.
2. The Council finds that the IS I ND for the Project are adequate and have been completedin compliance with CEQA and the CEQA Guidelines.
3. The Council finds that it has independently reviewed and considered the EnvironmentalRecord, including the Initial Study and proposed Negative Declaration, as a final NegativeDeclaration, prior to adopting the final Negative Declaration.
4. On the basis of the Environmental Record as the whole record before the Council, includingthe Initial Study and any comments received, the Council finds, in its independent judgmentand analysis, that there is no substantial evidence the Project will have a significant effecton the environment.
5. The Council approves and adopts the findings set forth herein, and the NegativeDeclaration, based on the Environmental Record.
6. The Council authorizes Fresno COG staff to cause a Notice of Determination concerningthe adoption of the Negative Declaration for the Project to be filed in the office of the FresnoCounty Clerk and with the Office of Planning and Research in accordance with CEQA andState CEQA Guidelines.
Passed and adopted at a regular Meeting of the City Council of the City of Kerman held on 21st of March2018, by the following vote:
AYES: Dhaliwal, Sandoval, Arvance, Yep
NOES: None
ABSENT: Armstrong
ABSTAIN: None
The foregoing resolution is hereby approved.
Mayor Pro TemATTEST:
RESOLUTION NO. 18·15
A RESOLUTION OF THE CITY COUNCIL OF THE CITY OF KERMANADOPTING THE FRESNO COUNTY REGIONAL TRANSPORTATION PLAN
WHEREAS, the Fresno County Regional Active Transportation Plan complies with the CaliforniaTransportation Commission 2017 Active Transportation Program Guidelines; and
WHEREAS, the Fresno County Regional Active Transportation Plan is in compliance with the 2014Fresno Council of Governments Regional Transportation Plan and Sustainable Communities Strategy; and
WHEREAS, the Fresno County RegionalActive Transportation Plan is an implementation tool to eachof Fresno COG's member agencies' General Plan Circulation Elements; and
WHEREAS, the Fresno County Regional Active Transportation Plan promotes walking and biking fortransportation and recreation by all members of the community by creating a connected and complete networkof trails, walkways, and bikeways that provide safe, convenient, and enjoyable connections to key destinationsand neighborhoods; and
WHEREAS, the Fresno County Regional Active Transportation Plan promotes pedestrian andbicyclist safety and collision reduction; and
WHEREAS, the Fresno County Regional Active Transportation Plan will improve the accessibility offunding for pedestrian and bicycle related-related improvements for all Fresno COG member agencies; and
WHEREAS, approval of the Fresno County Regional Active Transportation Plan meets the eligibilityrequirements for Active Transportation Program funding.
NOW, THEREFORE, BE IT RESOLVED that the City of Kerman City Council hereby approves the FresnoCounty Regional Active Transportation Plan
Passed and adopted at a regular Meeting of the City Council of the City of Kerman held on 21st of March2018, by the following vote:
AYES: Dhaliwal, Sandoval, Arvance, YepNOES: None
ABSENT: ArmstrongABSTAIN: None
The foregoing resolution is hereby approved.
G~l¥Mayor Pro TemATTEST:
~City Clerk