Embed Size (px)
Citation preview
ABSTRACT
Title of Dissertation: RELATIONSHIP OF PRINCIPAL'S LEADERSHIP
BEHAVIORS TO ACADEMIC ACHIEVEMENT AND
SCHOOL IMPROVEMENT EFFORTS
Betty Williams King, Doctor of Philosophy, 2006
Dissertation directed by: Professor Emeritus James DudleyDepartment of Education Policy and Leadership
The purpose of this study was to compare the extent to which leadership
behavior of principals differs in schools at risk for reconstitution and in schools judged
as meeting state standards; and to determine the extent to which principals in these
schools employ frame utilization strategies for school improvement as designed by
Bolman and Deal (1992a). The sample population for the study was randomly
selected by the school district's Division of Research Evaluation Assessment and
Accountability (DREAA). Ten schools were selected to participate in the study: five
schools labeled "at risk" and five schools "making adequate progress."
Data collection was performed in 2006. The Leadership Orientation Survey
designed by Bolman and Deal (1990) was distributed to principals, immediate
supervisors of the principals, teachers, parents, and community representatives who
serve on the School Improvement Team (SIT) in each school. The survey measured
the extent to which leaders use four frames of leadership: structural, human resource,
political, and symbolic.

Cronbach alpha, a measure of inter-item reliability, was computed for each of
the four frames. All were .75 or higher, indicating that the survey was reliable. Inter-
scale correlations were computed for schools making adequate progress and for
schools at risk. The correlations for teachers, parents, and community representatives
for both school groups were strong and statistically significant, most in the .75 to .95
range. For principals and supervisors, the results of the correlational analysis were
mixed. Some correlations were strong and statistically significant, .80 to .95, and
others were weak and in some cases negative. This may be due primarily to the small
number of principals in the study, four in each group of schools. The same limitation
was true for supervisors, where there were five in each group of schools. A
correlation is a measure of a linear relationship between two variables. It can range
from -1.00 to +1.00.
The results of the statistical analysis of the three research questions using
independent t-tests indicated that for principals, supervisors, teachers, parents, and
community representatives, there were almost no statistically significant differences in
the use of the four frames for the schools making adequate progress or for the schools
at risk. All of the means indicated that the principals were judged to often use the
different frames. The only exception was the human resource frame, where there was
a statistically significant difference favoring principals in the schools making adequate
progress. The demographics information indicated that the most qualified
professionals were found in the schools making adequate progress.
RELATIONSHIP OF PRINCIPAL'S LEADERSHIP BEHAVIORSTO ACADEMIC ACHIEVEMENT AND SCHOOL
IMPROVEMENT EFFORTS
by
Betty Williams King
Dissertation submitted to the Faculty of the Graduate School of theUniversity of Maryland, College Park in partial fulfillment
of the requirements for the degree ofDoctor of Philosophy
2006
Advisory Committee:Professor Emeritus James Dudley, Chairperson/AdvisorDr. Gilbert R. AustinDr. Carol ParhamDr. Frank SchmidtleinDr. Thomas Weible

Copyright by
Betty Williams King

ii
DEDICATION
This research project is dedicated to my family who supported and encouraged
me throughout this process. Though it was my husband who was aware of my desire
to complete the program, my children and other family members were there for me in
many ways. Many thanks to former administrators; to colleagues who currently serve
as administrators at various levels; to teachers who worked with me over the years and
have remained my friends; and finally to the students, who will always be my
inspiration for seeking to learn more so that I might do more to provide programs that
will result in positive and productive outcomes for them. Again, thank you and much
love and appreciation to all of you.
iii
ACKNOWLEDGMENTS
Sincere gratitude is extended to many who contributed to the completion of
this research study. First, to the chairperson of my committee, Dr. James Dudley, for
his willingness to serve in this capacity. His leadership and guidance were invaluable.
To my dissertation committee—Dr. Thomas Weible, Dr. Frank Schmidtlein, Dr. Carol
Parham, and Dr. Gilbert Austin, for clear and purposeful direction throughout the
experience. To the Division of Research, Evaluation, Assessment and Accountability
in the state where this study was conducted, for their assistance. To the supervisors,
administrators, school staffs and others who participated in the study. To the office
staff in the Department of Education Policy and Planning at UMCP, who were always
congenial, helpful, and most efficient when answering questions regarding "next
steps." Finally, to University of Maryland support programs that enabled me to
achieve this lifetime goal. Thanks to all of you.
iv
TABLE OF CONTENTS
List of Tables ...................................................................................................... vi
Chapter I INTRODUCTION ................................................................. 1
Leadership ....................................................................................... 4Pre-Implementation Phase ..................................................... 5Implementation Phase............................................................ 6
Significance of the Study ................................................................ 9Statement of the Problem ................................................................ 10Conceptual Orientation ................................................................... 12Research Questions ......................................................................... 13Definitions of Terms ....................................................................... 13Limitations of the Study.................................................................. 15Delimitations ................................................................................... 15Organization of the Study ............................................................... 16
Chapter II REVIEW OF THE LITERATURE ....................................... 17
Organizational Behavior in Education ............................................ 17Leadership and Management .......................................................... 19School Reform and Accountability ................................................. 26
Accountability Models........................................................... 28State Accountability Models.................................................. 29Restructured Schools ............................................................. 29Principals' Role in School Restructuring ............................... 30Leadership for School Change............................................... 32
Summary ......................................................................................... 35
Chapter III DESIGN AND METHODOLOGY....................................... 37
Setting.............................................................................................. 37School Accountability ..................................................................... 38Sampling.......................................................................................... 42Data Collection................................................................................ 42Research Questions and Statistical Hypotheses .............................. 43Instrumentation................................................................................ 44
Section I: Leadership Behaviors ............................................ 47Section II: Leadership Style Use ........................................... 47Section III: Overall Rating..................................................... 47Section IV: Background Information .................................... 48
Instrument Reliability...................................................................... 48Statistical Analysis .......................................................................... 48
v
Chapter IV. FINDINGS............................................................................. 50
Statistical Analysis .......................................................................... 50Research Questions and Statistical Hypotheses .............................. 63
Research Question 1 .............................................................. 63Statistical Hypothesis 1.......................................................... 63Research Question 2 .............................................................. 65Statistical Hypothesis 2.......................................................... 66Research Question 3 .............................................................. 67Statistical Hypothesis 3.......................................................... 67
Demographics.................................................................................. 70
Chapter V. SUMMARY, CONCLUSIONS, ANDRECOMMENDATIONS....................................................... 75
Summary ........................................................................................ 75Conclusions ..................................................................................... 78
Research Question 1 .............................................................. 78Research Question 2 .............................................................. 80Research Question 3 .............................................................. 80
Recommendations ........................................................................... 82
Appendix A Leadership Orientations (Self and Other) Surveys................ 83
References ............................................................................................... 96
vi
LIST OF TABLES
1. Inter-Scale Correlations for the Total Group in the Schools MakingAdequate Progress on the Four Leadership Frames........................ 52
2. Inter-Scale Correlations for Principals in the Schools MakingAdequate Progress on the Four Leadership Frames........................ 53
3. Inter-Scale Correlations for Teacher Members of the SIT Teamin the Schools Making Adequate Progress on the Four LeadershipFrames ............................................................................................. 54
4. Inter-Scale Correlations for Parents and CommunityRepresentatives of the SIT Team in the Schools Making AdequateProgress on the Four Leadership Frames ........................................ 54
5. Inter-Scale Correlations for Principals' Supervisors in the SchoolsMaking Adequate Progress on the Four Leadership Frames .......... 55
6. Inter-Scale Correlations for the Total Group in the At-Risk Schoolson the Four Leadership Frames ....................................................... 56
7. Inter-Scale Correlations for Principals in the At-Risk Schoolson the Four Leadership Frames ....................................................... 57
8. Inter-Scale Correlations for Teacher Members of the SIT Teamin the At-Risk Schools on the Four Leadership Frames.................. 58
9. Inter-Scale Correlations for Parents and CommunityRepresentatives of the SIT Team in the At-Risk Schools on theFour Leadership Frames.................................................................. 58
10. Inter-Scale Correlations for Principals' Supervisors in theAt-Risk Schools on the Four Leadership Frames............................ 59
11. One-Way Analysis of Variance of Differences in PatternsAmong Principals', SIT Team Members', and Principals'Supervisors' Judgments of Principals' Frame Utilization inSchools Making Adequate Progress................................................ 61
12. One-Way Analysis of Variance of Differences in PatternsAmong Principals', SIT Team Members', and Principals'Supervisors' Judgments of Principals' Frame Utilization inSchools Considered At Risk............................................................ 62
vii
13. Independent t-Test of Principals' Judgments of Principals'Frame Utilization in Schools Making Adequate Progress v.Schools Considered At Risk............................................................ 64
14. Independent t-Test of Principals' Supervisors' Judgments ofPrincipals' Frame Utilization in Schools Making AdequateProgress v. Schools Considered At Risk......................................... 66
15. Independent t-Test of Teacher Members of the SIT Team'sJudgments of Principals' Frame Utilization in Schools MakingAdequate Progress v. Schools Considered At Risk......................... 68
16. Independent t-Test of Parents and Community Representativesof the SIT Team's Judgments of Principals' Frame Utilization inSchools Making Adequate Progress v. Schools ConsideredAt Risk............................................................................................. 69
17. Demographics of Principals in Schools Making AdequateProgress ........................................................................................... 70
18. Demographics of Principals in Schools Considered At Risk.......... 71
19. Demographics of Principals' Supervisors in Schools MakingAdequate Progress........................................................................... 71
20. Demographics of Principals' Supervisors in Schools ConsideredAt Risk............................................................................................. 72
21. Demographics of SIT Team Members (Teachers) in SchoolsMaking Adequate Progress ............................................................. 72
22. Demographics of SIT Team Members (Teachers) in SchoolsConsidered At Risk ......................................................................... 73
23. Demographics of SIT Team Members (Parents and CommunityRepresentatives) in Schools Making Adequate Progress ................ 73
24. Demographics of SIT Team Members (Parents and CommunityRepresentatives) in Schools Considered At Risk............................ 74
1
CHAPTER I
INTRODUCTION
Schools, now more than ever, are challenged to improve to the extent that
every effort is made to ensure the success of all students (No Child Left Behind
(NCLB); Maryland State Department of Education, 2003). In the state where this
study was conducted, the state department of education has for a number of years
instituted school reform initiatives where individual schools are held accountable for
student achievement. Under the provisions of the School Improvement Act, the state
was authorized to take action that included reassignment/dismissal of the principal
and/or placing the school in reconstitution and ultimately under a private or charter
contractor (Hall, Wiener, & Carey, 2003). The passage of the No Child Left Behind
Act gave federal leverage to the states in their school reform policies, primarily
because of the threat of the loss of federal funds to support the implementation of
programs for school improvement.
Action by the state in this study is defined as restructuring, a process that
begins by identifying schools that are not making adequate progress as measured by a
series of state assessments and attendance rates. Schools under local restructuring are
given additional assistance from the state and are directed to develop annual school
improvement plans. They are then monitored by the state for several years to check
on progress made in each school. Only when it is apparent that school improvement is
inadequate does the state move toward reconstitution and state take-over.
Placed at high risk as a result of these actions is the school principal. Efforts to
improve education relate directly to the quality of leadership provided in the schools.
"In study after study, it has been shown that the one determinant of excellence in
public schooling is the leadership of the individual school principal" (Action for
2
Excellence, 1983, p.29). Research on effective schools strongly supports the concept
that the school principal is the key figure in a school's success or failure (Austin, 1979;
Brookover, 1977; Crowson et al., 1984; Dunlap & Goldman, 1991; Edmonds, 1979;
Educational Research Service, 1982; Goodlad, 1984; Lezotte, 1992; Malen & Ogawa,
1988).
The notion of leadership is continually evolving, often moving simultaneously
in numerous directions (e.g., leader, manager, administrator). Goldring and
Greenfield (2002) argue that the image of the school leader has changed from a
"position that was once ideologically grounded in philosophy and religion in the
1800s, to a highly prescriptive manager concerned with efficiency and focused on
functional administrative tasks in the mid 1900s, to a behavioral science perspective in
the mid to late twentieth century" (p. 1). Having reviewed the long-standing debate
about the principalship, Sergiovanni (1991) concludes that while distinctions between
management, leadership and administration debates may be useful for theorists, what
is key is the recognition that the principalship involves multiple responsibilities and
duties. As predicted by Laffey (1980), principals are expected to be "all things to all
people." They are expected to be effective managers, and currently, with the focus on
student achievement, instructional leaders. However, according to Scott (1983)
principals and other significant groups who work with them have expectations
regarding the principals' managerial role but disagree significantly about the principal
as instructional leader. Reports have noted that principals have resisted changing their
role from manager to that of an instructional leader (e.g. Philadelphia School
Improvement Project, Kopple, 1985). Moreover, where principals' role transition has
been successful, extensive training (Newburg & Glatthorn, 1983) and/or long-term
training efforts (Kline, 1987) were necessary.
3
Instructional leadership responsibilities seem to have emerged from the
existence of many instructionally effective schools for poor and minority children
reported since the early 1970s (Stevenson, 1987). Clark et al. (1982) aggregated
approximately 97 studies of urban school achievement and concluded that this
leadership is crucial in determining school success and that this leadership is typically
attitudinal and motivational, and capable of engendering an achievement climate. This
research gives credence to the decision of federal, state and local policy makers to
hold principals accountable for the school's success.
In the state where this study was conducted, there exists a large urban school
district of 180 schools of which 95 are currently labeled "at risk". Three of these
schools have been taken over by the State and principals have been demoted,
reassigned or terminated. The schools in the district are, for the most part, in
neighborhoods that house large numbers of students who traditionally do not perform
well in school. Their enrollments include large numbers of poor children from non-
English speaking families, and large numbers of minority students with special needs.
A local press release in the state indicated a concern highlighted by the 1998 student
achievement test results, which is lagging performance by many minority students,
especially African-American males. The article further stated that an ingredient
common to poor performance on state tests and functional tests, low attendance, and
high dropout rates is poverty. While both low- and high-performing school systems in
the state have made significant progress over the years, a wide gulf still separates the
two.
Prior to such action on the part of state and local educational authorities, there
should be an effort to document the ineffectiveness of the principal at risk. As
Sergiovanni (1991) pointed out, while it might be a fact that good leadership produces
positive results, it is difficult to produce facts that are generally accepted about what it
4
actually entails. For example, while there exists an extensive review of the literature
to support the importance of instructional leadership behaviors of the principal, it is
not clear in the literature concerning which instructional leadership behaviors are most
important. However, it is possible from the same literature to construct, under a
number of frames or domains, the instructional leadership behaviors that are most
often mentioned as important for principals to implement.
Leadership
There are various models or methods to capture information concerning
leadership roles and styles (Cohen et al., 1972; Mintzberg, 1980; Schein, 1984; Yukl,
1989). For example, Sebring and Bryk (2000) posit that "the behaviors and practices
of the principal have influence on all aspects of the learning community, which leads
to school success" (p.441). They state that the specifics of leadership are not just a
listing of the correlates of effective schools; the specifics include behavior and
practices related to five domains: Vision, Mission, Culture, Curriculum and Classroom
Instruction. They further state that the vision of the principal, the mission of the
school and the culture of the organization cannot be separated; one supports and
affects the other. Curriculum and Classroom Instruction are critical to student
achievement. Promoting student learning is a priority for successful principals. These
researchers conclude that as principals perform as instructional leaders, they create an
environment for learning, set high standards for teaching and allow teachers to take
risks and try new methods of teaching (Sebring & Bryk, 2000).
Following his research on principals and empowerment in schools, Hughes
(2004) designed a model for restructuring schools that included guidelines that used
both questions and suggestions. The question format seems to be better suited for
those items the principal needs to determine or consider. The suggestion format seems
5
to be more useful for highlighting items that were not fully developed in past
practices. Both types of statements reflect the insights of principals in the research
study and observations collected in school visits and conferences.
The guidelines are divided into two categories: Pre-implementation and
Implementation. The first category focuses on preexisting conditions and
considerations that enhance or inhibit the success of the innovations for school
improvement; the second category is composed of factors and considerations that
appeared during the course of the innovation.
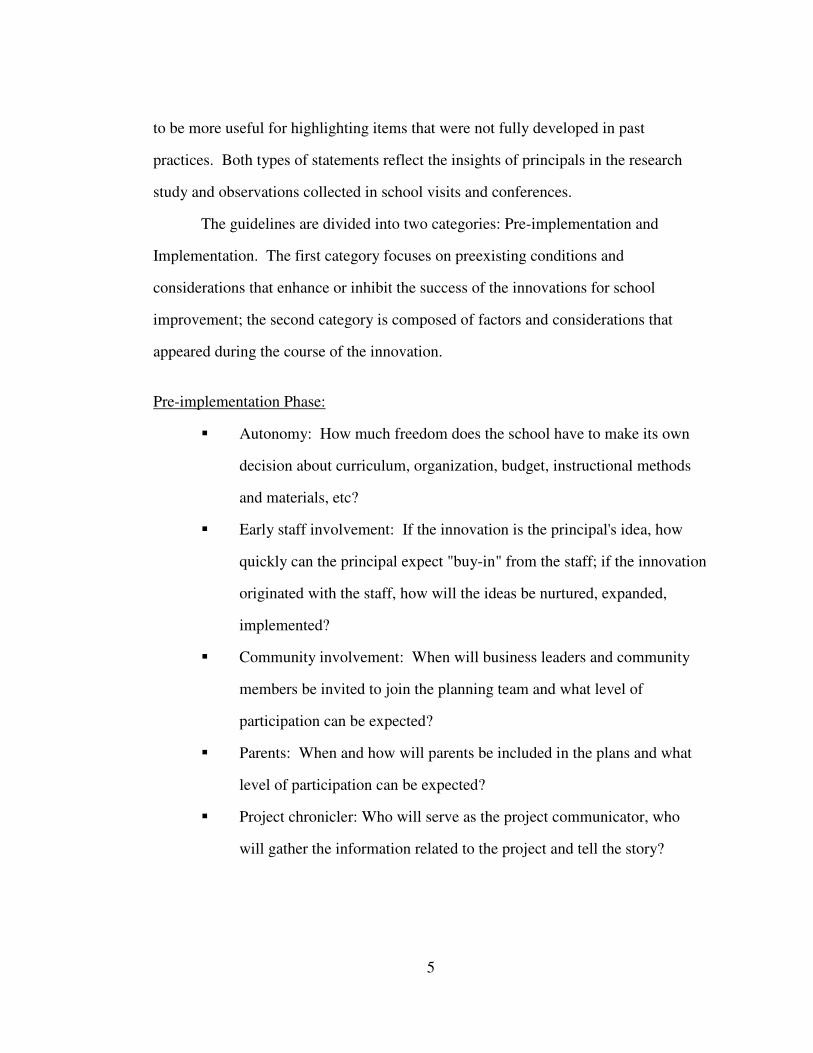
Pre-implementation Phase:
� Autonomy: How much freedom does the school have to make its own
decision about curriculum, organization, budget, instructional methods
and materials, etc?
� Early staff involvement: If the innovation is the principal's idea, how
quickly can the principal expect "buy-in" from the staff; if the innovation
originated with the staff, how will the ideas be nurtured, expanded,
implemented?
� Community involvement: When will business leaders and community
members be invited to join the planning team and what level of
participation can be expected?
� Parents: When and how will parents be included in the plans and what
level of participation can be expected?
� Project chronicler: Who will serve as the project communicator, who
will gather the information related to the project and tell the story?
6
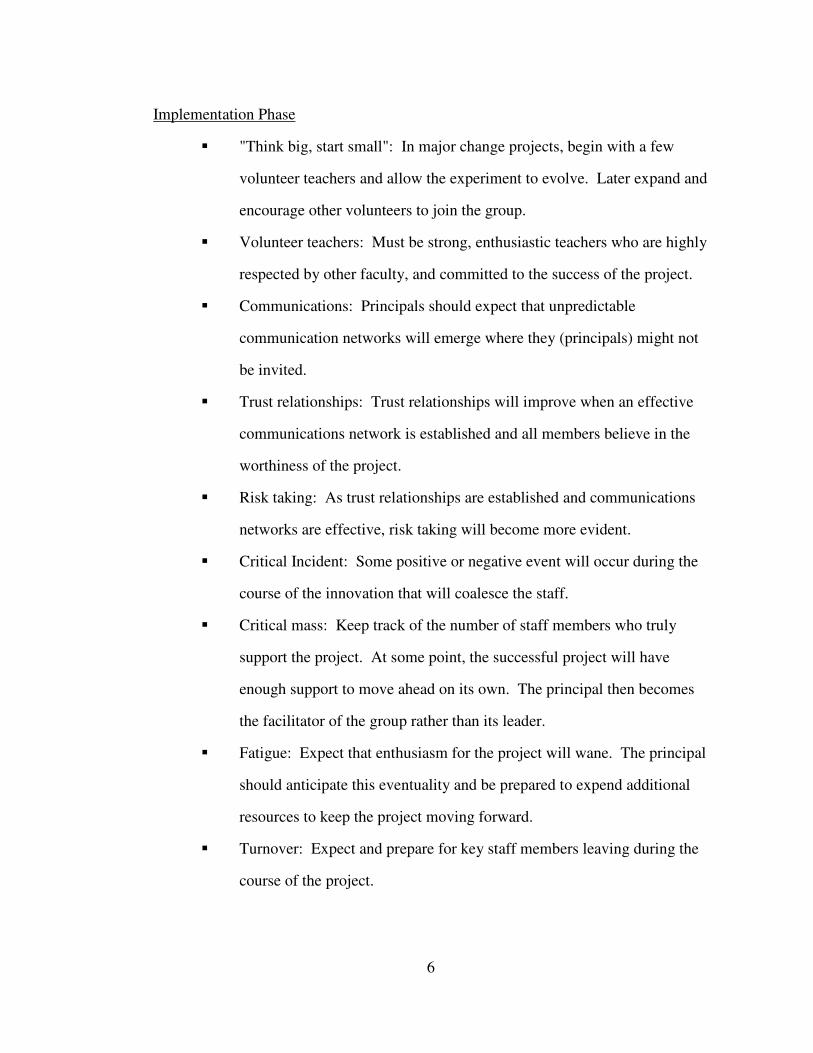
Implementation Phase
� "Think big, start small": In major change projects, begin with a few
volunteer teachers and allow the experiment to evolve. Later expand and
encourage other volunteers to join the group.
� Volunteer teachers: Must be strong, enthusiastic teachers who are highly
respected by other faculty, and committed to the success of the project.
� Communications: Principals should expect that unpredictable
communication networks will emerge where they (principals) might not
be invited.
� Trust relationships: Trust relationships will improve when an effective
communications network is established and all members believe in the
worthiness of the project.
� Risk taking: As trust relationships are established and communications
networks are effective, risk taking will become more evident.
� Critical Incident: Some positive or negative event will occur during the
course of the innovation that will coalesce the staff.
� Critical mass: Keep track of the number of staff members who truly
support the project. At some point, the successful project will have
enough support to move ahead on its own. The principal then becomes
the facilitator of the group rather than its leader.
� Fatigue: Expect that enthusiasm for the project will wane. The principal
should anticipate this eventuality and be prepared to expend additional
resources to keep the project moving forward.
� Turnover: Expect and prepare for key staff members leaving during the
course of the project.
7
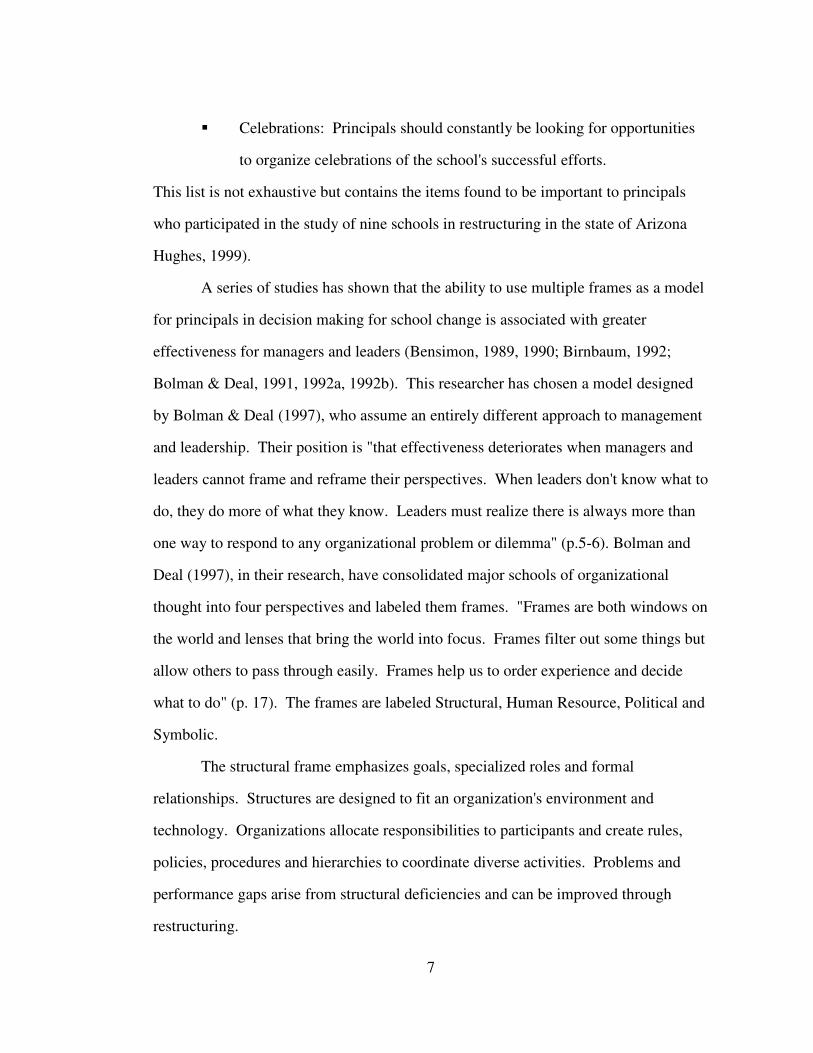
� Celebrations: Principals should constantly be looking for opportunities
to organize celebrations of the school's successful efforts.
This list is not exhaustive but contains the items found to be important to principals
who participated in the study of nine schools in restructuring in the state of Arizona
Hughes, 1999).
A series of studies has shown that the ability to use multiple frames as a model
for principals in decision making for school change is associated with greater
effectiveness for managers and leaders (Bensimon, 1989, 1990; Birnbaum, 1992;
Bolman & Deal, 1991, 1992a, 1992b). This researcher has chosen a model designed
by Bolman & Deal (1997), who assume an entirely different approach to management
and leadership. Their position is "that effectiveness deteriorates when managers and
leaders cannot frame and reframe their perspectives. When leaders don't know what to
do, they do more of what they know. Leaders must realize there is always more than
one way to respond to any organizational problem or dilemma" (p.5-6). Bolman and
Deal (1997), in their research, have consolidated major schools of organizational
thought into four perspectives and labeled them frames. "Frames are both windows on
the world and lenses that bring the world into focus. Frames filter out some things but
allow others to pass through easily. Frames help us to order experience and decide
what to do" (p. 17). The frames are labeled Structural, Human Resource, Political and
Symbolic.
The structural frame emphasizes goals, specialized roles and formal
relationships. Structures are designed to fit an organization's environment and
technology. Organizations allocate responsibilities to participants and create rules,
policies, procedures and hierarchies to coordinate diverse activities. Problems and
performance gaps arise from structural deficiencies and can be improved through
restructuring.

8
The human resource frame envisions an organization comparable to an
extended family with individuals with needs, feelings, prejudices, skills and
limitations. These individuals have the capacity to learn; however, they also tend to
defend old attitudes and beliefs. From the human resource perspective, the challenge
is to tailor the organization to the people, to find ways for these individuals to "buy in"
to what they are charged to do.
From the political frame perspective, organizations are viewed as arenas,
contests, or jungles. Different interests compete for power and scarce resources and
bargaining, negotiation, coercion, and compromise are part of everyday life.
Coalitions emerge around special interests and also change as issues in the
organization change.
The symbolic frames sees organizations as cultures motivated by rituals,
ceremonies, stories, heroes and myths rather than by rules, policies and managerial
authority. Assumptions of rationality are not as prominent in the symbolic frame as in
the three previous frames. Organization is also theater; actors play their roles in the
organization while audiences form their own impressions from what is seen "onstage".
Problems arise when participants play their roles badly and when the symbols lose
their meaning.
This overview of the four frame models shows that each of the frames has its
own image of reality. Some frames may be clearly aligned with policy expectations
for principals in the State where this study will be conducted. Dunford and Palmer
(1995) found that management courses that taught multiple frames had significant
positive effects over the short and long term. Ninety-eight percent of the respondents
rated reframing as helpful or very helpful, and approximately 90% felt it gave them a
competitive edge. Another series of studies has shown that the ability to use multiple
frames is associated with effectiveness for managers and leaders (Bensimon, 1989,
9
1990; Birnbaum, 1992; Bolman & Deal, 1991, 1992a, 1992b; Heimovics, Herman &
Jurkiewicz-Coughlin, 1993, 1995; Wimpleberg, 1987).
The ability to employ multiple frame perspectives enhances principals'
decision-making skills and develops their ability for creative problem solving
according to Bolman and Deal (1992a, 1995). Exploring how principal leadership
behaviors are judged will contribute to the knowledge of how principals respond to
school reform initiatives. This knowledge may provide implications for future
leadership development programs.
Significance of the Study
The school principal's role has been identified as the primary factor
contributing to excellence in public schools, regardless of the ethnic or socioeconomic
factors of the school community (Zigarelli, 1996). Research on effective schools
consistently indicates how vital the principal is to a school's ongoing success. Many
studies (Barker, 1997; Edmonds, 1979, 1982; Goodlad, 1955; Murphy, 2001) have
claimed that good principals are the most important key to school reform. Emphasis
on testing as a means to hold schools accountable reflects the perspective that effective
school leadership and good teaching are measured by student achievement (Clark,
1995). Proponents of the testing movement suggest that there is general agreement
among education professionals about just what should be taught to each and every
student. However, despite the No Child Left Behind Act (NCLB) the ideas associated
with testing and the accountability movement are highly debatable (Weisman et al.,
2005). Clear connections are not made between school improvement and
accountability policies.
In summary, this research study is significant in that it proposed to address the
need to document the extent to which leadership behaviors differ among principals in

10
schools "at risk" and principals in schools that have made adequate progress as judged
by state standards. There was a need to clarify the daily behaviors and practices of the
principal and to provide insight into how the principal makes leadership decisions and
makes judgments about school improvement and how to get the job done (Bolman &
Deal, 1997).
Statement of the Problem
The purpose of this study was to examine the extent to which leadership
behaviors of principals differ in schools at risk for reconstitution and in schools judged
as meeting state standards; and to determine the extent to which principals in these
schools employ frame utilization strategies for school improvement as designed by
Bolman and Deal (1992b). The study proposed to gather data from three sources—the
principals, the immediate supervisor of the principals, and the teachers and parents and
community members who work with the principal on the School Improvement Team
in the schools.
Schools and their leaders are currently under increasing pressure to make the
nation's schools more effective as a means of helping to ensure its future
competitiveness. Since there is compelling evidence that schools make a difference in
determining the achievement of children in school and in later life, the effort to make
schools and educators who manage the educational process more effective is a
worthwhile goal.
In efforts to achieve this goal, the school principal plays an important role in
implementing and maintaining effective instructional programs within a school (Fullan
& Stieglebauer, 1991; Hanson & Smith, 1989). The principal's belief about students'
abilities to learn and teachers' ability to teach affect long-range and everyday teaching
and learning processes (Greenfield, 1991). The principal is actively involved in

11
decision making about instruction and must attend to instructional objectives as well
as instructional strategies. The principal is responsible for collecting information and
using data in a manner that keeps everyone in the school well informed about the
performance of teachers and students (Weisman et al., 2005). Principals are
responsible for providing ongoing professional development for teachers at their
schools. Effective principals work hard to build staff capacity for leadership so that
teachers not only grow and develop professionally, but they can assume more
leadership responsibilities in the school (Sergiovanni, 2000).
One impact of the reform movement of the last decade is to involve as many
people as possible in local school decision making. This shared decision making
reflects a less centralized approach to school leadership and requires a great deal of
collaboration and trust (Midgely & Wood, 1993). Collaborative decision making
means many things and takes many forms, depending on the people involved;
therefore the role of the principal changes as situations and circumstances change.
The situational leadership approach examines relationships among leader and
subordinate behaviors, characteristics, and the situation. Among those leaders who
must have the ability to adapt their leadership behavior to the needs of the situation are
school principals (Glatthorn & Newberg, 1984; Thornberry, 1986). Furthermore,
because the school principal has the dual responsibility for management functions and
instruction, the situations he or she must deal with require an ability to be flexible
when responding to the behavior of subordinates (Bossert, Dwyer, Rowan, & Lee,
1982; DeBevoise, 1984; Kuch, 1983; Scott, 1983).
As a principal of a school under restructuring, he or she must reconcile the
demands and initiatives of the state with those of the local system to bring about
school improvement (Schools for Success, 2002). The state in which this study was
conducted has for many years held individual schools responsible for the success of

12
their students. Therefore, principals in these schools are charged to improve student
achievement among all student groups.
Since research into the relationship between instructional leadership behaviors
of the school principal and school effectiveness has not yet been clearly established, a
problem has emerged that needs further study. Moreover, inasmuch as everything
concerning how the school principal can provide the most effective instructional
leadership is not yet understood, researchers must continue to examine which
strategies used by the principals might contribute to school effectiveness at all school
levels—elementary, middle and high.
Conceptual Orientation
This study was anchored in perspectives on the principalship and on factors
that shape how principals define and respond to their roles with respect to school
reform. Research conducted on this topic does not contain refined theories, but it does
contain descriptions of how the principal's role is changing, and how principals
respond to some of the changes and challenges of the position. Some writers identify
factors that might shape how principals define and carry out their role (Fullan et al.,
1993, 1999a, 1999b, 2001; Ladd & Walsh, 2002; Spillane, Halverson, & Diamond,
2001). Other studies reveal how school leaders attempt to implement reform policies
and still other studies evaluate principals' behavior from multiple perspectives (i.e.,
organizational and/or political perspectives) in an effort to categorize leadership
practices demonstrated in school reform initiatives (Lindle, 1999). This study drew
from the literature that speaks to how principals view school improvement, how
principals make decisions about school reform, how they build capacity for leadership
in the schools, and ultimately what strategies they use for decision making.

13
Research Questions
To gather data for this study, the following questions were asked of principals,
the immediate supervisor of the principals, and the SIT team members (teachers and
parents and community representatives). A frame-utilization schema developed by
Bolman and Deal was used to gather data to answer the questions:
1. From the perspective of the principals, to what extent are there
differences in principals' frame utilization (structural, human resource,
political and symbolic orientations) in schools labeled "at risk" and in
schools "making adequate progress" as judged by state standards?
2. From the perspective of the immediate supervisors of the principals, to
what extent are there differences in principals' frame utilization
(structural, human resource, political and symbolic orientations) in
schools labeled "at risk" and in schools "making adequate progress" as
judged by state standards?
3. From the perspective of SIT team members, to what extent are there
differences in principals' frame utilization (structural, human resource,
political and symbolic orientations) in schools labeled "at risk" and in
schools "making adequate progress" as judged by state standards?
Definitions of Terms
Adequate Yearly Progress - states decide whether schools are making adequate
yearly progress through a five-step process. The state sets academic standards aligned
with the Voluntary State Curriculum (VSC). If a school does not make AYP for six
years, the alternate governance plan must be implemented. This plan might include
demoting the principal and "zero-basing" the staff (all staff must reapply for their
positions). New administrators are assigned to the school.
14
Frame Utilization: a process by which leaders order their experiences and
make informed decisions; framing helps filter out some things and allow others to pass
through. Frames represent a "lens" through which principals might view their
leadership behavior. For example, if principals can determine that their focus seems to
provide a structure that includes rules, regulations, and standards, or if time is spent on
gathering data to analyze progress made by teachers and students and they seek to
design curriculum based on the data, then one might conclude that these principals'
behavior reflects the use of the structural frame (frames are discussed later in the text).
For this research study the frames are structural, political, human resource and
symbolic (Bolman & Deal, 1995).
School Assessment Program - the State assessment tests administered in
reading to grades 3, 5, 8,and 10; in math to grades 3, 5,and 8; and in geometry to
students enrolled in a high school geometry course (2002- 2003). In 2003-2004, the
tests were also administered in reading and math to grades 4, 6, and 7.
No Child Left Behind Act of 2001 - the most recent effort by the federal
government to influence educational policy and practice. This law, a revision of the
Elementary and Secondary Education Act first passed in 1965, provides mandates in
ten categories that cut across schooling in America. Embedded in these categories are
state accountability systems, required testing programs, and rules and regulations that
mandate standards for teachers that states are required to meet. States are also
accountable for student achievement and for the achievement of low-income students,
students of different racial and ethnic backgrounds, limited-English-speaking students
and students with disabilities.
Reconstitution - the final step in the school improvement process as designed
by the school system of this research study. This step signifies that when schools fail
15
to make adequate progress as determined by state assessment tests, intervention by the
State is likely.
Restructuring - a term that replaced "reconstitution" in the school improvement
process. In the past, the state identified low-performing schools for local and state
reconstitution. Restructuring involves at least one of the following: (1) replacing all or
most school staff who are relevant to the failure to make Annual Yearly Progress
(AYP); (2) contracting with a management company to operate the school;
(3) Reopening the school as a public charter; or (4) Other major restructuring actions
that involve significant changes to staffing and governance.
Limitations of the Study
This study was conducted in ten elementary schools randomly selected by the
research department of a large urban area in a mid-Atlantic state. Five schools labeled
"at risk" and five schools that made adequate progress as determined by state
standards were studied. The ten schools selected were in three administrative areas.
Data were collected from teachers who serve on the School Improvement
Team rather than all of the teachers in the school. Similarly, data were collected from
community members who serve on the School Improvement Team rather than those
who serve on the PTA or other school committees.
Delimitations
The decision to select elementary schools for the study was based on available
time and resources of the researcher. Since accessibility to principals and faculty is
critical for data collection, limiting the study to elementary schools seemed logical.
16
Organization of the Study
This study is organized into five chapters. Chapter I provides an overview of
the research effort. Chapter II portrays a review of related literature. Chapter III
explains the design of the study. Chapter IV describes the findings of the research.
Chapter V summarizes the findings and presents conclusions from the study and
makes recommendations for further research.
17
CHAPTER II
REVIEW OF THE LITERATURE
The purpose of this study was to examine the extent to which leadership
behaviors of principals differ in schools at risk for reconstitution and in schools judged
as meeting state standards; and to determine the extent to which principals in these
schools employ frame utilization strategies for school improvement as designed by
Bolman and Deal (1992b). This chapter includes a review of the literature relevant to
organizational behavior in education, leadership and management, school reform and
accountability. The leadership of the school principal will be discussed within each of
these categories.
Organizational Behavior in Education
Robert G. Owens (2004) reminds us that in a place called "school," people live
and work. Not unlike other social organizations, the world of the school has power,
structure, logic and values, which combine to exert strong influence on the ways in
which individuals perceive the world, interpret it, and respond to it. Simplified, "the
behavior of people at work in an educational organization, individually as well as in a
group, is not merely a reflection of their idiosyncratic personalities but it is influenced
by the social norms and expectations of the culture that prevail in the organization"
(p.2). One might also add, by the culture of the community that the school serves.
Educational programs have been influenced by different paradigms,
perspectives or worldviews about issues of behavior in educational organizations
(Bloom et al., 1956; Edmonds, 1966; Lezotte, 1992; Schein, 1985; Sizer, 1992;
Skinner, 1968). The fact that people use different views in trying to understand
human behavior in organizations simply means that educational leaders will be
18
confronted with conflict and controversy as a normal part of daily work. It is evident
from studies and reports relevant to school leadership and school performance that
there is no one paradigm to unify and give direction to those concerned about teaching
and learning in our schools. Because there is no one overarching paradigm, it
becomes necessary for educational leaders to think through the issues and develop a
clear understanding of their own position on the different, often conflicting, points of
view (Owens, 2004). It is clear that the old order of education is giving way and that
schooling will continue its rapid processes of change in the future.
The No Child Left Behind Act of 2002, a new paradigm signed into law on
January 3, 2002, sought to reduce uncertainty and ambiguity in education by imposing
new top-down bureaucratic laws and regulations. It also ushered in a new era for
educational leaders, one in which school leadership is expected to be driven by data
from educational outcomes as measured by individual state assessment tests.
According to Owens (2004), the passage of this act "has everything to do with
the day-to-day realities of being a leader in the schools and anyone who would be an
effective leader in the schools of America's future must have a clear understanding of
the assumptions and beliefs that underlie the arguments of those on both sides of the
confrontation" (p. 20). While a top-down leadership style is supported in the No Child
Left Behind Act, contemporary scholarly thought about leadership is dominated by the
recognition that change, complexity and uncertainty are dominant characteristics of
today's school environments and the need to find new and better ways to lead is
imminent. "At a time when school reform demands leadership rather than
bureaucratic command, schools should be evolving from top-down hierarchical
management toward a more collaborative, collegial, participative form of leadership"
(Owens, 2004, p.274).
19
Leadership and Management
The study of leadership and management has a long history. The concept of
effective leadership prompts the question, by whose standards? The concept of
leadership using scientific methods is relatively new, and Orozco (1999) notes that, as
in other organizations, school leadership can be viewed from the perspective of
teachers, students, supervisors, parents and the community, which might complicate
the process of confirming the most important qualities of leadership. Greenberg and
Baron (1997) describe the complexities of leadership when they note that "leadership
resembles love. It is something most people believe they can recognize but often find
difficult to define" (p.433). Leadership is partially based on the positive feelings that
exist between leaders and subordinates and involves non-coercive influence
(Greenberg & Baron, 2000). For Cashman (2000), "leadership is authentic self-
expression that creates value, it is not seen as hierarchical—it exists everywhere in
organizations" (p.20).
Historically, school leaders have been portrayed as people in charge of a
school who have the sole responsibility for leading those who work for them to
success. This kind of school leader has the expectation that when he/she leads, others
will follow. More recent views of leadership involve persuading other people to set
aside for a period of time their individual concerns and pursue a common goal that is
important for the group (Hogan et al., 1999). They express that leadership is
persuasion, not domination; persons who can require others to do their bidding
because of their power are not leaders. Leadership only occurs when others willingly
adopt, for a period of time, the goals of the group as their own.
Research from the last two decades has also shown a strong link between
effective leadership and effective organizations (Bolman & Deal, 1994; Boyan, 1988;
Griffiths, 1988; Lezotte, 1997; Sergiovanni, 1995). Hogan et al. (1999) assert that a
20
"growing body of evidence supports the common sense belief that leadership matters"
(p.34). Fullan (2002) expresses that schools need leaders who can change "what
people in the organization value and how they work together to accomplish it" (p.34).
Fullan (2002) continues by saying the schools "need leaders who can create a
fundamental transformation in the learning cultures of schools and of the teaching
profession itself" (p.18). Beach and Reinhartz (2000) note that "leadership is essential
to promoting student achievement and creating a vision of success for the total
educational program" (p.72).
A causal and definitional link exists between leadership and team performance,
posit Blanchard, Hybels and Hodges (1999), who also note that leadership is about
serving and starts on the inside and moves outward to serve others. Such leadership
has the interest of others in mind, nurtures growth and development in others, is
willing to listen, and thinks less about self while held accountable for performance.
Lambert (1998) suggests that leadership involves "learning together and constructing
meaning and knowledge collectively and collaboratively to reflect on and make sense
of work in the light of shared beliefs and create actions that grow out of these new
understandings" (pp.5-6).
The task of running a complex operation is administration—a task with two
dimensions. One dimension, embracing activities related to change, is leadership.
The other dimension, encompassing productive efforts to manage a status quo in
which people can work comfortably, is management (Hughes, 2004). Hughes
introduces the ABC rule (Accelerator, Brake and Cruise control) and further explains
that the good administrator reads the context correctly and knows how much pressure
to apply, when to apply it and why. In running complex organizations, the person in
charge must attend to both leadership tasks and management tasks. The successful
principal administers a complex organization that is part of a larger social and political
21
context. When exercising leadership skills, the administrator helps establish the goals,
mission, and shared vision for the organization itself and for the organization within
the larger context. When the vision is shared, management can generate processes and
structures to guide goal attainment.
One of the most influential calls for educational leaders to have such a vision is
found in Standards for School Leaders proposed by the Interstate School Leaders
Licensure Consortium (ISLLC) of the Council of Chief State School Officers as a
basis for licensing school administrators in the United States. These standards were
developed in a two-year collaborative effort by numerous individuals from the ranks
of state education agencies and representatives of professional associations. Published
in 1996, they have a nationwide impact on qualifications required for issuing licenses
to educational administrators. These standards are compatible with the guidelines of
the National Council for the Accreditation of Teacher Education (NCATE). The first
of these standards calls for the school administrators to have a "vision of learning" that
shapes the educational programs they may advocate, as well as the ways in which they
work with others in seeking to bring the vision to reality. Educational leaders should
have such a vision, and their professional behaviors should be shaped and guided by it.
Bennis and Nanus (1985) defined vision as "an uncommon ability to visualize
a better future for an organization" (p. 32). The National Board Policy for Educational
Administration (1990) has as one of its elements for School Building Leadership,
Develops a Vision. Candidates develop a vision of learning for a school that promotes
the success of all students, base this vision on relevant knowledge and theories, and
articulate the components of this vision for a school and the leadership processes
necessary to implement and support the vision."
The school leader develops a vision of learning from the culture of the
organization and establishes a mission for the school community. The vision is the
22
primary and major influence on both the mission and the culture. Vision can be
defined as foresight and forethought. It is the dream of where the school principal
wants the school to be in the future. If it is a shared vision, it exceeds what the
principal wants; it is now what the staff, students, parents and community leaders
want. Given that the No Child Left Behind Act holds the principal accountable for
what everybody wants, the shared vision strategy is important. The mission is the
charge—how to achieve the vision. Deal and Peterson (1999) wrote that the mission
is "the focus of what people do" (p.23). The culture in a school reflects the vision and
the mission of the school. In defining culture, Deal and Peterson (1999) state that "it
consists of the stable, underlying social meanings that shape beliefs and behavior over
time" (p.3). In other words, it is the way things happen in a school. The vision is the
dream; the mission is how to achieve the dream; and the culture is impacted by the
realization of the vision as the mission is accomplished. Culture involves values,
beliefs, mores, tools for establishing goals, and the way in which people are valued or
devalued.
Smith and Andrews (1989) explain that "communication of vision is perhaps
the most important way for a principal to exert effective leadership—to leave no doubt
about school priorities" (p. 16). These principals know what to expect for the school
and students and are able to infect others with that dream, a positive and beneficial
contagion. Perhaps these principals can do nothing more important for their teachers
and staff than to create a process for forging and reworking the vision or mission of
the school. Traditionally, schools have not been places where adults can easily share
the collegial relationships that are essential to leadership, as distinct from
management, and teacher empowerment. An effective school principal "demonstrates
a strong interest in promoting collegiality and shared leadership, an interest in shifting
23
the norms of the school's culture from the traditional to more collaborative ways of
working together" (Owens, 2004, p. 274).
Powell (2004), in her research on the behaviors and practices of successful
principals working with "at risk" schools, found that the school vision, mission and
culture are important to the success of the school. She found that it is difficult to
separate the three because one supports and affects the others. She also found other
research that supports this claim. For example, it is the vision of the school that leads
the way to accomplishing the goals of the school (Uchiyama & Wolf, 2002). Dufour
and Eaker (1998) state that the shared vision motivates the staff to work together and
gives a sense of direction for what they want to accomplish in the future. The U. S.
Department of Education (1999) stated that education leaders today must have a vision
of where their school is going and have a plan for getting there.
During this period of reform and change, the vision of school leaders is
especially important. Edwards (1998) found the vision of the principal a key factor in
implementing change in a high-involvement school. In this quantitative study, the
researcher completed a case study of an elementary school under school renewal in
southwestern Virginia. From relevant data regarding student achievement and the
need for improvement, the principal began to develop her own vision about the future
of the school, which evolved with the efforts of the school staff. This shared vision
led to participatory and shared leadership in the school that was a significant factor in
implementing school change.
The vision of the school principal influences the mission of the school.
Everyone needs to understand the mission of the school in order to realize the vision.
As Papalewis and Fortune (2002) stated:
Above all, leadership and stewardship in a school mandate the
development of a clear mission. This does not mean that only the
24
principal is aware of the mission statement. It means that as school
leader, the principal must involve everyone in the school in
recognizing, enforcing, and implementing the mission statement. The
statement must become a daily concrete objective. (p. 12)
Papalewis and Fortune (2002) also cited examples of successful schools in
which the goals that reflect the mission statement are displayed in every classroom. In
these schools everyone knew the direction of the school and the posted goals in the
halls and classrooms reflected their knowledge and commitment.
The vision is the foundation of the culture of the school. The culture reflects
the vision of the principal and staff and illuminates the way of life in a school. The
principal is the key in determining the culture (Barth, 1990). Successful school
cultures are focused on the learning of all students (Deal & Peterson, 1999) and
everyone knows that learning comes first (Druan & Butler, 1987). When learning is
the central purpose of schooling, and all work is focused on this purpose, a school is
likely to be successful (Maehr & Parker, 1993).
In successful schools, there is a culture that shows everyone focused on
teaching and learning. Connell (1999) described these schools as a place where
everyone is involved in the work of the school. In her study of high-performing and
high-poverty schools, she found that a staff focused on engagement in the school is an
important aspect of school success. She stated:
Of primary importance is the principal's engagement in a school. There
is no high-achieving school where the staff is not serious about their
work and where they are not focused. One can sense that people in a
building are moving in the same direction. Everyone knows their job
and why they're there... even the lunch-room aide. In low-achieving
schools, everyone is an island unto themselves. (p. 17)
25
Clearly from the research, the vision of the principal is the key element in
school leadership. With a vision, the leader is then able to influence the mission of the
school and create a culture of learning that will promote success for all students.
Hughes (2004) further explains a school's culture. He states "a school's culture
is a representation of what its members collectively believe themselves to be: It is their
self-concept. It reflects what they value and what they express to others as being
'important around here'"(p. 65). Culture is a shared reality constructed over time;
cultures may be cohesive or fragmented, strong or weak, and functional or
dysfunctional depending on the degree to which the same reality is shared by
organizational members (Morgan, 1986; Sergiovanni, 1990).
It is clear that schooling has reached a turning point and the need for
cultivating creative cultures is at hand (Hughes, 2004).
The principal has emerged as the energizer and facilitator of this
process. Purposeful direction depends on the leader's ability to inspire
the creative contribution of all members of the organization.
Leadership must become reciprocal as leaders and followers raise one
another to higher levels of moral consciousness and improvement of
social order. Creative leaders recognize that excellence is facilitated
through a bonding of purposes and values rather than through imposed
structures designed to streamline, predict and quantify set objectives.
A creative culture then is characterized by participants who examine
current practices in relation to organizational needs. (p. 81)
Blumberg (1989) explains that the successful principal applies the "craft of
administration" by balancing the art of leadership and the science of management to
improve curriculum, instruction, and other important elements of school. He adds that
by purposefully adding elements of a specific school setting into the general model, a
26
principal can categorize and assess important site-specific school improvement
actions.
Barker (1992) posits that applying new ideas to the challenge of future
paradigm shifts is not just changing the rules of the game, but is the formulation of a
new game. He notes that the administrator manages within a paradigm but leads
between paradigms. School leadership has become increasingly more complicated
and vital to ensuring school success and soliciting substantial participation from
faculty, staff and students. In responding to higher standards of increased student
progress, school leaders recognize that they alone cannot be the sole instructional
leaders but must coach, mentor, and empower faculty and staff in the pursuit of reform
and renewal. As school leaders continue to adapt to their changing roles, effective
leadership skills will be essential and the real challenge is providing the type of
leadership skills necessary to assist schools in expanding their traditional boundaries
(Green, 2001). Lambert (2002) notes that for decades, educators have understood that
they are all responsible for student learning, but more recently administrators have
come to realize that they are responsible for their own learning and the learning of
their colleagues as well.
School Reform and Accountability
The term accountability is frequently used in discussions about education, and
it is a term that appears to have different meanings to different people. The
fundamental dictionary definition suggests that being accountable involves being
responsible and/or providing explanations (Webster's New World Dictionary, 1996).
When the term is applied to educational leadership, it means that leaders must be
responsible for all student learning and use data to inform the successes or failures of
the instructional process. Accountability simply means that school leaders can no
27
longer be willing to defer to or blame others for school inadequacy and that they must
be willing to do whatever it takes to make sure that all students are academically
successful. Schmoker (2001) says it is time to acknowledge an ever-increasing body
of evidence that points to the fact that accountability promotes higher achievement.
He goes on to say that accountability and school improvement are linked because as
school leaders take greater responsibility for successes as well as failures, their schools
begin to improve. Greenlee and Bruner (2001) have observed that "while many may
view standardized testing as just the monitoring piece of accountability, it can raise
organizational and instructional capacity when the assessments require higher
cognitive levels of performance from students" (p.2). They go on to point out that
when aligned with curriculum goals, "standards and assessments do not have to result
in just 'teaching to the test'" (p.2), but can also serve to influence the teaching-learning
process. The dilemma for school leaders becomes one of balance.
In this new era of accountability, Underwood (2001) notes that "the only stable
aspect of school as an institution is a persistent, constant, repetitive drumbeat of
reform (p. 72). With the publication of A Nation At Risk (National Commission on
Excellence in Education, 1983), schools began an ever-evolving process of change and
reform. The school reform measures have embodied changes in assessment and
accountability strategies that have led to a clearer articulation of what students need to
know and be able to do. This increased emphasis on student learning and student
success means that school leaders "must implement better methods and materials, not
just apply consequences for failure" (Slavin, 2000/2001, p.23). Systemic and
comprehensive reform approaches that are performance based have characterized the
process (Comer, Ben-Avie, Haynes, & Joyner, 1999). These approaches provide
school leaders with "well researched, readily replicable whole-school reforms to help
28
improve teaching and learning in under-performing schools" (Slavin, 2000/2001,
p.25).
School leaders must use appropriate and available student data to ensure that
systemic reform leads to fundamental changes in the instructional materials and
practices in elementary and secondary classrooms. Fullan (1999a, 1993) suggests that,
on the basis of his research and observations, an elementary school can make progress
in school improvement in three years, a high school in six years, and an entire school
district in eight years.
Accountability Models
In the last two decades, accountability in public education has been the focus
of much research (Berman & Gjelten, 1984; Bryk & Hermanson, 1993; Darling-
Hammond, 1991; Glickman, 1990; Harrington-Lueker, 1990; Hill & Bonan, 1991).
Today, little is left to chance and not only have many states adopted various forms of
statewide assessment measures, but recent national legislation has mandated testing in
grades three through nine. With the implementation of the No Child Left Behind Act
of 2001, states are required to "develop assessments aligned with state standards and
to be accountable for students' annual academic progress. States and school districts
must develop yearly report cards documenting the success of their students meeting
achievement goals" (American Association of Colleges for Teacher Education, 2002,
p. 1).
The results by district, usually in the form of student performance on state-
mandated tests, are often reported to the public. Statewide assessment measures are
generally aligned with the respective formal state public school curriculum and are
designed to assess not only what has been taught, but more importantly what students
have been learning. The assessment results are normally tied to each state's

29
accountability system, which may involve accreditation ratings or sanctions as well as
funding. For Holcomb (2001), the following five questions serve to guide school
leaders in their efforts to improve educational accountability and ensure learning for
all:
1. Where are we now?
2. Where do we want to go?
3. How will we get there?
4. How will we know we are there?
5. How can we keep it going? (p.7)
State Accountability Models
Several states have received recognition for their accountability systems based
on the level of student achievement on the statewide assessment programs. Alabama,
California, North Carolina, South Carolina, and Texas have earned recognition for
their strong curriculum standards and accountability systems (Finn & Petrilli, 2000).
Additionally, Florida's model, which includes the Florida Comprehensive Assessment
Test, is not only aligned with the state curriculum standards, but requires students to
demonstrate understanding at higher cognitive levels (application, analysis, or
evaluation) (Greenlee & Bruner, 2001).
Restructured Schools
Restructuring refers to the process of changing the basic structure of a school.
Hughes (1999) asserts that many have ignored this dictionary definition and applied
the word to mean any change in programs, instructional techniques, or teaching
arrangements. He says that confusion and lack of understanding have resulted from
this application. Restructuring defined in this manner forces one to turn away from
traditional notions about the organization of schools. It means that the "production

30
line" paradigm of classical organizational theory must be replaced with a different
model. He further indicates that most of our schools are organized in a manner similar
to an assembly line in a factory. For example, 25 or 30 students and a teacher work
together for approximately nine months. Then the group moves along to another
teacher and the nine-month cycle is repeated. Should a student fail to keep up with the
other members of the group, he or she is simply recycled through the entire nine-
month experience, often with the same teacher.
In a reform effort in Arizona, restructuring means changing this assembly line
model; restructuring has meant the adoption of a more static model where students of
various ages work with the same teacher over a multiple-year period. As the student
demonstrates the acquisition of the knowledge, skills and behavior expected of
students in the setting, he or she moves individually to the next multiple-age, multiple-
grade setting. Groups are not moved; individuals move as they are ready.
At Abraham Lincoln High School in Denver, the school community (principal,
teachers, and community leaders) decided that the existing organization of the school's
departments did not serve the students well nor did it enable the school to offer
programs the students in the school needed. The decision was then made to abandon
the departments in favor of a "school within a school" structure. Each "school" was
designed to serve the learning needs of a particular segment of the student population
and no two schools were alike (Hughes, 1999).
Principals' Role in School Restructuring
The exercise of leadership involves working with and through people,
individually and in groups, to achieve organizational goals. When the goals of the
organization emphasize demands for quick responses to rapid, pervasive change in the
environment while dealing with emerging problems arising from the need for change
31
that are ambiguous and ill-understood, and the outcomes of possible alternative
solutions are knowable in advance, problems arise for school administrators. The two
issues of stability and change are inseparable from every decision in which the
educational leader is involved. Educational leaders have a theoretical choice between
using traditional bureaucratic methods to work with and through others or using
collaborative methods. On the one hand, the fast-paced world of school
administration seems to demand that the leader make decisions quickly and move on
to other pressing business. On the other hand, it is clear that healthy organizations
find strength in opening up participation in decision making and empowering relevant
people on the staff to contribute to the quality of the decisions made.
While the research reveals several decision-making models, (i.e., rational
decision making, participative decision making, theories of decision-making
practices), the summary of decision making in this chapter focuses on the personal
decision-making style of the school administrator because of its inevitable impact on
the behavior of others. This emphasis on the responsibility of the administrator for the
nature and quality of the decision-making processes used in an organization is
compatible with the contemporary view that the administrator is a key actor in the
development of the culture of the school organization.
Recent research suggests that academic people and administrators tend to think
about administrative work in different ways. Research argues that much of the in-
service training for administrators that emphasizes so-called models for decision
making is little more than an effort to train administrators in formal methods of
reflective thought; the assumption being that with such training, one can improve the
decision-making behavior of administrators by improving their skills in logical
thought (Owens, 2004). Karl Weick (1983) offers possibilities and states that "when
administrators tour, read, talk, supervise and meet with each other, all these actions

32
contain thought and, indeed, they are ways in which administrators do their thinking"
(cited in Owens, 2004, p. 299).
In considering the ways in which administrators think about their work, it is
important to realize that the organizational environment in which the work is done is
characterized by ambiguity, uncertainty, and disorder. Situations that require
decisions are often fluid and difficult to analyze and are subject to a number of
interpretations, often conflicting (Owens, 2004). In the daily flow of action,
administrators typically engage in brief, spontaneous, face-to-face, verbal interaction
with others. They are constantly "fighting fires" (Owens, 2004, p.300).
Under conditions of ambiguity and uncertainty, in school administrators'
attempts to shift from traditional methods to participative methods in decision-making,
a new sense of administrative wisdom has emerged. Traditionally, it was believed that
only limited power was available in the school organization and that the wise
administrator would garner all that was possible. Empowering teachers and others to
participate in decision making would be viewed by the administrator as losing power
by giving it away to others. Contemporary empowering administrators understand
that one gains power by sharing it with others because in collaborative efforts, the
power available to the group multiplies (Owens, 2004).
Leadership for School Change
The role of manager is essential for the school principal and is probably the
most important aspect of school leadership. Katz and Kahn (1966), in their classic
text on organizational behavior, divide management skills into three major categories:
1. Technical - derived from sound management techniques
2. Human - derived from harnessing available social and interpersonal
resources.

33
3. Conceptual - derived from expert knowledge about matters of
education and schooling.
Sergiovanni (1991) added two other areas of management for school
administrators:
1. Symbolic - derived from focusing the attention of others on matters of
importance to the school.
2. Cultural - derived from building a unique school culture.
Fullan and Stieglebauer (1991) add a sixth dimension of school management—the
principal as a change agent and facilitator. In all six areas of leadership, the principal
attempts to organize the school's mission or goals by (1) building collegiality among
teachers, (2) forging partnerships with the parents, community residents, and
community institutions, and (3) manipulating symbols, resources, and rewards toward
common goals (Blake & Pfeiffer, 1993).
There are several recently released studies of school leadership for school
change across different countries including the United States that provide clear, but
not necessarily easy, messages. For example, Bryk and his colleagues (1998) have
been tracing the evolution of reform in Chicago since 1988. Their findings reveal that
in schools that evidenced improvement over time (about one-third of 473 elementary
schools),
Principals worked together with a supportive base of parents, teachers
and community members to mobilize initiative. Their efforts broadly
focused along two major dimensions: first, reaching out to parents and
community to strengthen the ties between local school professionals
and the clientele they are to serve; and second, working to expand the
professional capacities of individual teachers, to promote the formation
34
of a coherent professional community, and to direct resources toward
enhancing the quality of instruction. (Fullan, 2001, p. 142)
Collaboration is a key characteristic of school change and school success.
Successful principals empower staff through collaboration and shared leadership.
They encourage risk taking and problem solving (Davenport & Anderson, 2002). Bell
(2001), in a report from a symposium on high-performing, high-poverty schools in
Sacramento, California in December 2000, discussed reasons for the high performance
of the schools. A dialogue between nationally known researchers, such as Joyce
Epstein from the Johns Hopkins University and Patricia Davenport from the American
Productivity and Quality Center, and the school participants concluded the session
with lessons learned for future work. In addition to restating the value of strong
principal leadership, they emphasized that effective site leadership is an integral part
of how schools conducted business.
Bolman and Deal (1984) assert that leaders view their world through a
framework of preconditioned lenses and filters. This framework shapes how
situations are defined and determines what actions are taken. However, correct
diagnosis of a given situation is the critical step in determining the appropriate
response from the leader. "A faulty diagnosis will rarely produce an effective
response, and misreading a situation can undermine even a leader of exceptional
stature and skill (Bolman & Deal, 1991, p.1).
Bolman and Deal (1984) developed four frames that portray the way leaders
think and act in response to everyday issues:
� The human resource frame focuses attention on human needs.
� The structural frame focuses on organizational goals and efficiency
� The political frame emphasizes competition for scarce resources.
� The symbolic frame focuses on imagery, symbols and culture.
35
Bolman and Deal's research indicates that leaders rarely use more than two
frames. They determined that leaders most often used the human resource frame
while the least used frame was the symbolic. Research found a relatively consistent
view of leaders' self-perception of orientation and subordinates' views of that
orientation (Bolman & Deal, 1977). Their research revealed a relationship between
the leader's orientation and Bennis and Nanus' (1985) concept of leadership and
management. Their research also found that the four orientations were predictor
variables for leader effectiveness and managerial effectiveness as perceived by
colleagues and subordinates. The structural orientation was found to be the best
predictor of managerial effectiveness; symbolic orientation was found to be the best
predictor of leader effectiveness, but the worst predictor of managerial effectiveness
(Bolman & Deal, 1977). Additional studies that have used the Bolman and Deal
model for determining school leadership behaviors in school improvement are
Fleming (2002), Fears (2004), and Hoo-Balade (2004).
Summary
The Bolman and Deal frame utilization schemata was selected to gather data to
determine leadership behaviors of school principals because of its close alignment
with management and leadership theories and orientations from research studies cited
in the literature. Each frame can be linked to leadership styles and behaviors of school
principals. For example, the central concept of the Structural Frame is related to rules,
goals, policies, and task orientations that are embedded in leadership and management
requirements for principals. The Human Resource frame has as its focus human needs
and relationships (staff, students, parents, and community). Collegial relationships are
necessary where people work comfortably. Understanding the culture of the school
community is key for the school leader; to be able to visualize a better future for the

36
organization has relevance for the Symbolic Frame. Finally, school leaders must
understand that leadership is not domination through coalitions of power, but by
persuasion. Leaders must understand the central concept of power and conflict in the
school setting—Political Frame. Therefore, the Bolman and Deal frame utilization
strategy will be used for data collection for this study.
37
CHAPTER III
DESIGN AND METHODOLOGY
Literature related to the study of school reform and student performance
suggests that principal leadership is critical to school change (State Department of
Education, 2000). This study was designed to investigate the extent to which
principals employ frame utilization strategies, as designed by Bolman and Deal
(1997), when making judgments and management decisions for school improvement.
The sample population for this study was composed of ten elementary school
principals; five principals in schools considered at risk and five principals in schools
making adequate progress as judged by state accountability standards. The
methodology used for gathering data for this study and the statistical analysis
proposed are presented in this chapter. The research questions and statistical
hypotheses, a description of the sample population to be studied, and a description of
the instrumentation used in this study are also presented.
Setting
The urban school district where this research study was conducted has a total
student population of 85,468. In the last ten years, the student population has declined
by 23,291 students (21%). The white, non-Hispanic population has declined by 48%
and the African American population has declined by 17%. The only group to
increase its enrollment is the Hispanic group, which has experienced a 256% increase.
However, this is a small group in comparison. Its numbers have increased from 456 in
1997 to 1,623 in 2006. In 2006, school demographics were .08% white, 89% African
American, .02% Hispanic, .006% Asian/Pacific Islander, and .003% American
Indian/Alaskan Native.

38
The school district is divided into seven areas. Four of them contain only
elementary schools or elementary/middle schools. In Areas 1, 2, 3, and 4, there are a
total of 113 elementary schools and K-8 schools. In Areas 5, 6, and 7, there are
middle schools, district-wide high schools, and neighborhood high schools. There are
a total of 192 schools in the district.
School Accountability
This state's accountability program provides the data that were used to assess
school effectiveness in this study. The history surrounding the accountability program
is noteworthy. In 1989, the governor of this mid-Atlantic state appointed a
commission to examine ways to measure the performance of the public schools in the
state and to develop strategies for improvement. Outlined in the report of the
Governor's Commission on School Performance (Sondheim et al., 1989),
accountability efforts are guided by three fundamental premises:
� All children can learn
� All children have the right to attend schools in which they can progress
and learn
� All children shall have a real opportunity to learn equally rigorous
content. (p.3)
The commission made recommendations aimed at promoting flexibility and
change in addressing school improvement. Recognizing that experience and
circumstances would inevitably dictate change, the commission developed a set of
assumptions and established a set of guidelines that were to be the framework to
assess schools. This framework of educational assessment included a "vital core" of
student achievements in which uniform statewide measurement is possible (Sondheim,
et al., 1989). Recommendations included compiling data about (1) the
39
accomplishments of graduates of this state's high schools; (2) the percentage of
students completing a rigorous academic program; (3) the percentage of average daily
attendance; (4) the percentage of students meeting state standards in reading,
mathematics, writing, science and social studies.
Following the commission's report, the State Department of Education
developed the State School Performance Program (SSPP) to measure school
performance and student achievement. The SSPP yields a school score rather than an
individual student score. The SSPP provides a system of public accountability with
results of individual school and district performance announced in a variety of
publications. The SSPPs bring a "new, more authentic form of accountability" (SDE,
1999) that seeks to measure academic, application and interpersonal skills. Schools
not showing adequate progress toward meeting the state standards are identified by the
State Department of Education. These schools are eligible to receive additional
support in the form of state-aided technical assistance, additional funding, or
reconstitution.
Since 1994, the State Board in the mid-Atlantic state of this study has
identified over 95 schools as ''reconstitution eligible." Historically, though student
achievement has improved, the number of schools not making adequate progress
continues to increase (i.e., new schools were added to the list each year). For
example, in 1994, when schools were assessed using the state performance assessment
tests, two high schools were placed on probation; in 1995, one elementary school and
two middle schools were identified; in 1996, 23 elementary schools, five middle
schools and three high schools were identified; in 1997, five additional elementary
schools, one middle school and two high schools were identified; in 1998, 16
elementary schools and eight middle schools; in 1999, five elementary schools and
one intermediate school were identified. For the year 2000, no additional schools
40
were identified for local reconstitution but in 2001, four elementary schools and three
middle schools were identified (SDE, 2003). Currently, test results from the new state
accountability system indicate that while elementary schools show progress, few
schools show adequate progress (Local Paper, June, 2005, p. B2).
Since 2003 the term "reconstitution" is no longer used to refer to schools on
probation. Under the No Child Left Behind Act, a three-year-old education reform
law, schools that fail to meet state standards for six consecutive years must restructure
by: (1) replacing all or most of the staff, (2) reopening as a public charter school,
(3) contracting the operation of the school to an outside entity, or (4) adopting a
different "governance structure." However, the state has developed its own plan to
help schools improve. Currently, the state has combined these separate processes into
one statewide process of improvement and schools are currently categorized as
"Schools Making Progress" and "Schools Not Making Progress" or "at risk."
Recent changes to the state's accountability system increased the focus on
subgroup (ethnicity and gender) performance and fulfilled the requirements of No
Child Left Behind (NCLB). The cornerstone of the state's accountability system is
Adequate Yearly Progress (AYP) and replaces the School Performance Index as the
method by which the state tracks academic progress and makes accountability
decisions. Schools must show that students are making progress in reading, math and
a third measure, as determined by the state assessment program. In the elementary
schools, the additional measure is attendance. The State Board of Education has set
performance standards as Basic, Proficient and Advanced.
Under regulations, if schools fail to adequately improve, the district can
identify these schools as subject to state takeover. This is not an immediate action,
however; local school districts can submit school improvement plans for each
identified school in the district, and if the state approves the plan local districts

41
continue to run the schools, implementing the plans under the "Local Board
Reconstitution" (Making Accountability Work, 1998, Advocacy for Children and
Youth). For the 2005-2006 school year, three schools were "zero-based." This means
that new principals were assigned in each of the schools. All staff were required to
reapply for positions in the school.
School systems in the state have developed individual plans for school
improvement. The urban area of this research study has devised categories for
elementary school improvement: Year One (Improvement, 5 Schools), Year Two
(Improvement, 21 Schools), Year Three (Corrective Action, 1 School), Year Four
(Restructuring Planning, 10 Schools) and Year Five (Restructuring Implementation,
56 Schools). During the 2004-2005 school year, the urban school system continued an
aggressive plan to support and hold accountable schools at various levels of school
improvements determined by the State reporting of Adequate Yearly Progress (AYP).
Of the 61 schools identified for restructuring planning and/or restructuring
implementation, 10 schools (8 elementary schools and 2 K-8 schools) exited from
improvement status and 17 schools met AYP.
Schools in years 1 and 2 of school improvement lose basic levels of autonomy
and are supported by ongoing and intensive oversight and monitoring via systemic
initiatives. Schools in corrective action lose school level autonomy and are supported
by ongoing and intensive area and central office review team monitoring, professional
development, systemic initiatives and mandated intervention programs. Schools in
restructuring/planning lose autonomy at the area office level, receive coaching from
external partners for professional development fidelity and receive support and
oversight from an external review team. Schools in restructuring/implementation lose
autonomy at the area office level, receive coaching from external partners for
professional development fidelity, receive support and oversight from an external

42
review team, and provided a Restructuring Implementation Specialist for monitoring
and oversight in the implementation of the school's restructuring plan.
Sampling
For this study, ten elementary schools were randomly selected to participate by
the research department of the urban district where this study was conducted. The ten
schools were selected because they possess a distinctly urban character, that is, they
are located in older sections of the city, and are either in the midst of or are in close
proximity to urban poverty and blight. Poverty indicators are high. All of the schools
are Title I schools meaning they qualify for free and reduced price meals. Percentages
of students in the schools who receive free and reduced price meals are above 70%
and student mobility rates are at 39% or higher. The ten schools are under the
management of three area executive officers. Five of the elementary schools were
considered to be at risk and five were judged to be making adequate yearly progress.
This researcher assumed that the responses from the principals, supervisors, teachers
and community members on the School Improvement Team were truthful and
unbiased in their answers.
Data Collection
Once permission was received from the committee to proceed with the study,
the researcher completed the Human Subjects Form required by the university. Upon
receiving that approval, the researcher scheduled a meeting with the Area Executive
Officers (AEOs), the immediate supervisors of the principals. The AEOs agreed to
contact each of the principals in their respective areas to inform them of the research
project and to request their participation in the study. The letter outlined the
procedures to be followed in collecting the data. There were about 20 teachers in each
school. However, not every teacher in the school served on the School Improvement
43
Team. The number of these teachers varied from school to school. The teachers as
well as other staff and community members who served on the SIT received a survey
and a pre-addressed envelope in which to return the survey. The principals and the
immediate supervisors of the principals also received a copy of the survey and a return
envelope. The researcher had hoped to receive completed surveys from at least 70%
of the teachers and other members on the SIT, and a 100% return from the principals
and supervisors. In each of the school categories, four of the five principals returned
the survey and all supervisors responded.
Research Questions and Statistical Hypotheses
1. From the perspective of the principals, to what extent are there
differences in principals' frame utilization (structural, human resource,
political and symbolic orientations) in schools labeled "at risk" and in
schools "making adequate progress" as judged by state standards?
H1. From the perspective of the principals, there are no statistically
significant differences in the means of principals' frame utilization
(structural, human resource, political and symbolic orientations) in
schools labeled "at risk" and in schools "making adequate progress" as
judged by state standards.
2. From the perspective of the immediate supervisors of the principals, to
what extent are there differences in principals' frame utilization
(structural, human resource, political and symbolic orientations) in
schools labeled "at risk" and in schools "making adequate progress" as
judged by state standards?
H2. From the perspective of the immediate supervisors of the principals,
there are no statistically significant differences in the means of
44
principals' frame utilization (structural, human resource, political and
symbolic orientations) in schools labeled "at risk" and in schools
"making adequate progress" as judged by state standards.
3. From the perspective of SIT team members, to what extent are there
differences in principals' frame utilization (structural, human resource,
political and symbolic orientations) in schools labeled "at risk" and in
schools "making adequate progress" as judged by state standards?
H3. From the perspective of SIT team members, there are no statistically
significant differences in the means of principals' frame utilization
(structural, human resource, political and symbolic orientations) in
schools labeled "at risk" and in schools "making adequate progress" as
judged by state standards.
Instrumentation
Bolman and Deal (1997) identify four frames that categorize leadership
behaviors (Structural, Human Resource, Political and Symbolic). In their research
they have consolidated major schools of organizational thought into four perspectives
and labeled them frames. "Frames are both windows on the world and lenses that
bring the world into focus. Frames filter out some things but allow others to pass
through easily. Frames help us order experiences and decide what to do" (p. 16). The
structural frame emphasizes goals, specialized roles and formal relationships.
Structures are designed to fit an organization's environment and technology.
Organizations allocate responsibilities to participants and create rules, policies,
procedures and hierarchies to coordinate diverse activities. Problems and performance
gaps arise from structural deficiencies and can be improved through restructuring.

45
The human resource frame sees an organization comparable to an extended
family with individuals with needs, feelings, prejudices, skills, and limitations. These
individuals have the capacity to learn; however, they also tend to defend old attitudes
and beliefs. From the human resource perspective, the challenge is to tailor
organizations to the people, to find ways for these individuals to "buy in" to what they
are charged to do.
From the political perspective, organizations are viewed as arenas, contests, or
jungles. Different interests compete for power and scarce resources and bargaining,
negotiation, coercion, and compromise are part of everyday life. Coalitions emerge
around special interests and also change as issues in the organization change.
The symbolic frame sees organizations as cultures motivated by rituals,
ceremonies, stories, heroes and myths rather than by rules, policies and managerial
authority. Assumptions of rationality are not as prominent in the symbolic frame as in
the three previous frames. Organization is also theater; actors play their roles in the
organization while audiences form their own impressions from what is seen onstage.
Problems arise when participants play their parts badly and when the symbols lose
their meaning.
This overview of the four-frame model shows that each of the frames has its
own image of reality. Some frames may seem clear while others might be confusing.
The creators of this model assert that as managers learn to apply all four, they should
develop a greater understanding of the organization. Dunford and Palmer (1995)
found that management courses that taught multiple frames had significant positive
effects over the short and long term. Ninety-eight percent of the respondents rated
reframing as helpful or very helpful, and approximately 90% felt it gave them a
competitive edge. Another series of studies has shown that the ability to use multiple
frames is associated with effectiveness for managers and leaders (Bensimon, 1989,
46
1990; Birnbaum, 1992; Bolman and Deal, 1991, 1992a, 1992b; Heimovics, Herman,
& Jurkiewicz-Coughlin, 1993, 1995; Wimpleberg, 1987).
The Bolman and Deal (1992a) framework has been used in research studies in
the United States and Singapore. The investigation combined qualitative and
quantitative methods. The researchers used interviews and the Leadership
Orientations (Self and Others) Survey instrument to gather data. Two samples were
taken.
The study had similar findings among the United States sample and that of
Singapore: (a) all four frames were positively associated with the measures of
effectiveness, (b) the structural frame was a better predictor of managerial than
leadership effectiveness, while the reverse was true for the symbolic frame, and (c) the
effective school manager is someone oriented toward structure and symbols. Both the
qualitative and quantitative results suggest that the ability to use multiple frames is
critical to principals' effectiveness as both manager and leader.
In 1992, the organizational frames of Bolman and Deal were used to determine
factors that school superintendents and individuals who work in school administration
in Tennessee considered important to effective leadership. The frames were examined
with regard to the relationship of Tennessee superintendents' leadership styles and the
perception of the superintendents' leadership styles by superordinates and
subordinates. The Leadership Orientations Survey was used to identify
superintendents' self-assessments of frame use and perceptions of superintendents'
frame use by superordinates and subordinates. The findings indicated that the multiple
frame use was a predictor of management and leadership effectiveness as perceived by
the respondents.
The Leadership Orientations Survey (Appendix A) is designed to measure the
extent to which leaders use the four frames. Bolman and Deal parallel versions of the

47
instrument, one for leaders (Self) and the other for supervisors and teachers (Others).
For the purposes of this study, the parallel versions are Self (for principals to rate
themselves) and Others (for ratings from the SIT Team—teachers, parents, and
community representatives, and the principals' immediate supervisors). Both versions
have four sections representing the four frames.
Section I : Leader Behaviors
Rating scales for this section range from 1, never to 5, always, for leaders'
behaviors. The total instrument contains 32 items. Each frame is measured by eight
items. For each individual, scores for each of the frames may range from a minimum
of 8 to a maximum of 40.
Section II: Leadership Style Use
The second section includes six items that rank the style of the principal from 1
to 4. For example, for each item, respondents are asked to describe the leadership
style of the principal. Each of the choices corresponds to one of the frames: choice A
corresponds to the Structural Frame, choice B corresponds to the Human Resource
Frame, choice C to the Political Frame, and choice D to the Symbolic Frame. These
scores provide a range from 6 to 24 points for each of the frames.
Section III: Overall Rating
This section includes two one-item measures—perceived effectiveness as a
manager and perceived effectiveness as a leader, comparing the principal to other
principals with comparable levels of experiences and responsibilities. Respondents
are asked to rate the principal from 1 (least) to 5 (most).
48
Section IV: Background Information
This section provides demographic information about the respondents. This
information asks each respondent to specify gender, age, education level, and number
of years' experience in his/her present position. School Improvement Team members
were asked two additional questions: (1) To identify themselves as a teacher, parent,
community representative, or other, and (2) to specify the number of years served on
the School Improvement Team.
Instrument Reliability
Bolman and Deal originally reported the reliability of the instrument in 1991
and assessed the internal consistency of the instrument and the subscales by
computing Cronbach alphas. The instrument was tested by comparing the rating of 94
leaders and 556 of their colleagues and subordinates. Bolman and Deal computed
Cronbach alphas for each of the four frames: structural, .92, human resources, .93,
political, .91, symbolic, .93. These numbers reflect the high inter-item reliability of
the instrument.
Statistical Analysis
The researcher computed Cronbach alpha inter-item reliabilities on the four
sections of the survey for the principals, supervisors, and teachers. The results were
compared with Bolman and Deal's originally computed Cronbach alphas. Pearson
Product Moment correlation coefficients were computed across the four frames of the
Bolman and Deal survey for principals, supervisors, and SIT Team members.
The researcher computed independent t-tests to look for differences between
the principals' judgments of themselves in schools identified as being at risk, and in
schools identified as making adequate progress. Analysis of variance and independent
t-tests were also used to look for differences between the SIT Team members'

49
judgments of principals in schools judged as being at risk and in schools identified as
making adequate progress. Independent t-tests were used as well to look for
differences between the supervisors' judgments of principals in schools judged to be at
risk and in schools identified as making adequate progress. The researcher used the
.05 level of statistical significance to accept or reject the statistical hypotheses.
50
CHAPTER IV
FINDINGS
This researcher investigated the relationship between patterns of principal
leadership orientations as judged by principals, school improvement team members
(teachers, parents, and community representatives), and principals' supervisors. A
conceptual framework based on the four frames of leadership (structural, human
resource, political, and symbolic) developed by Bolman and Deal (1991) was used as
the basis for identifying the leadership orientations of principals. This chapter
presents the findings regarding the principals' frame utilization.
Principals, school improvement team members (teachers, parents, and
community representatives), and principals' supervisors completed the Bolman and
Deal Leadership Orientations Survey to elicit information about their own judgments
of leadership orientations. This framework has been used for classifying and
analyzing behaviors and styles that leaders use to manage organizations (Bolman &
Deal, 1991). The survey was designed to categorize responses according to Bolman
and Deal's (1991) four styles of leadership. Survey responses from principals
provided insights relative to how they view their own behaviors. Additionally, survey
responses from SIT Team members and principals' supervisors provided insights about
how they viewed the behaviors of their respective principals.
Statistical Analysis
The first statistical analysis the researcher did was to establish the reliability of
the Bolman and Deal survey. Gliner and Morgan (2000) state "if each item on a test
has multiple choices, such as a Likert scale, then Cronbach alpha is the method of
choice to determine the inter-item reliability" (p. 316). Cronbach alphas were
51
computed for each of the four frames. The Cronbach alpha for the first leadership
frame, structural, was .92; for human resource, it was .90; for political, the Cronbach
alpha was .75; and for symbolic, it was .93. All of these Cronbach alphas were
statistically significant at the .001 level and indicated that the instrument has high
inter-item reliability for the items comprising each frame. The researcher compared
these Cronbach alphas with those computed by Bolman and Deal. They were very
similar: structural frame, .92; human resource, .93; political, .91; and symbolic, .93.
These data indicate that if a person took the same survey a second time, the responses
would be very similar to the responses given the first time.
Next, the researcher computed correlation coefficients among the four frames
of leadership for the total group, and for principals, SIT Team members and principals'
supervisors of schools labeled both "at risk" and "making adequate progress." The
correlation coefficient is a measure of the strength of association between two
variables. It reflects how closely scores on two variables go together (Shavelson,
1988, p. 139). These correlation coefficients are displayed in Tables 1 through 10. In
interpreting these tables, the researcher used an established set of criteria to make
judgments about the significance of the correlations. First, a level of <.05 was used to
identify statistically significant correlations. Second, the correlations themselves were
judged in the following manner. If the correlation was between 0.0 and 0.30, it was
judged to be weak. If it was between 0.31 and 0.70, it was considered modest. If it
was above 0.71, it was judged to be strong (Gliner & Morgan, 2000).
The inter-scale correlations presented in Table 1 show that for the total group
of schools making adequate progress, there was a strong linear relationship among the
four frames of the Bolman and Deal instrument: structural, human resource, political,
and symbolic. These four frames have a common underlying factor concerned with
school leadership. All six of the correlations were above .72 and were statistically

52
significant beyond the .001 level, indicating a strong association among them. This
means, for instance, that if a respondent chose option 4 (often) for judging structural
leadership, he or she would likely choose "often" for human resource leadership if
there was a strong linear relationship, as Table 1 indicates did exist.
Table 1
Inter-Scale Correlations for the Total Group in the Schools Making Adequate Progress
on the Four Leadership Frames
StructuralLeadershipOrientation
Human ResourceLeadershipOrientation
PoliticalLeadershipOrientation
SymbolicLeadershipOrientation
STRUCTLO 1.00(38)
.75(38)
P=.001***
.81(38)
P=.001***
.82(38)
P=.001***HUMRESLO 1.00
(38).72(38)
P=.001***
.80(38)
P=.001***POLITLO 1.00
(38).93(38)
P=.001***SYMBLO 1.00
(38)P = < .05*; <.01**; <.001***
Table 2 presents the correlations for the principals of the schools making
adequate progress. The reader is advised to use caution in drawing any conclusions
from this table, since it is based on responses from only four principals. In general,
correlations should be based on 30 or more respondents. These results indicate that
three of the correlations were statistically significant: structural and political, structural
and symbolic, and political and symbolic. This finding shows high agreement among
these principals on the frequency with which they use the frames. The other three
were not statistically significant; interestingly, they were negative, indicating no
agreement among the principals in terms of frequency of use.
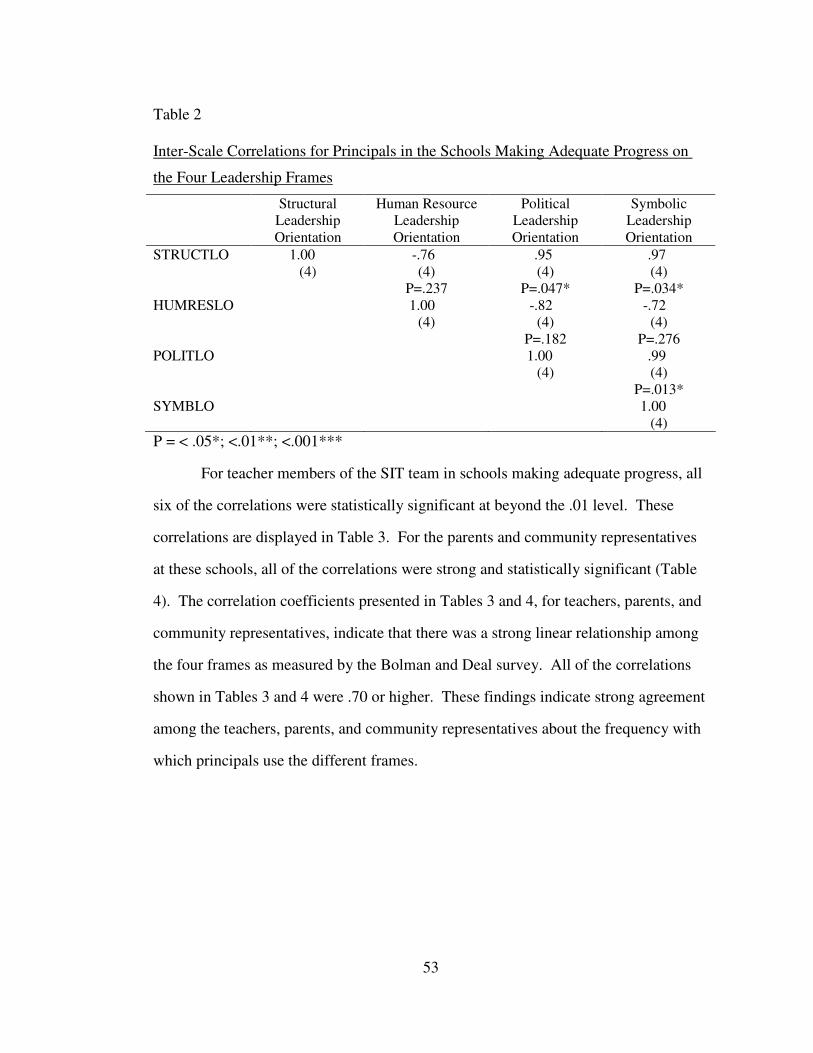
53
Table 2
Inter-Scale Correlations for Principals in the Schools Making Adequate Progress on
the Four Leadership Frames
StructuralLeadershipOrientation
Human ResourceLeadershipOrientation
PoliticalLeadershipOrientation
SymbolicLeadershipOrientation
STRUCTLO 1.00(4)
-.76(4)
P=.237
.95(4)
P=.047*
.97(4)
P=.034*HUMRESLO 1.00
(4)-.82
(4)P=.182
-.72(4)
P=.276POLITLO 1.00
(4).99(4)
P=.013*SYMBLO 1.00
(4)P = < .05*; <.01**; <.001***
For teacher members of the SIT team in schools making adequate progress, all
six of the correlations were statistically significant at beyond the .01 level. These
correlations are displayed in Table 3. For the parents and community representatives
at these schools, all of the correlations were strong and statistically significant (Table
4). The correlation coefficients presented in Tables 3 and 4, for teachers, parents, and
community representatives, indicate that there was a strong linear relationship among
the four frames as measured by the Bolman and Deal survey. All of the correlations
shown in Tables 3 and 4 were .70 or higher. These findings indicate strong agreement
among the teachers, parents, and community representatives about the frequency with
which principals use the different frames.
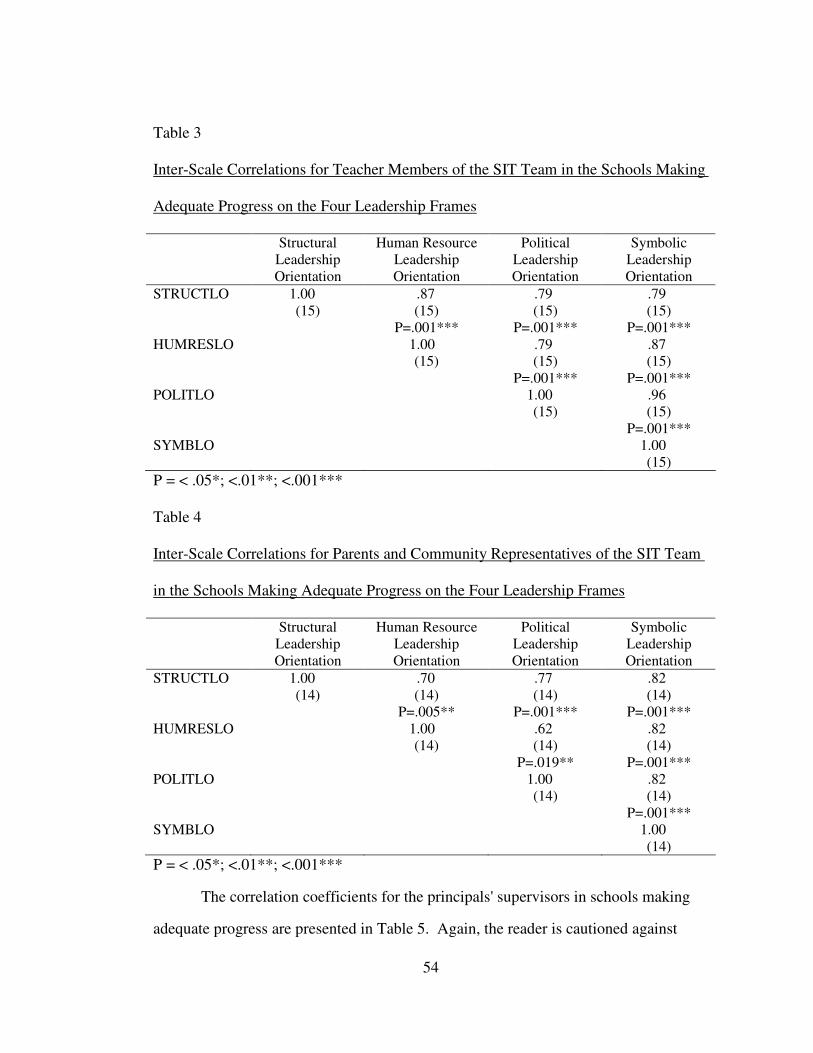
54
Table 3
Inter-Scale Correlations for Teacher Members of the SIT Team in the Schools Making
Adequate Progress on the Four Leadership Frames
StructuralLeadershipOrientation
Human ResourceLeadershipOrientation
PoliticalLeadershipOrientation
SymbolicLeadershipOrientation
STRUCTLO 1.00(15)
.87(15)
P=.001***
.79(15)
P=.001***
.79(15)
P=.001***HUMRESLO 1.00
(15).79(15)
P=.001***
.87(15)
P=.001***POLITLO 1.00
(15).96(15)
P=.001***SYMBLO 1.00
(15)P = < .05*; <.01**; <.001***
Table 4
Inter-Scale Correlations for Parents and Community Representatives of the SIT Team
in the Schools Making Adequate Progress on the Four Leadership Frames
StructuralLeadershipOrientation
Human ResourceLeadershipOrientation
PoliticalLeadershipOrientation
SymbolicLeadershipOrientation
STRUCTLO 1.00(14)
.70(14)
P=.005**
.77(14)
P=.001***
.82(14)
P=.001***HUMRESLO 1.00
(14).62(14)
P=.019**
.82(14)
P=.001***POLITLO 1.00
(14).82(14)
P=.001***SYMBLO 1.00
(14)P = < .05*; <.01**; <.001***
The correlation coefficients for the principals' supervisors in schools making
adequate progress are presented in Table 5. Again, the reader is cautioned against
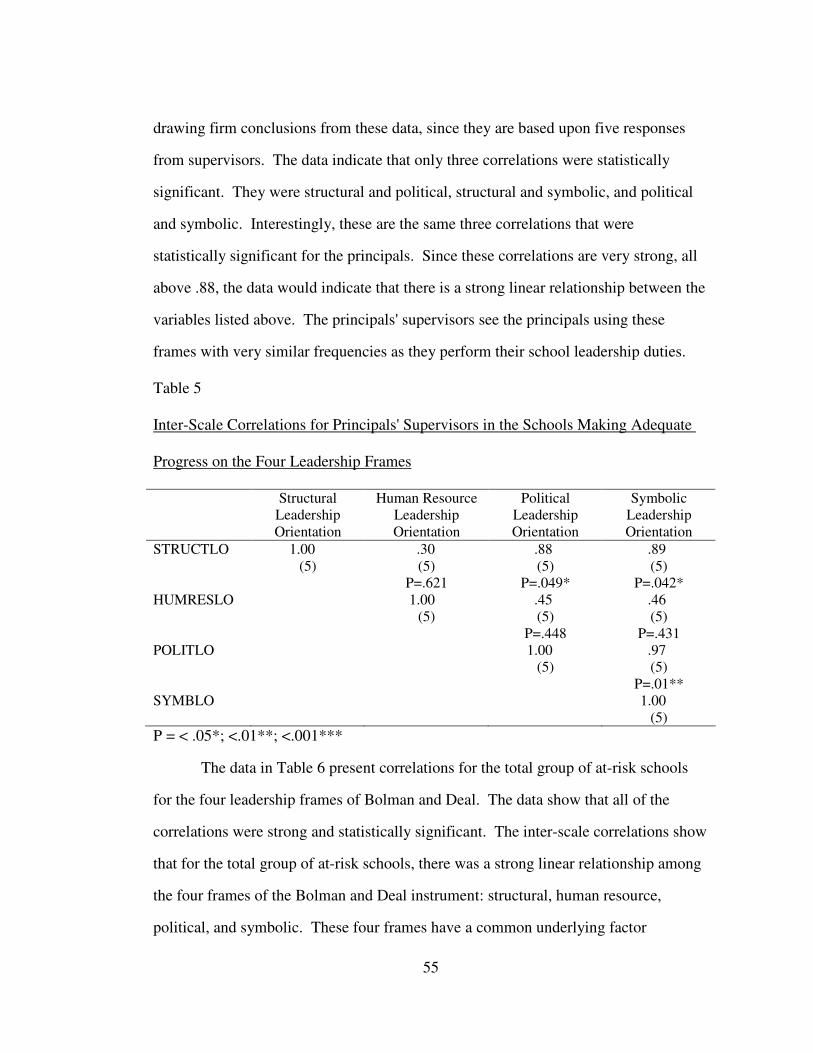
55
drawing firm conclusions from these data, since they are based upon five responses
from supervisors. The data indicate that only three correlations were statistically
significant. They were structural and political, structural and symbolic, and political
and symbolic. Interestingly, these are the same three correlations that were
statistically significant for the principals. Since these correlations are very strong, all
above .88, the data would indicate that there is a strong linear relationship between the
variables listed above. The principals' supervisors see the principals using these
frames with very similar frequencies as they perform their school leadership duties.
Table 5
Inter-Scale Correlations for Principals' Supervisors in the Schools Making Adequate
Progress on the Four Leadership Frames
StructuralLeadershipOrientation
Human ResourceLeadershipOrientation
PoliticalLeadershipOrientation
SymbolicLeadershipOrientation
STRUCTLO 1.00(5)
.30(5)
P=.621
.88(5)
P=.049*
.89(5)
P=.042*HUMRESLO 1.00
(5).45(5)
P=.448
.46(5)
P=.431POLITLO 1.00
(5).97(5)
P=.01**SYMBLO 1.00
(5)P = < .05*; <.01**; <.001***
The data in Table 6 present correlations for the total group of at-risk schools
for the four leadership frames of Bolman and Deal. The data show that all of the
correlations were strong and statistically significant. The inter-scale correlations show
that for the total group of at-risk schools, there was a strong linear relationship among
the four frames of the Bolman and Deal instrument: structural, human resource,
political, and symbolic. These four frames have a common underlying factor
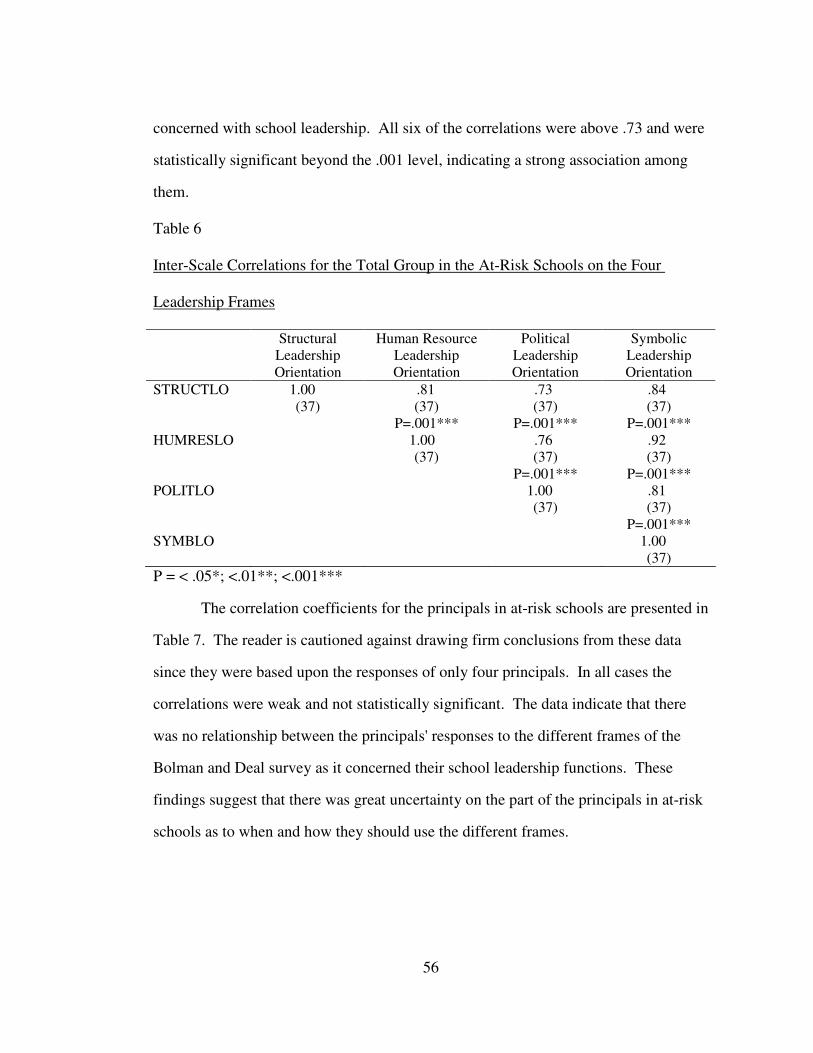
56
concerned with school leadership. All six of the correlations were above .73 and were
statistically significant beyond the .001 level, indicating a strong association among
them.
Table 6
Inter-Scale Correlations for the Total Group in the At-Risk Schools on the Four
Leadership Frames
StructuralLeadershipOrientation
Human ResourceLeadershipOrientation
PoliticalLeadershipOrientation
SymbolicLeadershipOrientation
STRUCTLO 1.00(37)
.81(37)
P=.001***
.73(37)
P=.001***
.84(37)
P=.001***HUMRESLO 1.00
(37).76(37)
P=.001***
.92(37)
P=.001***POLITLO 1.00
(37).81(37)
P=.001***SYMBLO 1.00
(37)P = < .05*; <.01**; <.001***
The correlation coefficients for the principals in at-risk schools are presented in
Table 7. The reader is cautioned against drawing firm conclusions from these data
since they were based upon the responses of only four principals. In all cases the
correlations were weak and not statistically significant. The data indicate that there
was no relationship between the principals' responses to the different frames of the
Bolman and Deal survey as it concerned their school leadership functions. These
findings suggest that there was great uncertainty on the part of the principals in at-risk
schools as to when and how they should use the different frames.
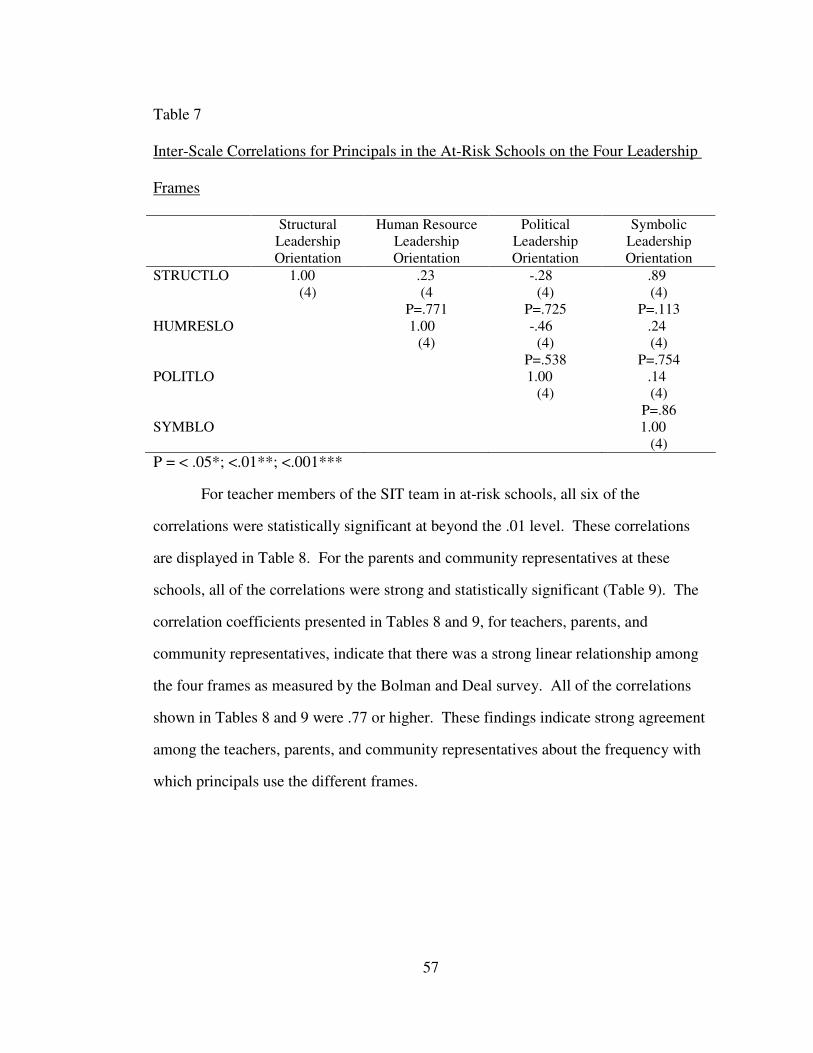
57
Table 7
Inter-Scale Correlations for Principals in the At-Risk Schools on the Four Leadership
Frames
StructuralLeadershipOrientation
Human ResourceLeadershipOrientation
PoliticalLeadershipOrientation
SymbolicLeadershipOrientation
STRUCTLO 1.00(4)
.23(4
P=.771
-.28(4)
P=.725
.89(4)
P=.113HUMRESLO 1.00
(4)-.46
(4)P=.538
.24(4)
P=.754POLITLO 1.00
(4).14(4)
P=.86SYMBLO 1.00
(4)P = < .05*; <.01**; <.001***
For teacher members of the SIT team in at-risk schools, all six of the
correlations were statistically significant at beyond the .01 level. These correlations
are displayed in Table 8. For the parents and community representatives at these
schools, all of the correlations were strong and statistically significant (Table 9). The
correlation coefficients presented in Tables 8 and 9, for teachers, parents, and
community representatives, indicate that there was a strong linear relationship among
the four frames as measured by the Bolman and Deal survey. All of the correlations
shown in Tables 8 and 9 were .77 or higher. These findings indicate strong agreement
among the teachers, parents, and community representatives about the frequency with
which principals use the different frames.

58
Table 8
Inter-Scale Correlations for Teacher Members of the SIT Team in the At-Risk Schools
on the Four Leadership Frames
StructuralLeadershipOrientation
Human ResourceLeadershipOrientation
PoliticalLeadershipOrientation
SymbolicLeadershipOrientation
STRUCTLO 1.00(13)
.77(13)
P=.01**
.84(13)
P=.001***
.82(13)
P=.001***HUMRESLO 1.00
(13).83(13)
P=.001***
.95(13)
P=.001***POLITLO 1.00
(13).92(13)
P=.001***SYMBLO 1.00
(13)P = < .05*; <.01**; <.001***
Table 9
Inter-Scale Correlations for Parents and Community Representatives of the SIT Team
in the At-Risk Schools on the Four Leadership Frames
StructuralLeadershipOrientation
Human ResourceLeadershipOrientation
PoliticalLeadershipOrientation
SymbolicLeadershipOrientation
STRUCTLO 1.00(15)
.90(15)
P=.001***
.86(15)
P=.001***
.86(15)
P=.001***HUMRESLO 1.00
(15).89(15)
P=.001***
.92(15)
P=.001***POLITLO 1.00
(15).94(15)
P=.001***SYMBLO 1.00
(15)P = < .05*; <.01**; <.001***
The correlation coefficients for principals' supervisors in at-risk schools are
presented in Table 10. The data indicate that five of the six correlations were strong
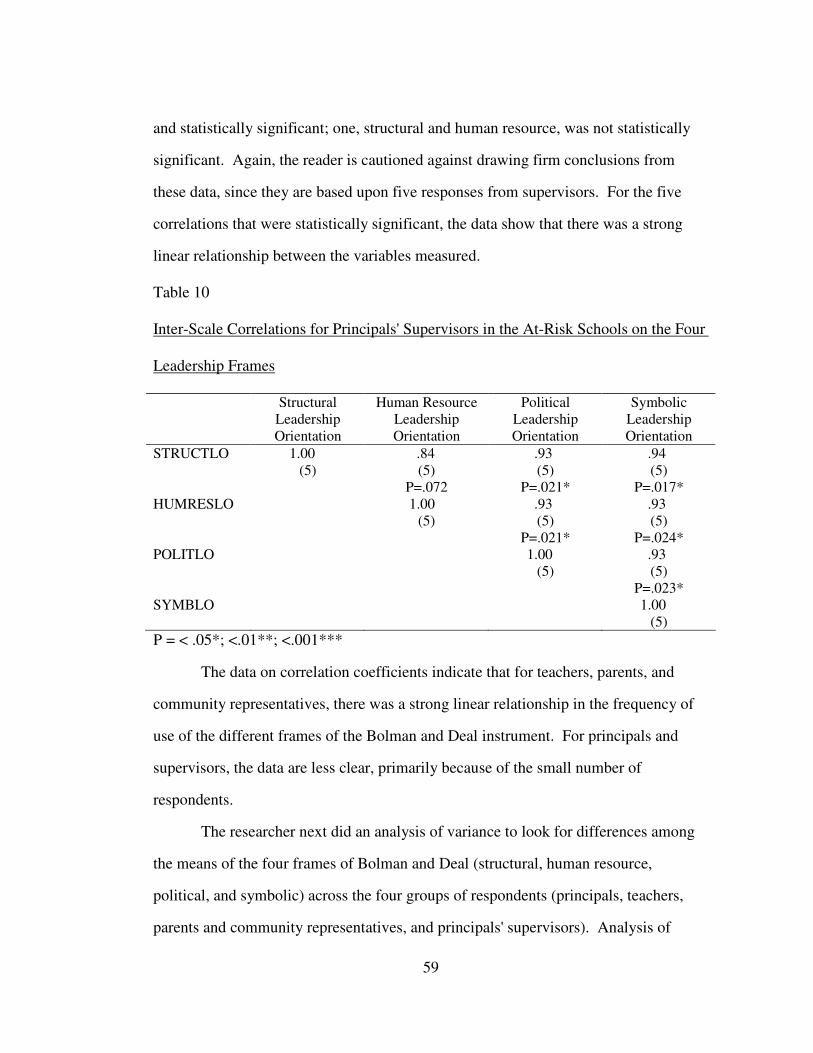
59
and statistically significant; one, structural and human resource, was not statistically
significant. Again, the reader is cautioned against drawing firm conclusions from
these data, since they are based upon five responses from supervisors. For the five
correlations that were statistically significant, the data show that there was a strong
linear relationship between the variables measured.
Table 10
Inter-Scale Correlations for Principals' Supervisors in the At-Risk Schools on the Four
Leadership Frames
StructuralLeadershipOrientation
Human ResourceLeadershipOrientation
PoliticalLeadershipOrientation
SymbolicLeadershipOrientation
STRUCTLO 1.00(5)
.84(5)
P=.072
.93(5)
P=.021*
.94(5)
P=.017*HUMRESLO 1.00
(5).93(5)
P=.021*
.93(5)
P=.024*POLITLO 1.00
(5).93(5)
P=.023*SYMBLO 1.00
(5)P = < .05*; <.01**; <.001***
The data on correlation coefficients indicate that for teachers, parents, and
community representatives, there was a strong linear relationship in the frequency of
use of the different frames of the Bolman and Deal instrument. For principals and
supervisors, the data are less clear, primarily because of the small number of
respondents.
The researcher next did an analysis of variance to look for differences among
the means of the four frames of Bolman and Deal (structural, human resource,
political, and symbolic) across the four groups of respondents (principals, teachers,
parents and community representatives, and principals' supervisors). Analysis of
60
variance is the appropriate statistic to use when an independent variable has more than
two levels (in this case, groups). Tables 11 and 12 present the results of the analysis
of variance to determine whether there were statistically significant differences among
the four frames used by the principals of the schools making adequate progress and the
schools considered at risk, as judged by the principals, teachers, parents and
community representatives, and principals' supervisors. The data indicate that there
were no statistically significant differences in patterns among the judgments of
principals, SIT Team members, and principals' supervisors.
Since the analysis indicated that there were no statistically significant
differences in the means for either the at-risk schools or the schools making adequate
progress, the researcher decided to use a finer-grained analysis and therefore
conducted a series of independent t-tests. The results of this analysis are presented in
Tables 13 through 16 in the following section on the research questions.
The researcher used independent t-tests to answer the research questions. The
purpose of the t-test for independent means (schools making adequate progress and
schools at risk) is to help the researcher decide whether the observed difference
between two sample means arose by chance or represents a true difference between
populations (Shavelson, 1988).

61
Table 11
One-Way Analysis of Variance of Differences in Patterns Among Principals', SIT
Team Members, and Principals' Supervisors' Judgments of Principals' Frame
Utilization in Schools Making Adequate Progress
Structural Dimension
dfSum ofSquares
MeanSquare F Sig.
Between Groups 3 109.78 36.59
1.56 .22
Within Groups 34 796.12 23.42
Human Resource Dimension
dfSum ofSquares
MeanSquare F Sig.
Between Groups 3 149.19 49.73
1.99 .13
Within Groups 34 851.68 25.05
Political Dimension
dfSum ofSquares
MeanSquare F Sig.
Between Groups 3 78.95 26.32
.92 .44
Within Groups 34 969.89 28.53
Symbolic Dimension
dfSum ofSquares
MeanSquare F Sig.
Between Groups 3 174.17 58.06
1.87 .15
Within Groups 34 1,055.23 31.04P = < .05*; <.01**; <.001***
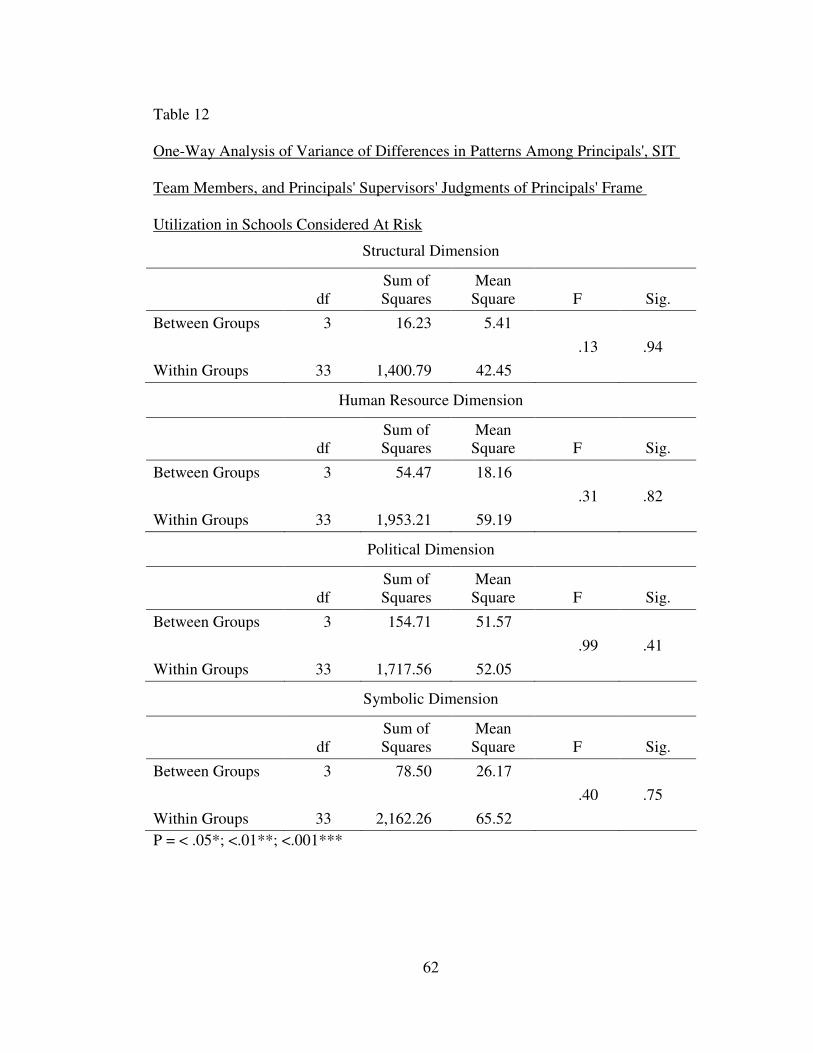
62
Table 12
One-Way Analysis of Variance of Differences in Patterns Among Principals', SIT
Team Members, and Principals' Supervisors' Judgments of Principals' Frame
Utilization in Schools Considered At Risk
Structural Dimension
dfSum ofSquares
MeanSquare F Sig.
Between Groups 3 16.23 5.41
.13 .94
Within Groups 33 1,400.79 42.45
Human Resource Dimension
dfSum ofSquares
MeanSquare F Sig.
Between Groups 3 54.47 18.16
.31 .82
Within Groups 33 1,953.21 59.19
Political Dimension
dfSum ofSquares
MeanSquare F Sig.
Between Groups 3 154.71 51.57
.99 .41
Within Groups 33 1,717.56 52.05
Symbolic Dimension
dfSum ofSquares
MeanSquare F Sig.
Between Groups 3 78.50 26.17
.40 .75
Within Groups 33 2,162.26 65.52P = < .05*; <.01**; <.001***

63
Research Questions and Statistical Hypotheses
Research Question 1
From the perspective of the principals, to what extent are there differences in
principals' frame utilization (structural, human resource, political and symbolic
orientations) in schools labeled "at risk" and in schools "making adequate progress" as
judged by state standards?
Statistical Hypothesis 1
From the perspective of the principals, there are no statistically significant
differences in the means of principals' frame utilization (structural, human resource,
political and symbolic orientations) in schools labeled "at risk" and in schools "making
adequate progress" as judged by state standards.
The data presented in Table 13 indicate that for principals, there were no
statistically significant differences on the structural, political, or symbolic frames.
There was a statistically significant difference on the human resource variable. The
principals of schools making adequate progress had a statistically significantly higher
mean than did the principals of the at-risk schools. The statistical hypothesis was
accepted for structural, political, and symbolic orientations. It was rejected for human
resources.
It is important to note that the means in Table 13 are all high. There were eight
statements to judge for each frame and five options from which to choose. This means
that the means could range from 8 to 40. Most of the means are between 31 and 33,
which means the respondents felt that the principal often used the frame. It is also
important to note that the standard deviations for the at-risk principals in three of four
cases are two to five times larger than those for the principals of the schools making
adequate progress.
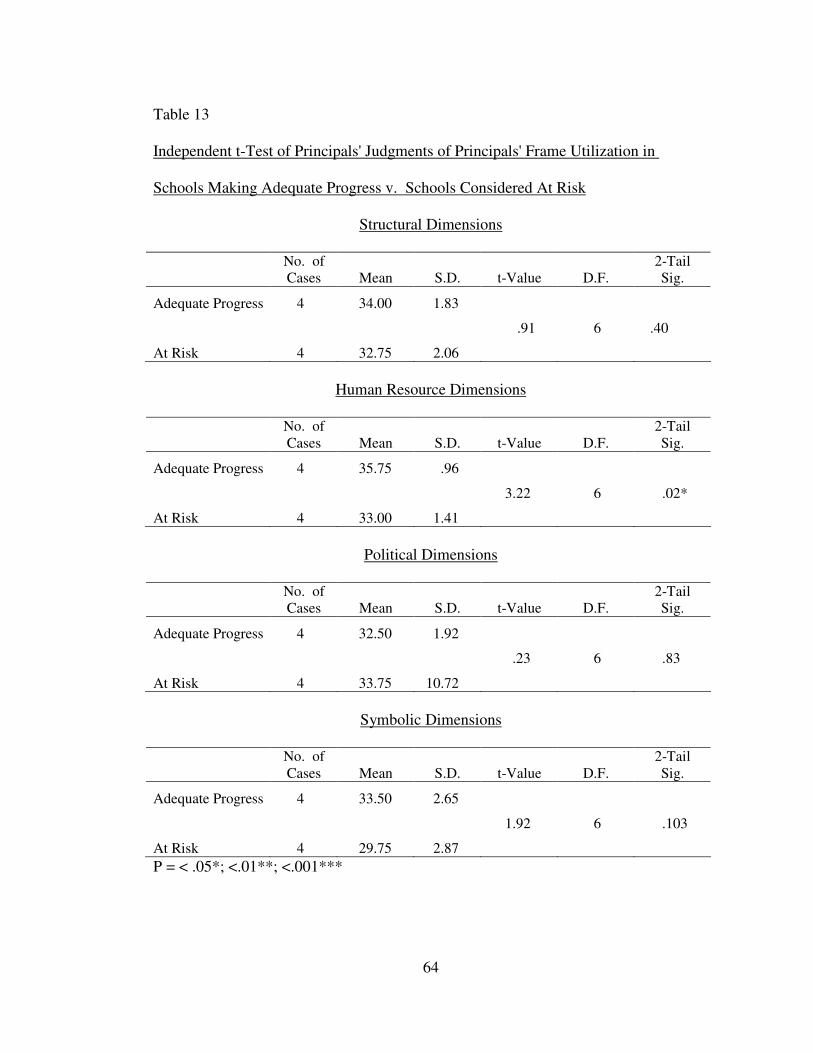
64
Table 13
Independent t-Test of Principals' Judgments of Principals' Frame Utilization in
Schools Making Adequate Progress v. Schools Considered At Risk
Structural Dimensions
No. ofCases Mean S.D. t-Value D.F.
2-TailSig.
Adequate Progress 4 34.00 1.83
.91 6 .40
At Risk 4 32.75 2.06
Human Resource Dimensions
No. ofCases Mean S.D. t-Value D.F.
2-TailSig.
Adequate Progress 4 35.75 .96
3.22 6 .02*
At Risk 4 33.00 1.41
Political Dimensions
No. ofCases Mean S.D. t-Value D.F.
2-TailSig.
Adequate Progress 4 32.50 1.92
.23 6 .83
At Risk 4 33.75 10.72
Symbolic Dimensions
No. ofCases Mean S.D. t-Value D.F.
2-TailSig.
Adequate Progress 4 33.50 2.65
1.92 6 .103
At Risk 4 29.75 2.87P = < .05*; <.01**; <.001***
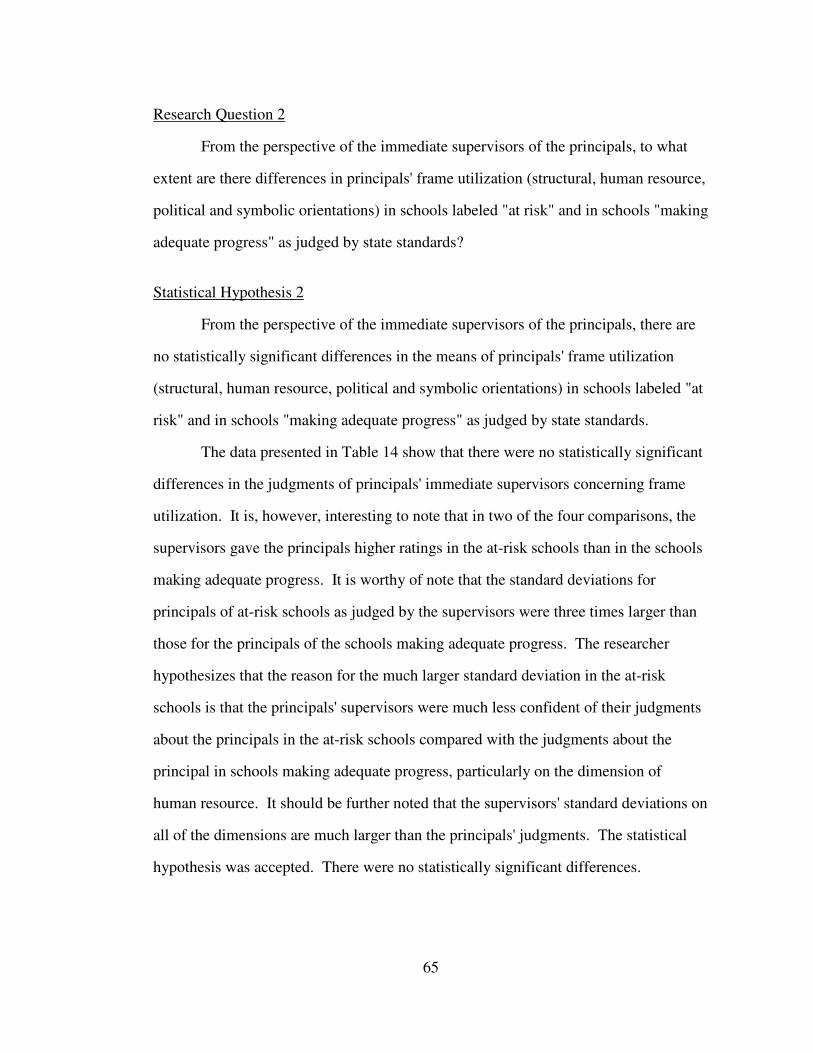
65
Research Question 2
From the perspective of the immediate supervisors of the principals, to what
extent are there differences in principals' frame utilization (structural, human resource,
political and symbolic orientations) in schools labeled "at risk" and in schools "making
adequate progress" as judged by state standards?
Statistical Hypothesis 2
From the perspective of the immediate supervisors of the principals, there are
no statistically significant differences in the means of principals' frame utilization
(structural, human resource, political and symbolic orientations) in schools labeled "at
risk" and in schools "making adequate progress" as judged by state standards.
The data presented in Table 14 show that there were no statistically significant
differences in the judgments of principals' immediate supervisors concerning frame
utilization. It is, however, interesting to note that in two of the four comparisons, the
supervisors gave the principals higher ratings in the at-risk schools than in the schools
making adequate progress. It is worthy of note that the standard deviations for
principals of at-risk schools as judged by the supervisors were three times larger than
those for the principals of the schools making adequate progress. The researcher
hypothesizes that the reason for the much larger standard deviation in the at-risk
schools is that the principals' supervisors were much less confident of their judgments
about the principals in the at-risk schools compared with the judgments about the
principal in schools making adequate progress, particularly on the dimension of
human resource. It should be further noted that the supervisors' standard deviations on
all of the dimensions are much larger than the principals' judgments. The statistical
hypothesis was accepted. There were no statistically significant differences.

66
Table 14
Independent t-Test of Principals' Supervisors' Judgments of Principals' Frame
Utilization in Schools Making Adequate Progress v. Schools Considered At Risk
Structural Dimensions
No. ofCases Mean S.D. t-Value D.F.
2-TailSig.
Adequate Progress 5 33.00 7.04
.16 8 .87
At Risk 5 32.20 8.32
Human Resource Dimensions
No. ofCases Mean S.D. t-Value D.F.
2-TailSig.
Adequate Progress 5 31.60 2.70
.15 8 .88
At Risk 5 32.20 8.13
Political Dimensions
No. ofCases Mean S.D. t-Value D.F.
2-TailSig.
Adequate Progress 5 29.80 6.10
.20 8 .85
At Risk 5 29.00 6.48
Symbolic Dimensions
No. ofCases Mean S.D. t-Value D.F.
2-TailSig.
Adequate Progress 5 28.80 6.50
.09 8 .93
At Risk 5 29.20 7.82P = < .05*; <.01**; <.001***

67
Research Question 3
From the perspective of SIT team members, to what extent are there
differences in principals' frame utilization (structural, human resource, political and
symbolic orientations) in schools labeled "at risk" and in schools "making adequate
progress" as judged by state standards?
Statistical Hypothesis 3
From the perspective of SIT team members, there are no statistically
significant differences in the means of principals' frame utilization (structural, human
resource, political and symbolic orientations) in schools labeled "at risk" and in
schools "making adequate progress" as judged by state standards.
The data in Table 15 show that for teacher members of the SIT team, there
were no statistically significant differences in the means between schools making
adequate progress and schools at risk. Therefore, the statistical hypothesis was
accepted. It is again noted that the standard deviations in the at-risk schools are
considerably larger than those in the schools making adequate progress. This again
indicates a level of uncertainty and a surprising level of variance on the part of the
teachers in at-risk schools who are judging their principals' use of the four frames.
The data for Table 16 show that for parents and community members of the
SIT team, there were no statistically significant differences between schools making
adequate progress and schools at risk. The statistical hypothesis was therefore
accepted. In Tables 15 and 16, the standard deviations for the at-risk schools are
larger than for the schools making adequate progress.

68
Table 15
Independent t-Test of Teacher Members of the SIT Team's Judgments of Principals'
Frame Utilization in Schools Making Adequate Progress v. Schools Considered At
Risk
Structural Dimensions
No. ofCases Mean S.D. t-Value D.F.
2-TailSig.
Adequate Progress 15 33.80 5.80
.42 26 .68
At Risk 13 32.77 7.25
Human Resource Dimensions
No. ofCases Mean S.D. t-Value D.F.
2-TailSig.
Adequate Progress 15 33.47 7.13
.91 26 .37
At Risk 13 30.62 9.50
Political Dimensions
No. ofCases Mean S.D. t-Value D.F.
2-TailSig.
Adequate Progress 15 32.13 6.39
1.25 26 .22
At Risk 13 28.62 8.49
Symbolic Dimensions
No. ofCases Mean S.D. t-Value D.F.
2-TailSig.
Adequate Progress 15 33.00 6.73
.83 26 .41
At Risk 13 30.23 10.65P = < .05*; <.01**; <.001***
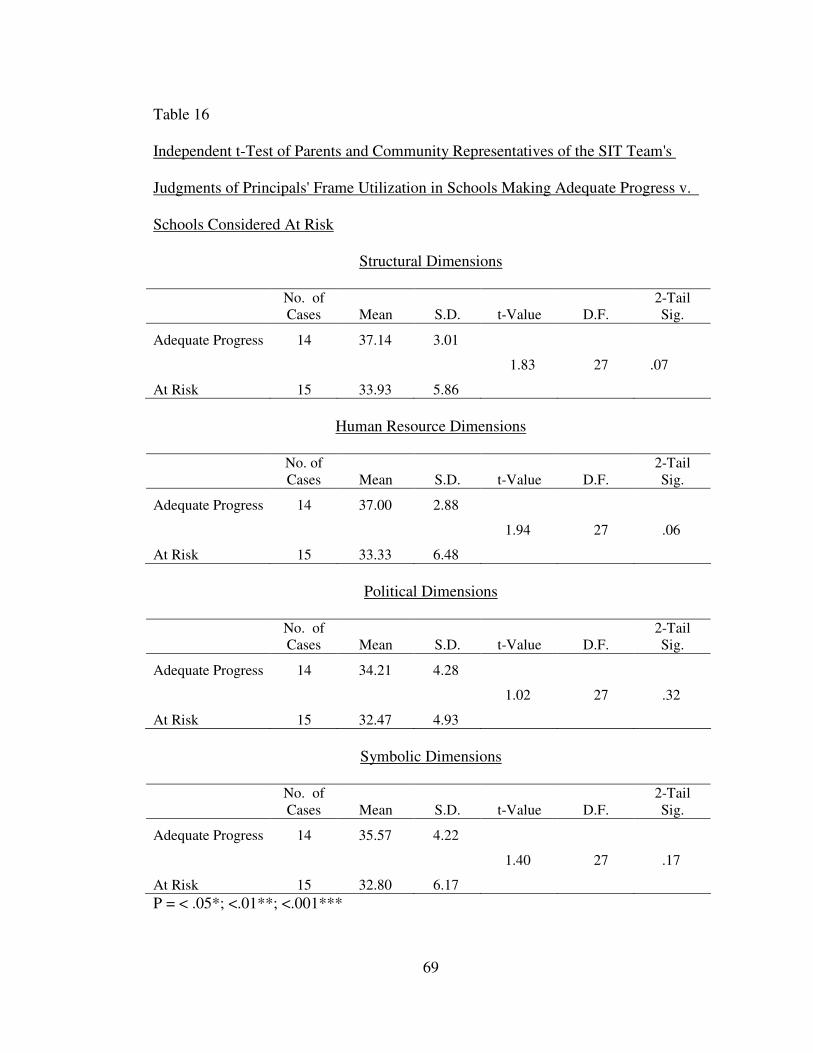
69
Table 16
Independent t-Test of Parents and Community Representatives of the SIT Team's
Judgments of Principals' Frame Utilization in Schools Making Adequate Progress v.
Schools Considered At Risk
Structural Dimensions
No. ofCases Mean S.D. t-Value D.F.
2-TailSig.
Adequate Progress 14 37.14 3.01
1.83 27 .07
At Risk 15 33.93 5.86
Human Resource Dimensions
No. ofCases Mean S.D. t-Value D.F.
2-TailSig.
Adequate Progress 14 37.00 2.88
1.94 27 .06
At Risk 15 33.33 6.48
Political Dimensions
No. ofCases Mean S.D. t-Value D.F.
2-TailSig.
Adequate Progress 14 34.21 4.28
1.02 27 .32
At Risk 15 32.47 4.93
Symbolic Dimensions
No. ofCases Mean S.D. t-Value D.F.
2-TailSig.
Adequate Progress 14 35.57 4.22
1.40 27 .17
At Risk 15 32.80 6.17P = < .05*; <.01**; <.001***

70
In concluding this section, it is important to point out that for the principals,
supervisors, teachers, parents, and community members, the number in any one of the
groups was quite small. Therefore, it was much more difficult to find statistically
significant differences. This is particularly true for principals and supervisors, where
there were only four or five respondents in a group. There was a great deal of
variance in judgments about the principals of at-risk schools and their use of the four
frames. This was true for the principals themselves, their supervisors, teachers,
parents, and community representatives.
Demographics
Tables 17 through 24 present demographics for principals, supervisors, and
SIT Team members (teachers, parents, and community representatives) both for
schools making adequate progress and schools considered at risk.
Table 17
Demographics of Principals in Schools Making Adequate Progress
GenderMale 1Female 3Years inEducation
1-5 6-10 11-15 16-20 21+
1 3Years inCurrent Job
1-5 6-10 11-15 16-20 21+
2 1 1EducationalLevel
Gr. 12+ BA/BS MA MA+30 Ph.D/Ed.D
1 3Age 22-30 31-40 41-50 51+
1 3
71
Table 18
Demographics of Principals in Schools Considered At Risk
GenderMale 1Female 3Years inEducation
1-5 6-10 11-15 16-20 21+
1 2 1Years inCurrent Job
1-5 6-10 11-15 16-20 21+
2 2EducationalLevel
Gr. 12+ BA/BS MA MA+30 Ph.D/Ed.D
1 2 1Age 22-30 31-40 41-50 51+
2 2
Table 19
Demographics of Principals' Supervisors in Schools Making Adequate Progress
GenderMale 0Female 5Years inEducation
1-5 6-10 11-15 16-20 21+
5EducationalLevel
Gr. 12+ BA/BS MA MA+30 Ph.D/Ed.D
5Age 22-30 31-40 41-50 51+
5
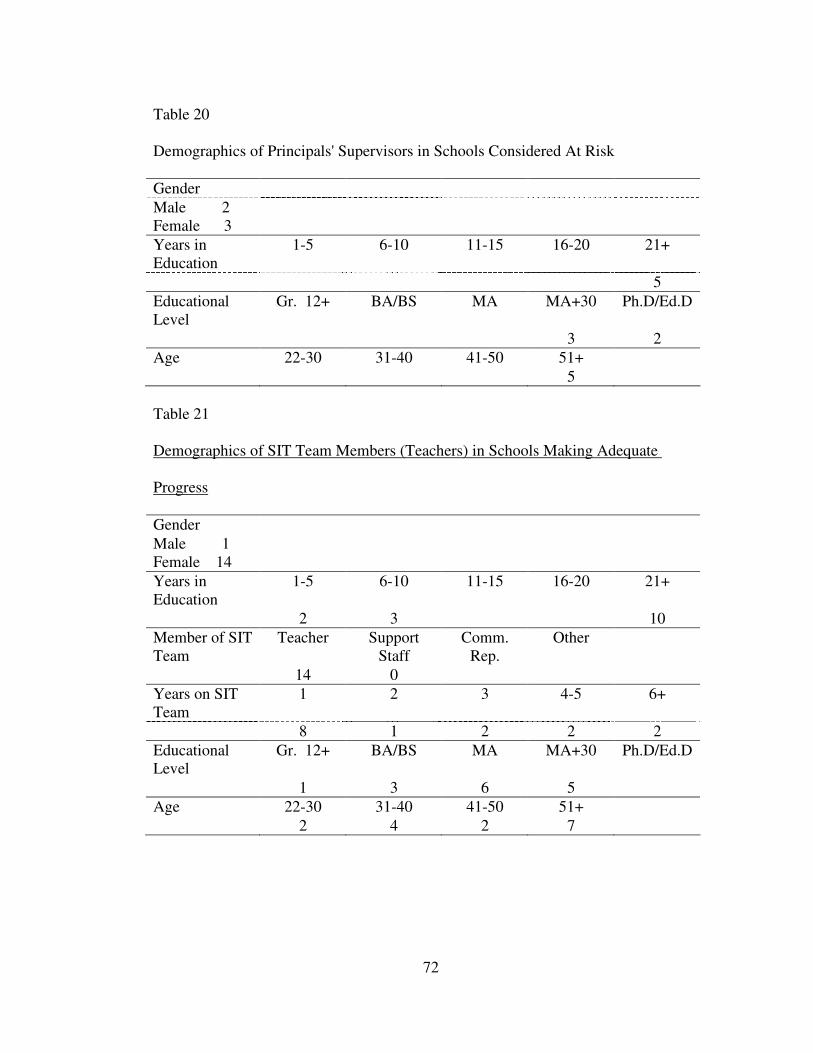
72
Table 20
Demographics of Principals' Supervisors in Schools Considered At Risk
GenderMale 2Female 3Years inEducation
1-5 6-10 11-15 16-20 21+
5EducationalLevel
Gr. 12+ BA/BS MA MA+30 Ph.D/Ed.D
3 2Age 22-30 31-40 41-50 51+
5
Table 21
Demographics of SIT Team Members (Teachers) in Schools Making Adequate
Progress
GenderMale 1Female 14Years inEducation
1-5 6-10 11-15 16-20 21+
2 3 10Member of SITTeam
Teacher SupportStaff
Comm.Rep.
Other
14 0Years on SITTeam
1 2 3 4-5 6+
8 1 2 2 2EducationalLevel
Gr. 12+ BA/BS MA MA+30 Ph.D/Ed.D
1 3 6 5Age 22-30 31-40 41-50 51+
2 4 2 7

73
Table 22
Demographics of SIT Team Members (Teachers) in Schools Considered At Risk
GenderMaleFemale 13Years inEducation
1-5 6-10 11-15 16-20 21+
7 2 2 2Member of SITTeam
Teacher SupportStaff
Comm.Rep.
Other
13 0Years on SITTeam
1 2 3 4-5 6+
5 2 2 3 1EducationalLevel
Gr. 12+ BA/BS MA MA+30 Ph.D/Ed.D
7 5 1Age 22-30 31-40 41-50 51+
8 2 3
Table 23
Demographics of SIT Team Members (Parents and Community Representatives) in
Schools Making Adequate Progress
GenderMale 2Female 12Years inEducation
1-5 6-10 11-15 16-20 21+
2 2 2 7Member of SITTeam
Teacher Parents Comm.Rep.
Other
5 9Years on SITTeam
1 2 3 4-5 6+
5 1 1 4 3EducationalLevel
Gr. 12+ BA/BS MA MA+30 Ph.D/Ed.D
1 5 2 5 1Age 22-30 31-40 41-50 51+
2 2 10
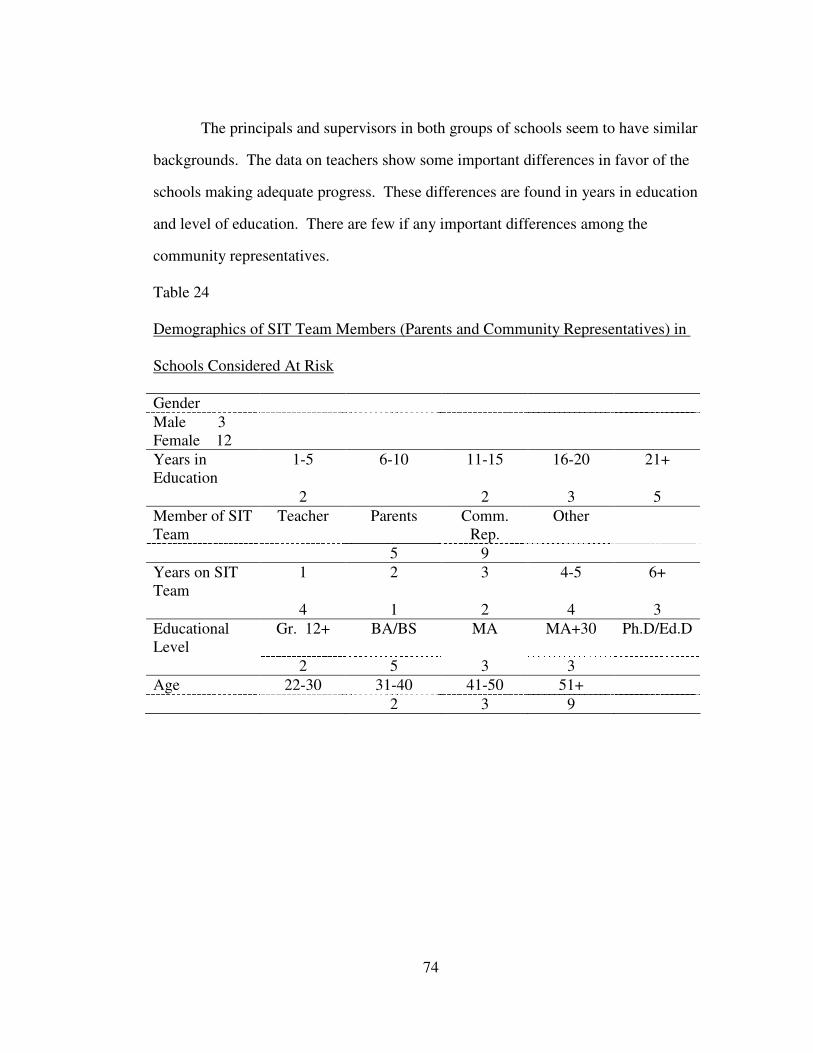
74
The principals and supervisors in both groups of schools seem to have similar
backgrounds. The data on teachers show some important differences in favor of the
schools making adequate progress. These differences are found in years in education
and level of education. There are few if any important differences among the
community representatives.
Table 24
Demographics of SIT Team Members (Parents and Community Representatives) in
Schools Considered At Risk
GenderMale 3Female 12Years inEducation
1-5 6-10 11-15 16-20 21+
2 2 3 5Member of SITTeam
Teacher Parents Comm.Rep.
Other
5 9Years on SITTeam
1 2 3 4-5 6+
4 1 2 4 3EducationalLevel
Gr. 12+ BA/BS MA MA+30 Ph.D/Ed.D
2 5 3 3Age 22-30 31-40 41-50 51+
2 3 9
75
CHAPTER V
SUMMARY, CONCLUSIONS, AND RECOMMENDATIONS
Summary
The purpose of this study was to examine the extent to which leadership
behaviors of principals differ in schools at risk for reconstitution and in schools judged
as meeting state standards, and to determine the extent to which principals in these
schools employ frame utilization strategies for school improvement as designed by
Bolman and Deal (1992). Schools, in recent decades, have been challenged to
improve to the extent that every attempt is made to ensure the success of all students
(No Child Left Behind, 2003). The reform movements mandated by the state
highlight the role of the school principal. Efforts to improve education relate directly
to the quality of leadership provided by the school principal.
Research has shown that the one determinant of excellence in the schools is the
leadership of the individual school principal (Action for Excellence, 1983, p. 29).
While there are various models or methods to capture information concerning
leadership roles and styles, Sebring and Bryk (2000) posit that "the behaviors and
practices of the school principal have influence on all aspects of the learning
community, which leads to school success" (p.441). Further, the principal's belief
about students' abilities to learn and teachers' ability to teach affect long-range and
everyday teaching and learning processes (Greenfield, 1991). The principal is actively
involved in decision making about instruction and must attend to instructional
objectives as well as instructional strategies. Recent research on school reform
advocates involving as many people as possible in local school decision making. This
shared decision making reflects a less centralized approach to school leadership and
76
requires a great deal of collaboration and trust (Midgely & Wood, 1993).
Collaborative decision making takes many forms, depending on the people involved;
therefore, the role of the principal changes as situations and circumstances change.
Bolman and Deal (1984) assert that principals view their world through a framework
of preconditioned lenses and filters. This framework shapes how situations are
defined and determines what actions are taken.
This study was designed to investigate the extent to which principals employ
frame utilization strategies as designed by Bolman and Deal (1997) when making
judgments and management decisions for school improvement. In their research, they
have consolidated major schools of organizational thought into four perspectives and
labeled them frames. The structural frame emphasized goals, specialized roles and
formal relationships. Problems and performance gaps arise from structural
deficiencies and can be improved through restructuring. The human resource frame
sees an organization comparable to an extended family with individuals with needs,
feelings, prejudices, skills, and limitations; from the human resource frame, the
challenge is to tailor organizations to the people, to find ways for these individuals to
"buy in" to what they are charged to do. From the political perspective, different
interests complete for power and scarce resources and conditions emerge around
special interests and also change as issues in the organization change. The symbolic
frame sees an organization as cultures motivated by rituals, ceremonies, heroes and
myths rather than by rules, policies and managerial authority. Assumptions of
rationality are not as prominent in the symbolic frame as in the three previous frames.
The sample population for this study was composed, first, of ten elementary
school principals; four of five principals both in schools considered at risk and in
schools making adequate progress as judged by state standards responded to the
survey. In addition, the immediate supervisors of the principals in both groups and
77
members of the School Improvement Team (teachers, other staff and community
members) also responded to the survey. The Leadership Orientation Survey
(Appendix A) was used for data collection. This instrument is designed to measure
the extent to which leaders use the four frames. Bolman and Deal parallel versions of
the instrument—one for leaders (Self) and the other for supervisors and teachers
(Others). For this study, the parallel versions are Self (for principals to rate
themselves) and Others (for ratings from the principals' immediate supervisors and
from the SIT Team—teachers, parents, and community representatives). The response
rate was 80% from the principals, 100% from the immediate supervisors, and 72%
from the SIT members.
Cronbach alphas, a measure of inter-item reliability, were computed for each
of the four frames as well as correlation coefficients computed among the four frames.
All of the Cronbach alphas were statistically significant at the .001 level and ranged
from .75 to .93. The researcher concluded that the Bolman and Deal instrument had
strong inter-item reliability. The only exception was the political frame, where the
Cronbach alpha was only .75 and would be called modest.
The inter-scale correlations show that for the total group in schools making
adequate progress, there were strong correlations among the four frames of the
Bolman and Deal instrument, all of which were statistically significant beyond the
.001 level. For the principals of schools making adequate progress, three of the six
correlations were statistically significant. These correlations need to be viewed with
caution, since they are based on only four principal responses. For teacher members
of the SIT, all six of the correlations were statistically significant at or beyond the .01
level. For the parents and community representatives, all of the correlations were
strong and statistically significant. For the principals' supervisors, only three of the

78
correlations were statistically significant. These correlations also should be viewed
with caution, as they are based on only five supervisor responses.
For the total group of the at-risk schools for the four leadership frames, the
data show that all of the correlations were strong and statistically significant. The
correlations for the principals in at-risk schools in all cases were weak and not
statistically significant. Again, the small number of principals responding may make
drawing conclusions difficult. The correlations for both groups on the SIT were
strong and statistically significant. The same was generally true for the principals'
supervisors in at-risk schools, where the correlations were strong and statistically
significant with one exception. These correlations should be viewed cautiously, as
they are based on only five supervisor responses.
In all cases except for the principals themselves and their supervisors, the
correlations were in the .70 to .95 range. This means that about 49% to 90% of the
variance was shared by the four frames. For principals, particularly in the at-risk
schools, the correlations were weak and in many cases not statistically significant.
The researcher concluded that this may be the result of the small number of principals
in the sample, four in each group, or it may reflect a greater variance in the principals'
responses.
Conclusions
Research Question 1
From the perspective of the principals, to what extent are there differences in
principals' frame utilization (structural, human resource, political and symbolic
orientations) in schools labeled "at risk" and in schools "making adequate progress" as
judged by state standards?
79
For principals there were no statistically significant differences on the
structural, political, or symbolic frames. There was a statistically significant
difference on the human resource variable. The principals of schools making adequate
progress had a statistically significantly higher mean than did the principals of the at-
risk schools. The statistical hypothesis was accepted for structural, political, and
symbolic orientations. It was rejected for the human resource orientation.
The researcher concluded that the higher means for human resource orientation
may mean that the principals in schools making adequate progress may view their
school organizations as an extended family and seek to tailor the organization to the
needs of the people. There was no greater emphasis on any one dimension but a well-
balanced approach was taken by the principal across these four important dimensions
concerned with leading and managing an elementary school. On the political
dimension, the standard deviations for the at-risk schools were five times larger than
for the principals in schools making adequate progress. This finding led the researcher
to conclude that there was a great deal more variance (uncertainty) in the responses of
the principals in at-risk schools than there was in schools making adequate progress.
Inter-scale correlations for principals in both groups were computed between
frames and revealed low and in some cases negative correlations. The researcher
believed that there are two possible reasons for these findings. One is that the number
of principals responding was very small, only four in each group. Second, the
standard deviation (variance) is much higher for the principals in the at-risk schools.
The researcher tentatively concluded that principals in at-risk schools were less
confident about their abilities to use the frames than were the principals in the schools
making adequate progress.
80
Research Question 2
From the perspective of the immediate supervisors of the principals, to what
extent are there differences in principals' frame utilization (structural, human resource,
political and symbolic orientations) in schools labeled "at risk" and in schools "making
adequate progress" as judged by state standards?
From the perspective of the immediate supervisors of the principals, there were
no statistically significant differences in the means of principals' frame utilization
(structural, human resource, political and symbolic orientations) between schools
labeled at risk and in schools making adequate progress as judged by state standards.
However, in two of the four comparisons, the supervisors gave the principals higher
ratings in the at-risk schools than in schools making adequate progress. The statistical
hypothesis was accepted. There are no statistical differences.
In the case of principals' supervisors in schools making adequate progress, only
three of the six correlations were statistically significant. In the at-risk schools, five of
the six correlations were statistically significant. The standard deviations (variance)
were larger in the at-risk schools compared to the schools making adequate progress.
The principals' immediate supervisors gave the principals similar ratings on the four
frames of the Bolman and Deal survey. The researcher concluded that the differences
that exist may be due to the small number of raters, five for each principal. The large
variance associated with each frame may be the result of a different orientation by the
supervisors. This is an area that needs further study.
Research Question 3
From the perspective of SIT team members, to what extent are there
differences in principals' frame utilization (structural, human resource, political and
symbolic orientations) in schools labeled "at risk" and in schools "making adequate
progress" as judged by state standards?
81
For teacher members of the SIT, there were no statistically significant
differences in the means between schools making adequate progress and schools at
risk. Therefore, the statistical hypothesis was accepted.
For parents and community members of the SIT, there were no statistically
significant differences between schools making adequate progress and schools at risk.
The statistical hypothesis was accepted.
The correlations for members of the SIT, whether teachers, parents, or
community representatives, were all high and statistically significant beyond the .001
level. This was true for both the schools making adequate progress and the at-risk
schools. This led the researcher to conclude that the SIT members felt there was a
strong relationship between the four frames identified by Bolman and Deal. The
standard deviations (variance) were greater for the principals of at-risk schools than
for principals of schools making adequate progress.
The teachers, parents, and community representatives gave the principals very
similar ratings for their use of the four frames in both groups of schools. There was
considerably more variance in the responses of the teachers, parents, and community
representatives in the schools at risk than was true for the schools making adequate
progress. The researcher therefore concluded that there was greater variance between
the teachers, parents, and community representatives' judgments about principals in
the at-risk schools than in the schools making adequate progress.
The researcher's major conclusion is that the principal of a school considered at
risk is viewed as more uncertain about his/her ability to use the four frames of the
Bolman and Deal survey or that their actual frame orientation differs based on the
decisions they are called to make in their different schools. The kinds of decisions a
principal faces in a school making adequate progress perhaps allow him or her to be
more concerned with being an instructional leader while the principal of a school at
82
risk may have to spend considerably more of his or her time and energy on trying to
help the students, teachers, and parents meet the expected goals of the state program.
Recommendations
The researcher recommends that a similar study be conducted in another urban,
suburban, or rural area and that the numbers of principals, supervisors, and School
Improvement Team members be significantly increased.
The researcher recommends that measures other than state-mandated test
results be used to identify schools that are making adequate progress and schools that
are labeled at risk.
The researcher recommends that findings from this study and other studies of
the principal based on the Bolman and Deal survey be used in future professional
development programs for school principals.
The researcher recommends that a mixed study be done using quantitative and
qualitative measures that examine the complexities of principals' decision-making
styles in more depth.
83
Appendix A
Leadership Orientations (Self and Other) Surveys

84
Form S-4 Code______________________
LEADERSHIP ORIENTATIONS (SELF)1
This questionnaire asks you to describe your leadership and management style.
1. Behaviors
You are asked to indicate how often each of the items below is true of you.Please use the following scale in answering each item.
A B C D ENever Occasionally Sometimes Often Always
Following this example, you would answer "A" for an item that is never true ofyou, "B" for one that is occasionally true, "C" for one that is sometimes true of you,and so on. Please use the attached Scantron sheet to record your answers.
Be discriminating! Your results will be more helpful if you think about eachitem and distinguish the things that you really do all the time from the things that youdo seldom or never.
A B C D E
1. Think very clearly and logically.
2. Show high levels of support and concern forothers.
3. Have exceptional ability to mobilize people andresources to get things done.
4. Inspire others to do their best.
5. Strongly emphasize careful planning and cleartime lines.
6. Build trust through open and collaborativerelationships.
7. Am a very skillful and shrewd negotiator.
8. Am highly charismatic.
9. Approach problems through logical analysis andcareful thinking.
10. Show high sensitivity and concern for others'needs and feelings.
11990, Lee G. Bolman and Terrence E. Deal
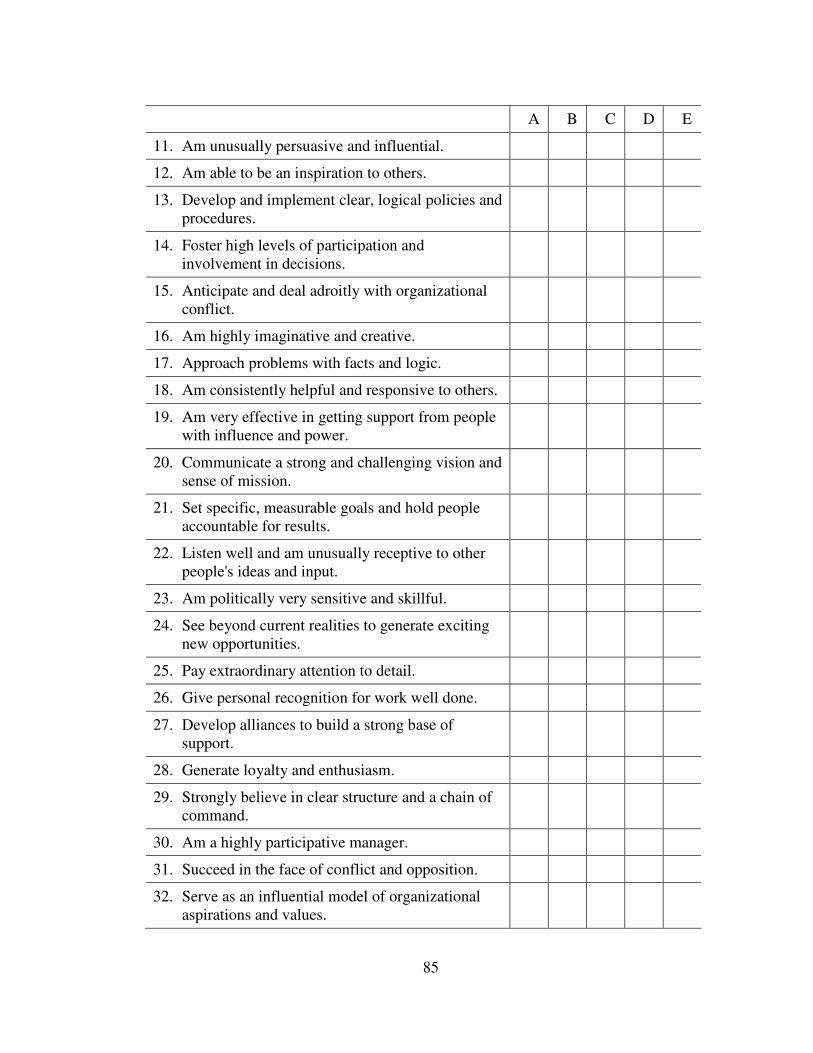
85
A B C D E
11. Am unusually persuasive and influential.
12. Am able to be an inspiration to others.
13. Develop and implement clear, logical policies andprocedures.
14. Foster high levels of participation andinvolvement in decisions.
15. Anticipate and deal adroitly with organizationalconflict.
16. Am highly imaginative and creative.
17. Approach problems with facts and logic.
18. Am consistently helpful and responsive to others.
19. Am very effective in getting support from peoplewith influence and power.
20. Communicate a strong and challenging vision andsense of mission.
21. Set specific, measurable goals and hold peopleaccountable for results.
22. Listen well and am unusually receptive to otherpeople's ideas and input.
23. Am politically very sensitive and skillful.
24. See beyond current realities to generate excitingnew opportunities.
25. Pay extraordinary attention to detail.
26. Give personal recognition for work well done.
27. Develop alliances to build a strong base ofsupport.
28. Generate loyalty and enthusiasm.
29. Strongly believe in clear structure and a chain ofcommand.
30. Am a highly participative manager.
31. Succeed in the face of conflict and opposition.
32. Serve as an influential model of organizationalaspirations and values.
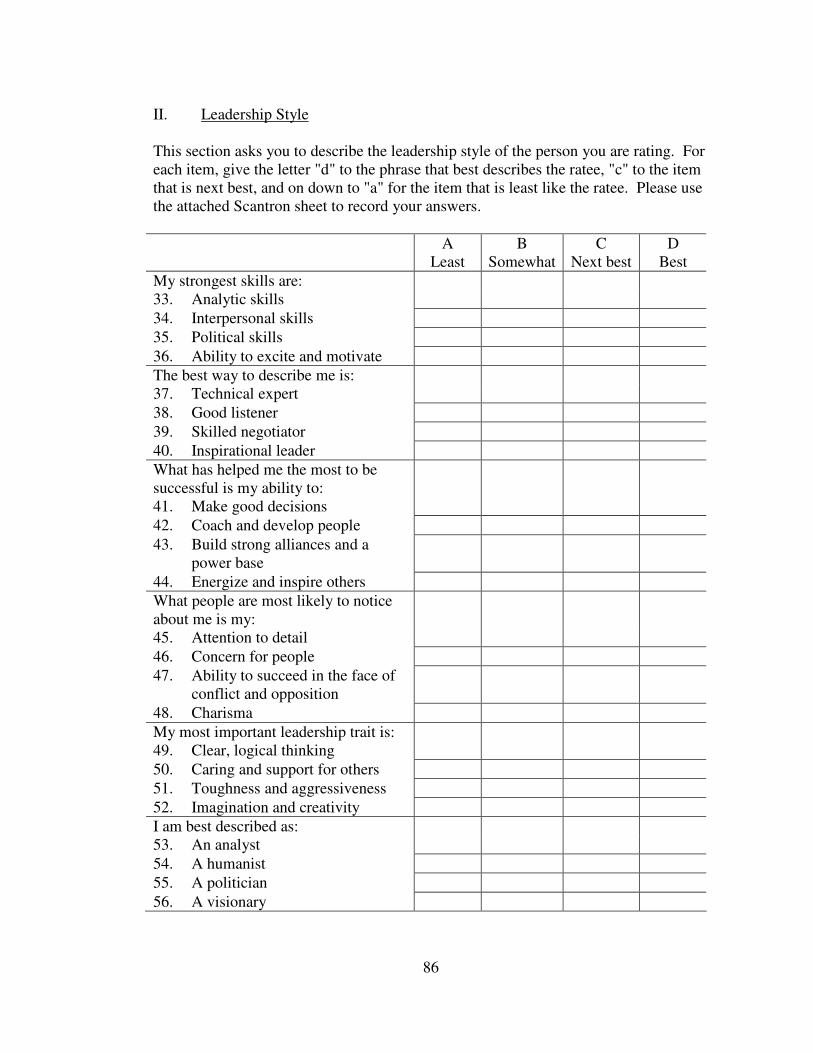
86
II. Leadership Style
This section asks you to describe the leadership style of the person you are rating. Foreach item, give the letter "d" to the phrase that best describes the ratee, "c" to the itemthat is next best, and on down to "a" for the item that is least like the ratee. Please usethe attached Scantron sheet to record your answers.
ALeast
BSomewhat
CNext best
DBest
My strongest skills are:33. Analytic skills34. Interpersonal skills35. Political skills36. Ability to excite and motivateThe best way to describe me is:37. Technical expert38. Good listener39. Skilled negotiator40. Inspirational leaderWhat has helped me the most to besuccessful is my ability to:41. Make good decisions42. Coach and develop people43. Build strong alliances and a
power base44. Energize and inspire othersWhat people are most likely to noticeabout me is my:45. Attention to detail46. Concern for people47. Ability to succeed in the face of
conflict and opposition48. CharismaMy most important leadership trait is:49. Clear, logical thinking50. Caring and support for others51. Toughness and aggressiveness52. Imagination and creativityI am best described as:53. An analyst54. A humanist55. A politician56. A visionary
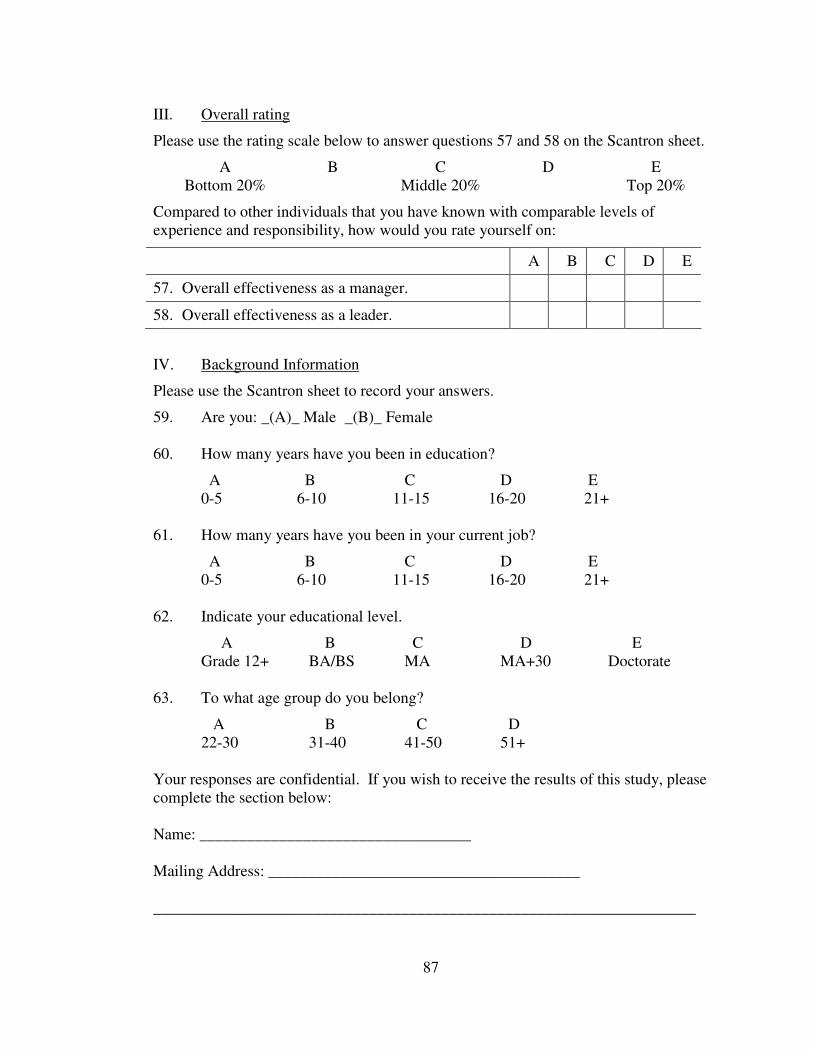
87
III. Overall rating
Please use the rating scale below to answer questions 57 and 58 on the Scantron sheet.
A B C D EBottom 20% Middle 20% Top 20%
Compared to other individuals that you have known with comparable levels ofexperience and responsibility, how would you rate yourself on:
A B C D E
57. Overall effectiveness as a manager.
58. Overall effectiveness as a leader.
IV. Background Information
Please use the Scantron sheet to record your answers.
59. Are you: _(A)_ Male _(B)_ Female
60. How many years have you been in education?
A B C D E0-5 6-10 11-15 16-20 21+
61. How many years have you been in your current job?
A B C D E0-5 6-10 11-15 16-20 21+
62. Indicate your educational level.
A B C D EGrade 12+ BA/BS MA MA+30 Doctorate
63. To what age group do you belong?
A B C D22-30 31-40 41-50 51+
Your responses are confidential. If you wish to receive the results of this study, pleasecomplete the section below:
Name: __________________________________
Mailing Address: _______________________________________
____________________________________________________________________
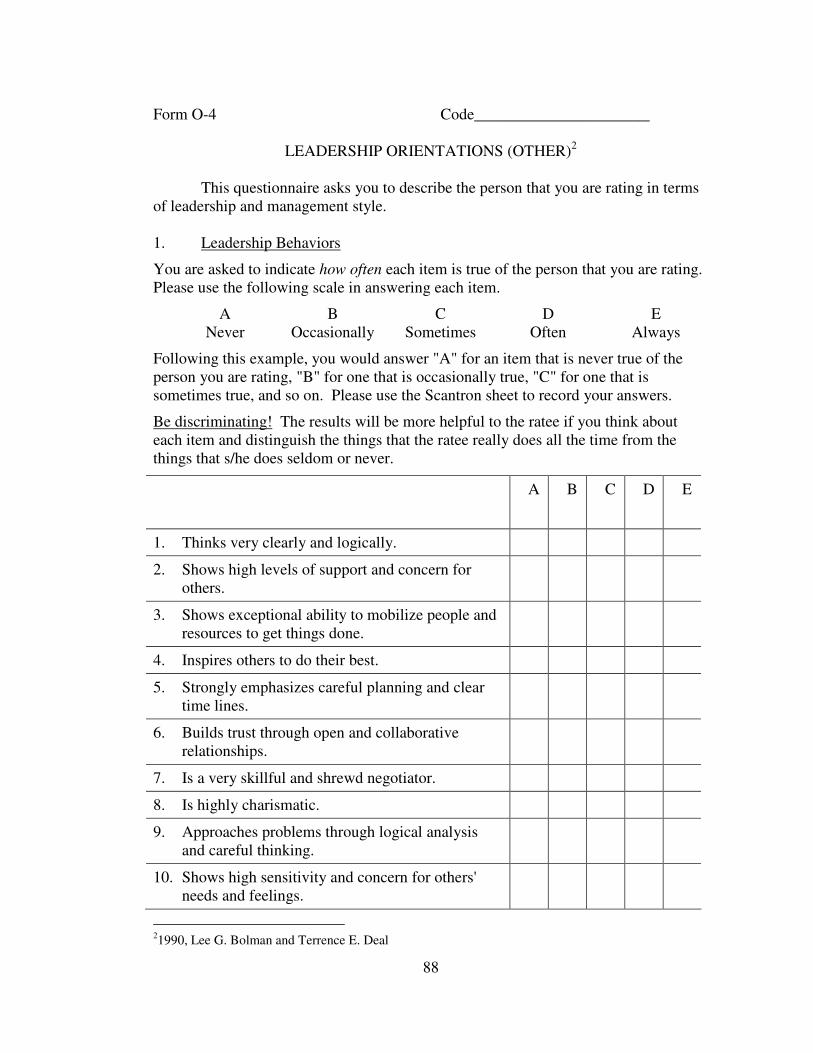
88
Form O-4 Code______________________
LEADERSHIP ORIENTATIONS (OTHER)2
This questionnaire asks you to describe the person that you are rating in termsof leadership and management style.
1. Leadership Behaviors
You are asked to indicate how often each item is true of the person that you are rating.Please use the following scale in answering each item.
A B C D ENever Occasionally Sometimes Often Always
Following this example, you would answer "A" for an item that is never true of theperson you are rating, "B" for one that is occasionally true, "C" for one that issometimes true, and so on. Please use the Scantron sheet to record your answers.
Be discriminating! The results will be more helpful to the ratee if you think abouteach item and distinguish the things that the ratee really does all the time from thethings that s/he does seldom or never.
A B C D E
1. Thinks very clearly and logically.
2. Shows high levels of support and concern forothers.
3. Shows exceptional ability to mobilize people andresources to get things done.
4. Inspires others to do their best.
5. Strongly emphasizes careful planning and cleartime lines.
6. Builds trust through open and collaborativerelationships.
7. Is a very skillful and shrewd negotiator.
8. Is highly charismatic.
9. Approaches problems through logical analysisand careful thinking.
10. Shows high sensitivity and concern for others'needs and feelings.
21990, Lee G. Bolman and Terrence E. Deal
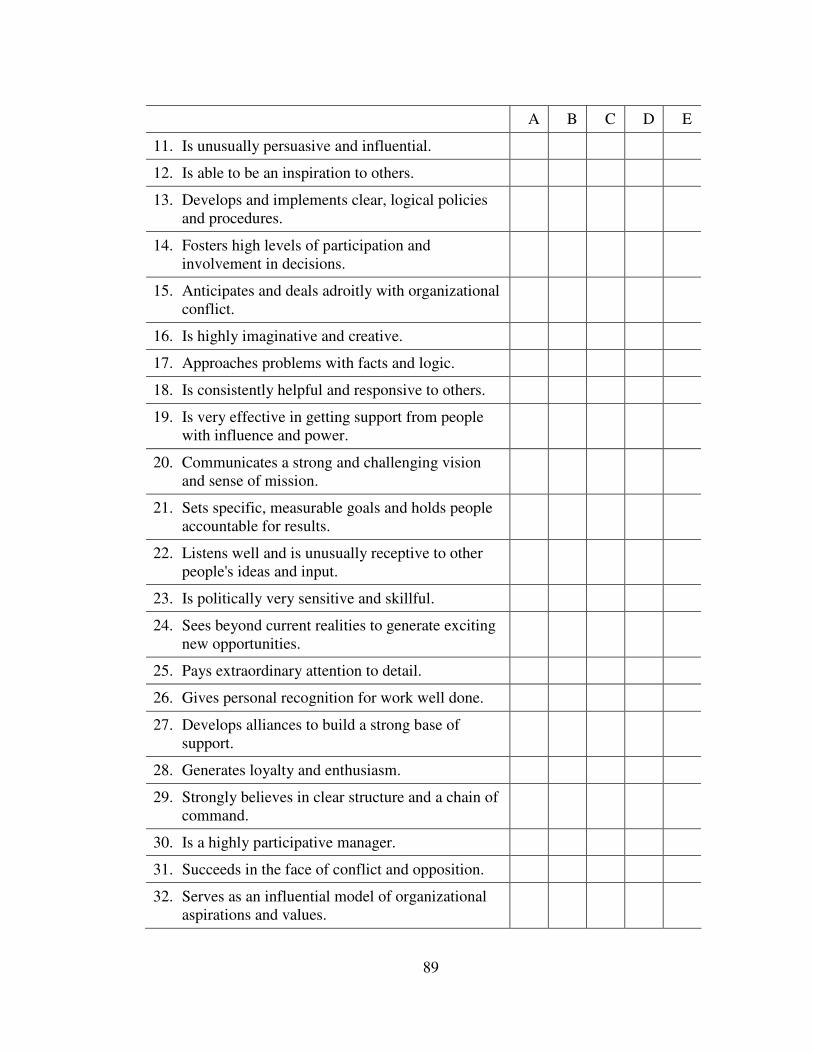
89
A B C D E
11. Is unusually persuasive and influential.
12. Is able to be an inspiration to others.
13. Develops and implements clear, logical policiesand procedures.
14. Fosters high levels of participation andinvolvement in decisions.
15. Anticipates and deals adroitly with organizationalconflict.
16. Is highly imaginative and creative.
17. Approaches problems with facts and logic.
18. Is consistently helpful and responsive to others.
19. Is very effective in getting support from peoplewith influence and power.
20. Communicates a strong and challenging visionand sense of mission.
21. Sets specific, measurable goals and holds peopleaccountable for results.
22. Listens well and is unusually receptive to otherpeople's ideas and input.
23. Is politically very sensitive and skillful.
24. Sees beyond current realities to generate excitingnew opportunities.
25. Pays extraordinary attention to detail.
26. Gives personal recognition for work well done.
27. Develops alliances to build a strong base ofsupport.
28. Generates loyalty and enthusiasm.
29. Strongly believes in clear structure and a chain ofcommand.
30. Is a highly participative manager.
31. Succeeds in the face of conflict and opposition.
32. Serves as an influential model of organizationalaspirations and values.
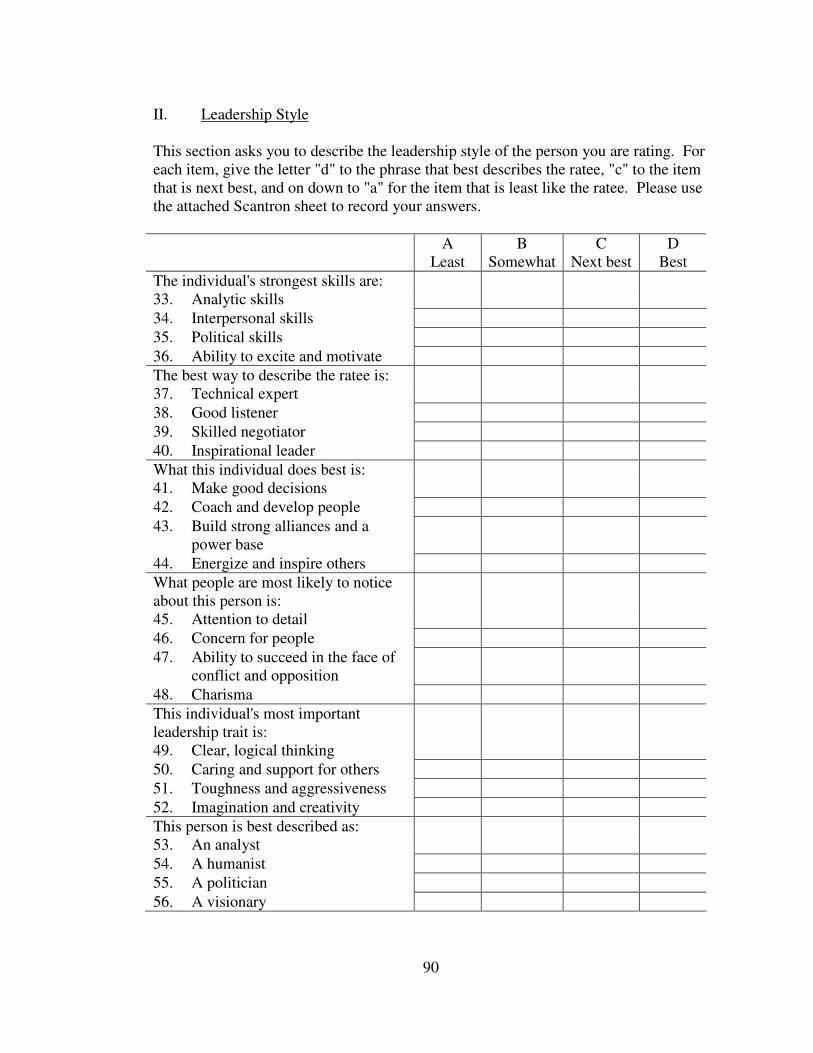
90
II. Leadership Style
This section asks you to describe the leadership style of the person you are rating. Foreach item, give the letter "d" to the phrase that best describes the ratee, "c" to the itemthat is next best, and on down to "a" for the item that is least like the ratee. Please usethe attached Scantron sheet to record your answers.
ALeast
BSomewhat
CNext best
DBest
The individual's strongest skills are:33. Analytic skills34. Interpersonal skills35. Political skills36. Ability to excite and motivateThe best way to describe the ratee is:37. Technical expert38. Good listener39. Skilled negotiator40. Inspirational leaderWhat this individual does best is:41. Make good decisions42. Coach and develop people43. Build strong alliances and a
power base44. Energize and inspire othersWhat people are most likely to noticeabout this person is:45. Attention to detail46. Concern for people47. Ability to succeed in the face of
conflict and opposition48. CharismaThis individual's most importantleadership trait is:49. Clear, logical thinking50. Caring and support for others51. Toughness and aggressiveness52. Imagination and creativityThis person is best described as:53. An analyst54. A humanist55. A politician56. A visionary
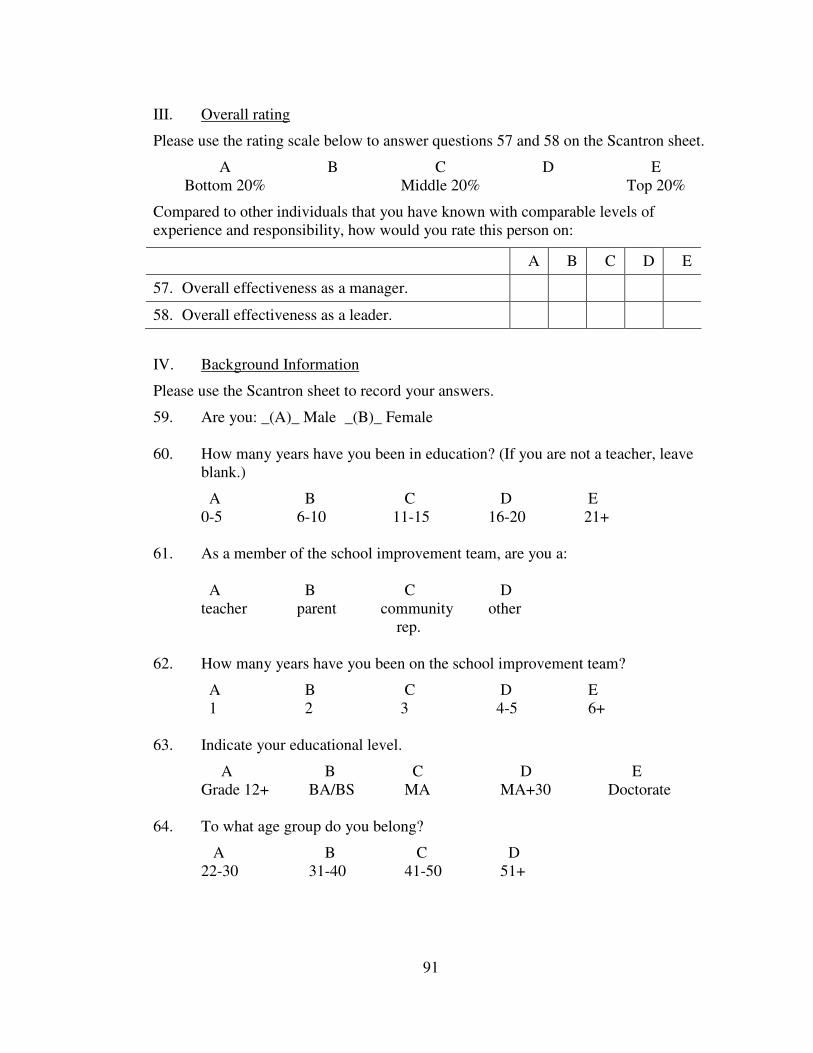
91
III. Overall rating
Please use the rating scale below to answer questions 57 and 58 on the Scantron sheet.
A B C D EBottom 20% Middle 20% Top 20%
Compared to other individuals that you have known with comparable levels ofexperience and responsibility, how would you rate this person on:
A B C D E
57. Overall effectiveness as a manager.
58. Overall effectiveness as a leader.
IV. Background Information
Please use the Scantron sheet to record your answers.
59. Are you: _(A)_ Male _(B)_ Female
60. How many years have you been in education? (If you are not a teacher, leaveblank.)
A B C D E0-5 6-10 11-15 16-20 21+
61. As a member of the school improvement team, are you a:
A B C Dteacher parent community other
rep.
62. How many years have you been on the school improvement team?
A B C D E1 2 3 4-5 6+
63. Indicate your educational level.
A B C D EGrade 12+ BA/BS MA MA+30 Doctorate
64. To what age group do you belong?
A B C D22-30 31-40 41-50 51+
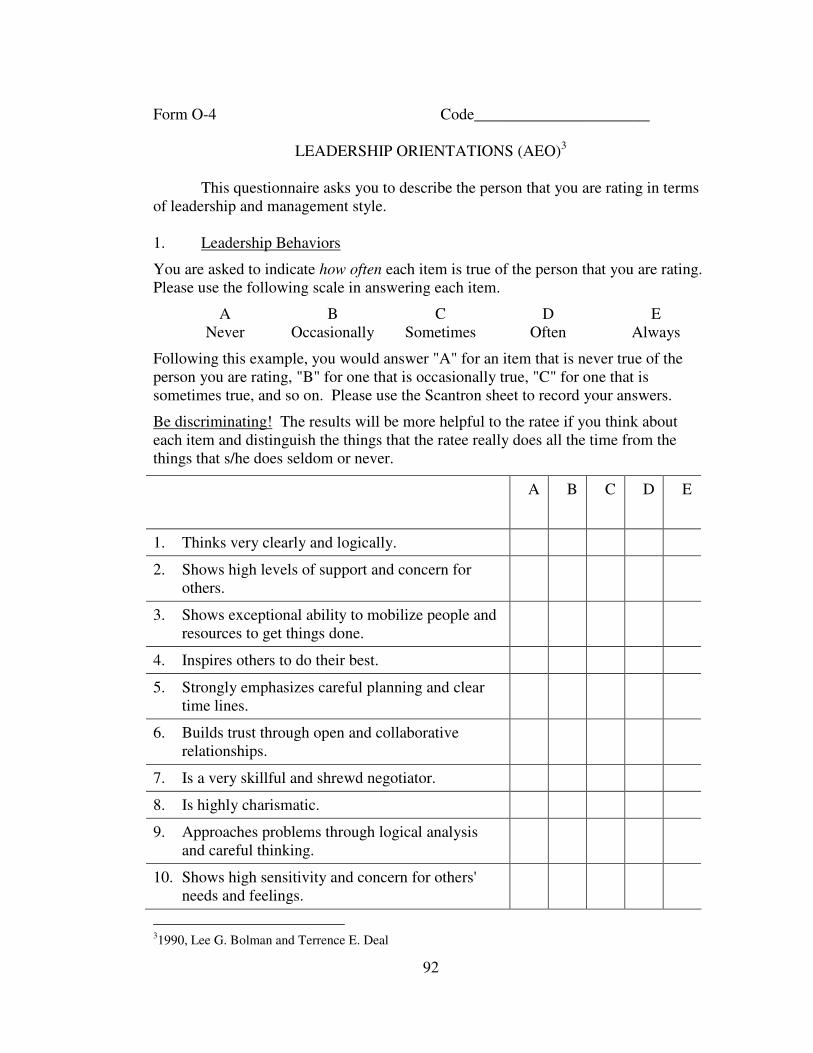
92
Form O-4 Code______________________
LEADERSHIP ORIENTATIONS (AEO)3
This questionnaire asks you to describe the person that you are rating in termsof leadership and management style.
1. Leadership Behaviors
You are asked to indicate how often each item is true of the person that you are rating.Please use the following scale in answering each item.
A B C D ENever Occasionally Sometimes Often Always
Following this example, you would answer "A" for an item that is never true of theperson you are rating, "B" for one that is occasionally true, "C" for one that issometimes true, and so on. Please use the Scantron sheet to record your answers.
Be discriminating! The results will be more helpful to the ratee if you think abouteach item and distinguish the things that the ratee really does all the time from thethings that s/he does seldom or never.
A B C D E
1. Thinks very clearly and logically.
2. Shows high levels of support and concern forothers.
3. Shows exceptional ability to mobilize people andresources to get things done.
4. Inspires others to do their best.
5. Strongly emphasizes careful planning and cleartime lines.
6. Builds trust through open and collaborativerelationships.
7. Is a very skillful and shrewd negotiator.
8. Is highly charismatic.
9. Approaches problems through logical analysisand careful thinking.
10. Shows high sensitivity and concern for others'needs and feelings.
31990, Lee G. Bolman and Terrence E. Deal
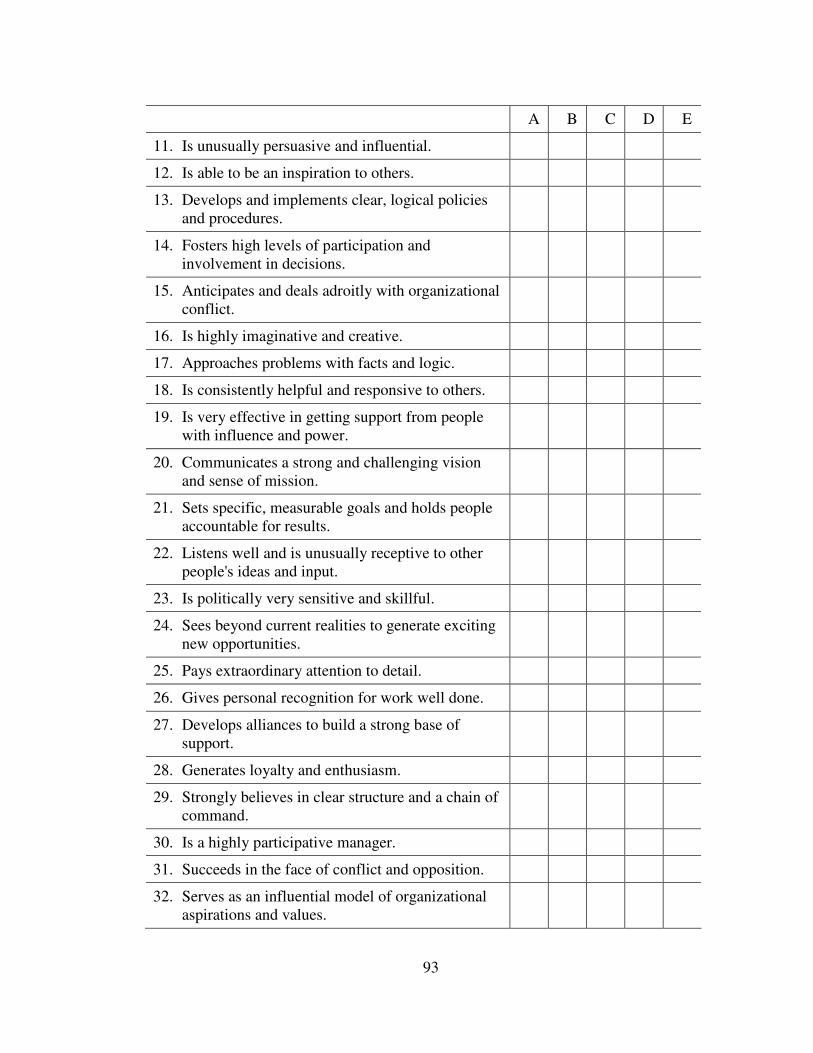
93
A B C D E
11. Is unusually persuasive and influential.
12. Is able to be an inspiration to others.
13. Develops and implements clear, logical policiesand procedures.
14. Fosters high levels of participation andinvolvement in decisions.
15. Anticipates and deals adroitly with organizationalconflict.
16. Is highly imaginative and creative.
17. Approaches problems with facts and logic.
18. Is consistently helpful and responsive to others.
19. Is very effective in getting support from peoplewith influence and power.
20. Communicates a strong and challenging visionand sense of mission.
21. Sets specific, measurable goals and holds peopleaccountable for results.
22. Listens well and is unusually receptive to otherpeople's ideas and input.
23. Is politically very sensitive and skillful.
24. Sees beyond current realities to generate excitingnew opportunities.
25. Pays extraordinary attention to detail.
26. Gives personal recognition for work well done.
27. Develops alliances to build a strong base ofsupport.
28. Generates loyalty and enthusiasm.
29. Strongly believes in clear structure and a chain ofcommand.
30. Is a highly participative manager.
31. Succeeds in the face of conflict and opposition.
32. Serves as an influential model of organizationalaspirations and values.
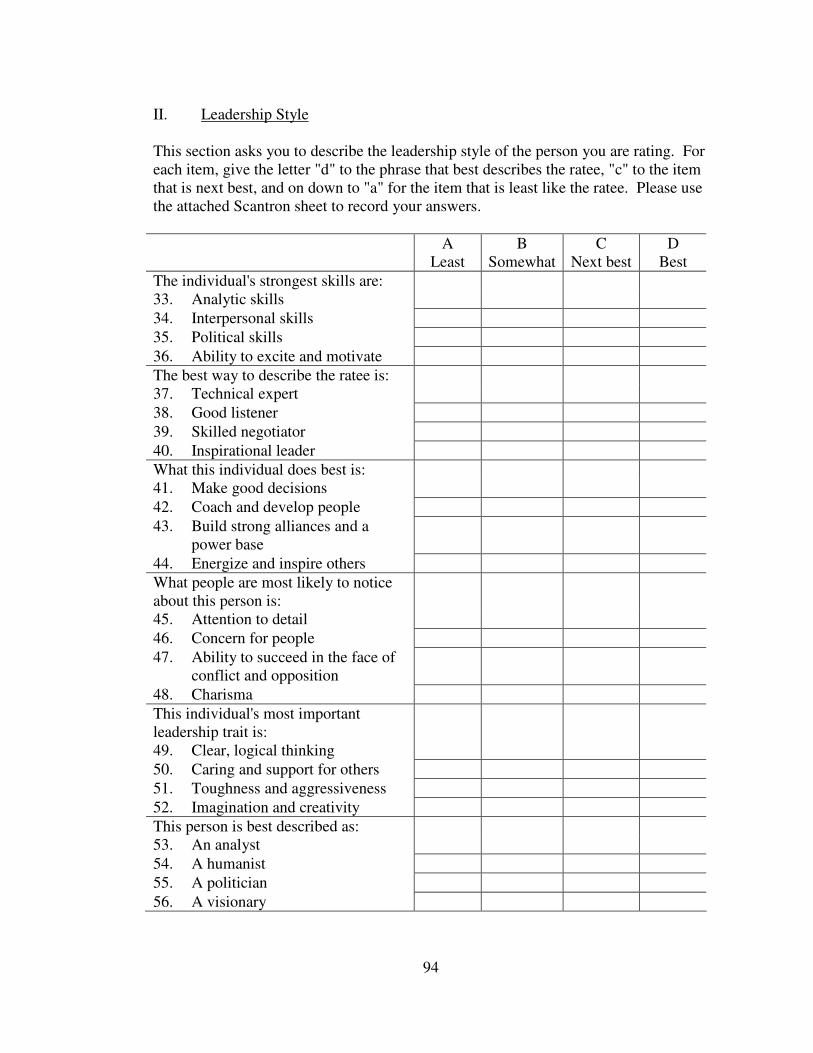
94
II. Leadership Style
This section asks you to describe the leadership style of the person you are rating. Foreach item, give the letter "d" to the phrase that best describes the ratee, "c" to the itemthat is next best, and on down to "a" for the item that is least like the ratee. Please usethe attached Scantron sheet to record your answers.
ALeast
BSomewhat
CNext best
DBest
The individual's strongest skills are:33. Analytic skills34. Interpersonal skills35. Political skills36. Ability to excite and motivateThe best way to describe the ratee is:37. Technical expert38. Good listener39. Skilled negotiator40. Inspirational leaderWhat this individual does best is:41. Make good decisions42. Coach and develop people43. Build strong alliances and a
power base44. Energize and inspire othersWhat people are most likely to noticeabout this person is:45. Attention to detail46. Concern for people47. Ability to succeed in the face of
conflict and opposition48. CharismaThis individual's most importantleadership trait is:49. Clear, logical thinking50. Caring and support for others51. Toughness and aggressiveness52. Imagination and creativityThis person is best described as:53. An analyst54. A humanist55. A politician56. A visionary
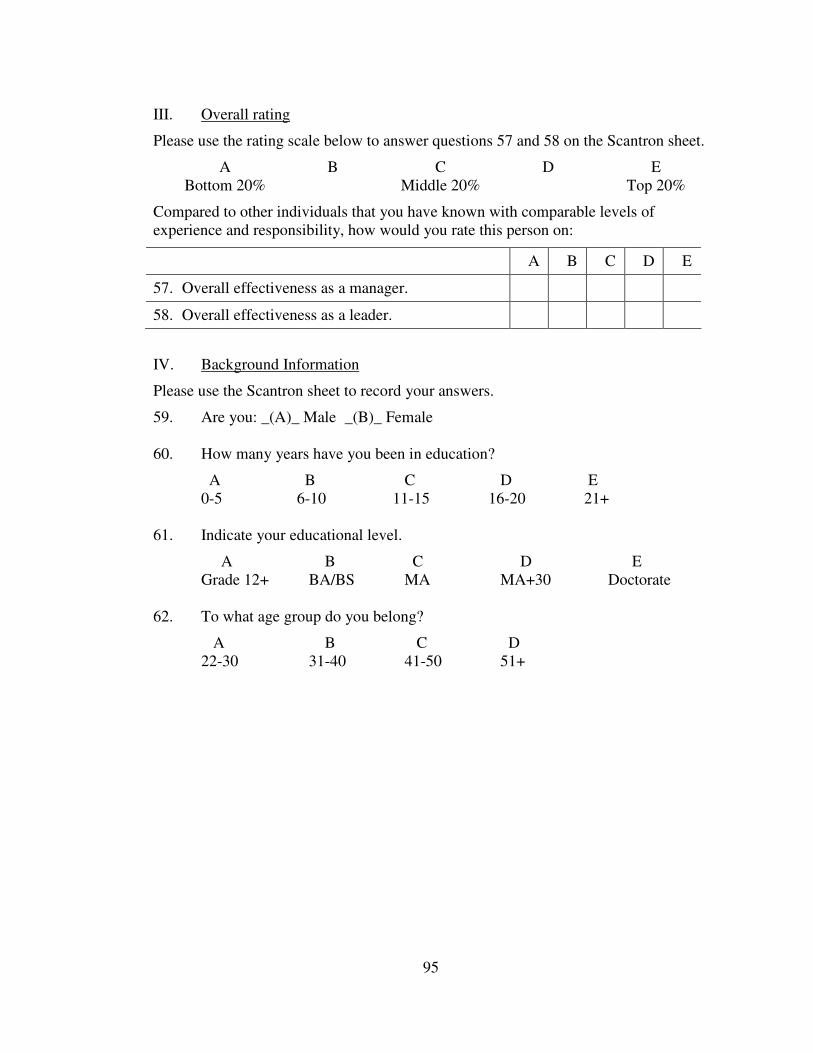
95
III. Overall rating
Please use the rating scale below to answer questions 57 and 58 on the Scantron sheet.
A B C D EBottom 20% Middle 20% Top 20%
Compared to other individuals that you have known with comparable levels ofexperience and responsibility, how would you rate this person on:
A B C D E
57. Overall effectiveness as a manager.
58. Overall effectiveness as a leader.
IV. Background Information
Please use the Scantron sheet to record your answers.
59. Are you: _(A)_ Male _(B)_ Female
60. How many years have you been in education?
A B C D E0-5 6-10 11-15 16-20 21+
61. Indicate your educational level.
A B C D EGrade 12+ BA/BS MA MA+30 Doctorate
62. To what age group do you belong?
A B C D22-30 31-40 41-50 51+
96
Reference List
American Association of Colleges for Teacher Education. (2002,February).Governmental relations update. Washington, DC: AACTE.
Andrews, R.,& Soder, R. (1987). Principal instructional leadership and schoolachievement. Educational Leadership, 44, 9-11.
Anyon, J. (1997). Ghetto schooling: A political economy of urban educational reform.New York: Teachers College Press.
Austin, G. (1979). Exemplary schools and the search for excellence. EducationalLeadership, 37, 10-14.
Austin, G. (1985). Research on exemplary schools. New York: Academic Press.
Ball, S. (1987). The micropolitics of schools. Lewes: Falmer Press.
Baltimore Sun, June 30, 2005, p. B2.
Barker, J. A. (1990). The power of vision: Discussion guide. Burnsville, MN:Charterhouse Learning Corporation.
Barker, J. A. (1992). Future edge. New York: William Morrow and Company.
Barker, J. A. (1997). How can we train leaders if we do not know what leadership is?Human Relations Journal, 50(4), 343-362.
Barr, R., & Bizar, M. (Eds.) (2001). School leadership in times of urban reform.Erlbaum Associates, Inc. New Jersey.
Barth, R. (1990). Improving schools from within. San Francisco: Jossey-Bass..
Beach, D. M., & Reinhartz, J. (2000). Supervisory leadership: focus on instruction.Boston: Allyn & Bacon.
Bell, J. A. (2001). High-performing, high-poverty schools. Leadership 31(1), 8-11.
Bennis, W. G., & Nanus, B., (1985). Leaders: Strategies for taking charge. NewYork: HarperCollins.
Bensimon, E. M. (1989). The meaning of good presidential leadership: A frameanalysis. Review of Higher Education, 12, 107-123.
97
Bensimon, E. M. (1990). Viewing the presidency: Perceptual congruence betweenpresidents and leaders on their campuses. Leadership Quarterly, 1, 71-90.
Berman, P., & Gjelten, T. (1984). Improving school improvement: A policyevaluation of the California school improvement program. Berkeley, CA:Berman, Weiler Associates.
Berman, P., & McLaughlin, M. (1975). Federal programs supporting educationalchange, Vol. IV: The findings in review. Santa Monica, CA.: The RandCorporation.
Birnbaum, R. (1992). How academic leadership works: Understanding success andfailure in the college presidency. San Francisco: Jossey-Bass.
Blake, P., & Pfeiffer, S. (1993). School business partnerships. NAASP Bulletin, 77,pp. 29-33.
Blanchard, K., Hybels, B., & Hodges, P. (1999). Leadership by the book. New York:William Morrow.
Blasé, J. (1991). The politics of life in schools. Newbury Park, CA: Sage.
Bloom, B. S. (1984). The search for methods of group instruction as effective as one-on-one training. Educational Leadership, 41.
Bloom, B. S., Forst, E. J., Hill, W. H., & Krathwohl, D. R. (1956). Taxonomy ofeducational objectives: Cognitive domain. New York: David McKay.
Blumberg, A. (1989). Administration as a craft. Boston: Allyn and Bacon.
Bolman, L. G., & Deal, T. E. (1977). Reframing organizations. San Francisco:Jossey-Bass.
Bolman, L. G., & Deal, T. E. (1984). Modern approaches to understanding andmanaging organizations. San Francisco: Jossey-Bass.
Bolman, L. G., & Deal, T. E. (1991). Leadership and management effectiveness: Amulti-frame, multi-sector analysis. Human Resources Management, 30, 509-534.
Bolman, L. G., & Deal, T. E., (l992a). Leading and managing: Effects of context,culture, and gender. Education Administration Quarterly, 28, 314-329.

98
Bolman, L. G., & Deal, T. E. (1992b). Reframing leadership: The effects of leaders'images of leadership. In K. E. Clark, M. B. Clark, & D. Campbell (Eds.),Impact of leadership. Greensboro, NC: Center for Creative Leadership.
Bolman, L. G., & Deal, T. E. (1994). Looking for leadership: Another search party'sreport. Educational Administration Quarterly, 30(1), 77-96.
Bolman, L. G., & Deal, T. E. (1995). Leading with soul: An uncommon journey ofspirit. San Francisco: Jossey-Bass.
Bolman, L. G., & Deal, T. E. (1997). Reframing organizations: Artistry, choice, andleadership. San Francisco: Jossey-Bass.
Bossert, S. T., Dwyer, D. C., Rowan, B., & Lee, G. V. (1982). The instructionalmanagement role of the principal. Educational Administration Quarterly,18(3), 34-64.
Bowles, B. D. (1990). The silent crisis in educational leadership. The EducationDigest, 5, 12-14.
Boyan, N. J. (1988). Describing and explaining administrative behavior, In N. J.Boyan (Ed.), Handbook of research on educational administration. New York:Longman.
Brookover, W. B. (1977). Creating effective schools. Holmes Beach, FL: LearningPublications, Inc.
Bryk, A. S., & Hermanson, K. L. (1993). Educational indicator systems: Observationson their structure, interpretation, and use. Review of Research in Education,19, 451-484.
Bryk, A., Sebring, P., Kerbow, D., Rollow, S., & Easton, J. (1998). Charting Chicagoschool reform. Boulder, CO. Westview Press.
Cashman, K. (2000). Leadership from the inside out. Provo, UT: ExecutiveExcellence Publishing.
Cheng, Y.C. (1994). Principal's leadership as a critical factor for school performance:Evidence from multi-levels of primary schools. School Effectiveness andSchool Improvement, 5, 299-317.
Christensen, G. (1993). The changing role of the principal in the move from atraditional school to an accelerated school. CERAS: Stanford, CA.
99
Clark, D. L., et al., (1982). Factors associated with success in urban schools. PhiDelta Kappan, .467-470.
Clark, D. L., & Astuto, T. (1995). Activators and impediments to learner centeredschools. Theory into Practice, 34(4), 244-249.
Clune, W. (1993). The best path to systemic educational policy: Standard/centralizedor differential/decentralized? Educational Evaluation & Policy Analysis, 15(3),233-254.
Cohen, M., et al. (1972). Instructionally effective schools: Research area plan.Washington, DC: National Institute of Education. (ERIC DocumentReproduction Service No. ED 210 801).
Comer, J. P., Ben-Avie, M., Haynes, N. M., & Joyner, E. T. (1999). Child by child:The Comer process for change in education. New York: Teachers CollegePress.
Comer, J. (1989). Child development and education. Journal of Negro Education, 5,125-143.
Connell, N. (1999). Beating the odds: High-achieving elementary schools in highpoverty neighborhoods. New York: Educational Priorities Panel. (ERICDocument Reproduction Service No. ED 441 913.
Crowson, R. L., McPherson, R. B., & Pitner, N. J.. (1986). Managing uncertainty:Administrative theory and practice in education. Columbus, OH: Merrill.
Cuban, L. (1976). Urban school chiefs under fire. Chicago: University of ChicagoPress.
Cuban, L. (1988). Effective schools: A friendly but cautionary note. Phi DeltaKappan, 64, 695-696.
Cuban, L. (1990). Reforming again, again, and again. Educational Researcher, 19(1),3-13.
Danielson, M. L. (2001). How principals perceive and respond to a high-stakesaccountability measure. Ann Arbor, MI: UMI Dissertation Services.
Darling-Hammond, L. (1991). Policy uses and indicators. Paper prepared for theOrganization for Economic Cooperation and Development.
Davenport, R., & Anderson, G. (2002). Closing the achievement gap: No excuses.Houston, Texas: American Productivity & Quality Center.

100
Day, C. et al. (2000). Leading schools in times of change. Buckingham, England.Open University Press.
Deal, T. E., & Peterson, K. D. (1999). Shaping school cultures: The heart ofleadership. San Francisco: Jossey-Bass.
DeBevoise, W. (1984). Synthesis of research on the principal as instructional leader.Educational Leadership, 14-20.
Drake, T. L., & Roe, W. H. (1999). The principalship. New Jersey: Prentice Hall.
Druin, G., & Butler, J. A. (1987). Effective school practices and at-risk youth: Whatresearch shows. Office of Educational Research and Improvement (OERI),U.S. Department of Education.
Drury, D. W. (1999). Reinventing school-based management. Alexandria, VA.National School Board Association.
Dufour, R. & Eaker, R. (1998). Professional learning communities at work: Bestpractices for enhancing student achievement. Bloomington, IN: NationalEducational Service. (ERIC Reproduction Service No. ED426 472)
Duke, D. L. (1988). Why principals consider quitting. Phi Delta Kappan, 70(4), 308-313.
Dunford, R., & Palmer, I. (1995). Reframing and organizational action: Theunexplored link. Journal of Organizational Change Management, 9(6), 12-25.
Dunlap, W. H., et al. (1991). The goal is control. Agenda, 14, pp. 24-26.
Dunlap, D. M., & Goldman, P. (1991). Rethinking power in schools. EducationalAdministration Quarterly, 27(1), 5-29.
Dwyer, D. C., Lee, G. V., Rowan, B., & Bossert, S. (1983). Five principals in action:Perspectives on instructional management. Far West Laboratory: SanFrancisco.
Dwyer, D. C., Lee, G. V., Rowan, B., & Bossert, S. (1984). The principal's role ininstructional management: Five participant observation studies of principals inaction. Paper prepared for the American Educational Research Association,Montreal. Far West Laboratory, Instructional Management Program.
Edmonds, R. (1966). Revolutionary and evolutionary: The effective schoolsmovement. Effective Schools Products, Ltd.

101
Edmonds, R. (1979). Effective schools for the urban poor. A discussion of theliterature and issues related to effective schooling. (ERIC ED 170 394).
Edmonds, R. (1982). Programs of school improvement: An overview. EducationalLeadership, 40, 4-11.
Edmonds, R. (1986). Characteristics of effective schools. In U. Neiser (Ed.), Theschool achievement of minority children. Hillsdale, NJ: Erlbaum; pp.89-111.
Education Commission of the States. (1983). Action for excellence: A comprehensiveplan to improve our nation's schools. Denver, CO: Author.
Educational Research Service (1982). The role of elementary school principals: asummary of research. Arlington, VA: Author.
Edwards, J. D. (1998). Toward democracy: A case study of high involvement in oneelementary school. Unpublished doctoral dissertation, Virginia PolytechnicInstitute and State University.
Elmore, R. (2000). Building a new structure for school leadership. Washington, DC:The Albert Shaker Institute.
Elmore, R., & Sykes, G. (1992). Curriculum Policy. Handbook of research oncurriculum. New York: Macmillan Publishing Company.
Fears, A. A. (2004). A study of school-based leadership and the school improvementprocess for elementary schools that have demonstrated high and low studentachievement. Unpublished doctoral dissertation, Union Institute andUniversity Graduate School.
Finn, C. E., & Petrilli, M. J. (2000, January). The state of state standards.Washington, DC: Thomas B. Fordham Foundation.
Fleming, N. J. B. (2002). A study of principal and teacher judgments of principalleadership orientations. Unpublished doctoral dissertation, University ofMaryland, College Park.
Fullan, M. (1982). The meaning of educational change. New York: Teachers CollegePress.
Fullan, M. (1993). Change forces: Probing the depth of educational reform. NewYork: Falmer Press.
102
Fullan, M. (1998). The meaning of educational change: A quarter of a century oflearning. In A. Hargreaves et al. (eds.), International Handbook of EducationalChange. Dordrecht: Kluwer Academic Publishers. pp. 214-228.
Fullan, M. (1999a). Change forces: The sequel. Philadelphia: Falmer Press.
Fullan, M. (1999b). Learning from the past: Directions for the future. Alexandria,VA: Association for Supervision and Curriculum Development.
Fullan, M. (2001). The new meaning of educational change (3rd ed). TeachersCollege Press, Columbia University, N.Y.
Fullan, M. (2002). The change leader. Educational Leadership, 50(8), 15-20.
Fullan, M., Bennett, B., & Bennett, C. (1990). Linking classroom and schoolimprovement. Educational Leadership, 47, 13-19.
Fullan, M., & Stieglebauer, S. (1991). The new meaning of educational change (2nded.) New York: Teachers College Press, Columbia University.
Glaser, J. S. (1991). Feminism and professionalism in teaching and educationaladministration. Educational Administration Quarterly, 27, 321-342.
Glatthorn, A. A., & Newberg , N. A. (l984). A team approach to instructionalleadership. Educational Leadership, 60-63.
Glickman, C. D. (l990). Open accountability for the 90s: Between the pillars.Educational Leadership, 47(7), 38-42.
Gliner, J. A., & Morgan, G. A. (2000). Research methods in applied settings: Anintegrated approach to design and analysis. Mahwah, New Jersey: LawrenceErlbaum Associates, Publishers.
Goldring, E., & Greenfield, W. (2002). The educational leadership challenge:Redefining leadership for the 21st century. 101st Yearbook of the NationalSociety for the Study of Education. Chicago: University of Chicago Press.
Goldring, E., & Pasternak, R. (1994). Principals' coordinating strategies and schooleffectiveness. School Effectiveness and School Improvement, 5, 239-253.
Goodlad, J. L. (1955). The individual school principal: Key setting and key person.Educational Leadership, 13(1).
Goodlad, J. (1984). A place called school. New York: McGraw-Hill.

103
Green, R. L. (2001). Practicing the art of leadership. Upper Saddle River, NJ:Prentice-Hall.
Greenberg, R. A., & Baron, J. (1997). Behavior in organizations (6th ed.). UpperSaddle River, NJ: Prentice-Hall.
Greenberg, R. A., & Baron, J. (2000). Behavior in organizations (7th ed.). UpperSaddle River, NJ: Prentice-Hall.
Greenfield, W. (1987). Instructional leadership: Concepts, issues, and controversies.Boston: Allyn & Bacon. pp. 56-74.
Greenfield, W. D. (1991). Toward a theory of school leadership. Paper presented atthe annual meeting of the American Research Association, Chicago, IL.
Greenlee, B. J., & Bruner, D. Y. (2001). State assessment rediscovered: Canaccountability tests initiate better reading? Wingspan, 14(1), 2-5.
Griffiths, D. (1988). Administrative theory. In N. J. Boyan (Ed.), Handbook ofresearch on educational administration. New York: Longman.
Hall, G. E. (1979). The concerns-based approach for facilitating change. EducationalHorizons, 57, 203-209.
Hall, G. E. (1988). The principal as leader of the change facilitating team. Journal ofResearch and Development, 22(1).
Hall, D., Wiener, R., & Carey, K. (2003). What new AYP information tells us aboutschools, states, and public education. Washington, DC: The Education Trust.
Hallinger, P. (1985). Assessing the instructional management behavior of principals.Elementary School Journal, 86(2), 217-247.
Hallinger, P., & Heck, R. (1995). The principal's role in school effectiveness: Anassessment of methodological progress, 1980-1995. In K. Leithwood (Ed.)The International Handbook of Research on Educational Leadership andAdministration. New York: Kluwer Press.
Hallinger, P., & Heck, R. (1996). Reassessing the principal's role in schooleffectiveness: A view of empirical research, 1980-1995. EducationalAdministration Quarterly, 32, 5-44.
Hallinger, P., & Murphy, J. (1986). The social context of effective schools. AmericanJournal of Education, 94, 328-355.
104
Hallinger, P., Murphy, J., & Hausman, C. (1992). Restructuring schools: Principals'perceptions of fundamental education reform. Special Edition of EducationalAdministration Quarterly, 28(3), 330-349.
Hanson, J. M., & Smith, R. (1989). Building-based instructional improvement: Theprincipal as an instructional leader. NASSP Bulletin, 73(518), 10-16.
Harrington-Lueker, D. (1990). The engine of reform gathers steam: Kentucky startsfrom scratch. American School Board Journal, 177(9), 17-21.
Heimovics, R. D., Herman, R. D., & Jurkiewicz-Coughlin, C. L. (1993) Executiveleadership and resource dependence in nonprofit organizations: A frameanalysis. Public Administration Review, 53, 419-427.
Heimovics, R. D., Herman, R. D., & Jurkiewicz-Coughlin, C. L. (1995). The politicaldimension of effective nonprofit executive leadership: Nonprofit managementand leadership. Public Administration Review, 5, 233-248.
Hill, P. T., & Bonan, J. (1991). Decentralization and accountability in publiceducation. Santa Monica, CA: RAND.
Hogan, R., Curphy, G. J., & Hogan, J. (1999). What we know about leadership:Effectiveness and personality. In L. Orozco (Ed.), Educational Leadership.Bellvue, WA: Coursewise.
Holcomb, E. L. (2001). Asking the right questions: Techniques for collaboration andschool changes (2nd ed.). Thousand Oaks, CA: Corwin Press.
Hoo-Ballade, M. (2004). Principal leadership and effective schooling for ESLstudents. The George Washington University, Washington, DC.
Hord, S., et al. (1998). Taking charge of change. Austin, Texas: SouthwestEducational Development Laboratory.
Hoyle, E. (1982). The micropolitics of educational administration. EducationalManagement and Administration, 10(2), 87-98.
Hughes, L. W. (1999). The principal as leader. New York: Macmillan.
Hughes, L. W. (2004). The principal as leader (2d ed.). Upper Saddle River, NJ.:Merrill, Prentice-Hall.
Jantzi, D., & Leithwood, K. (1993). Toward an explanation of variation in teacherperceptions of transformational leadership. Educational AdministrationQuarterly, 32, 512- 538.
105
Katz, D., & Kahn, R. L. (1966). The social psychology of organizations. New York:Wiley.
Kelley, C. & Protsik, J. (1997). Risk and reward: Perspectives on the implementationof Kentucky's school-based performance award program. EducationalAdministration Quarterly, 33, 474-505.
Kline, W. A. (1987). A collegial approach to developing leadership. EducationalLeadership, pp. 70-71.
Knapp, M. (1997). Between systemic reforms and the mathematics and scienceclassroom: The dynamics of innovation implementation and professionallearning. Review of Educational Research, 67(2), 227-266.
Knapp, M. et al. (1998). Converging reforms and the working lives of frontlineprofessionals in schools. Educational Policy, 12(4), 397-418.
Kopple, H. (1985). Replicating success: School district of Philadelphia. Paperpresented at the annual meeting of the American Educational ResearchAssociation, Chicago, IL.
Kuch, W. T. (1983). The role of the elementary school principal as building managerand instructional leader. (Doctoral dissertation, University of Pittsburgh).Dissertation Abstracts International, 442 353-A.
Ladd, H. F., & Walsh, R. P. (2002). Implementing value added measures of schooleffectiveness: Getting the incentives right. Economics of Education Review21, 1-17.
Laffey, J. L. (1980). The role of the elementary school principal in the school readingprogram: Research and Practice. Reading Teacher, pp.632-636.
Lambert, L. (1998). Building leadership capacity in schools. Alexandria, VA:Association for Supervision and Curriculum Development.
Lambert, L. (2002). A framework for shared leadership. Educational Leadership,50(8), 37-40.
Leithwood, K. A. (1995). Expert problem solving: Evidence from school and districtleaders. Ontario: Ontario Institute for Studies in Education.
Leithwood, K., & Jantzi, D. (1999). Transformational school leadership effects: Areplication. School Effectiveness and School Improvement, 10, 451-479.

106
Leithwood, K. & Menzies, T. (1998). Forms and effects of school-basedmanagement: A review. Education Policy, 12, 325-346.
Leithwood, K. A., & Montgomery, D. J. (1982). The role of the elementary schoolprincipal in program improvement. Review of Educational Research, 52(3),309-339.
Leithwood, K., Steinbach, R., & Jantzi, D. (1999). Changing leadership for changingtimes. Buckingham, UK: Open University Press.
Lezotte, L. (1982). Staff development and the research on effective schools. SyracuseUniversity, National Council of States on Inservice Education, 4(14).
Lezotte, L. (1992). Creating the total quality effective school. Okemos, MI: EffectiveSchools Products.
Lezotte, L. (1997). Learning for all. Okemos, MI: Effective Schools Products.
Lindle, J. C. (1999). Academic perspectives on the study of micropolitics in leadingschool reform. School Leadership & Management, 19(2).
Lindle, J. C. (2000). School-based decision making: A review of research on theKentucky Education Reform. Lexington: Kentucky Institute for EducationResearch.
Lipham, J. M. (1982). Effective principal, effective school. Reston, VA: NationalAssociation of Secondary Schools.
Lunenberg, F. C., & Ornstein, A. C. (1996). Educational administration: Conceptsand practices. Belmont, WA: Wadsworth Publishing.
Maehr, M. L., & Parker, S. A. (1993). A tale of two schools and the primary task ofleadership. Phi Delta Kappan, 75(3) 233-239.
Malen, B. (1995). The micropolitics of education: Mapping the multiple dimensionsof power relations in school politics. In J. D. Scribner & D. H. Lyaton (Eds),The study of educational politics. Washington, DC: Falmer Press.
Malen, B. (1999). On rewards, punishments, and possibilities: Teacher compensationas an instrument for education reform. Journal of Personnel Evaluation inEducation, 12(4), 387-94.
Malen, B., & Ogawa, R. L. (1988). Professional-patron influence on site-basedgovernance councils: A confounding case study. Educational Evaluation andPolicy Analysis, 10, 251-270.

107
Malen, B., Ogawa, R., & Kranz, J. (1989). An analysis of site-based management asan education reform strategy. Salt Lake City, UT: The University of Utah.
Mann, D. (1976). Making change happen. Teachers College Board.
Maryland State Department of Education. (2003, April). School improvement act.Baltimore, MD: Author.
McLaughlin, M. W. (1987). Learning from experience: Lessons from policyimplementation. Educational Evaluation and Policy Analysis, 9(2), 171-178.
McLaughlin, M. W. (1990). The Rand Change Agent Study revisited: Macroperspectives and micro realities. Educational Researcher, 19(9), 11-16.
Midgely, C., & Wood, S. (1993). Beyond site-based management: Empoweringteachers to reform schools. Phi Delta Kappan, 75, 245-252.
Mintzberg, H. (1980). The structuring of organizations. Englewood Cliffs, N.J:Prentice-Hall.
Mintrop, H. (2003). The limits of sanctions in low performing schools: A study ofMaryland and Kentucky schools on probation. Education Policy AnalysisArchives, 11(3).
Morgan, G. (1986). Images of organizations. Thousand Oaks, CA: Sage.
Murphy, J. (1990). Principal instructional leadership. In P.W. Thurston and L.L.Lotto (Eds.), Advances in educational administration. 1B. Greenwich, CT: JAIPress.
Murphy, J. (2001) The interstate school leaders licensure consortium: Standards forschool leaders. The AASA Professor, 24(2), 2-4.
National Commission on Excellence in Education. (1983). A nation at risk.Washington, DC: U.S. Government Printing Office.
Newburg, N., & Glatthorn, A. (1983). Four case studies of effective junior highprincipals. Philadelphia, PA: University of Pennsylvania.
Newmann, F., King, B., and Young, P. (2000). Professional development thataddresses school capacity. Paper presented at AERA.
No Child Left Behind Act of 2001. (2002, Jan. 8). United States Congress. PublicLaw 107-110, 115 Stat.1425.
108
Orozco, L. (1999). Perspectives: Educational leadership. Boulder, CO: Coursewise.
Owens, R. G. (1970). Organizational behavior in schools. Englewood Cliffs, NJ:Prentice-Hall, Inc.
Owens, R. G. (2004). Organizational behavior in education: Adaptive leadership andschool reform (8th ed.). Boston: Allyn & Bacon.
Papalewis, R., & Fortune, R. (2002). Leadership on purpose. Thousand Oaks, CA:Corwin Press.
Powell, S. T. (2004). Leadership and school success: The behaviors and practices ofprincipals in successful at-risk schools. Unpublished doctoral dissertation,Virginia Polytechnic Institute and State University.
Purkey, S. C., & Smith, M. S. (1983). Effective schools: A review. The ElementarySchool Journal, 83, 427-452.
Rand Change Agent Study. Federal programs supporting educational change,Volumes 1-5. Santa Monica, CA: Rand Corporation. 1974-75.
Richardson, M., Short, P., & Prickett, R. (1993). School principals and change.Garland Publishing, Inc. New York & London.
Rosenholtz, S. (1991). Teachers workplace: The social organization of schools. NewYork, NY: Teachers College Press.
Rutter, M. (1983). School effects on pupil progress: Research findings and policyimplications. In L. Shulman & G. Sykes (Eds.), Handbook of teaching andpolicy (pp.341). New York: Longman.
Sarason, S. (1990). The predictable failure of education reform: Can we changecourse before it's too late? San Francisco: Jossey-Bass.
Sarason, S. B. (1996). Revisiting the culture of the school and the problem of change.San Francisco: Jossey-Bass.
Schein, E. H. (1984, Winter). Coming to a new awareness of organizational culture.Sloan Management Review, 25.
Schein, E. H. (1992). Organizational culture and leadership (2nd. ed). San Francisco:Jossey-Bass.
109
Schmoker, M. (2001). The results fieldbook. Alexandria, VA: Association forSupervision and Curriculum Development.
Schon, D. A. (1983). The reflective practitioner. Basic Books. New York, N.Y.
Scott, G. H. (1983). Actual and ideal management, instructional leadership, andcommunity relations functions of the elementary school principal in theBaltimore County Public Schools as perceived by selected others. (Doctoraldissertation, University of Maryland). Dissertation Abstracts International, 49,1337-A.
Sebring, P. B., & Bryk, A. S. (2000). School leadership and the bottom line inChicago. Phi Delta Kappan, 81(6), p. 440-443.
Seifert, E. H., & Beck, J. J. (1981, March). Elementary principals: Instructionalleaders or school managers. Phi Beta Kappan, 62, 528.
Sergiovanni, T. (1979). Rational bureaucratic, collegial, and political views of theprincipal's role. Theory in practice (Thematic Issue: The role of the principalas instructional leader) 16(1), 12-20.
Sergiovanni, T. (1990). Value-added leadership: How to get extraordinaryperformance in schools. New York: Harcourt Brace Jovanovich.
Sergiovanni, T. (1991). The principalship: A reflective practice perspective (2nd ed.).Needham Heights, Massachusetts: Allyn & Bacon.
Sergiovanni, T. (1995). The principalship: A reflective practice perspective. Boston:Allyn & Bacon.
Sergiovanni, T. ( 2000). Changing educational change. Education Week Commentary,27.
Shavelson, R. J. (1988). Statistical reasoning for the behavioral sciences. Boston:Allyn and Bacon, Inc.
Shoemaker, J., & Fraser, H. W. (1981). What principals can do: Some implicationsfrom studies of effective schooling. Phi Delta Kappan, 63(3), 178-182.
Short, P. M., Greer, J. L., & Michael, P. (1991). Restructuring schools throughempowerment: Facilitating the process. Journal of School Leadership, 1(2),127-139.
Sizer, T. R. (1984). Horace's compromise: The dilemma of the American high school.Boston: Houghton-Mifflin.
110
Sizer, T. R. (1992). Horace's school: Redesigning the American high school. Boston:Houghton-Mifflin.
Skinner, B. F. (1968). The technology of teaching. New York: Appleton-Century-Crofts.
Slavin, R. E. (2000/2001). Putting the school back in school reform. EducationalLeadership, 58(4), 22-27.
Smith, M., & O'Day, J. (1990). Systemic school reform. In S. Fuhrman & B. Malen(Eds.), The politics of curriculum and testing (pp. 233-267). London: FulmerPress.
Smith, W. F., & Andews, L. (1989). Instructional leadership: How principals make adifference. Alexandria: Association for Supervision and CurriculumDevelopment.
Smith, S. S., & Michelson, R. A. (2000). All that glitters is not gold: School reform inCharlotte-Mecklenburg. Educational Evaluation and Policy Analysis, 22(2),101-127.
Sondheim, W. et al. (1989). The report of the Governor's Commission on SchoolSupport. Annapolis, MD.
Spillane, J., et al. (2000). Investigating school leadership practice: A distributiveperspective. Educational Researcher, 31, 23-28.
Spillane, J., Halverson, R., & Diamond, J. (2001). Investigating school leadershippractice: A distributive perspective. Educational Researcher, 30(3), 23-38.
Stedman, J. (1994). Goals 2000: An overview and analysis. Washington, DC:Congressional Research Service.
Stevenson, M. B. (1987). Instructional leadership: Teacher perceptions of elementaryprincipal leadership behaviors. (Doctoral dissertation, University ofMinnesota, 1987). Dissertation Abstracts International, 49, 3028-A.
Sykes, G. & Plastrik, P. (1993). Standard setting as educational reform: Trends andissues. Paper # 8, Washington, DC. ERIC Clearinghouse on TeacherEducation. American Association of Colleges for Teacher Education.
Teddlie, C., & Stringfield, S. (1993). Schools make a difference: Lessons learningfrom a ten-year study of school effects. New York, NY: Teachers CollegePress.
111
Thomson, S. A. (1990). Principals for our changing schools: Preparation andcertification. Fairfax, VA: National Commission for the Principalship.
Thornberry, T. (1986). Towards a dynamic theory of delinquency. IndianaUniversity, 1984.
Tracy, D. (1990). The power pyramid: How to get power by giving it away. NewYork: Morrow.
Tripses, J. (1998). An examination of the principal's role in managing the paradox ofstate mandated improvement and accountability. Planning and Changing,29(4), 237250.
Uchiyama, K. P., & Wolf, S. A. (2002). The best way to lead them. EducationalLeadership, 59, 80-83.
Underwood, T. L. (2001). Reflections on assessment, accountability, and schoolreform. The Clearing House, 74(4), 172-174.
United States Department of Education. (2001). The No Child Left Behind Act of2001, Public Law 107-110. Washington, DC: Author.
Van de Grift, W. (1989). Self perceptions of educational leadership and mean pupilachievements. In D. Reynolds, B. P.M Creemers, & T. Peters (Eds.), SchoolEffectiveness and Improvement, pp.227-242. Cardiff/Groningen: School ofEducation/RION.
Van de Grift, W. (1990). School effectiveness and school improvement. EducationalLeadership and Achievement in Elementary Education, 1(3), 26-40.
Weatherley, R., & Lipsky, M. (1977). Street-level bureaucrats and institutionalinnovation: Implementing special-education reform. Harvard EducationalReview, 47(2), 171-197.
Webster's New World Dictionary and Thesaurus. (1996). M. Agnes (Ed.). New York:Macmillan.
Weick, K. E. (1983). Managerial thought in the context of actions in the executivemind (Suresh Srivastia, Ed.). San Francisco: Jossey-Bass. p. 22.
Weisman, I. M. (2005). New directions for community colleges, presidents andtrustees in partnership: New roles and leadership challenges, No. 98. SanFrancisco: Jossey-Bass.
112
Wimpleberg, R. K. (1987. Managerial images and school effectiveness.Administrators' Notebook, 32, 1-4.
Yukl, G. A. (1989). Leadership in organizations. Upper Saddle River, NJ: Prentice-Hall.
Zigarelli, M. A. (1996). Can they do that? A guide to your rights on the job. NewYork: Lexington Books.