Embed Size (px)
Citation preview

RELATIONSHIP BETWEEN TRANS PACIFIC AND FEED RAW MATERIALS USED IN
THAILANDSeksom Attamangkune, Ph.D. Kasetsart University

Facts about Thailand
Area : 514,000 sq.km (200,000 sq. miles)
[equivalent in size to France or Texas]
Agriculture Land : 238,784 sq.km.
Irrigation Area : 47,648 sq.km. (20%)
No Irrigation Area : 191,136 sq.km. (80%)

Facts about Thailand
37.6% (24.5 millions) of
total population (65 millions)
are in Agricultural sector
67% of farmers are in the
range of 15-56 years old
8%
92%
Gross Domestic Product Ratio (2012)(Agriculture : Non-agriculture products)

Facts about Thailand
Crop production depends largely on natural resources and labors
Crop production is 46.5% of total land
Only 48% of crop area owned by farmers
Multiple cropping index = 110

Thai’s major agricultural products
Rice Rubber Corn Tapioca Sugar cane Palm oil
60+16 15 7-8 8 8 4-5
5
Cash crops Area (Million Rai)

6
Memberships:USAJapanMalaysiaVietnamSingapore* Brunei*AustraliaNew Zealand*CanadaMexicoChile*Peru
* P4 Trade Agreement

Global supply of major feedstuffs

World major oil seed production8
Soybean Rapeseed and Canola

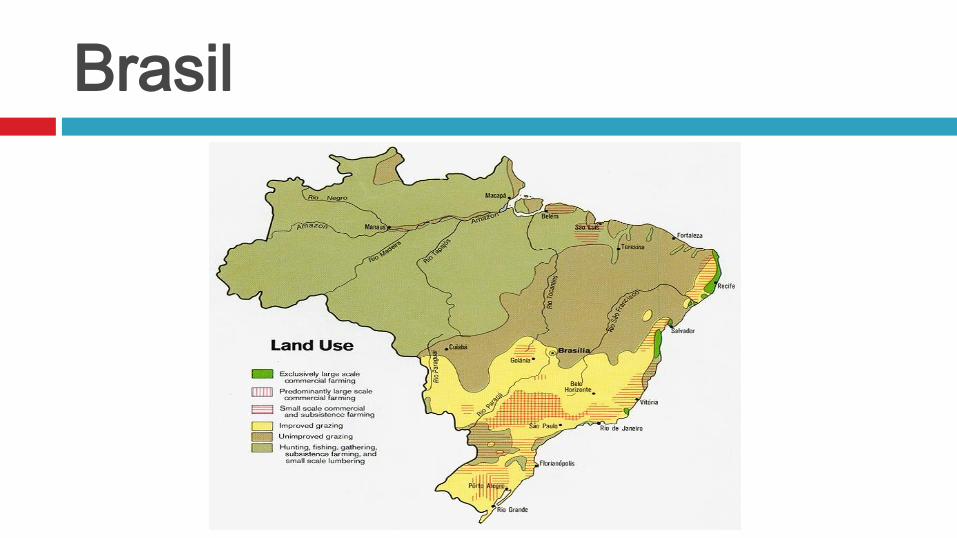
Brasil

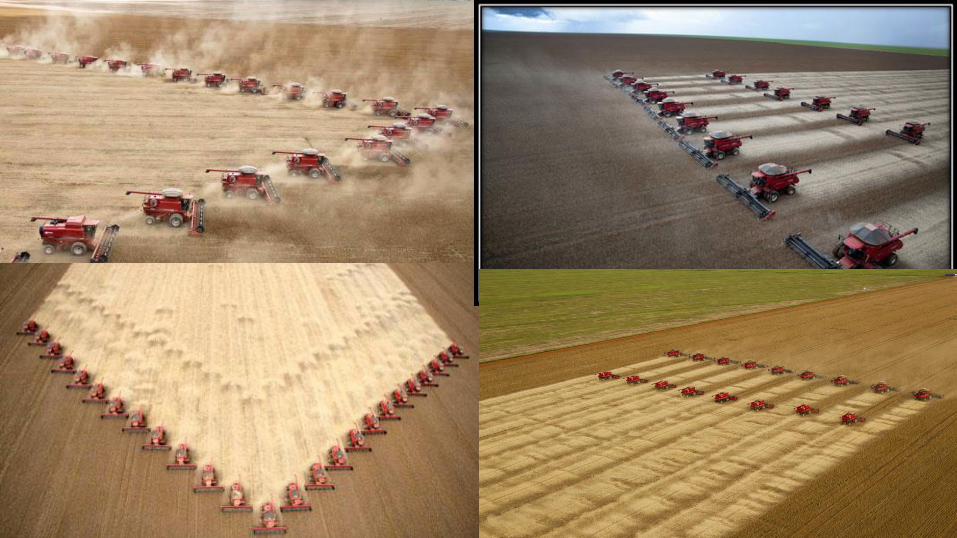
Soybean expansion in Brazil

Soybean production in Brazil
13

Soybean production in Argentina

JAN FEB MAR APR MAY JUNE JULY AUG SEPT OCT DECNOV
Time table for global soybean production
ARGENTINA
BRASIL
INDIA
USA
Harvest Planting

Global Soybean Production by Country(Values in Metric Tons)
16
United States: 105,732,000 Brazil: 97,000,000 Argentina: 57,000,000 Other: 21,191,000 China: 11,500,000 India: 11,500,000 Paraguay: 8,800,000 Canada: 6,200,000

Rape Seed and Canola

Global Rapeseed Production by Country(Values in Metric Tons)
18
European Union: 21,400,000 Canada: 14,600,000 China: 14,100,000 Others: 9,580,000 India: 7,500,000 Japan: 2,000

World major grain production19
Corn Wheat

Global Corn Production by Country(Values in Metric Tons) United States:
343,678,000 China: 229,000,000 Others: 96,254,000 Brazil: 77,000,000 EU-27: 65,773,000 Ukraine: 26,000,000 Argentina: 25,000,000 India: 23,500,000 Mexico: 23,500,000
South Africa:13,500,000
Russia: 13,000,000 Canada: 12,300,000 Indonesia: 9,600,000 Philippines: 8,300,000 Nigeria: 7,000,000 Ethiopia: 7,000,000 Serbia: 6,700,000
20

Global Wheat Production by Country(Values in Metric Tons) EU-27: 147,875,000 China: 130,000,000 India: 90,000,000 United States: 58,456,000 Russia: 57,000,000 Others: 55,265,000 Canada: 27,500,000 Australia: 26,000,000 Pakistan: 25,000,000
Ukraine: 24,000,000 Turkey: 18,500,000 Iran: 14,000,000 Kazakhstan:
13,500,000 Argentina: 11,500,000 Egypt: 8,360,000 Morocco: 7,800,000 Uzbekistan: 7,200,000
21

22
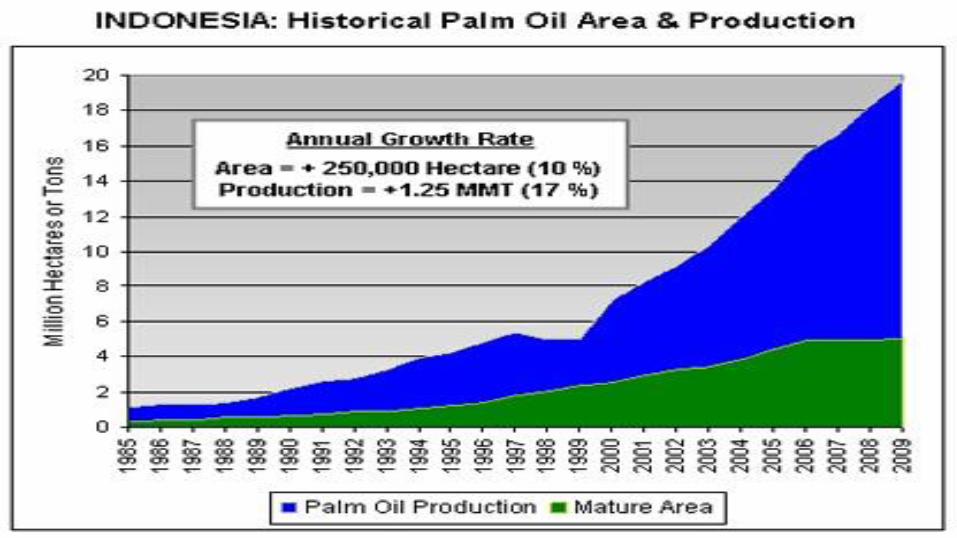
Palm oil
Major countries1.Indonesia2.Malaysia3.Thailand
23

IMF: Spot Crude, $/barrel
104.1
96.2
56.259.6
63.366.7 68.4 69.0
0
20
40
60
80
100
120
2013 2014 2015 2016 2017 2018 2019 2020
$/b
bl
Medium Term Commodity Price Baseline

25

Biodiesel Production26

Biodiesel yield per acre27

28
1. Normal years2. El Nino years3. La Nina years

Current Thai’s agriculture situation29

Wheat grain imported to Thailand30

31

By-products from food industries
Rice bran Extracted rice bran Wheat bran Tapioca pulp Palm kernel meal Brewery dried
grain Copra meal DDGS
32

Others potential By-products
GlycerolYeastVinassesBagassesAlgae Insects
33

Conclusions34
Benefit in terms of imported RMs for Feed industry but detriment for Thai farmers and related industries
Too much risks for cheaper imported foods from world leading countries in agricultural production i.e. Poultry from USA, Meat and milk from Australia and New Zealand
The overall trading of the country and the government’s policies