Embed Size (px)
Citation preview
18
Lymphology 13 (1980) 18- 23
Relationship Between the Measured and Calculated Colloid Osmotic Pressure of Plasma and Lung Lymph in the Sheep
R.H. Demling, M.D., M. Manohar, D.V.M., Ph.D. and J.A. Will, D.V.M., Ph.D.
Department of Surgery and Veterinary Science , Un iversity of Wisconsin, Madison, Wisconsin 53706
Summary
The colloid osmotic pressure of plasma, 1rp, and lung lymph 1ri, in the adult sheep was measured with a membrane osmometer and calculated from the protein content using the Landis and Pappenheimer equation. Measured (M) plasma oncotic pre sure was 6 mm Hg lower than calculated (C), for normal sheep plasma. The difference between (M) and (C) decrea ed as protein content decreased. The (M) lymph value, considered to be equal to interstitial fluid, was only I mm Hg lower than (C) for normal lymph. This re ulted in a difference between the calculated and measured oncotic gradient (1Tp"1Ti) of nearly 5 mm Hg. This difference decreased as protein content decreased in plasma and lymph. The difference between measured and calculated values may in part be explained by the difference in A/G ratio between human and sheep plasma and between heep plasma and lymph. Measured oncotic pressure
in plasma and lymph after severe hemorrhagic and cndotoxic shock did not differ significantly from that in the normal animal.
The chronic lung lymph fistula preparation in the adult sheep is currently being used by a number of investigators for the measurement of pulmonary fluid and protein dynamics in various disease states (1-4). An accurate measurement of colloid osmotic pressure both in plasma and lung lymph, which is considered to be equal to interstitial fluid, is necessary for studies of fluid and protein movement across the microcirculation (3, 4). A number of studies using this model, reported in the literature, have used the Landis - Pappenheimer equation ( 5) for total protein or for albumin and globulin , to calculate these values (1 , 2). Recent reports comparing calculated oncotic pressures with those measured on a membrane
Supported by NIH Grant HL 21076
osmometer, have demonstrated that in the human the values agree but in several animal species, in particular the dog, measured values are significantly lower than calculated (6).
Our purpose was to compare directly measured plasma and lymph oncotic pressures in the sheep with those calculated using the LandisPappenheimer equation. We performed these measurements both in the normal state and after hemorrhage and endotoxic shock to see if various disease states altered this relationship.
Methods
Twenty-six adult sheep (40- 90 kg) were prepared for collection of lung lymph according to the method of Staub (3). Animals were allowed to recuperate for five days after lymph cannulation prior to any studies, to allow for a steady-state lymph and protein flow. All studies were performed in the unanesthetized state the sheep unrestrained in a metabolic cage.
Measurements
Lung lymph and venous blood were collected in heparinized tubes and immediately centrifuged and the plasma and cell free lymph, separated. Plasma and lymph colloid osmotic pressure were measured at room temperature (24 °C) using a commercially available oncometer having a semipermeable membrane impermeable to particles over 30,000 molecular weight (Weil-lnstrumentation Laboratory Inc., Lexingtom, Massachusetts, Model No. IL 186) . Since the effect of temperature on oncotic pressure is considered to be very small (0.3%
0024-7766/80 1300-0018 S 02.00 © 1980 Georg Thieme Verlag, Stuttgart· New York
Permission granted for single print for individual use. Reproduction not permitted without permission of Journal LYMPHOLOGY.

Relationship Between the Measured and Calculated Colloid Osmotic Pressure 19
per degree C0) , a temperature correction was
not made (7) .
Total protein concentrations were determined by the Biuret technique and albumin concentrations by the Doumas (8) method. Colloid osmotic pressures were calculated using both the Landis and Pappenheimer equations for total protein and for albumin and globulin (5).
Total protein 11 = 2.1 C + .16 C2 + 0.009 C3 Albumin 11 = 2.8 C + .18 C2 + 0 .012 C3 Globulin 11 = 1.6 C + .15 C2 + 0.006 C3
Experiments
Lymph and plasma san1ples were collected in 14 sheep with lymph fistulae over a four day period . Eight animals were subsequently given a rapid crystalloid infusion equal to one-half of their blood volume. In six sheep, 50% of blood volume was removed and replaced with 2.5 times this volume with lactated Ringers solution. Lymph and plasma samples were collected at one-half hour to one hour intervals during the study.
Hemorrhagic Shock
The study was performed on six unanesthetized animals. Sheep were bled from an arterial line to a mean arterial pressure of 50 mm Hg over a 30 minute period. Blood was then removed as necessary to maintain the pressure between 50- 55 mm Hg.
Animals remained at this pressure until they expired. Lymph and plasma samples were collected every 30 minutes .
Endotoxemia
Six unanesthetized sheep were given a lethal dose (1 0 J.Lg/kg) of E. coli endotoxin in !ravenously. The animals were monitored until they died , with lymph and plasma collections every 30 minutes.
Statistical Analysis
Statistical analysis was performed using the paired t-test on individual paired differences. The slopes of the regression equations were compared using the t-test (9). Significance was considered as p < 0.05.
Results
Mean data for the normal animal with hemo· dilution is found in Table 1. Calculations of oncotic pressure were made using tl1e Landis Pappenheimer equation for total protein . We noted a 6 mm Hg difference between calculated and measured oncotic pressures for normal plasma (1rp) and a 1 mm Hg difference for normal lymph (1ri) with ilie measured value being lower. When oncotic pressure was decreased by hemodilution , ilie difference between calculated and measured decreased. At extremely low levels of 1ri (3 - 5 mm Hg), the measured value was actually higher than that calculated.
Since the difference in values for 1rp was much larger than for 1ri , the differences did not cancel out in the oncotic gradient (1rp-1ri). In fact measured (1rp-1ri) was 4 mm Hg lower ilian that calculated. We compared the measured and calculated 1rp and 1ri with total protein content (Figure 1). The measured data best fit a straight line in the range of the protein content in our study. Data were not extrapolated beyond this range because this would require artificially altering the samples by further concentration or dilutions. The equation for plasma was y = 2.22x + 1.87 r = .94 and for lymph, y = 2.4 7x + 0.51 r = .96. Both 1rp and 1ri deviated from the Landis- Pappenheimer equation as protein content increased. The comparison between calculated values using both total protein and albumin/globulin and measured values is shown in Figure 2.
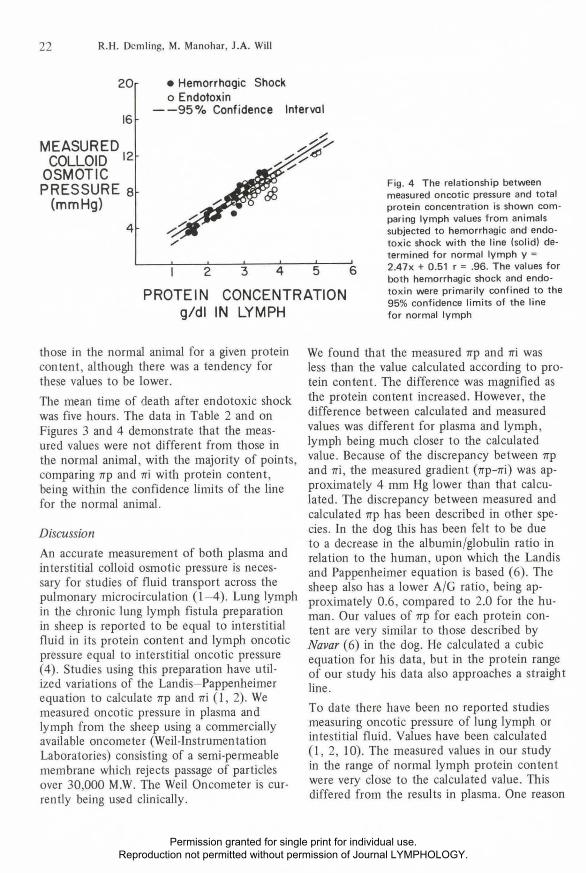
Mean data for animals subjected to fatal hemorrhagic and endotoxic shock are shown in Tables 2 and 3 . The mean time of death after hemorrhagic shock was six hours . Hemorrhagic shock resulted in a significant decrease in 1rp. 1ri was also significantly decreased. The mean difference during shock between calculated and measured 1rp and 1ri was less than that at baseline because of the hypoproteinemic state. On Figures 3 and 4 are plotted the individual points comparing measured 1rp and 1ri after hemorrhagic shock with regression lines determined from the normal animal . The majority of the points are within the confidence limits of the lines , indicating iliat the values of 1rp and 1ri were not significantly different from
Permission granted for single print for individual use. Reproduction not permitted without permission of Journal LYMPHOLOGY.

20 R.H. Dcmling, M. Manohar , J.A . Will
Table 1 Comparison between calculated and measured oncotic pressure in the normal animal
Protein (g/dl) Ratio Colloid Osmotic Pressure (mm Hg) Gradient rrp--rri (mm Hg) Mean ± S.E. Total Albumin A /G Calc. Meas. Diff. Calc. Meas. Diff .
Plasma 6.6±0 .2 2.5±0 .2 .60 21 .6±0.9 16.3±0.4* 5.8±1.5* (Baseline)
Lymph 10.8±0.7 6.5±0.4* 4.4±0.2*
(Baseline) 4.2±0 .1 1.9±0 .5 .82 11.7±0.6 1 0 .7±0.4 1.1±0 .3
Plasma 3.9±0 .1 1.6±0 .1 .69 10.9±0 .3 9.5±0 .3* 1.4±0 .2* (Crystalloid)
Lymph 1.4±0 .1 0 .7±0.1 1.00 3.3±0 .3 3.9±0 .3 - 0.7±0.4 (Crystalloid)
7 .5±0.4 5.4±0.4* 2.5±0.1 *
------------------------------*Sign ificantly different from calculated value p < 0 .05
28
24
20
COLLOID OSMOTIC 16
PRESSURE {mm Hg) 12
8
4
24
20
MEASURED 16 COLLOID
OSMOTIC 12
PRESSURE
{mmHg) 8
4
MEASURED COP -•-•Plasma ---Lymph
CALCULATED COP
/
.r=.94 r=.96 • ......-
/ ......... // / .........
~:.,.'·"""· ./
I 2 3 4 5 6 7 8 PROTEIN CONCENTRATION g/dl
T.P. -•-•Plasma ---Lymph
A/G ~ --Plasma 9"
--Lymph
...-::
4 8 12 16 20 24 26 CALCULATED COLLOID OSMOTIC
PRESSURE {mm Hg)
Fig . 1 The relationship between colloid osmotic pressure and total protein concentration is shown comparing the relationship (sol id line) as defined by the Landis and Pappenheimer equation with that measured in sheep plasma and lung lymph using an oncometer. In the range of the protein concentrations studied , the measured relationships best fit straigt lines. The equation for plasma is y = 2.22x + 1.87 r = .94 and lymph is y = 2.47x + 0.51 r = .96. As can be seen the lymph relationship was much closer than plasma to the Landis and Pappenheimer equation with both lines deviating from the equation wit h higher total protein contents.
Fig. 2 The comparison between calculated and measured colloid osmotic pressure is shown for plasma and lymph. The comparison was made using both the calculated value for COP based on total protein rr = 2.1C + .16C2 + 0 .009C 3 and on the albumin 1T = 1.6C + .15C2 + 0.006C 3. The relationships were the same for the two calculated values. As can be seen, the plasma and lymph relat ionships differed considerably , with the measured lymph value being much closer to the cal culated value than was plasma. The equation for lymph is y = .75x + 2 .0 and for plasma y = .45x + 6.1
Permission granted for single print for individual use. Reproduction not permitted without permission of Journal LYMPHOLOGY.

Relationship Between the Measured and Ca lculated Colloid Osmotic Pressure 21
Table 2 Comparison between calculated and measured oncotic pressure during hemorrhagic shock
Protein (g/dl) Ratio Colloid Osmotic Pressure (mm Hg) Gradient 1rp-rri (mm Hg) Mean ± S.E. Total Albumin A/G Calc. Meas. Diff. Calc. Meas. Diff .
Plasma 6.2±0 .2 2.5±0 .1 .67 21 .3±0.6 16.1±0.6* 5 .0±0.4* (Baseline)
Lymph 10.9±0 .3 5 .9±0.4 * 5.0±0 .2*
(Baseline) 2.6±0 .2 1.7±0.4 .90 10.1 ±0.4 10.2±0.5 0±0.4
Plasma 4.2±0 .3 1.8±0.2 .75 12.4±0.4 10.2±0.4 2.3±0.4* (H.S.)
Lymph 6 .5±0.4 4.1±0.3* 2 .2±0 .2*
(H.S .) 2.4±0.2 1.1±0.2 .85 6.1 ±0 .3 6.0±0.6 0.1 ±0.2
---------- - ------------------------------- -*Significantly different from calculated value p < 0 .05
Table 3 Comparison between calculated and measured oncotic pressure after E. coli endotoxin
Protein (g/dl) Ratio Colloid Osmotic Pressure (mm Hg) Gradient 1rp-rri (mm Hg) Mean ± S.E. Total Albumin A/G Calc. Meas. Diff. Calc. Meas. Diff .
Plasma 6.2±0.4 2.5±0.2 .64 21 .3±0 .8 16.6±0.5* 4 .8±0.6* (Baseline)
Lymph 1 0.4±0.4 5.6±0 .6 4 .5±0 .3
(Baseline) 4 .1 ±0.4 1.9±0.2 .89 11.9±0 .7 11.0±0.6 1.0±0.6
Plasma 5.7±0.1 2.0±0.1 .54 18.8±0.4 14.6±0.6* 4.4±0 .5 *
(Endotoxin)
Lymph 9 .0±0 .3 6 .1 ±0.4 3.2±0.3
(Endotoxin) 3 .5±0.3 1.4±0.2 .70 9 .7±0 .7 8 .5±0.4 1.1±0 .6
-------------------------------------------* Significantly different from calculated value p < 0 .05
Fig . 3 The relationship between measured oncotic pressure and total protein concentration is shown comparing plasma values from ani mals subjected to hemorrhagic and endotoxic shock with the line (solid) determined for normal plasma y = 2.22x + 1.87 . The values for hemorrhagic shock tended to be somewhat lower than found for normal plasma but most of the points as with endotoxin plasma, fell within the 95% confidence limits of the line for normal plasma
24
20
MEASURED 16
COLLOID OSMOTIC 12 PRESSURE
(mmHg) 8
4
• Hemorrhagic Shack o Endotoxin
--95% Confidence Interval
3 4 5 6 7
PROTEIN CONCENTRATION g/dl IN PLASMA
8
Permission granted for single print for individual use. Reproduction not permitted without permission of Journal LYMPHOLOGY.
22 R.H . Dcmling, M. Manohar, J.A. Will
20 • Hemorrhagic Shock o Endotoxin
--95% Confidence Interval 16
MEASURED COLLOID 12
OSMOTIC PRESSUREs
(mmHg)
4
2 3 4 5 6
PROTEIN CONCENTRATION g/dl IN LYMPH
Fig. 4 The relationship between measured oncotic pressure and total protein concentration is shown comparing lymph values from animals subjected to hemorrhagic and endotoxic shock with the line (solid) determined for normal lymph y = 2.47x + 0.51 r = .96. The values for both hemorrhagic shock and endotoxin were primarily confined to the 95% confidence limits of the line for normal lymph
those in the normal animal for a given protein content, although there was a tendency for these values to be lower.
The mean time of death after endotoxic shock was five hours. The data in Table 2 and on Figures 3 and 4 demonstrate that the measured values were not different from those in the normal animal , with the majority of points, comparing 1rp and 7Ti with protein content , being withln the confidence limits of the line for the normal animal.
Discussion
An accurate measurement of both plasma and interstitial colloid osmotic pressure is necessary for studies of fluid transport across the pulmonary microcirculation (1-4). Lung lymph in the chronic lung lymph fistula preparation in sheep is reported to be equal to interstitial fluid in its protein content and lymph oncotic pressure equal to interstitial oncotic pressure (4). Studies using thls preparation have utilized variations of the Landis- Pappenheimer equation to calculate 1rp and 1ri (1, 2). We measured oncotic pressure in plasma and lymph from the sheep using a commercially available oncometer (Weil-lnstrumentation Laboratories) consisting of a semi-permeable membrane which rejects passage of particles over 30,000 M.W. The Wei! Oncometer is currently being used clinically.
We found that the measured 1rp and 1ri was less than the value calculated according to protein content. The difference was magnified as the protein content increased. However, the difference between calculated and measured values was different for plasma and lymph, lymph being much closer to the calculated value . Because of the discrepancy between 7rp
and 1ri, the measured gradient (1rp-1ri) was approximately 4 mm Hg lower than that calculated. The discrepancy between measured and calculated 7Tp has been described in other species. In the dog this has been felt to be due to a decrease in the albumin /globulin ratio in relation to the human , upon which the Landis and Pappenheimer equation is based (6). The sheep also has a lower A/G ratio , being approximately 0.6 , compared to 2.0 for the human. Our values of 1rp for each protein content are very similar to those described by Navar (6) in the dog. He calculated a cubic equation for his data , but in the protein range of our study his data also approaches a straight line.
To date there have been no reported studies measuring oncotic pressure of lung lymph or intestitial fluid. Values have been calculated (I , 2, I 0). The measured values in our study in the range of normal lymph protein con tent were very close to the calculated value . This differed from the results in plasma. One reason
Permission granted for single print for individual use. Reproduction not permitted without permission of Journal LYMPHOLOGY.

Relationship Between the Measured and Calculated Colloid Osmotic Pressure 23
for this may be that the A/G ratio of lymph is about 0.9 and closer to human plasma than is sheep plasma. Other undetermined mechanisms , however , may be involved which will need to be identified.
Having identified the discrepancy between 7Tp and 7Ti and between calculated and measured values , we wanted to determine whether these relationships were altered by disease states. We found that these relationships did not appear to change significantly when the animals were subjected to lethal hemorrhagic and endotoxic shock , although there was a general tendency for these values to read slightly lower than the values for the same protein content in the normal animal.
We have therefore identified a significant discrepancy between calculated and measured oncotic pressure in sheep plasma and lymph. We have not determined which one of these values best approximates the oncotic Starling force affecting the microvascular membrane in vivo. However , these data do point out the need for further study of oncotic pressure measurement in the experimental animal.
References
1 Erdmann, A.J., T.R. Vaughan, K.L. Brigham, W.D. Woolverton, N.G. Staub: Effect of increased vas-
cu lar pressure on lung fluid balance in unanesthetized sheep. Circ. Res. 37 (1975 ) 271 - 284
2 Sturm, H.A., M.A. Carpenter, F.R. Lewis, C. Graziano, D.D. Trunkey : Water and protein movement in the sheep lung after septic shock : Effect of colloid versus crystalloid resuscitation. J . Surg. Res. (in press)
3 Staub, N.C., R.D. Bland, K.L. Brigham, R.H. Demling et al.: Preparation of chronic lung lymph fistula s in sheep. J. Surg. Res. 19 (1975) 315 - 320
4 Vreim , C.E. , P.D. Snashall, R.H. Demling, N.C. Staub : Lung lymph and free interstitial fluid protein composition in sheep with edema. Am. 1. Physiol. 230 (1976) 1650- 1653
5 Landis, EM. , J.R. Pappenheimer: Exchange of substances through capillary walls. Handbook of Physiology , Circulation Sec. 2 , Vol. 2, edited by W.F. Hamilton and P. Dow, Washington, D.C. , American Physiological Society (1963) pp. 961 -1034
6 Navar, P .D., L.G. Navar: Relationship between co lloid osmotic pressure and plasma protein concentration in the dog. Am. 1. Physiol. 233 (1977) 295 - 298
7 Ladegarrd-Pedersen, H.J. : Measurement of the colloid osmotic pressure in patients. Scand. J . Clin. Lab. Invest. 20 (1967) 79 - 87
8 Doumas, B.T., H.G. Briggs: Determination of serum albumin. 1n Standard Methods of Clinical Chemistry , Acod Press, New York, 7 , 175 - 188
9 Steel, R .G.D., J.H. Torrie: Principles and procedures. In : Statistics. McGraw Hill , New York (1960) pp. 161 - 193
lO Todd, T.R.J. , E. Baile, J.C. Hogg: Pulmonary capillary permeability during hemorrhagic shock. 1. Appl. Physiol. 45 (2) (1978) 298 - 306
Robert H. Demling, M.D. , University of Wisconsin Hospitals, 600 Highland Avenue, Madison, Wisconsin 53796
Permission granted for single print for individual use. Reproduction not permitted without permission of Journal LYMPHOLOGY.