Embed Size (px)
Citation preview
Relationship between the ECT-strength of
corrugated board and the compression
strength of liner and fluting medium papers
Author: Kiril Dimitrov (98022891)
Course: MEng Dissertation 800 (CVD800)
Supervisor: Mike Heydenrych
Submitted in fulfillment of the requirements for the degree MEng
(Chemical Engineering) in the Faculty of Engineering, Built
Environment and Information Technology, University of Pretoria,
Pretoria
16th of July, 2010
Executive Summary
i
Executive Summary
The compression strength of any corrugated board box is a direct measure of its
stacking strength. The compression strength of a box is measured according to a
standardized test method known as the Box Crush Test. Numerous studies,
initiated from the basic work conducted by McKee and Gander (1962), have been
published indicating which properties of the corrugated board give the corrugated
board box its compression strength. Further this was extended to studies
investigating, which properties of the substrates (papers) are critical to achieve
desired strength corrugated board. It was therefore the primary aim of this research
to establish predictive mathematical correlations between corrugated board and
paper compression properties, which can be used in the South African corrugating
industry.
The relationship between the corrugated board edgewise compression strength
(ECT) and its components’ characteristics can be analyzed in many ways. Some of
the reported in literature relationships between paper and board properties have
become progressively more complex as the models have been refined to take into
account all of the important structural and component characteristics. These
models can be used for detailed research and development purposes, but they are
too complicated for practical use. A more useful approach to predict the
compression strength of the corrugated board is to sum the compressive strengths
of the linerboards and medium making up the corrugated board, allowing for the
draw of the medium (Maltenfort model). This approach gives good predictive
accuracies, if based on appropriate statistical weighting factors. It is also necessary
to select adequate and practical paper and board compression strength test
methods.
The two most widely used paper compression strength test methods in the industry
are the Ring crush test (RCT) and the STFI Short-span compression test (SCT).
Certain limitations regarding the Ring crush testing method exist, pointing out that
this method does not measure the true intrinsic edgewise compressive strength.
Preferences were given in literature to the use of the STFI Short-span compression
test. The FPL Neck-Down test method resembles best the failure of the corrugated
Executive Summary
ii
board under pure compression, but this method is somewhat difficult to be used in
manufacturing environment and commercially available equipment for sample
preparation is limited. Therefore the more user-friendly and widely spread FEFCO
No. 8 (ISO 3037:1994(E)) method was utilized in this investigation, knowing its
limitations.
As boxes are generally transported at different climatic conditions stacked on top of
each other, when environmental conditions change, the compression strength of
the boxes changes. A corrugated box loses half or more of its short-term top load
box compression strength when the relative humidity is increased from 50 to 90%.
The reduction in compression strength of paper, board and the final box product
are correlated, but the magnitude of the reduction is dependent on the testing
methodology employed. The major factor affecting the stacking performance of
corrugated containers is the moisture content of the board. The equilibrium
moisture content of paper is dependent on the ambient temperature and relative
humidity among other factors. As moisture content increases, ultimate paper
strength properties are reduced, due to a reduction in inter-fiber bonding.
The experimental work conducted in this investigation and the results generated
were used to determine the linear regression constants in the Maltenfort model,
correlating the measured ECT with the predicted ECT, using the paper
components’ compression strengths, measured using the SCT and RCT methods.
The obtained predictive mathematical models are as follows:
ECT = 0.6982 (SCTL1 + SCTL2 + SCTL3 + αααα1111SCTF1 + αααα2222SCTF2)
R2SCT = 0.9758
ECT = 1.028 (RCTL1 + RCTL2 + RCTL3 + αααα1111RCTF1 + αααα2222RCTF2)
R2RCT = 0.9625
where the ECT, SCT and RCT are in kN/m, the correlating constant (k) is
dimensionless and αααα is the profile and plant specific flute take up factor. The
models show very high coefficients of determination, which confirms that they can
be used successfully to predict the compression strength of corrugated board using
Executive Summary
iii
the measured paper compression strength (SCT and RCT) after exposure to any
constant climatic condition.
It was also of interest for this study to determine whether the models obtained for
the participating corrugating plants differ. The results indicated that the plant
specific predictive mathematical models compared well to the overall linear models
and that no major difference exists between the plants’ capabilities to convert the
paper compression strength into corrugated board edgewise crush strength. These
results suggested that a single set of predictive mathematical models can be
utilized with good degree of confidence in the South African corrugating industry.
Even though somewhat higher correlation when using SCT results was obtained,
the comparative results between the two methods in this study could only confirm
that good correlations with the boards’ ECT results exist, regardless of the paper
testing method used. The linear correlation between the SCT and RCT results
obtained in this study, suggested somewhat limited correlation between the results
of the two test methods:
SCT = 1.3089 x RCT + 0.2758
R2 = 0.9166
The results in this study also showed that the reduction in compression strength
after exposure to the same conditions is different for different papers, but the
combined effect of the board’s components is reflected in the board’s ECT
reduction. It was speculated that the difference in strength reduction after exposure
to high humidity could be somewhat related to the different paper grades and their
furnish composition. In general high performance virgin linerboards and semi-
chemical fluting papers showed lower reduction in SCT and RCT after exposure to
high humidity conditions. However, these observations suggest the need to conduct
further research in this area in order to investigate the fundamentals behind these
findings.
KEYWORDS: Paper compression strength, SCT, RCT, corrugated board,
edgewise compression strength, ECT, relative humidity
Acknowledgements
iv
Acknowledgements
The author would like to express his gratitude to Sappi South Africa for the support
provided during the course of this study. Special thanks to the members of the
Paper Sciences Department at Sappi Technology Centre, who provided the
specialized equipment and assisted unconditionally in the extensive laboratory
work. Many thanks to the management of the three corrugating plants participating
in this study, for the time allowed on site for sample collection.
Contents
v
Contents
Executive Summary........................................................... i
Acknowledgements...........................................................iv
Contents............................................................................ v
List of Figures ..................................................................vii
List of Tables.....................................................................ix
1. Introduction .................................................................. 1
2. Literature Review ......................................................... 4
2.1. Paper properties related to box stacking strength...................................... 4
2.1.1. Box compression strength...............................................................................4
2.1.2. Correlation between corrugated board and its components’ properties ........8
2.1.2.1. Corrugated board flexural stiffness ........................................................................ 8 2.1.2.2. Corrugated board edgewise compression strength ............................................... 9
2.2. Paper and board compression test methods ........................................... 17
2.2.1. Edgewise compression strength testing of paper.........................................17
2.2.1.1. Short-span specimen geometry ........................................................................... 18 2.2.1.2. Plate-supported specimen ................................................................................... 18 2.2.1.3. Blade-supported specimen .................................................................................. 18 2.2.1.4. Cylindrical geometry............................................................................................. 19 2.2.1.5. Corrugated specimen........................................................................................... 19 2.2.1.6. Comparison of different methods......................................................................... 19 2.2.1.7. RCT vs. SCT ........................................................................................................ 20
2.2.2. Edgewise compression strength testing of corrugated board ......................25
2.2.2.1. Methods avoiding edge failure of the specimen .................................................. 26 2.2.2.2. Methods using rectangular specimen to minimize edge damage........................ 27 2.2.2.3. Comparison of different test methods .................................................................. 27
2.3. Paper and board performance at high humidity ....................................... 29
2.3.1. Moisture content and the effect from changing environmental conditions...29
2.3.2. Paper moisture content and the effect on paper properties .........................30
2.3.2.1. Viscoelastic properties ......................................................................................... 32 2.3.2.2. Compression strength properties......................................................................... 34
2.3.3. Moisture-accelerated creep...........................................................................37
3. Experimental .............................................................. 39
3.1. Apparatus ................................................................................................ 39
Contents
vi
3.2. Experimental design ................................................................................ 40
3.3. Methods ................................................................................................... 42
4. Results and Discussions............................................ 44
4.1. Paper substrate and corrugated board physical properties...................... 44
4.2. Calculated board compression strength results ....................................... 45
4.3. Mathematical models correlating compression strengths of board and its
components........................................................................................................ 45
4.4. Mathematical models – corrugating plants specific.................................. 51
4.5. RCT vs. SCT............................................................................................ 53
4.6. Strength reduction after exposure to high humidity.................................. 54
5. Conclusions................................................................ 58
6. Reference List ............................................................ 63
Appendix 1 ...................................................................... 73
Appendix 2 ...................................................................... 75
Appendix 3 ...................................................................... 78
Appendix 4 ...................................................................... 81
Appendix 5 ...................................................................... 83
Appendix 6 ...................................................................... 85
List of Figures
vii
List of Figures
Figure 1. Distribution of compression load around the perimeter of a box (McKee et al., 1961)......... 5
Figure 2. Corrugated board showing component plate elements (Whitsitt, 1988) ............................. 10
Figure 3. Predicted ECT versus liner density (Popil et al., 2004)....................................................... 12
Figure 4. Compressive strength of linerboard in CD vs. basis weight using different testing methods
(Fellers, 1983) .................................................................................................................................... 20
Figure 5. (Whitsitt, 1985) ................................................................................................................... 22
Figure 6. Compressive strength index vs. grammage of hand sheets. The transition points from
flatness occur at different grammages for the high and low density samples (Dahl, 1985)............... 24
Figure 7. Comparison between different ECT test methods (Markstrom, 1999)................................ 28
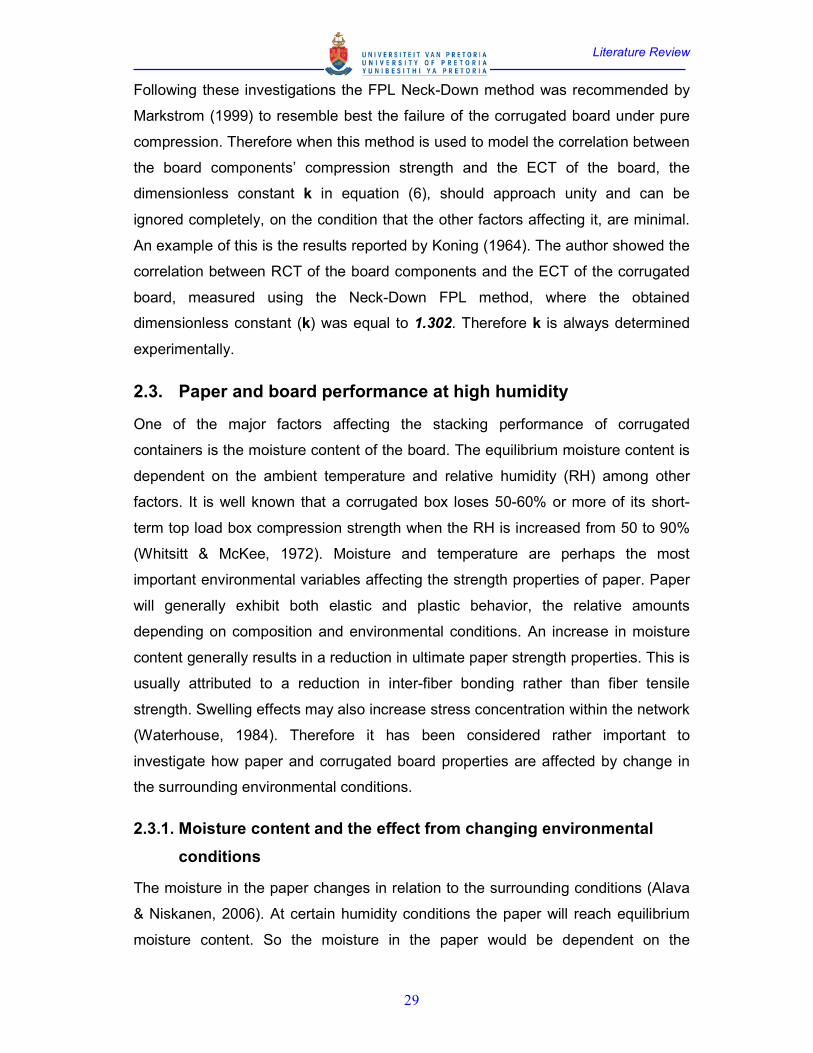
Figure 8. Moisture content of paper at different temperature when the relative humidity of ambient air
is varied (Prahl, 1968). ....................................................................................................................... 30
Figure 9. Effect of repeated humidity cycling on the dimension of paper in MD (Wink, 1961). ......... 31
Figure 10. Stress-strain curves in MD and CD of paperboard at RH=40%, 70% and 95%. The
corresponding moisture contents are 6.6%, 9.7% and 20% (Yeh, Considine & Suhling, 1991: 695)34
Figure 11. Average moisture content of linerboard and fluting grades at different relative humidity
and constant temperature (23ºC) as reported by Van Eperen and Robbins (1994). ......................... 35
Figure 12. The effect of moisture content on STFI SCT and RCT for all grades as reported by Van
Eperen and Robbins (1994). .............................................................................................................. 36
Figure 13. Relationship between loss of BCT strength and material moisture content. Initial BCT of
Box A – 5,560N and Box B – 6,290N (Boonyasarn et al., 1992). ...................................................... 37
Figure 14. Compressive creep at constant and cyclic humidity conditions (Gunderson & Tobey,
1990: 213-226). .................................................................................................................................. 38
Figure 15. Various types of corrugated board (Twede & Selke, 2005:407). ...................................... 40
Figure 16. Calculated (using paper components’ SCT and RCT results) vs. measured (using FEFCO
No.8 method) ECT results. ................................................................................................................. 46
Figure 17. Difference in board failure under compression when using FEFCO No.8 ECT test
method. Edge failure – left. Compression failure - right. .................................................................... 47
Figure 18. Calculated vs. measured ECT results of all board types (excl. sample 2) after exposure to
the two climatic conditions. Linear fits forced through the origin........................................................ 49
Figure 19. Calculated vs. measured ECT results divided into two sets – after exposure to standard,
as well as high RH conditions, for all corrugators, including all board types (excl. sample 2). Linear
fits forced through the origin. Correlation linear fits of all results as per figure 18 also included for
comparison. ........................................................................................................................................ 51
Figure 20. Calculated vs. measured ECT results divided into two sets – single and double wall board
for all corrugators, after exposure to the two climatic conditions (excl. sample 2). Linear fits forced
through the origin. Correlation linear fits of all results as per figure 18 also included for comparison.
............................................................................................................................................................ 51
List of Figures
viii
Figure 21. Calculated vs. measured ECT results per corrugating plant, including all board types
(excl. sample 2) and after exposure to the two climatic conditions. Linear fits forced through the
origin. ..................................................................................................................................................52
Figure 22. SCT vs. RCT linear fit obtained using the results for all papers tested after exposure to
the two climatic conditions, including 95% confidence intervals for some representative measured
values ................................................................................................................................................. 54
List of Tables
ix
List of Tables
Table 1. Fluting medium profile types (Twede & Selke, 2005:408-409) ............................................ 11
Table 2. Softening temperatures of dry material (Waterhouse, 1984). .............................................. 33
Table 3. Linear mathematical models for different board groups and exposure conditions. ............. 48
Table 4. Linear mathematical models for the different corrugating plants, compared to overall
models. ............................................................................................................................................... 53
Table 5. Average percentage reduction in SCT and RCT results after exposure of samples to high
relative humidity conditions. For reference the reduction in ECT of the board was 39.2% ............... 55
Table A1. Summary of literature reviewed mathematical models correlating board ECT and paper
propertiesIIIIIIIIIIIIIIIIIIIIIIIIIIIIIIIIIIIIII...73
Table A2. Summary of literature reviewed available compression strength test methods for
paper..IIIIIIIIIIIIIIIIIIIIIIIIIIIIIIIIIIIIIII....75
Table A3. Summary of literature reviewed available edgewise compression strength test methods for
board. IIIIIIIIIIIIIIIIIIIIIIIIIII...............................................78
Table A4. Apparatus available at Sappi Technology Centre and used for the experimental workI.81
Table A5. Paper substrate and corrugated board physical properties. .............................................83
Table A6. Calculated board compression strength results, using the Maltenfort model. ..................84
Table A7. Paper and corrugated board compression strength reduction after exposure to high
relative humidity conditions. IIIIIIIIIIIIIIIIIIIIIIIIIIIIII..85
Introduction
1
1. Introduction
As indicted by Markstrom (1999), the compression strength of any corrugated
board box is a direct measure of its stacking strength. The author also points that
the box compression strength constitutes a general measure of the performance
potential of a corrugated board package. The compression strength is measured
according to a standardized test method and is in general designated the BCT (Box
Compression Strength) value. Markstrom (1999) also warns that only 20-35% of the
measured BCT compression strength can be used reliably. Therefore safety factors
of between 3-5 times are always required. Even higher factors should be employed
where the packages are subject to several reloadings during transportation and
long storage times at changing climatic conditions.
However, McKee, Gander and Wachuta (1961) emphasized that the laboratory box
compression test is of limited utility for several reasons:
• During production of boxes, a considerable quantity may be manufactured
before it is known whether they meet the required strength specifications
• Testing of ready boxes increases the cost of the test and in some instances may
exceed the capacity of the testing equipment
• The test is generally not capable of distinguishing between the several factors
which contribute to box strength and in a case of inadequate box strength, it
may not be apparent whether the fault lies with the component liners or
corrugating medium, or the manufacture of the corrugated board, or the
conversion operations
• The box test is also so remote in time (and often location) from the manufacture
of paperboard and corrugated board as to be of only limited value in the
operations of the paper mill and corrugating plant
These limitations led to numerous studies, initiated from the work conducted by
McKee and Gander (1962), investigating which properties of the corrugated board
give the corrugated board box its compression strength. Further this was extended
to studies investigating, which properties of the substrates (papers) are critical to
achieve desired strength corrugated board. This research enabled testing and
Introduction
2
evaluation of paperboard materials in terms of those properties which are of direct
importance to the performance of the box.
It is therefore the aim of this research to provide predictive mathematical models to
the South African corrugating industry, correlating the measured compression
strength of corrugated board and its paper components, using standard testing
methods. This would allow packaging technologists in the field to select adequate
paper substrates, with certain strength characteristics, to manufacture corrugated
board with the necessary compression strength for achieving a desired carton
performance for certain climatic condition. Further, the study should establish
whether currently used paper compression strength testing methods for quality
control and assurance are in alignment with the end-users’ requirements for
sufficient box stacking strength.
Boxes are being transported at different climatic conditions stacked on top of each
other. When environmental conditions change as the goods are transported to
different geographical locations, the compression strength of the boxes changes. If
the strength is reduced, this would cause undesired collapse of the stack and
possible product damage. It is therefore important to determine whether paper
properties evaluations at different conditions could be correlated using
mathematical models to predict corrugated board performance, which would
consequently be transferred to performance of the box manufactured from these
combinations of paper boards.
The scope of this study includes:
• A comprehensive literature review on the topic;
• A review of the available paper and board compression test methods used in
the industry;
• Conducting a large number of paper combination compression strength
evaluations using the two most often utilized paper compression test methods –
STFI Short-span compression test (SCT) and Ring crush test (RCT), after
sufficient conditioning to standard and high relative humidity at 23ºC;
• Correlating the paper compression test results obtained, with the compression
performance of the manufactured from these paper combinations boards in

Introduction
3
terms of Edgewise crush test (ECT), using the FEFCO (No. 8) standard method,
after sufficient exposure to certain climatic conditions;
• Developing mathematical correlations between the paper and boards
compression strength at the different conditions;
• Comparison of the models obtained for the different corrugating plants
participating in the study;
Literature Review
4
2. Literature Review
2.1. Paper properties related to box stacking strength
2.1.1. Box compression strength
In the early 1920s, Rule 41 was introduced in the USA by the shipping industry to
establish liability for goods damaged during rail shipment (Gutmann, Nelson &
Yerke, 1993). If goods were shipped in a box which met Rule 41 specifications and
were damaged, the railway carrier was liable. If the box did not conform to Rule 41,
the shipper was liable. Under this original Rule 41, the most important requirement
for the box was that it contains and protects the shipped goods. The container
materials were designed primarily for bursting and puncture resistance. In recent
years, these parameters have lost some of their significance because of the
utilization of palletization, and stacking of the containerized purchased goods. This
often leads to the collapse of the bottom boxes and damage to their contents. To
evaluate the resistance of the containers against this type of damage, the box
crush test (BCT) for the manufactured box was introduced and accepted by many
manufacturers. These trends led to the revision of Rule 41 for USA rail shipment on
January 26, 1991, and Item 222 for the USA trucking industry on March 30, 1991,
to support the modern needs of the shipping industry. These regulations now focus
predominantly on stacking strength and puncture resistance.
It is well known that a corrugated box subjected to warehouse stacking will support
for a prolonged period only a relatively small fraction of the box compression
strength as determined by a laboratory box compression test (Whitsitt, Gander &
McKee, 1967). Therefore as indicated by Markstrom (1999) only 20-35% of the
measured short-term box compression strength can be used reliably and safety
factors of between 3-5 times are always required. The differences in box stacking
life depend in part on the perimeter of the box, as well as on the combined board
edgewise compression strength (ECT) and flexural rigidity. In general, the higher
the edgewise compression strength and flexural rigidity of the board, the higher the
box stacking strength.
Literature Review
5
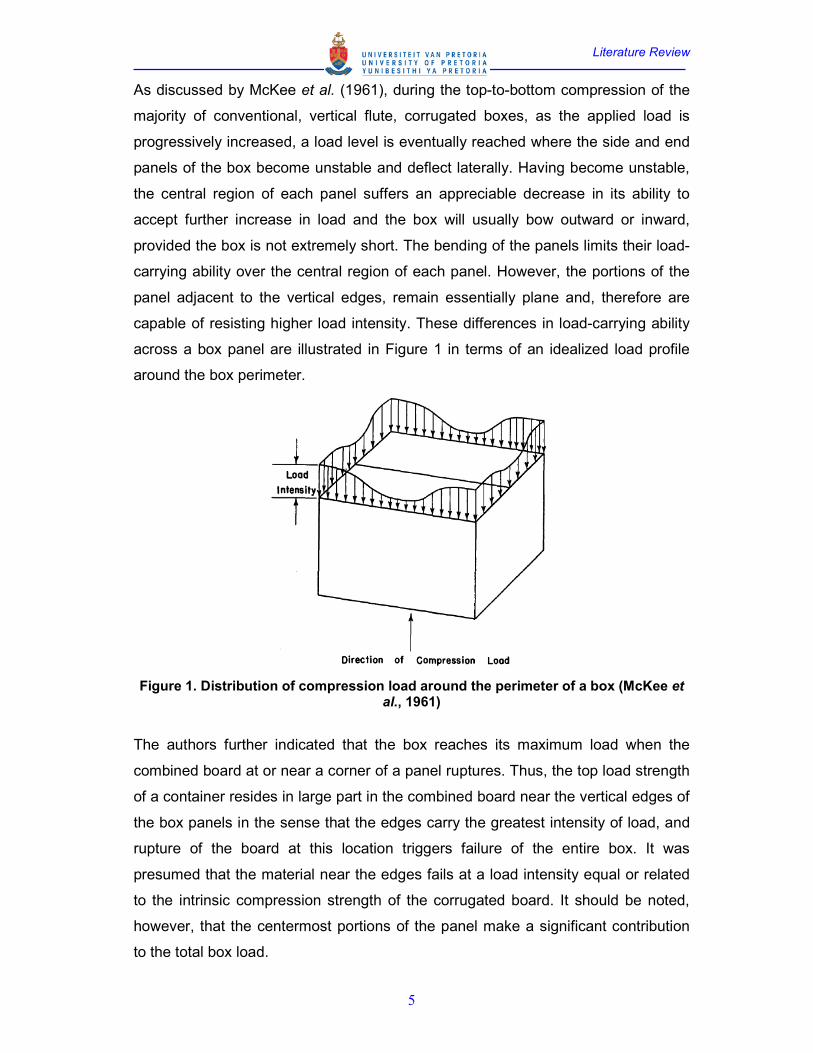
As discussed by McKee et al. (1961), during the top-to-bottom compression of the
majority of conventional, vertical flute, corrugated boxes, as the applied load is
progressively increased, a load level is eventually reached where the side and end
panels of the box become unstable and deflect laterally. Having become unstable,
the central region of each panel suffers an appreciable decrease in its ability to
accept further increase in load and the box will usually bow outward or inward,
provided the box is not extremely short. The bending of the panels limits their load-
carrying ability over the central region of each panel. However, the portions of the
panel adjacent to the vertical edges, remain essentially plane and, therefore are
capable of resisting higher load intensity. These differences in load-carrying ability
across a box panel are illustrated in Figure 1 in terms of an idealized load profile
around the box perimeter.
Figure 1. Distribution of compression load around the perimeter of a box (McKee et al., 1961)
The authors further indicated that the box reaches its maximum load when the
combined board at or near a corner of a panel ruptures. Thus, the top load strength
of a container resides in large part in the combined board near the vertical edges of
the box panels in the sense that the edges carry the greatest intensity of load, and
rupture of the board at this location triggers failure of the entire box. It was
presumed that the material near the edges fails at a load intensity equal or related
to the intrinsic compression strength of the corrugated board. It should be noted,
however, that the centermost portions of the panel make a significant contribution
to the total box load.
Literature Review
6
The top-load box compression strength is adequately expressed by the equation
(1), developed by McKee and Gander (1962):
P = 1.97.Pm0.753.sqrt(Dx.Dy)
0.247.Z0.506, when d/z>0.143 (1)
where:
P = box load [N]
Pm = edgewise compression strength per unit width of combined board in
cross-machine direction (wax-dip short column) – ECT, [N/m]
Dx = flexural stiffness per unit width of combined board in machine direction
(MD) (four-point beam), [Nm]
Dy = flexural stiffness per unit width of combined board in cross-machine
direction (CD) (four-point beam), [Nm]
Z = compression perimeter of the box, [m]
d = depth of the box, [m]
This formula indicates that the ECT of the combined board is a dominant factor in
top-load box compression strength. A percent increase in ECT-strength is expected
to contribute about three times greater increase in box compression strength (BCT)
as would the same percent increase in flexural stiffness and about 1-1/2 times the
same percent increase in box perimeter.
The BCT-method is generally acknowledged to be the best representation to
practical stacking strength of corrugated board boxes (Markstrom, 1999). The
method is pure top-to-bottom short-term load test, carried out on empty sealed
corrugated board boxes. These boxes are compressed between flat parallel plates
in a compression tester at constant compression rate. The force and strain are
continuously recorded until failure occurs. A number of standard test methods for
conducting BCT measurements are available, such as FEFCO (No. 50) and TAPPI
T804. The maximum load and deflection at failure are reported as BCT results. The
standard methods indicate that the test is conducted in a controlled environment of
50%RH at 23ºC.
Literature Review
7
As the corrugated box subjected to storage stacking will support only a fraction of
its short-term box compression strength for a prolonged period of time, a series of
studies by Whitsitt, Gander and McKee (1967&1968) were carried out, to provide
information relative to the stacking (creep) behavior of corrugated board and boxes.
In these investigations the deflection and time-to-failure of top-loaded empty boxes
were evaluated for a number of applied load levels expressed as a percentage of
their short-term compression strength (BCT). Even though large and statistically
significant differences in stacking life were reported by the authors, they found that:
• For the single-wall boxes the best multiple correlations obtained with all factors
statistically significant were as follows:
log(t) = 8.4762 - 9.81R - 0.0155Z + 0.0105Pm (2)
log(t) = 8.5255 - 9.47R - 0.0165Z + 0.00262sqrt(Dx.Dy) (3)
where
t = box stacking time, [days]
R = applied load ratio – (applied load/BCT)
Z = box perimeter, [in]
Pm = cross-machine combined board edgewise compression - ECT, [lb/in]
Dx = flexural stiffness per unit width of combined board in machine direction
(MD) (four-point beam), [lb/in]
Dy = flexural stiffness per unit width of combined board in cross-machine
direction (CD) (four-point beam), [lb/in]
The above reported findings indicated that box stacking life increases as
perimeter decreases, and ECT and board flexural stiffness increase. These
equations explained about 64% of the experimental variance in their studies,
thus the authors indicated that further studies are necessary to determine the
unexplained variance. They suggested that these variances are probably
associated with the large variability in box creep life within a given box sample,
as well as other factors such as boxes fabrication quality, differences in creep
behavior of the facings and mediums, etc.
Literature Review
8
• When single- and double-wall boxes were considered in their investigations, the
following regression equation (4) was reported with the best multiple correlation
with all factors statistically significant:
log(t) = 9.6862 - 10.68R - 0.0173Z (4)
where the symbols are as defined above. In this case, only Z and R were
significant factors.
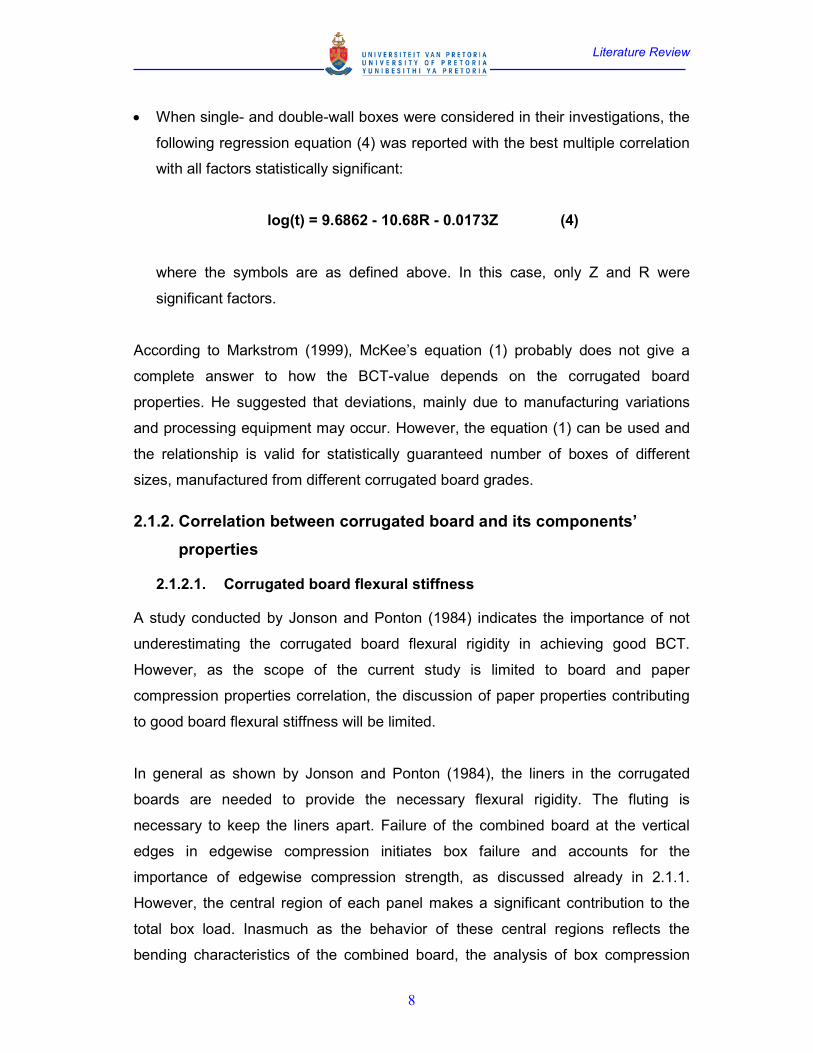
According to Markstrom (1999), McKee’s equation (1) probably does not give a
complete answer to how the BCT-value depends on the corrugated board
properties. He suggested that deviations, mainly due to manufacturing variations
and processing equipment may occur. However, the equation (1) can be used and
the relationship is valid for statistically guaranteed number of boxes of different
sizes, manufactured from different corrugated board grades.
2.1.2. Correlation between corrugated board and its components’
properties
2.1.2.1. Corrugated board flexural stiffness
A study conducted by Jonson and Ponton (1984) indicates the importance of not
underestimating the corrugated board flexural rigidity in achieving good BCT.
However, as the scope of the current study is limited to board and paper
compression properties correlation, the discussion of paper properties contributing
to good board flexural stiffness will be limited.
In general as shown by Jonson and Ponton (1984), the liners in the corrugated
boards are needed to provide the necessary flexural rigidity. The fluting is
necessary to keep the liners apart. Failure of the combined board at the vertical
edges in edgewise compression initiates box failure and accounts for the
importance of edgewise compression strength, as discussed already in 2.1.1.
However, the central region of each panel makes a significant contribution to the
total box load. Inasmuch as the behavior of these central regions reflects the
bending characteristics of the combined board, the analysis of box compression
Literature Review
9
strength involves consideration of the flexural stiffness of corrugated board.
Flexural stiffness is the capacity of a structural member to resist bending. In terms
of a simple beam, flexural stiffness is essentially the ratio of load to the deflection
produced by the load. The greater the flexural stiffness, the greater is the load
required to produce a given deflection, as investigated by McKee, Gander and
Wachuta (1962).
The combined board flexural stiffness in each direction is estimated by summing
the products of the elastic modulus of each component times its moment of inertia
relative to the neutral axis of the combined board, as widely discussed by Kellicutt
(1961), Koning and Moody (1971), and McKee et al. (1962). As a good
approximation, combined board stiffness is equal to EtH2/2 for a balanced
constructed board, where E is the elastic modulus of the liners, t is liner thickness,
and H is the combined board caliper (McKee et al.,1962). Thus, papermaking
factors which increase E in the appropriate direction of the liners and also their
thickness, will increase the combined board stiffness in that direction.
Combined board flexural stiffness is sensitive to the caliper of the combined board.
Thus, it is necessary to avoid crushing the board during conversion (Whitsitt, 1988).
The critical papermaking factors for the production of a good fluting grade should
be focused on achieving paper properties necessary to maintain maximum board
caliper for a selected fluting profile, i.e. the most important task of the fluting
medium in the corrugated board is to separate the two liners. The Corrugated
Medium Test (CMT), carried out on the fluting medium alone, is therefore
considered to be one of the most important quality properties of fluting material
(Markstrom, 1999).
2.1.2.2. Corrugated board edgewise compression strength
The relationship between the corrugated board edgewise compression strength
and its component characteristics has been analyzed in two main ways as reported
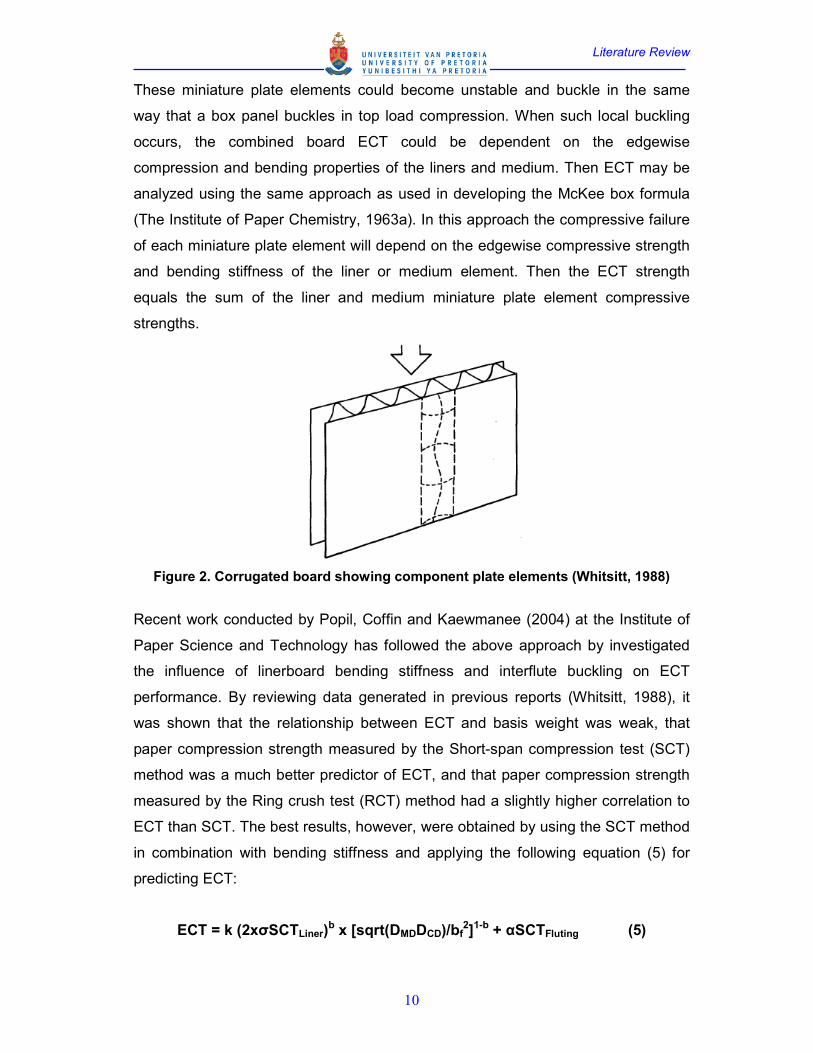
by Whitsitt (1988). In the first approach, the author commented that combined
board is treated as a structure comprised of narrow flat plate elements of liner
between flute tops and flat or curved plates of medium as shown in figure 2.
Literature Review
10
These miniature plate elements could become unstable and buckle in the same
way that a box panel buckles in top load compression. When such local buckling
occurs, the combined board ECT could be dependent on the edgewise
compression and bending properties of the liners and medium. Then ECT may be
analyzed using the same approach as used in developing the McKee box formula
(The Institute of Paper Chemistry, 1963a). In this approach the compressive failure
of each miniature plate element will depend on the edgewise compressive strength
and bending stiffness of the liner or medium element. Then the ECT strength
equals the sum of the liner and medium miniature plate element compressive
strengths.
Figure 2. Corrugated board showing component plate elements (Whitsitt, 1988)
Recent work conducted by Popil, Coffin and Kaewmanee (2004) at the Institute of
Paper Science and Technology has followed the above approach by investigated
the influence of linerboard bending stiffness and interflute buckling on ECT
performance. By reviewing data generated in previous reports (Whitsitt, 1988), it
was shown that the relationship between ECT and basis weight was weak, that
paper compression strength measured by the Short-span compression test (SCT)
method was a much better predictor of ECT, and that paper compression strength
measured by the Ring crush test (RCT) method had a slightly higher correlation to
ECT than SCT. The best results, however, were obtained by using the SCT method
in combination with bending stiffness and applying the following equation (5) for
predicting ECT:
ECT = k (2xσSCTLiner)b x [sqrt(DMDDCD)/bf
2]1-b + αSCTFluting (5)
Literature Review
11
Where SCT is the compression strength results of the liners and fluting medium
papers used for the construction of the board, measured using the short-span
compression paper test. The geometrical mean of the liners’ bending stiffness in
MD and CD is included as the square root of DMDDCD and it represents the flexural
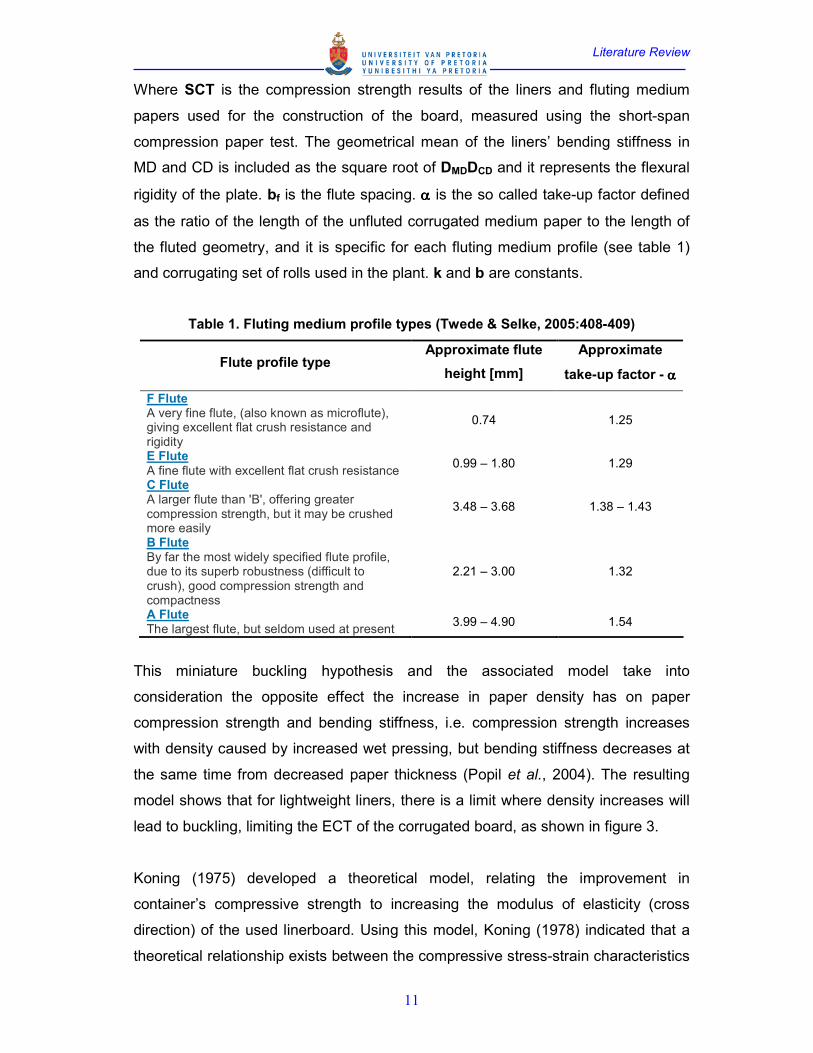
rigidity of the plate. bf is the flute spacing. αααα is the so called take-up factor defined
as the ratio of the length of the unfluted corrugated medium paper to the length of
the fluted geometry, and it is specific for each fluting medium profile (see table 1)
and corrugating set of rolls used in the plant. k and b are constants.
Table 1. Fluting medium profile types (Twede & Selke, 2005:408-409)
Flute profile type Approximate flute
height [mm]
Approximate
take-up factor - αααα
F Flute A very fine flute, (also known as microflute), giving excellent flat crush resistance and rigidity
0.74 1.25
E Flute
A fine flute with excellent flat crush resistance 0.99 – 1.80 1.29
C Flute A larger flute than 'B', offering greater compression strength, but it may be crushed more easily
3.48 – 3.68 1.38 – 1.43
B Flute By far the most widely specified flute profile, due to its superb robustness (difficult to crush), good compression strength and compactness
2.21 – 3.00 1.32
A Flute The largest flute, but seldom used at present
3.99 – 4.90 1.54
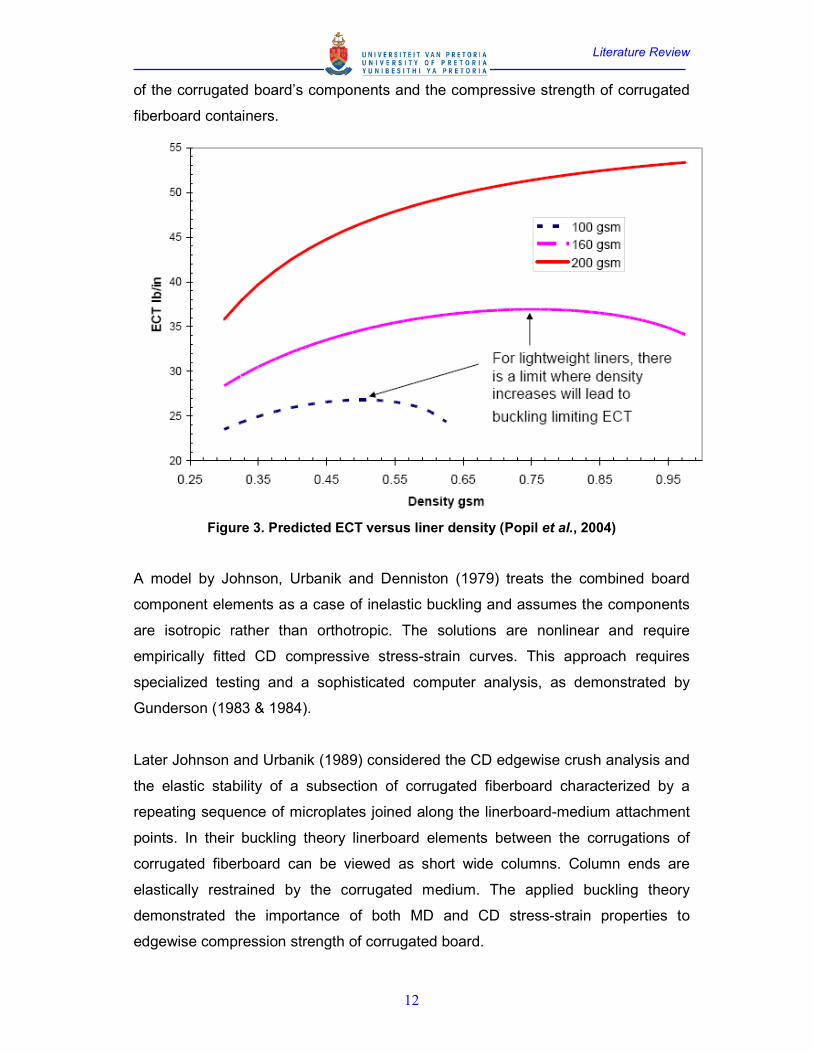
This miniature buckling hypothesis and the associated model take into
consideration the opposite effect the increase in paper density has on paper
compression strength and bending stiffness, i.e. compression strength increases
with density caused by increased wet pressing, but bending stiffness decreases at
the same time from decreased paper thickness (Popil et al., 2004). The resulting
model shows that for lightweight liners, there is a limit where density increases will
lead to buckling, limiting the ECT of the corrugated board, as shown in figure 3.
Koning (1975) developed a theoretical model, relating the improvement in
container’s compressive strength to increasing the modulus of elasticity (cross
direction) of the used linerboard. Using this model, Koning (1978) indicated that a
theoretical relationship exists between the compressive stress-strain characteristics
Literature Review
12
of the corrugated board’s components and the compressive strength of corrugated
fiberboard containers.
Figure 3. Predicted ECT versus liner density (Popil et al., 2004)
A model by Johnson, Urbanik and Denniston (1979) treats the combined board
component elements as a case of inelastic buckling and assumes the components
are isotropic rather than orthotropic. The solutions are nonlinear and require
empirically fitted CD compressive stress-strain curves. This approach requires
specialized testing and a sophisticated computer analysis, as demonstrated by
Gunderson (1983 & 1984).
Later Johnson and Urbanik (1989) considered the CD edgewise crush analysis and
the elastic stability of a subsection of corrugated fiberboard characterized by a
repeating sequence of microplates joined along the linerboard-medium attachment
points. In their buckling theory linerboard elements between the corrugations of
corrugated fiberboard can be viewed as short wide columns. Column ends are
elastically restrained by the corrugated medium. The applied buckling theory
demonstrated the importance of both MD and CD stress-strain properties to
edgewise compression strength of corrugated board.
Literature Review
13
The relationships between paper and board properties have become progressively
more complex as the models have been refined to take into account all of the
important structural and component characteristics. The model by Johnson et al.
(1979) is a good example, as commented by Van Eperen and Sprague (1983). Van
Eperen and Sprague (1983) indicated that such relationships are of great value for
research and development purposes, and may ultimately find a role in everyday
business. However, such models are too complicated for practical use.
The second and simplest approach reported by Whitsitt (1988) is to sum the
compressive strengths of the components (linerboards and medium) allowing for
the draw of the medium profile type (see table 1). This approach gives good
predictive accuracies if based on appropriate statistical weighting factors, and
therefore it would be used for the current study. The author further indicated that
the edgewise compressive strength of the board is also dependent on the quality of
corrugating converting.
The general format of the mathematical model to estimate the ECT of the board
from the compression strength of the liners and fluting medium is given by the so
called Maltenfort equation (6) (Markstrom, 1999):
ECT = k (σσσσc,L1 + σσσσc,L2 + ασασασασc,F) (6)
Where σσσσc is the compression strength of liners and fluting medium paper used for
the construction of the board. The paper industry employs different standardized
methods, which will be discussed later, to measure the compression strength of
paper, such as short-span compression test (SCT), ring crush test (RCT),
crush/Concora liner test (CLT) and corrugated crush test (CCT). αααα is again the so
called take-up factor of the specific fluting profile used (see table 1).
Theoretically the constant k should always be equal to unity, regardless of the
paper compression strength test used, but due to testing errors, limitations in the
test methods, as well as manufacturing variables at the corrugating plants, the
challenge is to find a more representative value, which would assist in predicting
Literature Review
14
more accurately the board and consequent box performance. Also the above
statement for k being equal to unity would be only valid if the strain to failure is
equal for both liner and fluting medium, and this is seldom the case (Markstrom,
1999).
Whitsitt and Sprague (1986) investigated and presented the factors affecting the
retention of compressive strength during fluting, i.e. the impact of the fluting
process on the constant – k. Their results indicate that 15-20% of the ECT potential
of corrugated board is lost during the fluting process. This occurs because the
fluting process causes large reductions in the edgewise compressive strength of
the medium, under both hot and cold forming conditions. The reductions in strength
are caused by the high bending and tension stresses induced in the medium paper
during fluting. During the process the medium is exposed to high stresses. If these
stresses are too high, visible fractures of the medium will occur and the board will
be useless. At lower stress levels visible fracturing will cease, but their research
showed that there is still heavy damage to the medium, resulting in a serious loss of
end-use performance.
The paperboards are also subjected to steaming during manufacture, which
relieves built-in stresses in the sheet (Seth, 1985). This can reduce the elastic
modulus and compressive strength of the sheet by 5-15%. Since the paper
components are sampled before they have been subjected to any treatment, it
should not be surprising to find that their combined strength is higher than that of
the corrugated board made from them. The extent of the damage to paperboard
resulting from manufacturing conditions is difficult to determine, but Seth (1985)
indicated that it would be different for different plants, and within a plant, different
for different flute types.
Seth (1985), when developing similar ECT correlation models, indicated that it can
be expected the ECT of the corrugated board measured by the column-crush test
would be lower than the sum of the strengths of the components measured by
short-span compression test method (SCT), used in his investigation, because the
initiation of failure is not only governed by the presence of defects, but also by the
component that has the minimum resistance to failure.
Literature Review
15
A further influence on k is that the measurement of combined-board ECT is prone
to error in specimen preparation and testing procedures and this could result in
lower strength values (Koning, 1983: 385-408 and Ericksson, 1979a&b). The
strength of the board and papers are also measured at different strain rates, as
noted by Seth (1985). The author indicated that a precise comparison is difficult,
but it is reasonable to assume that the rate for paper compression in SCT method
is an order of magnitude higher. The combined board strength, measured at a
comparably higher rate, could probably be 10% higher (Moody & Koning, 1966).
The sizes of the samples used for the measurements of ECT of combined boards
and SCT for paper components also could affect the results (Seth, 1985). While
edgewise compression strength of combined board is measured on specimens of
finite length (ECT methods to be further discussed in Paragraph 2.2.2.), the
strength of the board’s components is measured on test spans that are only 0.7 mm
long (when using the SCT method to be discussed later). In a comparison of the
short and finite-span methods for measuring the SCT of paper, Seth (1983) showed
that the short-span method gives results that are generally between 15-30% higher
than the finite-span method. This discrepancy can be explained by the different
boundary conditions for stresses in the two samples and by the higher chance of
initiation of failure by defects in the longer sample, as discussed by the author.
Ericksson (1979a&b) pointed out that 20-30% higher ECT values are obtained if
instead of waxing (to be discussed later), the edges of the combined board test
pieces are reinforced by attaching four pieces of linerboards onto the facings of the
sample with pressure sensitive tape, leaving 2-3 mm of free span in the middle.
These higher ECT values correspond well to the sum of the intrinsic strengths of
the components.
Further, the equation (6) format shows linear relationship between the corrugated
board and its components’ intrinsic compression strength with y-intercept equal to
0. However, the extensive literature review revealed that different experimental
determinations of these relationships show different y-intercept (a) values
depending on the testing methods used:
Literature Review
16
ECT = k (σc,L1 + σc,L2 + ασc,F) + a (7)
Y-intercept cannot be explained physically, i.e. if no compression is provided by the
paper components, the board should have no compression strength. However,
most authors of such models used the experimentally obtained data and forced the
linear fits to intercept the y-axis at 0, still retaining statistically significant
mathematical fits and high degree of correlation.
Also sometimes data analysis shows that the ratio of edgewise compression
strength of board to board components’ compression strength is curved so much so
that a single straight line formula does not fit the data in a satisfactory fashion. An
appropriate nonlinear relationship would describe the data better than a straight
line. To preserve simplicity, authors such as Van Eperen and Sprague (1983) have
chosen to divide the grade range into two parts, and fit each with a straight line
formula, depending on the paper components’ basis weight (thickness/density).
However, Popil et al. (2004) indicated that this is the direct result of low bending
stiffness and an increased tendency of interflute buckling prevalent with lightweight
linerboards. The authors further comment that since Van Eperen and Sprague
(1983) completed their work, high ring crush linerboards have become common.
The increase in vertical compression strength per unit weight has been achieved
primarily through wet pressing. This has resulted in increased densification, but
lower bending stiffness as also commented above. The outcome resulting in a
greater proclivity of interflute buckling with the current lightweight linerboards.
The models found in literature are summarized and shown in Appendix 1. It can be
seen that compression strength of corrugated board and its components can be
measured by different techniques, and simple models could be then fitted to
correlate these properties. Caution should be always exercised when using this
approach, because of the influence of the board manufacturing process. However,
predicted ECT values from the component properties should be a good indication
of the strength potential of the board in compression (Steadman, 2002: 622-623).
Literature Review
17
2.2. Paper and board compression test methods
2.2.1. Edgewise compression strength testing of paper
As already indicated above, in order to develop a representative mathematical
model correlating the compression strengths of board and its components, an
adequate paper testing method should be utilized. Any deficiencies and errors,
resulting from the testing methods used to generate the data for the models, are
integrated in the dimensionless constant – k, evident in all existing models, as
already discussed in paragraph 2.1.2.2.
In general two principally different uses for edgewise compression test of single
paper sheets can be identified (Fellers & Donner, 2002: 481-521). The first use is
for quality control in paper mills and quality acceptance in corrugating and box
plants. For such applications the test method must be precise and correlate to the
performance of the boards, i.e. k should approach unity, as well as it has to be
simple, rapid and reproducible over time. The second use is as a research and
development tool, where the method would be used to design and optimize
products’ performance. As indicated by the authors, the method for the second use
should be based on fundamental principles of mechanics.
The currently available paper compression test methods produce results that can
differ 30% or more for the same material (Fellers & Donner, 2002: 481-521).
Therefore it has been considered necessary to discuss this here in more details, as
the influence the paper testing method would have on the mathematical correlation
and on the constant k in particular, would be largely dependent on the paper testing
method selection.
According to Fellers and Donner (2002: 481-521), the main challenge for all
compression strength tests of paper is to introduce a compressive force into the
plane of the sheet in a way that causes a pure in-plane compression deformation
and failure. Often out-of-plane bending and buckling is evident. This problem is
overcome to some extent by either using a short span, by supporting the specimen
against out-of-plane deformations or by selecting proper specimen geometry. The
Literature Review
18
principle of load application and specimen geometry for the different test methods
are shown in Appendix 2.
2.2.1.1. Short-span specimen geometry
The basic principle behind the short-span specimen geometry is to use such a short
span, that crushing of the specimen occurs before any buckling of the paper strip
takes place. The Concora liner test (CLT) (Maltenfort, 1956) and STFI SCT (Fellers
& Jonsson, 1975) are examples of methods currently used in accordance with this
principle.
2.2.1.2. Plate-supported specimen
The short-span compression test is able to simply provide a measure of the
material compression strength, but the influence of the clamps prevents the
measurement of stiffness properties. Stress-strain characteristics in compression,
however, can be evaluated with the sheet restrained on each side by solid metal
plates. The main problem with this commercially unavailable test is the
development of small-amplitude waves, when a single sheet (especially thin paper)
is laterally supported. This can be minimized by applying lateral support when
closing down the clearance between the solid metal plates. Friction is then a
concern and often lubricants are used. Three different methods based on this
principle have been developed for determination of stress-strain curve of papers in
compression – STFI Solid support test (Fellers et al., 1980), PPRIC Plate support
test (Seth & Soszynski, 1979) and FPL Lateral support test (Jackson, Koning &
Gatz, 1978).
2.2.1.3. Blade-supported specimen
By providing lateral support using slender blades with very short distance in
between, buckling prevention of the sample can also be achieved. Stress-strain
curves in compression can also be obtained. However, certain problems such as
blades misalignment, rough paper surface, as well as difficulties in use were
reported as major shortcomings. The following tests using this approach were
reported - STFI Blade Support Test (Cavlin & Fellers, 1945), Weyerhauser Lateral
Support Test (Stockmann, 1976) and FPL Vacuum Restraint (Gunderson, 1983).
Literature Review
19
2.2.1.4. Cylindrical geometry
The cylindrical geometry allows for stability of the specimen when loading in the
plane of the sheet. However, one concern with this principle is the support of the
loaded edges, which can fail. The other problem is associated with the creation of
seam when forming the rolled geometry. Some methods using this approach utilize
adhesive to overcome the presence of the seam. The following test methods using
cylindrical geometry are known – Ring Crush Test, IPC-Modified Ring Crush Test
(The Institute of Paper Chemistry, 1963b) and FPL Supported Cylinder Test
(Setterholm & Gertjejansen, 1965).
2.2.1.5. Corrugated specimen
The principle of these methods is to simulate the corrugated shape of the fluting
medium in corrugated board. It is therefore used to evaluate the contribution of the
medium to the compression strength of the combined board. Edge crushing is also
problematic. Different methods utilizing this principle exist – Concora Fluted Crush
Test (Maltenfort, 1956), H&D Stiffness Test (Ostrowski, 1960) and Corrugated
Crush Test (Langaard, 1968).
2.2.1.6. Comparison of different methods
A study was undertaken at the Institute of Paper Chemistry by Kloth, Whitsitt and
Fox in 1977, to comparatively evaluate six methods of measuring the CD edgewise
compression strength of linerboard and corrugating medium. The methods were
compared in terms of maximum load, test variability, correlation to combined board
edgewise compression strength, correlation to each other, and relative ease of
testing. The compression test methods studied were Regular ring crush test,
Modified ring crush test, Liner edge crush test (LECT) - similar to Concora liner test,
Concora fluted crush (CFC) - medium only, FPL lateral support compression test
and Weyerhaeuser lateral support compression test. The RCT and LECT/CFC tests
have advantages for quality control purposes considering they are the easiest tests
to use and relate well to the ECT-strength of combined board. Until the question of
frictional interference between the specimen and the sides of the FPL fixture can be
resolved, it appears that the Weyerhaeuser lateral support test is the one most
suitable for research purposes.
Literature Review
20
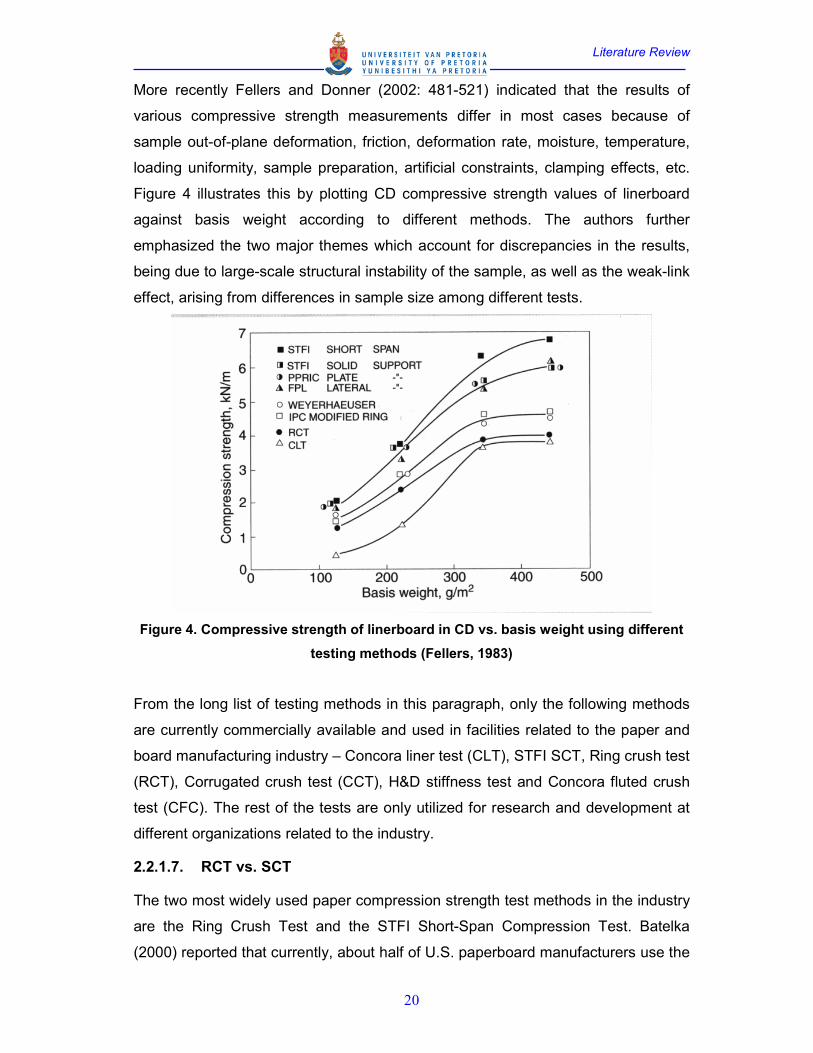
More recently Fellers and Donner (2002: 481-521) indicated that the results of
various compressive strength measurements differ in most cases because of
sample out-of-plane deformation, friction, deformation rate, moisture, temperature,
loading uniformity, sample preparation, artificial constraints, clamping effects, etc.
Figure 4 illustrates this by plotting CD compressive strength values of linerboard
against basis weight according to different methods. The authors further
emphasized the two major themes which account for discrepancies in the results,
being due to large-scale structural instability of the sample, as well as the weak-link
effect, arising from differences in sample size among different tests.
Figure 4. Compressive strength of linerboard in CD vs. basis weight using different
testing methods (Fellers, 1983)
From the long list of testing methods in this paragraph, only the following methods
are currently commercially available and used in facilities related to the paper and
board manufacturing industry – Concora liner test (CLT), STFI SCT, Ring crush test
(RCT), Corrugated crush test (CCT), H&D stiffness test and Concora fluted crush
test (CFC). The rest of the tests are only utilized for research and development at
different organizations related to the industry.
2.2.1.7. RCT vs. SCT
The two most widely used paper compression strength test methods in the industry
are the Ring Crush Test and the STFI Short-Span Compression Test. Batelka
(2000) reported that currently, about half of U.S. paperboard manufacturers use the
Literature Review
21
RCT method and about half use the STFI SCT method. The RCT is also commonly
used test in the Australian paperboard industry (Jackson & Parker, 1998). The
authors commented that the RCT is a more relevant indicator of box stacking
performance than SCT. In the same time, Fellers and Donner (2002: 481-521)
identified a number of deficiencies associated with the RCT method. However,
despite these problems with the RCT method, it is still used widely for control
purposes. Therefore for the purpose of this study, it was decided to further
investigate these limitations.
The analysis conducted by many authors, including Seth (1984), Dahl (1985),
Rennie (1995), Batelka (2000), Ju, Gurnagul and Shallhorn (2005), Frank (2003 &
2007) demonstrate that:
• the RCT and the STFI SCT are not interchangeable test methods;
• the failure mode is not the same for the two tests;
• the tests are measuring different compressive strength properties of the
paperboard affected by different paper mill process changes;
• a universal formula to convert SCT to RCT has failed because there is no
simple relationship between the two values as they are dependent on furnish
and the type of forming equipment used;
Also according to Whitsitt (1985):
• the STFI SCT is coming into wider use;
• the SCT is simpler, more accurate and appears to have many advantages;
• ring crush is a more complex test than the short span type test because of its
cylindrical geometry;
• there are also differences in mode of failure, as commented by the other
authors;
In ring crush tests on lightweight materials failure occurs by buckling. On heavy
weight materials failure occurs at the loaded edges, which are weakened by cutting
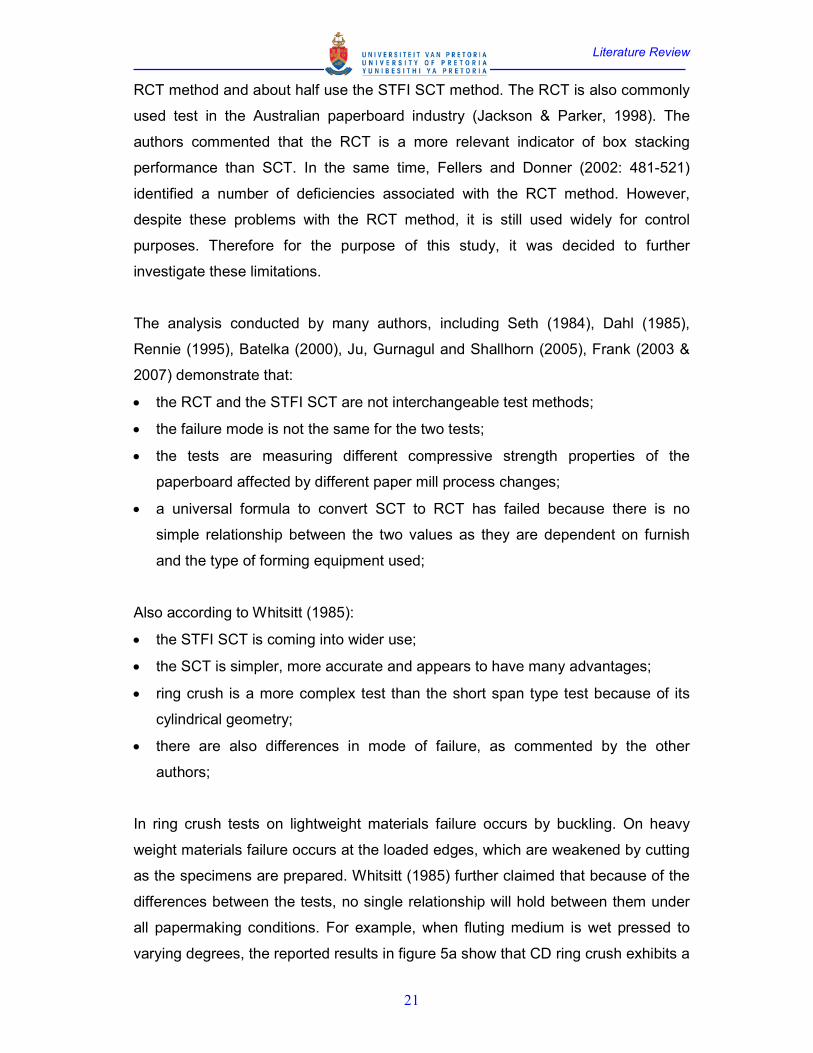
as the specimens are prepared. Whitsitt (1985) further claimed that because of the
differences between the tests, no single relationship will hold between them under
all papermaking conditions. For example, when fluting medium is wet pressed to
varying degrees, the reported results in figure 5a show that CD ring crush exhibits a
Literature Review
22
maximum at intermediate densities of around 750-850kg/m³, whereas the STFI
SCT results increase steadily over the density range. The ECT results achieved
with these mediums increased in the same way as the STFI SCT results, as shown
in figure 5b. Thus the STFI SCT results were more indicative of the fluting medium
contribution to ECT, than the RCT results.
(a) (b)
Figure 5. (Whitsitt, 1985)
(a)SCTCD and RCTCD show different trends with increasing density for 195gsm fluting
(b) Wet pressing increases the ECT of combined board
Batelka (2000) further commented that the relative technical merits of the two test
methods have, to date, been based on speculation. He suggested that what is
needed by the industry is a well designed, objective, thorough, and scientifically
correct investigation to define conclusively whether the RCT or the STFI SCT is the
technically correct test method to use to predict accurately and precisely the end
use compression strength performance of paperboard materials (ECT and BCT).
Seth (1984) pointed out that the RCT method does not measure the true intrinsic
edgewise compressive strength (IECS), important for ECT development. In view of
his results and the increased importance of compressive strength of linerboard and
medium in container design, he recommended that tests, such as the RCT should
not be used. The author indicated that the RCT results depend on both the
compressive strength of the sheet and stiffness of the specimen structure. He
recommended the use of compression test that measures the true potential of the
sheet under edgewise compression, such as the STFI SCT.
Literature Review
23
In opposition to this, Frank (2007) showed that RCT and SCT tests can be both
used to evaluate the compression strength of corrugated board components, and
can be correlated with combined board strength (ECT). The author demonstrated
that because each test evaluates paper strength at a different length scale, the
correlations are not of equal quality. Earlier, Frank (2003) showed that once the
effect of paper basis weight is excluded, the correlation between SCT and RCT
results is largely lost in the noise. This noise, or measurement variability,
significantly influences which test can better predict combined board performance.
Frank (2003 & 2007) found that even though SCT measures a more fundamental
paper property, the RCT correlates somewhat better with ECT strength, even when
smaller number of testing paper specimens is used to measure the paper
compression strength. This was again related to the difference in failure mechanism
within each paper test in relationship to the failure length scales in combined board,
as well as to the level of noise. Therefore the RCT appears to serve as a better
predictor of final board performance.
Rennie (1995) showed that RCT and SCT results can be correlated well, if the
bending stiffness (T) and thickness of the paper (t) is included in an empirical
model:
SCT = RCT + 0.005T/t2 (8)
Dahl (1985) indicated that normalization of strength test results to unit mass of
sample is a good method for data presentation. The author aimed to define paper
compression property parameter independent of basis weight over a reasonable
range. The compressive strength results of his study, indexed to grammage, are
plotted against grammage in figure 6, to serve as an aid in determining which
weights of paper might be unsuitable for RCT testing. For indexed results in the
legitimate test range, the data points should form a flat horizontal curve for that
domain. The obtained results point out that over the full range the STFI SCT index
curves are essentially flat and the ring crush curves are not. For the low density
hand sheets, the ring crush index (RCI) curve shows a level region for grammages
greater than 150 g/m2. Below 150 g/m2, the RCI values decrease and suggest that
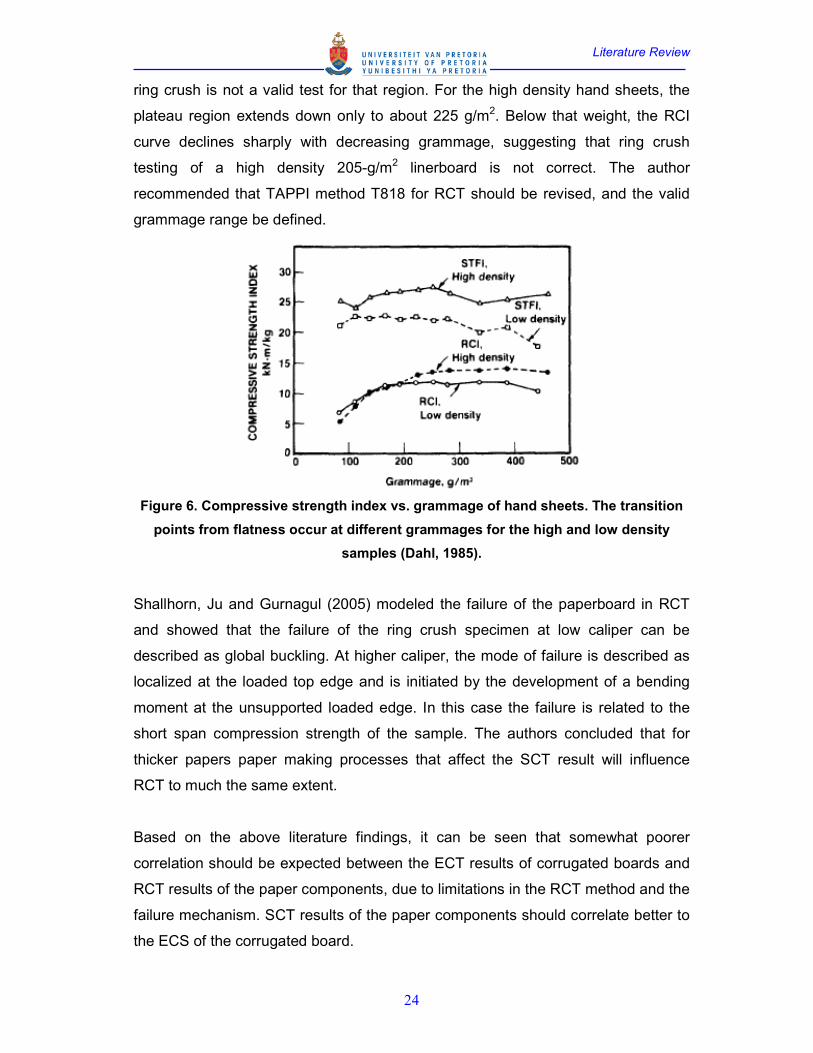
Literature Review
24
ring crush is not a valid test for that region. For the high density hand sheets, the
plateau region extends down only to about 225 g/m2. Below that weight, the RCI
curve declines sharply with decreasing grammage, suggesting that ring crush
testing of a high density 205-g/m2 linerboard is not correct. The author
recommended that TAPPI method T818 for RCT should be revised, and the valid
grammage range be defined.
Figure 6. Compressive strength index vs. grammage of hand sheets. The transition
points from flatness occur at different grammages for the high and low density
samples (Dahl, 1985).
Shallhorn, Ju and Gurnagul (2005) modeled the failure of the paperboard in RCT
and showed that the failure of the ring crush specimen at low caliper can be
described as global buckling. At higher caliper, the mode of failure is described as
localized at the loaded top edge and is initiated by the development of a bending
moment at the unsupported loaded edge. In this case the failure is related to the
short span compression strength of the sample. The authors concluded that for
thicker papers paper making processes that affect the SCT result will influence
RCT to much the same extent.
Based on the above literature findings, it can be seen that somewhat poorer
correlation should be expected between the ECT results of corrugated boards and
RCT results of the paper components, due to limitations in the RCT method and the
failure mechanism. SCT results of the paper components should correlate better to
the ECS of the corrugated board.
Literature Review
25
2.2.2. Edgewise compression strength testing of corrugated board
The edgewise compressive strength (ECS), (also called edgewise crush resistance
or ECT-strength), of corrugated board was defined by Markstrom (1999) as the
maximum compression force that a test piece will sustain without any failure
occurring. There are a number of different test methods for ECT measurement (see
Appendix 3). The various test methods are fundamentally similar – a test specimen
of corrugated board is placed between the platens of a compression or crush tester
with the flutes oriented vertically. The specimen is subject to an increasing
compressive force until it fails (Steadman, 2002: 622-623). The maximum force at
failure expressed per unit length of the specimen is recorded as the ECT result of
the board. However, Markstrom (1999) emphasized that differences of up to 30%
can be seen between the results obtained by the different methods. This is very
unsatisfactory, because it is expected the results from the different methods to lead
to similar values of board compression strength. On the positive side, the author
noted that at least the different methods rank the different boards in the same
order. Also to have a good and acceptable edgewise compression strength testing
method, the following must be in place:
• Measures what is intended to measure, i.e. pure compression strength of the
whole corrugated test piece;
• Is accurate and reproducible;
• Is easy to perform as a routine method in a corrugated board laboratory;
A study conducted by the Institute of Paper Chemistry (1965) reported that the
mechanical properties of fiberboard are also sensitive to rate of application of stress
or strain, requiring consideration of test rates for formulating test procedures. It was
shown that a definite trend of an increase in edgewise compression strength with
increase in test rate is evident, as may be anticipated for viscoelastic materials.
The different methods available differ mainly by sample geometry and dimensions,
the cutting equipment used for board preparation, the rate of loading, and the use
of edge reinforcement. According to Steadman (2002: 622-623), the test methods
can be categorized into two main groups:
Literature Review
26
2.2.2.1. Methods avoiding edge failure of the specimen
This group includes the Edge reinforcement method, known as TAPPI T811, the
Neck-Down method (TAPPI T838), the Edge clamping method (TAPPI T839), the
Japanese industrial standard (JIS Z-0401) and some others (see Appendix 3).
In the TAPPI T8II, which is the only test method approved for the alternative Rule
41/Item222 (Gutmann et al., 1993), the specimen is cut to maintain suitable
slenderness ratio, preventing sample buckling and ensuring the specimen failure
under pure compression (see paragraph 2.2.1.1.). The loaded edges of the
specimen are reinforced by dipping them in molten wax. However, this procedure of
sample preparation is tedious and time-consuming, thus not meeting one of the
criteria set above for good ECS test method.
The Neck-Down specimen method introduced by Koning (1964) has been used
very successfully in a number of research projects at the Forest Products
Laboratory (FPL). The test however, has not yet spread widely, due to the fact that
equipment for test-piece preparation has not been commercially available until
recently. The method is considered to meet all three criteria for suitable ECS
method, since the development of an extremely simple and rational method which
produces circular neck-down test pieces with great accuracy.
TAPPI T839 eliminates the use of edge waxing by using a clamp to reinforce the
edges. It effectively clamps the upper and the lower 20mm of the specimen, leaving
an unsupported span of approximately 10mm in the center. However, it has been
shown that the clamping force is extremely critical and that it must be adapted for
different flute grades. It is also in exceptional circumstances that the edge
compression failure can be avoided by this method (Markstrom, 1999). This method
does not meet with certainty any of the three criteria for a good testing method.
The JIS Z-0401 method builds upon the same principle as the above mentioned
clamping method. This method also is distinguished by the fact that the specimen
has been cut with a sharp waist. Cutting of the samples is complicated and the
method does not necessarily measure what is intended to measure – pure ECS
(Markstrom, 1999).
Literature Review
27
Other alternatives have also been proposed with small modifications to the above
methods, but have not gained much popularity due to not meeting the suitability for
testing methodology. Some of these methods include – the Morris Clamping
method - TAPPI T841 (Maltenfort, 1988), Reinforced Liners method (Eriksson,
1979a&b) and Long Span method (Westerlind & Carlsson, 1992).
2.2.2.2. Methods using rectangular specimen to minimize edge damage
This group includes the SCAN (P33:71), FEFCO (No. 8) and ISO (3037:1994)
standard methods, which specify different specimen sizes with no edge
reinforcement (see Appendix 3). The specimen is supported between two blocks to
keep it perpendicular to the platens of the compression tester during the initial
loading (Steadman, 2002: 622-623).
The FEFCO (No. 8) method has spread widely in Europe, although this method
does not try to avoid edge failure. It is now known that generally the test result
depends to a great extent on whether or not the edge surfaces of the test piece are
parallel (Markstrom, 1999).
2.2.2.3. Comparison of different test methods
A study, initiated by Schrampfer, Whitsitt and Baum in 1987, was directed toward
improving ECT measurement technology by developing a safer, simpler, and more
efficient method of sample preparation and testing. Three alternate ECT
procedures involving several types of sample cutters and holders were compared to
the standard TAPPI T811 method. The Japanese ECT test fixture was used in
combination with a 2-inch Billerud cutter, and it was found to compare the most
favorably with the TAPPI method. Results obtained with the original hand tightened
version of the fixture showed excellent agreement with TAPPI results, and exhibited
lower variability. Later work with a spring-operated version of the fixture showed
ECT results to be sensitive to clamping pressure. Double wall board and high
series single-wall board required a higher clamping pressure to achieve good
comparison with TAPPI results. An easy-to-use design involving the original fixture
fitted with the appropriate springs has been recommended. The two other ECT
procedures investigated included a SCAN-method/Billerud cutter combination and
a Weyerhaeuser holder/Weyerhaeuser cutter combination. ECT results were
Literature Review
28
considerably lower than TAPPI values using these methods. Sample height was
also investigated and found to have no effect on ECT in the range of 1.5-2.0inches.
Several types of rigid-platen compression testing machines were compared to the
flexible-platen H&D compression testing machine, and no significant difference in
ECT results was detected.
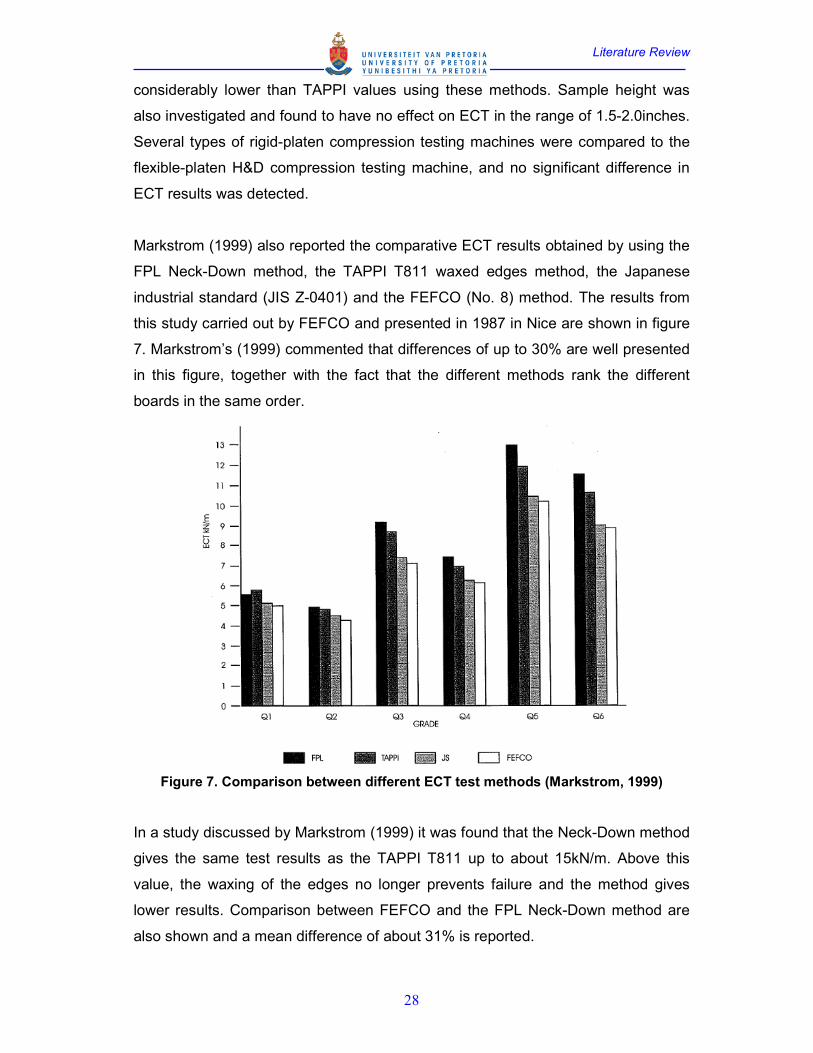
Markstrom (1999) also reported the comparative ECT results obtained by using the
FPL Neck-Down method, the TAPPI T811 waxed edges method, the Japanese
industrial standard (JIS Z-0401) and the FEFCO (No. 8) method. The results from
this study carried out by FEFCO and presented in 1987 in Nice are shown in figure
7. Markstrom’s (1999) commented that differences of up to 30% are well presented
in this figure, together with the fact that the different methods rank the different
boards in the same order.
Figure 7. Comparison between different ECT test methods (Markstrom, 1999)
In a study discussed by Markstrom (1999) it was found that the Neck-Down method
gives the same test results as the TAPPI T811 up to about 15kN/m. Above this
value, the waxing of the edges no longer prevents failure and the method gives
lower results. Comparison between FEFCO and the FPL Neck-Down method are
also shown and a mean difference of about 31% is reported.
Literature Review
29
Following these investigations the FPL Neck-Down method was recommended by
Markstrom (1999) to resemble best the failure of the corrugated board under pure
compression. Therefore when this method is used to model the correlation between
the board components’ compression strength and the ECT of the board, the
dimensionless constant k in equation (6), should approach unity and can be
ignored completely, on the condition that the other factors affecting it, are minimal.
An example of this is the results reported by Koning (1964). The author showed the
correlation between RCT of the board components and the ECT of the corrugated
board, measured using the Neck-Down FPL method, where the obtained
dimensionless constant (k) was equal to 1.302. Therefore k is always determined
experimentally.
2.3. Paper and board performance at high humidity
One of the major factors affecting the stacking performance of corrugated
containers is the moisture content of the board. The equilibrium moisture content is
dependent on the ambient temperature and relative humidity (RH) among other
factors. It is well known that a corrugated box loses 50-60% or more of its short-
term top load box compression strength when the RH is increased from 50 to 90%
(Whitsitt & McKee, 1972). Moisture and temperature are perhaps the most
important environmental variables affecting the strength properties of paper. Paper
will generally exhibit both elastic and plastic behavior, the relative amounts
depending on composition and environmental conditions. An increase in moisture
content generally results in a reduction in ultimate paper strength properties. This is
usually attributed to a reduction in inter-fiber bonding rather than fiber tensile
strength. Swelling effects may also increase stress concentration within the network
(Waterhouse, 1984). Therefore it has been considered rather important to
investigate how paper and corrugated board properties are affected by change in
the surrounding environmental conditions.
2.3.1. Moisture content and the effect from changing environmental
conditions
The moisture in the paper changes in relation to the surrounding conditions (Alava
& Niskanen, 2006). At certain humidity conditions the paper will reach equilibrium
moisture content. So the moisture in the paper would be dependent on the
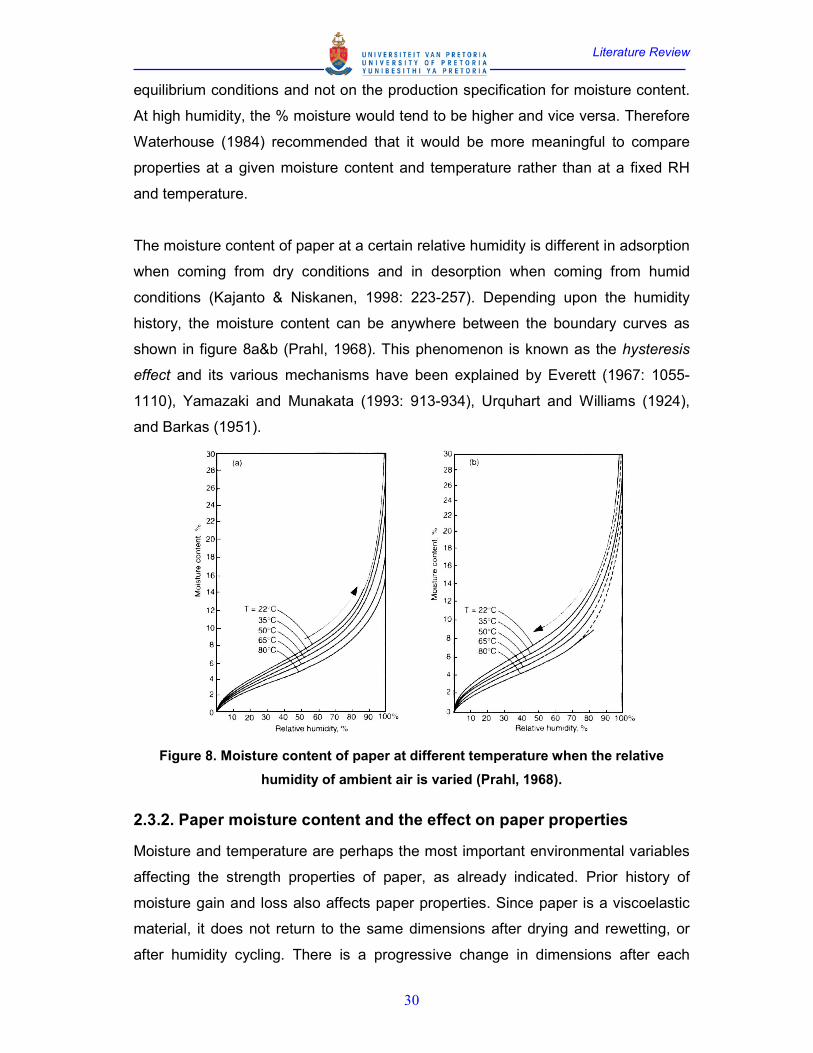
Literature Review
30
equilibrium conditions and not on the production specification for moisture content.
At high humidity, the % moisture would tend to be higher and vice versa. Therefore
Waterhouse (1984) recommended that it would be more meaningful to compare
properties at a given moisture content and temperature rather than at a fixed RH
and temperature.
The moisture content of paper at a certain relative humidity is different in adsorption
when coming from dry conditions and in desorption when coming from humid
conditions (Kajanto & Niskanen, 1998: 223-257). Depending upon the humidity
history, the moisture content can be anywhere between the boundary curves as
shown in figure 8a&b (Prahl, 1968). This phenomenon is known as the hysteresis
effect and its various mechanisms have been explained by Everett (1967: 1055-
1110), Yamazaki and Munakata (1993: 913-934), Urquhart and Williams (1924),
and Barkas (1951).
Figure 8. Moisture content of paper at different temperature when the relative
humidity of ambient air is varied (Prahl, 1968).
2.3.2. Paper moisture content and the effect on paper properties
Moisture and temperature are perhaps the most important environmental variables
affecting the strength properties of paper, as already indicated. Prior history of
moisture gain and loss also affects paper properties. Since paper is a viscoelastic
material, it does not return to the same dimensions after drying and rewetting, or
after humidity cycling. There is a progressive change in dimensions after each
Literature Review
31
humidity cycle, with the greatest change occurring after the initial cycle as seen in
figure 9.
Figure 9. Effect of repeated humidity cycling on the dimension of paper in MD (Wink,
1961).
Wink (1961) studied dimensional changes in linen writing paper during changing
relative humidity conditions. He exposed samples to the humidity cycle of
50→11→50→94→11%RH in increments of about 15% RH. He repeated the cycle
eight times, with the temperature at 23°C. The author found appreciable shrinkage
at the three relative humidity levels. The curves show that the stress-relaxation
effect dominates the swelling effect to such a degree that all dimensions at 94%
relative humidity were smaller than the initial dimensions at 50%RH.
Irreversible impact on physical properties, resulting from an excursion of paper to a
high RH, is often observed. This evidently originates with the swelling and shrinking
of the fibers and with the relaxation of dried-in or built-in stresses. The major effect
occurs on the first exposure of paper to a high RH, exceeding approximately 65%.
It is dependent upon the extent of the excursion and it could permanently alter
dimensional and strength properties. These changes are non-recoverable by
manipulation of the moisture content or by preconditioning and conditioning the
paper, concluded Wink (1961).
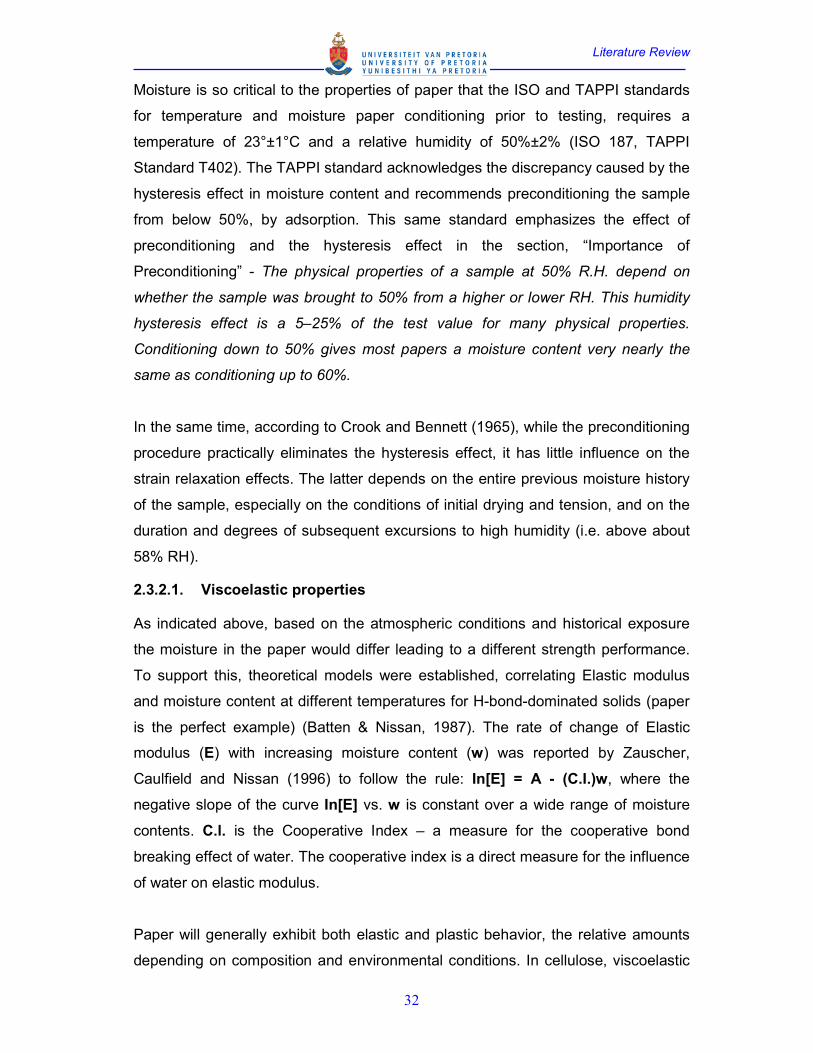
Literature Review
32
Moisture is so critical to the properties of paper that the ISO and TAPPI standards
for temperature and moisture paper conditioning prior to testing, requires a
temperature of 23°±1°C and a relative humidity of 50%±2% (ISO 187, TAPPI
Standard T402). The TAPPI standard acknowledges the discrepancy caused by the
hysteresis effect in moisture content and recommends preconditioning the sample
from below 50%, by adsorption. This same standard emphasizes the effect of
preconditioning and the hysteresis effect in the section, “Importance of
Preconditioning” - The physical properties of a sample at 50% R.H. depend on
whether the sample was brought to 50% from a higher or lower RH. This humidity
hysteresis effect is a 5–25% of the test value for many physical properties.
Conditioning down to 50% gives most papers a moisture content very nearly the
same as conditioning up to 60%.
In the same time, according to Crook and Bennett (1965), while the preconditioning
procedure practically eliminates the hysteresis effect, it has little influence on the
strain relaxation effects. The latter depends on the entire previous moisture history
of the sample, especially on the conditions of initial drying and tension, and on the
duration and degrees of subsequent excursions to high humidity (i.e. above about
58% RH).
2.3.2.1. Viscoelastic properties
As indicated above, based on the atmospheric conditions and historical exposure
the moisture in the paper would differ leading to a different strength performance.
To support this, theoretical models were established, correlating Elastic modulus
and moisture content at different temperatures for H-bond-dominated solids (paper
is the perfect example) (Batten & Nissan, 1987). The rate of change of Elastic
modulus (E) with increasing moisture content (w) was reported by Zauscher,
Caulfield and Nissan (1996) to follow the rule: In[E] = A - (C.I.)w, where the
negative slope of the curve In[E] vs. w is constant over a wide range of moisture
contents. C.l. is the Cooperative Index – a measure for the cooperative bond
breaking effect of water. The cooperative index is a direct measure for the influence
of water on elastic modulus.
Paper will generally exhibit both elastic and plastic behavior, the relative amounts
depending on composition and environmental conditions. In cellulose, viscoelastic
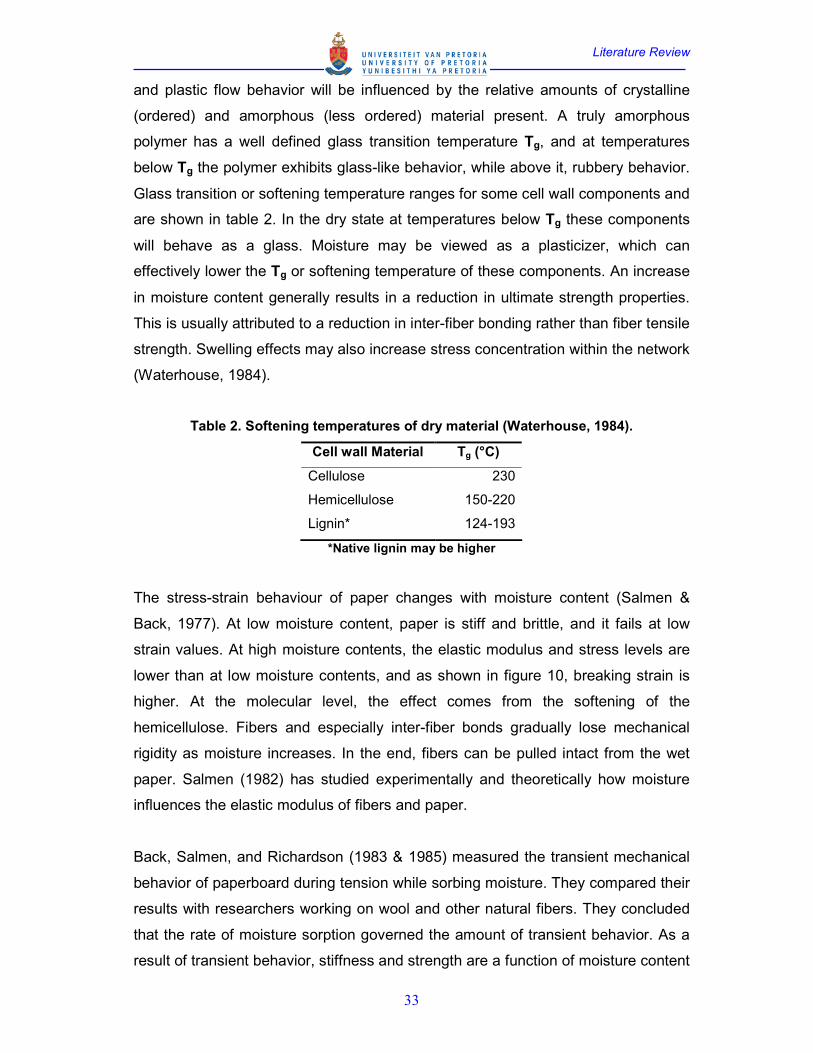
Literature Review
33
and plastic flow behavior will be influenced by the relative amounts of crystalline
(ordered) and amorphous (less ordered) material present. A truly amorphous
polymer has a well defined glass transition temperature Tg, and at temperatures
below Tg the polymer exhibits glass-like behavior, while above it, rubbery behavior.
Glass transition or softening temperature ranges for some cell wall components and
are shown in table 2. In the dry state at temperatures below Tg these components
will behave as a glass. Moisture may be viewed as a plasticizer, which can
effectively lower the Tg or softening temperature of these components. An increase
in moisture content generally results in a reduction in ultimate strength properties.
This is usually attributed to a reduction in inter-fiber bonding rather than fiber tensile
strength. Swelling effects may also increase stress concentration within the network
(Waterhouse, 1984).
Table 2. Softening temperatures of dry material (Waterhouse, 1984).
Cell wall Material Tg (°C)
Cellulose 230
Hemicellulose 150-220
Lignin* 124-193
*Native lignin may be higher
The stress-strain behaviour of paper changes with moisture content (Salmen &
Back, 1977). At low moisture content, paper is stiff and brittle, and it fails at low
strain values. At high moisture contents, the elastic modulus and stress levels are
lower than at low moisture contents, and as shown in figure 10, breaking strain is
higher. At the molecular level, the effect comes from the softening of the
hemicellulose. Fibers and especially inter-fiber bonds gradually lose mechanical
rigidity as moisture increases. In the end, fibers can be pulled intact from the wet
paper. Salmen (1982) has studied experimentally and theoretically how moisture
influences the elastic modulus of fibers and paper.
Back, Salmen, and Richardson (1983 & 1985) measured the transient mechanical
behavior of paperboard during tension while sorbing moisture. They compared their
results with researchers working on wool and other natural fibers. They concluded
that the rate of moisture sorption governed the amount of transient behavior. As a
result of transient behavior, stiffness and strength are a function of moisture content
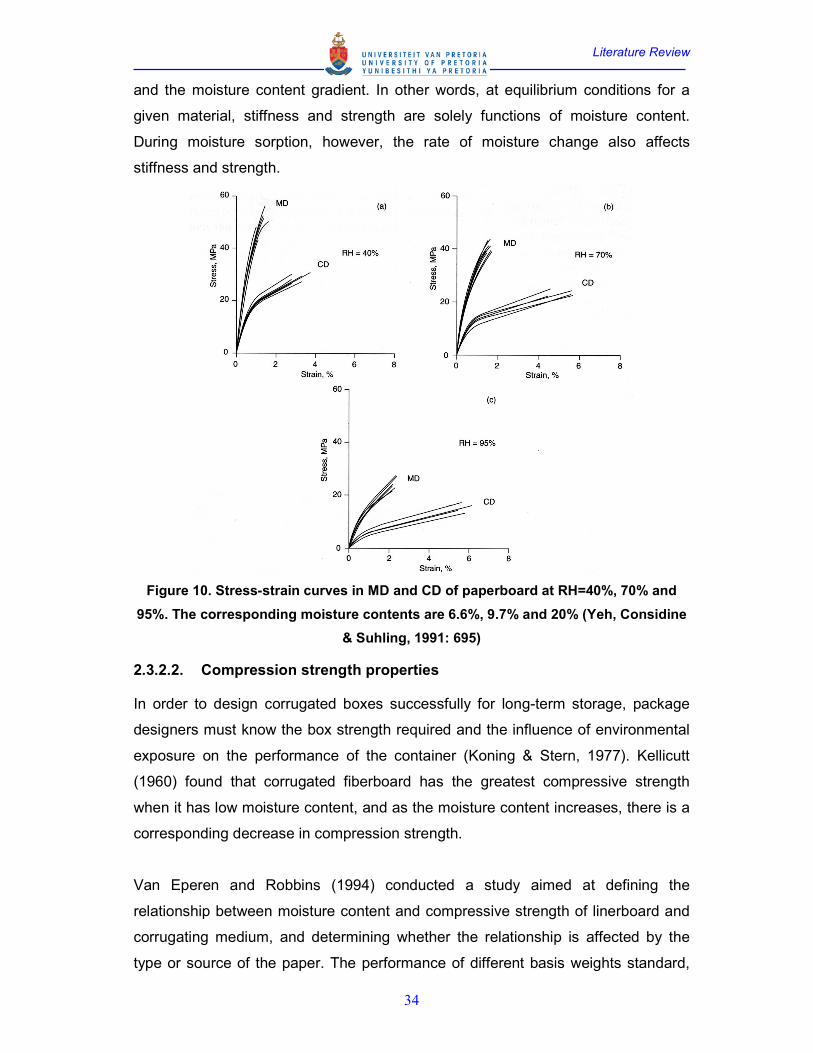
Literature Review
34
and the moisture content gradient. In other words, at equilibrium conditions for a
given material, stiffness and strength are solely functions of moisture content.
During moisture sorption, however, the rate of moisture change also affects
stiffness and strength.
Figure 10. Stress-strain curves in MD and CD of paperboard at RH=40%, 70% and
95%. The corresponding moisture contents are 6.6%, 9.7% and 20% (Yeh, Considine
& Suhling, 1991: 695)
2.3.2.2. Compression strength properties
In order to design corrugated boxes successfully for long-term storage, package
designers must know the box strength required and the influence of environmental
exposure on the performance of the container (Koning & Stern, 1977). Kellicutt
(1960) found that corrugated fiberboard has the greatest compressive strength
when it has low moisture content, and as the moisture content increases, there is a
corresponding decrease in compression strength.
Van Eperen and Robbins (1994) conducted a study aimed at defining the
relationship between moisture content and compressive strength of linerboard and
corrugating medium, and determining whether the relationship is affected by the
type or source of the paper. The performance of different basis weights standard,
Literature Review
35
recycled, green liquor and high performance linerboards and fluting grades were
evaluated at 20, 30, 40, 50, 60, 70, and 80%RH@23ºC. All samples were tested for
moisture content, RCTCD, and SCTCD. The % moisture vs. %RH results from their
study are shown in figure 11. The similarity in the results with figure 8 can be noted.
The authors reported that there was no significant difference between the average
moisture content of east and west coast (USA) paper samples. The results also
showed that the average moisture content of linerboard samples was a little higher
than that of medium samples, and this difference is statistically significant at the
0.05 probability level. The moisture content for recycled medium was clearly higher
than that for other medium types.
Figure 11. Average moisture content of linerboard and fluting grades at different
relative humidity and constant temperature (23ºC) as reported by Van Eperen and
Robbins (1994).
Van Eperen and Robbins (1994) found that over the range of 20 to 60%RH, similar
linear relationships exist between RCTCD and moisture content, and SCTCD and
moisture content (see figure 12a&b). Within this range RCTCD decreases 5% for 1%
moisture content increase, and SCTCD decreases 7% for an increase of 1%
moisture content. Above 60%RH, the rate of compression strength decrease
gradually accelerates for both test methods. The authors could not find any
significant evidence that the described above paper compression performance at
different moisture content is significantly different for samples of different types or
obtained from different sources.
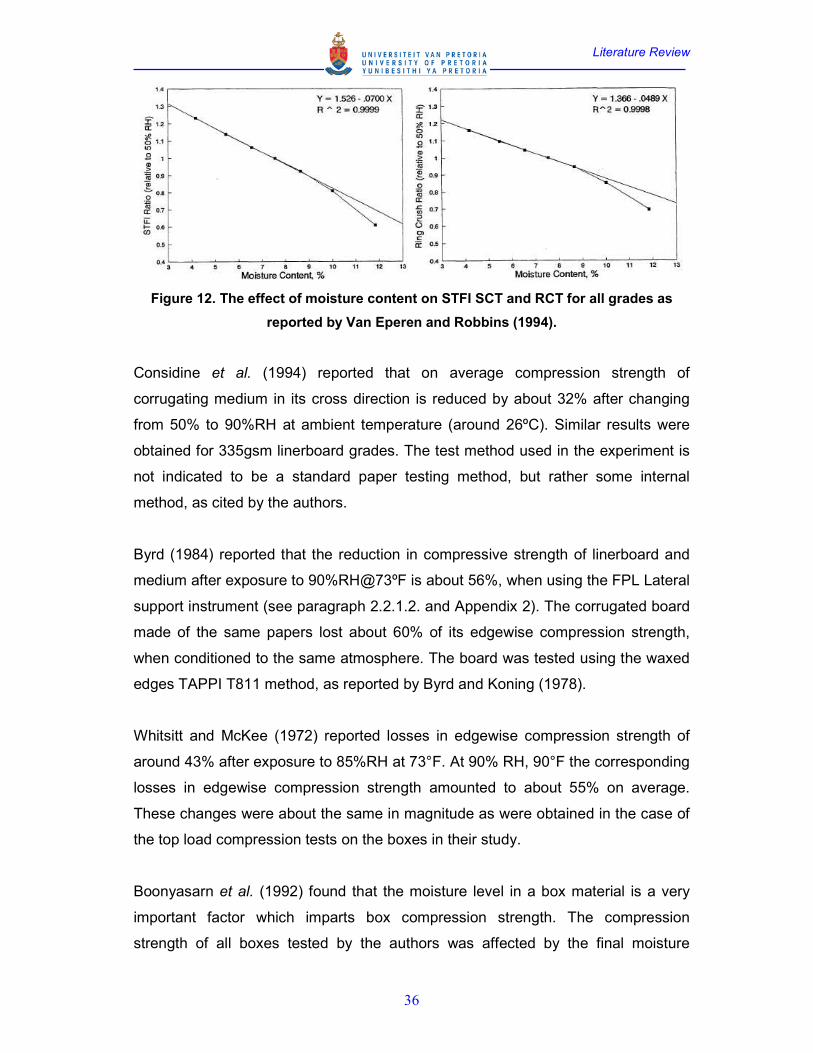
Literature Review
36
Figure 12. The effect of moisture content on STFI SCT and RCT for all grades as
reported by Van Eperen and Robbins (1994).
Considine et al. (1994) reported that on average compression strength of
corrugating medium in its cross direction is reduced by about 32% after changing
from 50% to 90%RH at ambient temperature (around 26ºC). Similar results were
obtained for 335gsm linerboard grades. The test method used in the experiment is
not indicated to be a standard paper testing method, but rather some internal
method, as cited by the authors.
Byrd (1984) reported that the reduction in compressive strength of linerboard and
medium after exposure to 90%RH@73ºF is about 56%, when using the FPL Lateral
support instrument (see paragraph 2.2.1.2. and Appendix 2). The corrugated board
made of the same papers lost about 60% of its edgewise compression strength,
when conditioned to the same atmosphere. The board was tested using the waxed
edges TAPPI T811 method, as reported by Byrd and Koning (1978).
Whitsitt and McKee (1972) reported losses in edgewise compression strength of
around 43% after exposure to 85%RH at 73°F. At 90% RH, 90°F the corresponding
losses in edgewise compression strength amounted to about 55% on average.
These changes were about the same in magnitude as were obtained in the case of
the top load compression tests on the boxes in their study.
Boonyasarn et al. (1992) found that the moisture level in a box material is a very
important factor which imparts box compression strength. The compression
strength of all boxes tested by the authors was affected by the final moisture
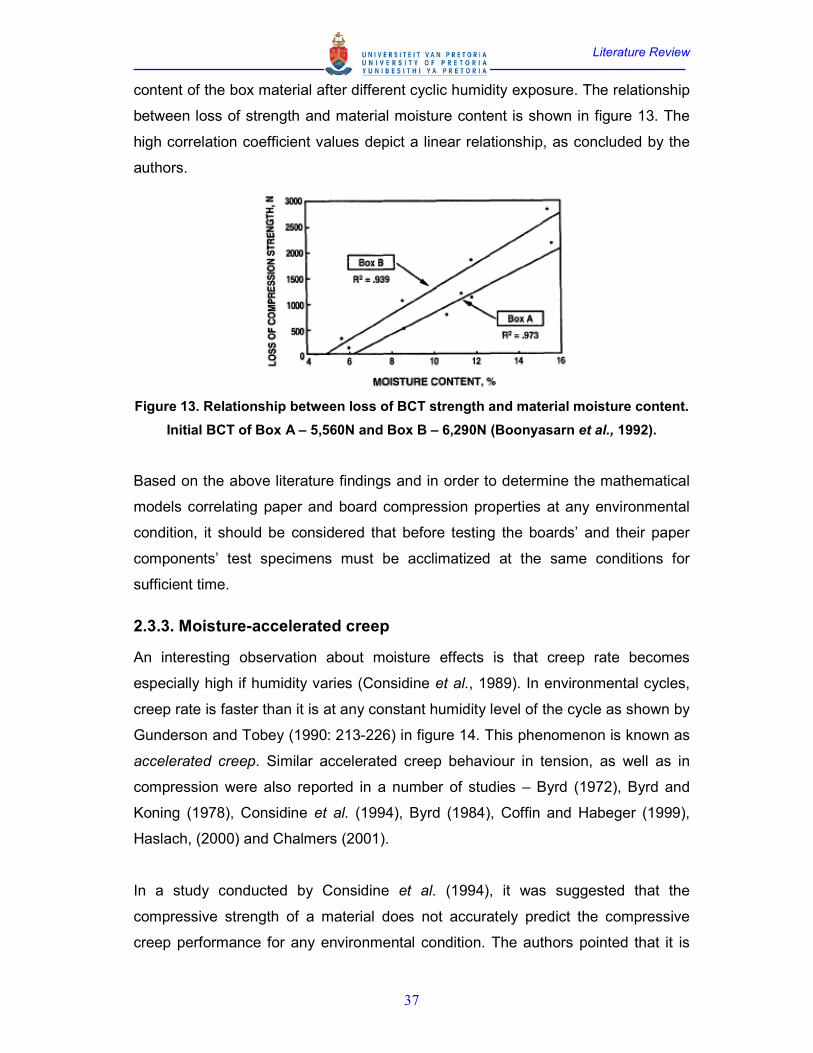
Literature Review
37
content of the box material after different cyclic humidity exposure. The relationship
between loss of strength and material moisture content is shown in figure 13. The
high correlation coefficient values depict a linear relationship, as concluded by the
authors.
Figure 13. Relationship between loss of BCT strength and material moisture content.
Initial BCT of Box A – 5,560N and Box B – 6,290N (Boonyasarn et al., 1992).
Based on the above literature findings and in order to determine the mathematical
models correlating paper and board compression properties at any environmental
condition, it should be considered that before testing the boards’ and their paper
components’ test specimens must be acclimatized at the same conditions for
sufficient time.
2.3.3. Moisture-accelerated creep
An interesting observation about moisture effects is that creep rate becomes
especially high if humidity varies (Considine et al., 1989). In environmental cycles,
creep rate is faster than it is at any constant humidity level of the cycle as shown by
Gunderson and Tobey (1990: 213-226) in figure 14. This phenomenon is known as
accelerated creep. Similar accelerated creep behaviour in tension, as well as in
compression were also reported in a number of studies – Byrd (1972), Byrd and
Koning (1978), Considine et al. (1994), Byrd (1984), Coffin and Habeger (1999),
Haslach, (2000) and Chalmers (2001).
In a study conducted by Considine et al. (1994), it was suggested that the
compressive strength of a material does not accurately predict the compressive
creep performance for any environmental condition. The authors pointed that it is
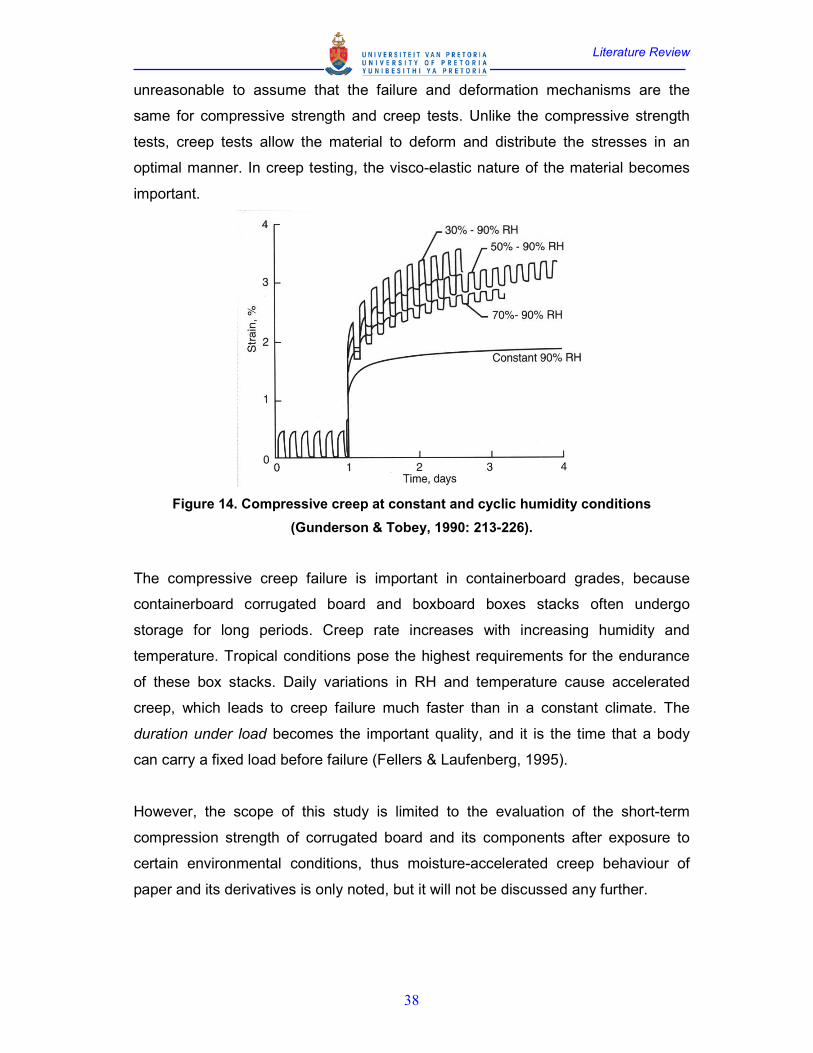
Literature Review
38
unreasonable to assume that the failure and deformation mechanisms are the
same for compressive strength and creep tests. Unlike the compressive strength
tests, creep tests allow the material to deform and distribute the stresses in an
optimal manner. In creep testing, the visco-elastic nature of the material becomes
important.
Figure 14. Compressive creep at constant and cyclic humidity conditions
(Gunderson & Tobey, 1990: 213-226).
The compressive creep failure is important in containerboard grades, because
containerboard corrugated board and boxboard boxes stacks often undergo
storage for long periods. Creep rate increases with increasing humidity and
temperature. Tropical conditions pose the highest requirements for the endurance
of these box stacks. Daily variations in RH and temperature cause accelerated
creep, which leads to creep failure much faster than in a constant climate. The
duration under load becomes the important quality, and it is the time that a body
can carry a fixed load before failure (Fellers & Laufenberg, 1995).
However, the scope of this study is limited to the evaluation of the short-term
compression strength of corrugated board and its components after exposure to
certain environmental conditions, thus moisture-accelerated creep behaviour of
paper and its derivatives is only noted, but it will not be discussed any further.
Experimental
39
3. Experimental
3.1. Apparatus
The following equipment, available at Sappi Technology Centre and shown in
Appendix 4, was used for the experimental laboratory work:
• TMI precision micrometer, No. PTE 202, model No. 49-61, was used to
determine the thickness (caliper) of paper samples conditioned at standard
environment;
• Mettler AE200 scientific scale, No. 070B, model No. SNR K58687, was
used to determine the paper samples weight after exposure to different
environmental conditions;
• W. Memment, Schwabach laboratory oven, serial No. 454819, was used
to obtain oven dried paper samples;
• Hung Ta environmental humidity chamber, type HT-58045A, No. 2361,
was used to expose the precut paper and board samples to constant high
humidity conditions at controlled temperature;
• TMI short span compression tester, No. P659, model No. 17-34-00-0002,
PT/E193A, TC/BT002, was used to performed STFI Short span compression
tests on the precut and preconditioned at different environments paper
samples;
• L&W crush tester, No. PTE 180B, model No. 977093, was used to perform
Ring crush and Edge crush tests on the precut and preconditioned at
different environments paper and corrugated board samples, respectively;
• L&W ECT sample cutter, Type: 978877, No. 758, Code: 008, was used to
cut the specified size board specimens for Edge crush testing;
• RCT Messer Buchel Guillotine, No. PTE 180A, was used to cut the
specified size paper specimens for RCT (152.4 x 12.7mm), from each paper
sample;
• Messer Buchel and Ideal Guillotines, PTE 302 and GL2, respectively,
were used to cut the specified size paper specimens for SCT (70 x 15mm),
from each paper sample;
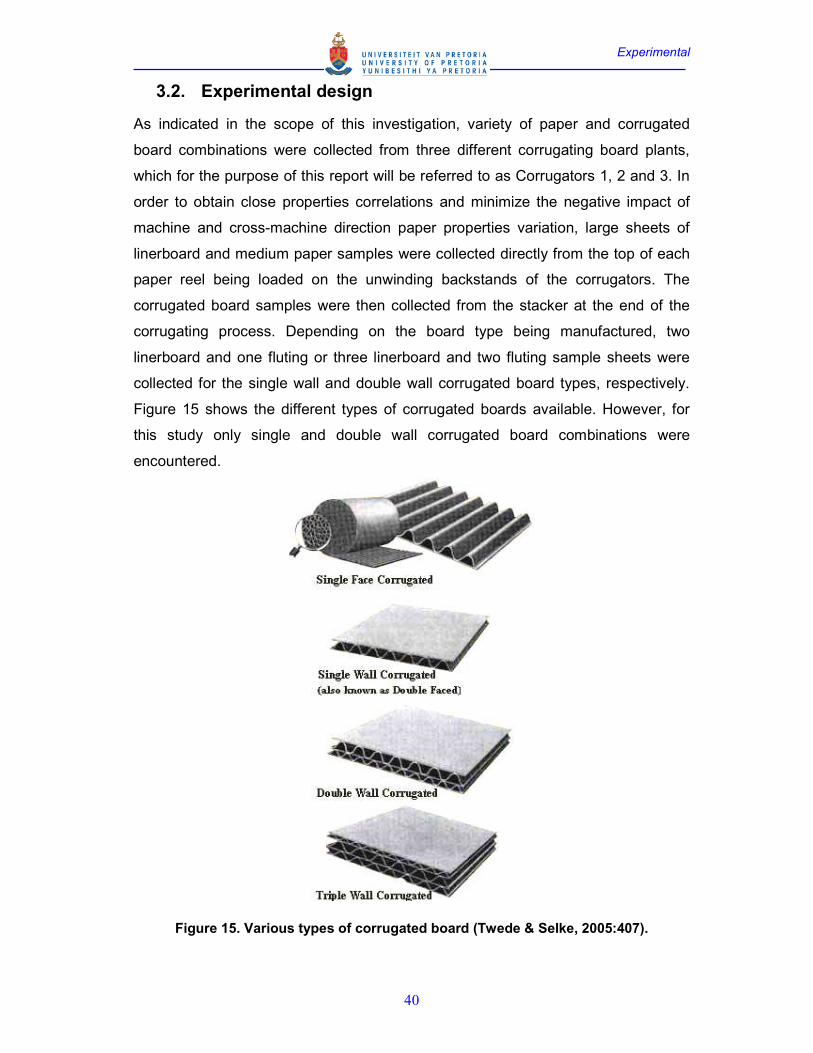
Experimental
40
3.2. Experimental design
As indicated in the scope of this investigation, variety of paper and corrugated
board combinations were collected from three different corrugating board plants,
which for the purpose of this report will be referred to as Corrugators 1, 2 and 3. In
order to obtain close properties correlations and minimize the negative impact of
machine and cross-machine direction paper properties variation, large sheets of
linerboard and medium paper samples were collected directly from the top of each
paper reel being loaded on the unwinding backstands of the corrugators. The
corrugated board samples were then collected from the stacker at the end of the
corrugating process. Depending on the board type being manufactured, two
linerboard and one fluting or three linerboard and two fluting sample sheets were
collected for the single wall and double wall corrugated board types, respectively.
Figure 15 shows the different types of corrugated boards available. However, for
this study only single and double wall corrugated board combinations were
encountered.
Figure 15. Various types of corrugated board (Twede & Selke, 2005:407).
Experimental
41
All paper and board samples were then clearly marked per combination and
according to its position (L1, L2 or L3 for linerboards and F1 or F2 for fluting
medium paper) for easy and accurate reference later. Cross-machine direction
(CD) was also marked on all papers, to ensure correct CD compression strength
evaluation (CD compression strength is in most cases critical for box stacking
strength, as already clarified in paragraph 2.1.2.2.). The fluting profile types (B, C or
E – only encountered) in each board combination were also recorded for medium
paper take-up factor determination later.
The collected paper and corrugated board samples were then taken to the Sappi
Technology Centre, where they were preconditioned for at least two days to
30%RH at 32ºC, followed by reconditioning to standard laboratory environmental
conditions (50%RH at 23ºC) for at least another two days, all in accordance with
ISO 187:1990(E) method.
All paper samples acclimatized at standard conditions were then used to cut
sufficient number of specified size test specimens, as per standard testing methods
listed in paragraph 3.3., to determine paper basis weight, thickness, as well as RCT
and SCT in the appropriate cross-machine direction. The corrugated board samples
were also used to cut the ECT test specimens. Board samples were also used to
delaminate the fluting(s) from the linerboards in order to establish the accurate
take-up factors for each fluting profile at each corrugating plant.
Basis weight and thickness were then determined for each paper sample.
Randomly selected basis weight specimens were later used to determine
equilibrium moisture content at high humidity conditions. Equilibrium moisture
content was determined by weighing each of the different samples after exposure
to the specified climatic conditions, followed by oven drying and weighing the same
samples.
Two sets of paper and board testing specimens for SCT, RCT and ECT were
prepared for each board combination. One set was used for compression strength
properties determination after exposure to standard laboratory conditions of
50%RH at 23ºC. The second set was placed in the Hung Ta environmental
Experimental
42
humidity chamber for at least 24hrs exposure at high relative humidity (85%-
90%RH at 23ºC). This was in agreement with the findings in literature that in order
to determine the mathematical models correlating paper and board compression
properties at any environmental condition, it should be considered that before
testing the boards’ and their paper components’ test specimens must be
acclimatized at the same conditions for sufficient time. It must be noted that the
objective of this investigation was neither to determine the paper and board
compression strengths correlation at certain conditions nor to establish the paper
vs. board compression strength reduction between standard and specified high
humidity conditions, but rather to establish mathematical correlations between
corrugated board and its papers’ compression properties. Thus the above
experimental design allowed to use the same board and papers combinations, but
using high humidity to decrease their strength properties. Based on the described
in literature strength reduction behaviour, this experimental design would be similar
to using weak paper and board combinations, doubling the data size to cover larger
strength properties range and obtaining more accurate mathematical models. The
mathematical models would allow for easy box stacking strength prediction at any
environmental condition via board strength, by only testing the paper components
at these conditions. It was therefore considered critical to place the different paper
and board samples combinations in the humidity chamber at the same time to
eliminate any difference in climatic conditions generated by incorrect operations or
interruptions of the chamber.
After the exposure to the specified high humidity conditions in the environmental
chamber, the specimens for each test were placed one set at a time in a plastic bag
and rapidly tested to minimize moisture migration at standard laboratory conditions
(50%RH at 23ºC).
3.3. Methods
The following International Standards were used in the experimental work of this
investigation:
• ISO 187:1990(E) – Paper, board and pulps – Standard atmosphere for
conditioning and testing and procedure for monitoring the atmosphere and
conditioning of samples.
Experimental
43
• ISO 536:1995(E) – Paper and board determination of grammage, where the
test specimens for each paper sample had an area of 100x100mm.
• ISO 534:1988(E) – Paper and board determination of thickness and
apparent bulk density or apparent sheet density.
• ISO 9895:1989(E) – Paper and board – Compressive strength – Short span
test (SCT).
• ISO 12192:2002(E) – Paper and board – Compressive strength – Ring crush
method (RCT).
• ISO 3037:1994(E) – Corrugated fiberboard determination of edgewise crush
resistance (Unwaxed edge method). This International Standard is
equivalent to the referred in this report FEFCO (No.8) ECT method.
Results and Discussions
44
4. Results and Discussions
4.1. Paper substrate and corrugated board physical properties
The results from the laboratory paper substrates and corrugated board tests are
shown in table A5 in Appendix 5. The annotations 1 and 2 for ECT, SCT, RCT and
Moisture stand for the test results obtained after exposure to standard and high
relative humidity conditions, respectively. Paper substrate apparent density results
were calculated using the basis weight and thickness (caliper) results at standard
laboratory conditions.
The standard deviation of the individual SCT results for the same paper sample
was found to be on average about 8.06% of the mean, which was greater than the
standard deviation of the RCT individual results (on average – 3.87% of the mean
for the same paper sample). This confirms the recent claims in literature (Frank,
2003 & 2007) recommending the necessity to measure SCT on a large number of
testing strips to ensure consistent and representative results. Therefore the
employed standard testing methods for SCT and RCT ensured sufficient number of
testing strips to generate statistically significant average results per paper sample.
However, this should be considered for Quality control at paper mills and
corrugating plants, when drafting the appropriate testing procedures. At the same
time, the standard deviation of the ECT individual results was on average about
3.79% of the mean for the same board sample, with marginally larger variation in
the results for the single wall boards.
The take up factors for the different fluting profiles for each corrugating plant were
determined, and are also shown in Table A5 in Appendix 5. Only small differences
are evident between the take up factors of the same flute profiles for the different
corrugating plants.
The moisture content results of the randomly selected papers at the two different
conditions are shown as percentages in table A5. It can be seen that the
equilibrium moisture content of the selected papers at standard laboratory
conditions is much lower than their equilibrium moisture content at high relative
Results and Discussions
45
humidity, which is in agreement with the reviewed in paragraph 2.3.1. studies. The
observed small differences in moisture content at the same climatic conditions for
the different paper samples confirm that the equilibrium moisture content is also
papermaking furnish dependent.
4.2. Calculated board compression strength results
The Maltenfort model (6), as discussed in paragraph 2.1.2.2. and shown again
below in the form applicable for double wall board, was used to estimate the ECT of
the corrugated boards:
ECTCalculated = (σσσσc,L1 + σσσσc,L2 + σσσσc,L3 + αααα1111σσσσc,F1 + αααα2222σσσσc,F2) (9)
Where σσσσc is still the measured compression strength (using SCT or RCT) of the
liners and fluting(s) medium papers used for the construction of the board, and αααα is
the so called take-up factor(s), as indicated above.
Two calculations for each board were performed, using the SCT and RCT paper
substrate results. The obtained results are shown in table A6 in Appendix 5 and
compared to the measured ECT results. The annotations ECTSCT and ECTRCT refer
to the results obtained by the above Maltenfort model, using the paper substrates’
SCT and RCT results, respectively. The annotations 1 and 2 refer to the results
obtained after exposure to standard and high relative humidity conditions,
respectively, as indicated earlier.
4.3. Mathematical models correlating compression strengths
of board and its components
In order to determine the linear regression constants in the Maltenfort model,
correlating the measured ECT with the predicted ECT, using the paper
components’ compression strengths, the results from table A6 were plotted in figure
16.
The predictive mathematical models obtained by linear regression, using all data
generated after exposure to the two climatic conditions for all corrugating plants,
are as follows:
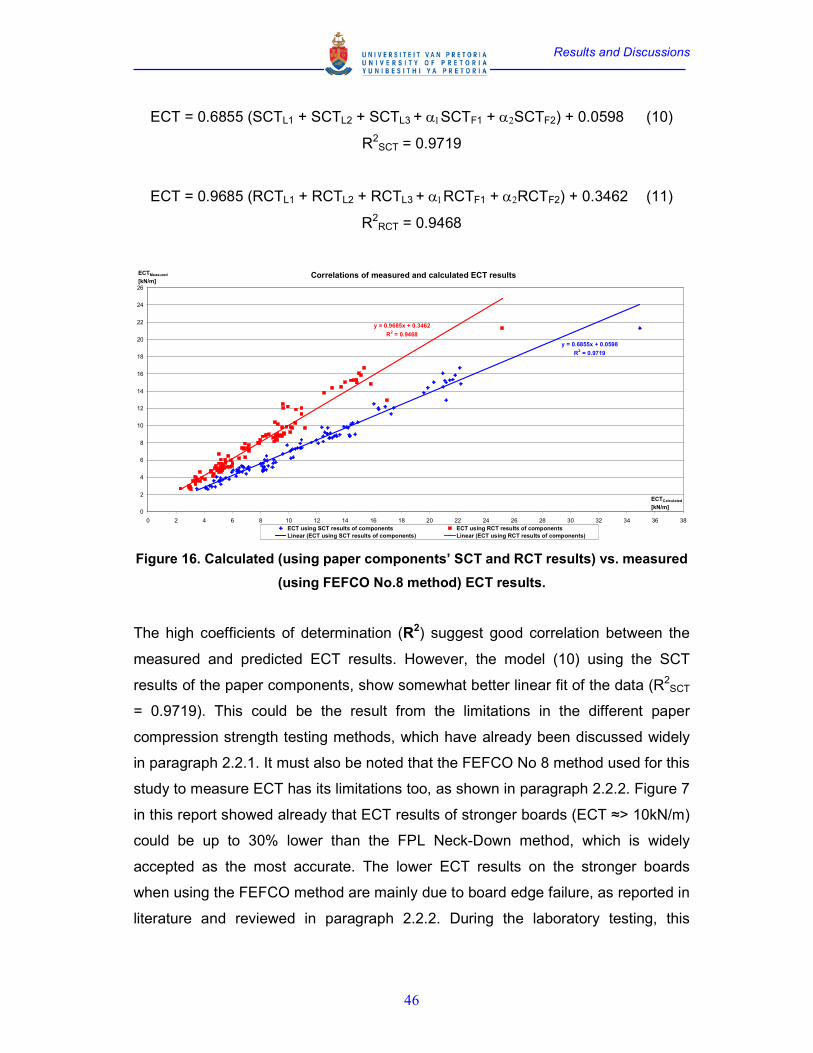
Results and Discussions
46
ECT = 0.6855 (SCTL1 + SCTL2 + SCTL3 + α1SCTF1 + α2SCTF2) + 0.0598 (10)
R2SCT = 0.9719
ECT = 0.9685 (RCTL1 + RCTL2 + RCTL3 + α1RCTF1 + α2RCTF2) + 0.3462 (11)
R2RCT = 0.9468
Correlations of measured and calculated ECT results
y = 0.6855x + 0.0598
R2 = 0.9719
y = 0.9685x + 0.3462
R2 = 0.9468
0
2
4
6
8
10
12
14
16
18
20
22
24
26
0 2 4 6 8 10 12 14 16 18 20 22 24 26 28 30 32 34 36 38
ECTCalculated
[kN/m]
ECTMeasured
[kN/m]
ECT using SCT results of components ECT using RCT results of components
Linear (ECT using SCT results of components) Linear (ECT using RCT results of components)
Figure 16. Calculated (using paper components’ SCT and RCT results) vs. measured
(using FEFCO No.8 method) ECT results.
The high coefficients of determination (R2) suggest good correlation between the
measured and predicted ECT results. However, the model (10) using the SCT
results of the paper components, show somewhat better linear fit of the data (R2SCT
= 0.9719). This could be the result from the limitations in the different paper
compression strength testing methods, which have already been discussed widely
in paragraph 2.2.1. It must also be noted that the FEFCO No 8 method used for this
study to measure ECT has its limitations too, as shown in paragraph 2.2.2. Figure 7
in this report showed already that ECT results of stronger boards (ECT ≈> 10kN/m)
could be up to 30% lower than the FPL Neck-Down method, which is widely
accepted as the most accurate. The lower ECT results on the stronger boards
when using the FEFCO method are mainly due to board edge failure, as reported in
literature and reviewed in paragraph 2.2.2. During the laboratory testing, this
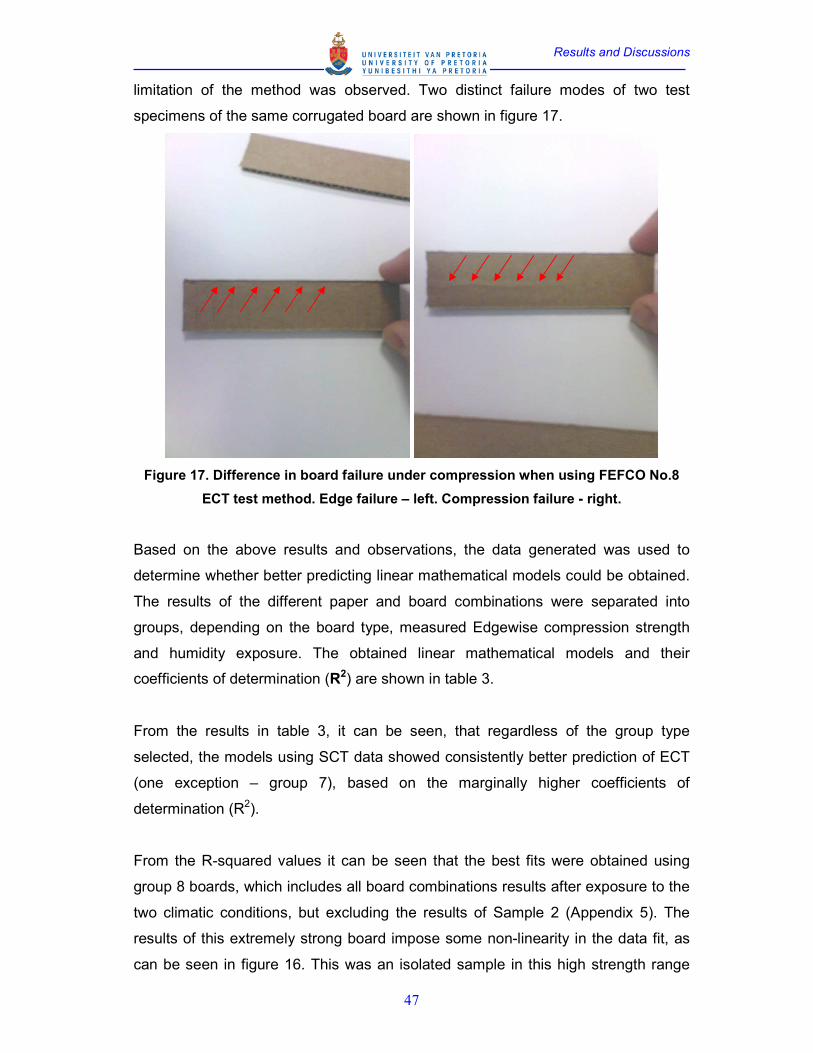
Results and Discussions
47
limitation of the method was observed. Two distinct failure modes of two test
specimens of the same corrugated board are shown in figure 17.
Figure 17. Difference in board failure under compression when using FEFCO No.8
ECT test method. Edge failure – left. Compression failure - right.
Based on the above results and observations, the data generated was used to
determine whether better predicting linear mathematical models could be obtained.
The results of the different paper and board combinations were separated into
groups, depending on the board type, measured Edgewise compression strength
and humidity exposure. The obtained linear mathematical models and their
coefficients of determination (R2) are shown in table 3.
From the results in table 3, it can be seen, that regardless of the group type
selected, the models using SCT data showed consistently better prediction of ECT
(one exception – group 7), based on the marginally higher coefficients of
determination (R2).
From the R-squared values it can be seen that the best fits were obtained using
group 8 boards, which includes all board combinations results after exposure to the
two climatic conditions, but excluding the results of Sample 2 (Appendix 5). The
results of this extremely strong board impose some non-linearity in the data fit, as
can be seen in figure 16. This was an isolated sample in this high strength range
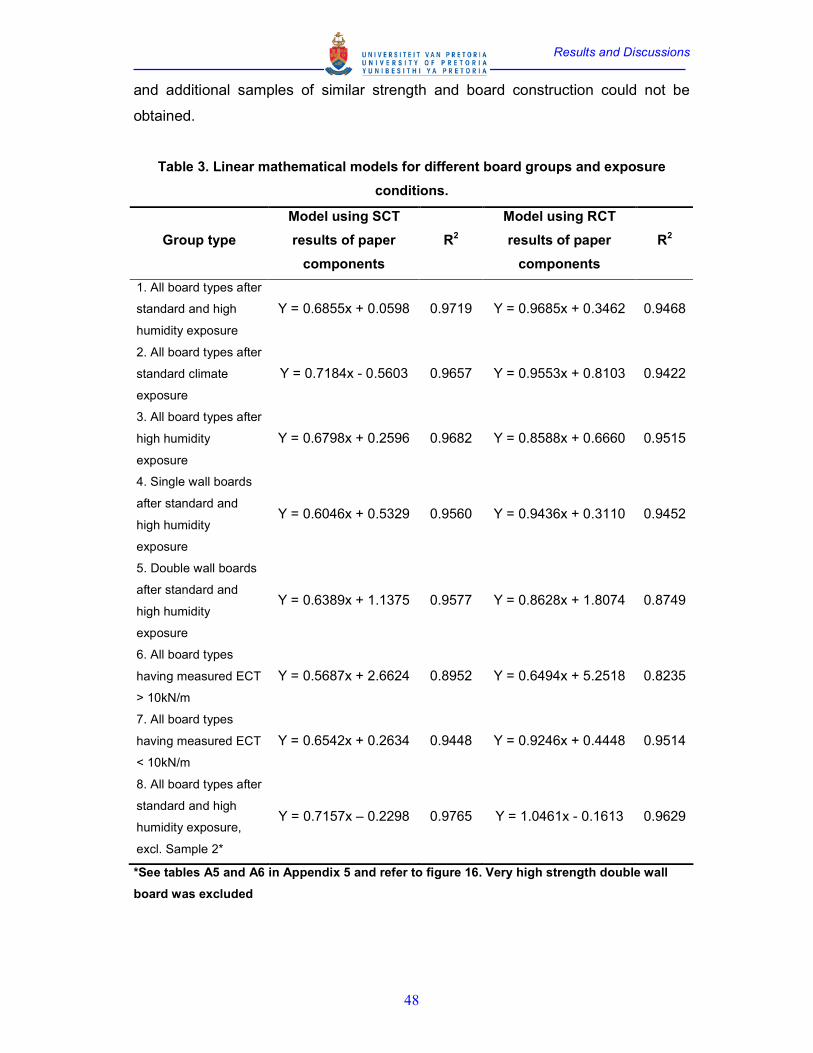
Results and Discussions
48
and additional samples of similar strength and board construction could not be
obtained.
Table 3. Linear mathematical models for different board groups and exposure
conditions.
Group type
Model using SCT
results of paper
components
R2
Model using RCT
results of paper
components
R2
1. All board types after
standard and high
humidity exposure
Y = 0.6855x + 0.0598 0.9719 Y = 0.9685x + 0.3462 0.9468
2. All board types after
standard climate
exposure
Y = 0.7184x - 0.5603 0.9657 Y = 0.9553x + 0.8103 0.9422
3. All board types after
high humidity
exposure
Y = 0.6798x + 0.2596 0.9682 Y = 0.8588x + 0.6660 0.9515
4. Single wall boards
after standard and
high humidity
exposure
Y = 0.6046x + 0.5329 0.9560 Y = 0.9436x + 0.3110 0.9452
5. Double wall boards
after standard and
high humidity
exposure
Y = 0.6389x + 1.1375 0.9577 Y = 0.8628x + 1.8074 0.8749
6. All board types
having measured ECT
> 10kN/m
Y = 0.5687x + 2.6624 0.8952 Y = 0.6494x + 5.2518 0.8235
7. All board types
having measured ECT
< 10kN/m
Y = 0.6542x + 0.2634 0.9448 Y = 0.9246x + 0.4448 0.9514
8. All board types after
standard and high
humidity exposure,
excl. Sample 2*
Y = 0.7157x – 0.2298 0.9765 Y = 1.0461x - 0.1613 0.9629
*See tables A5 and A6 in Appendix 5 and refer to figure 16. Very high strength double wall
board was excluded
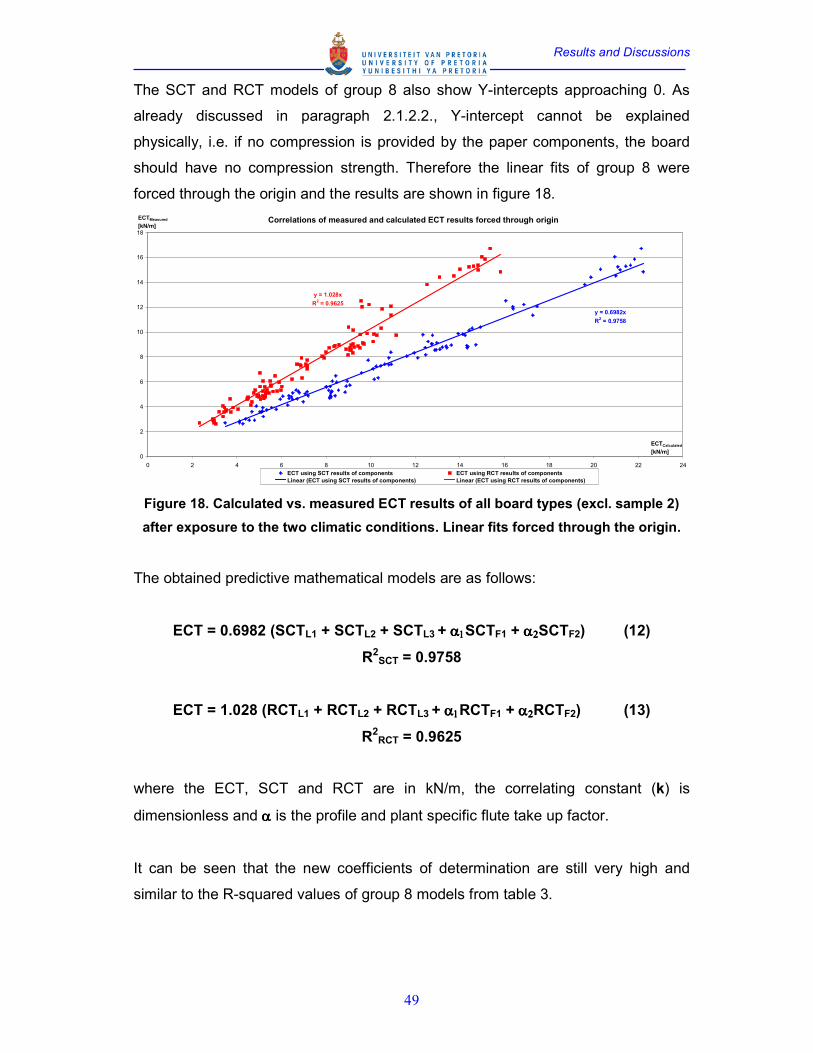
Results and Discussions
49
The SCT and RCT models of group 8 also show Y-intercepts approaching 0. As
already discussed in paragraph 2.1.2.2., Y-intercept cannot be explained
physically, i.e. if no compression is provided by the paper components, the board
should have no compression strength. Therefore the linear fits of group 8 were
forced through the origin and the results are shown in figure 18.
Correlations of measured and calculated ECT results forced through origin
y = 0.6982x
R2 = 0.9758
y = 1.028x
R2 = 0.9625
0
2
4
6
8
10
12
14
16
18
0 2 4 6 8 10 12 14 16 18 20 22 24
ECTCalculated
[kN/m]
ECTMeasured
[kN/m]
ECT using SCT results of components ECT using RCT results of components
Linear (ECT using SCT results of components) Linear (ECT using RCT results of components)
Figure 18. Calculated vs. measured ECT results of all board types (excl. sample 2)
after exposure to the two climatic conditions. Linear fits forced through the origin.
The obtained predictive mathematical models are as follows:
ECT = 0.6982 (SCTL1 + SCTL2 + SCTL3 + αααα1111SCTF1 + αααα2222SCTF2) (12)
R2SCT = 0.9758
ECT = 1.028 (RCTL1 + RCTL2 + RCTL3 + αααα1111RCTF1 + αααα2222RCTF2) (13)
R2RCT = 0.9625
where the ECT, SCT and RCT are in kN/m, the correlating constant (k) is
dimensionless and αααα is the profile and plant specific flute take up factor.
It can be seen that the new coefficients of determination are still very high and
similar to the R-squared values of group 8 models from table 3.
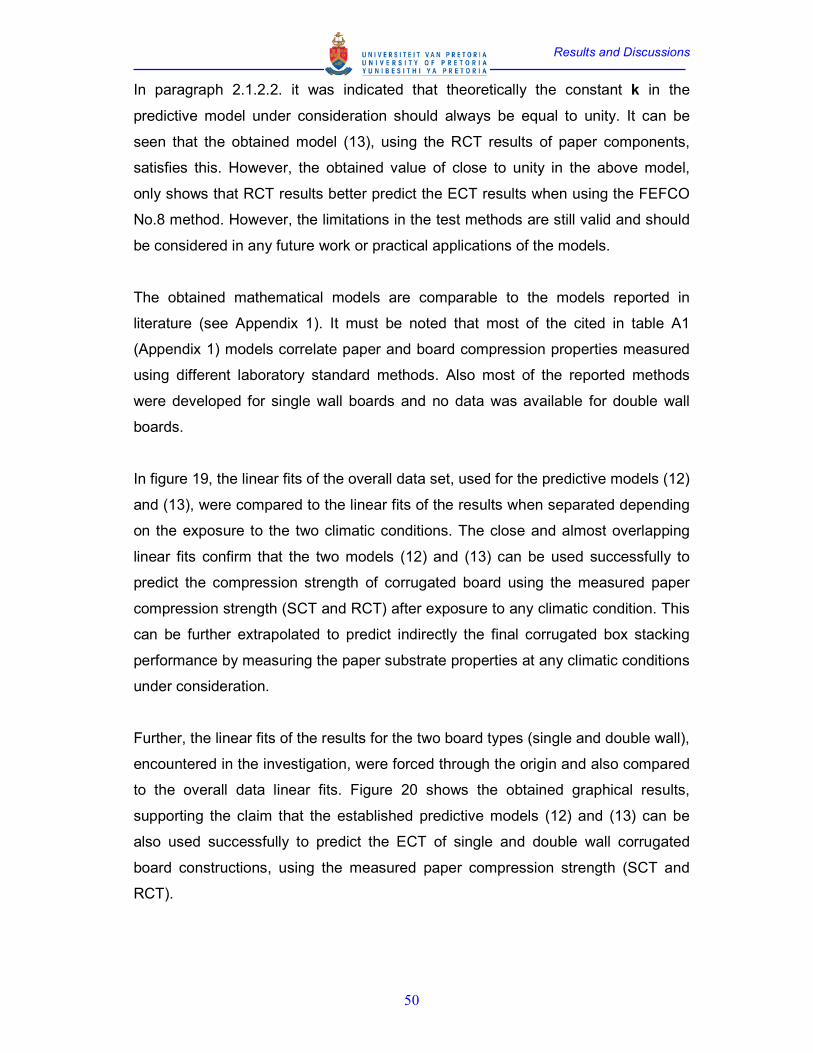
Results and Discussions
50
In paragraph 2.1.2.2. it was indicated that theoretically the constant k in the
predictive model under consideration should always be equal to unity. It can be
seen that the obtained model (13), using the RCT results of paper components,
satisfies this. However, the obtained value of close to unity in the above model,
only shows that RCT results better predict the ECT results when using the FEFCO
No.8 method. However, the limitations in the test methods are still valid and should
be considered in any future work or practical applications of the models.
The obtained mathematical models are comparable to the models reported in
literature (see Appendix 1). It must be noted that most of the cited in table A1
(Appendix 1) models correlate paper and board compression properties measured
using different laboratory standard methods. Also most of the reported methods
were developed for single wall boards and no data was available for double wall
boards.
In figure 19, the linear fits of the overall data set, used for the predictive models (12)
and (13), were compared to the linear fits of the results when separated depending
on the exposure to the two climatic conditions. The close and almost overlapping
linear fits confirm that the two models (12) and (13) can be used successfully to
predict the compression strength of corrugated board using the measured paper
compression strength (SCT and RCT) after exposure to any climatic condition. This
can be further extrapolated to predict indirectly the final corrugated box stacking
performance by measuring the paper substrate properties at any climatic conditions
under consideration.
Further, the linear fits of the results for the two board types (single and double wall),
encountered in the investigation, were forced through the origin and also compared
to the overall data linear fits. Figure 20 shows the obtained graphical results,
supporting the claim that the established predictive models (12) and (13) can be
also used successfully to predict the ECT of single and double wall corrugated
board constructions, using the measured paper compression strength (SCT and
RCT).
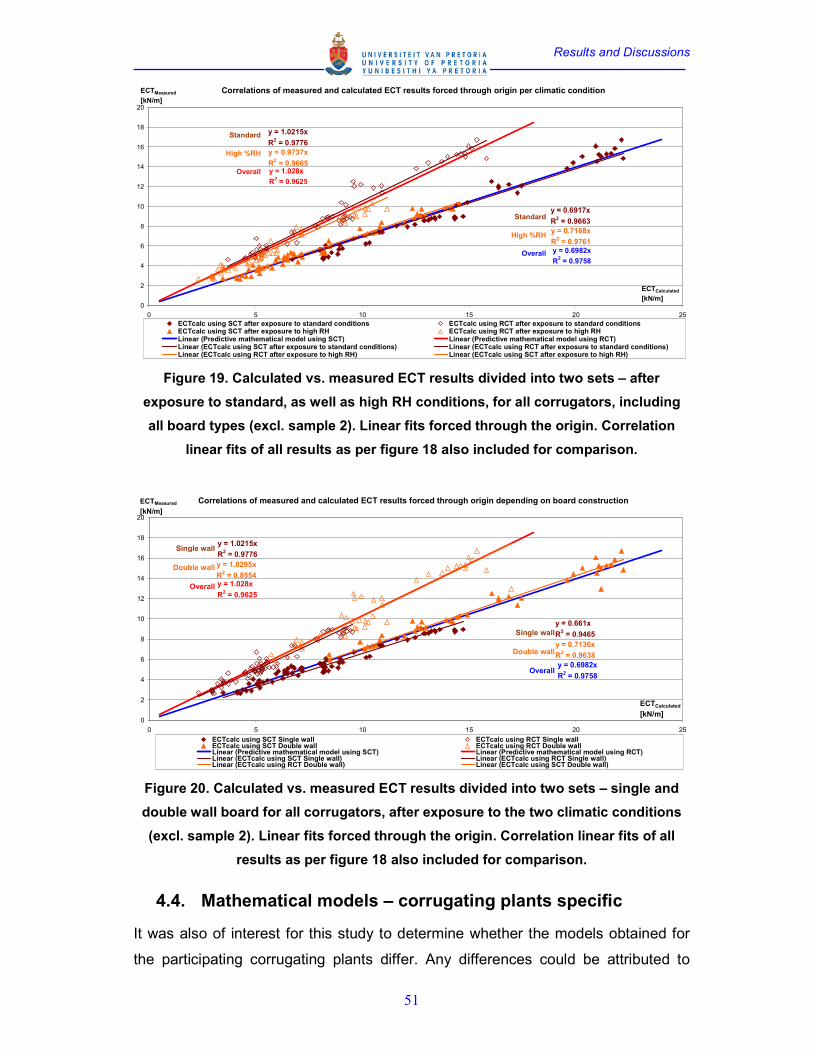
Results and Discussions
51
Correlations of measured and calculated ECT results forced through origin per climatic condition
y = 0.6917x
R2 = 0.9663
y = 1.0215x
R2 = 0.9776
y = 0.9737x
R2 = 0.9665
y = 0.7168x
R2 = 0.9761
0
2
4
6
8
10
12
14
16
18
20
0 5 10 15 20 25
ECTCalculated
[kN/m]
ECTMeasured
[kN/m]
ECTcalc using SCT after exposure to standard conditions ECTcalc using RCT after exposure to standard conditionsECTcalc using SCT after exposure to high RH ECTcalc using RCT after exposure to high RHLinear (Predictive mathematical model using SCT) Linear (Predictive mathematical model using RCT)Linear (ECTcalc using SCT after exposure to standard conditions) Linear (ECTcalc using RCT after exposure to standard conditions)Linear (ECTcalc using RCT after exposure to high RH) Linear (ECTcalc using SCT after exposure to high RH)
y = 1.028x
R2 = 0.9625
y = 0.6982x
R2 = 0.9758
Standard
High %RH
Overall
Standard
High %RH
Overall
Figure 19. Calculated vs. measured ECT results divided into two sets – after
exposure to standard, as well as high RH conditions, for all corrugators, including
all board types (excl. sample 2). Linear fits forced through the origin. Correlation
linear fits of all results as per figure 18 also included for comparison.
Correlations of measured and calculated ECT results forced through origin depending on board construction
y = 0.661x
R2 = 0.9465
y = 1.0215x
R2 = 0.9776
y = 1.0295x
R2 = 0.8554
y = 0.7136x
R2 = 0.9638
0
2
4
6
8
10
12
14
16
18
20
0 5 10 15 20 25
ECTCalculated
[kN/m]
ECTMeasured
[kN/m]
ECTcalc using SCT Single wall ECTcalc using RCT Single wallECTcalc using SCT Double wall ECTcalc using RCT Double wallLinear (Predictive mathematical model using SCT) Linear (Predictive mathematical model using RCT)Linear (ECTcalc using SCT Single wall) Linear (ECTcalc using RCT Single wall)Linear (ECTcalc using RCT Double wall) Linear (ECTcalc using SCT Double wall)
y = 1.028x
R2 = 0.9625
Single wall
Double wall
Overall
Single wall
Double wall
Overally = 0.6982x
R2 = 0.9758
Figure 20. Calculated vs. measured ECT results divided into two sets – single and
double wall board for all corrugators, after exposure to the two climatic conditions
(excl. sample 2). Linear fits forced through the origin. Correlation linear fits of all
results as per figure 18 also included for comparison.
4.4. Mathematical models – corrugating plants specific
It was also of interest for this study to determine whether the models obtained for
the participating corrugating plants differ. Any differences could be attributed to
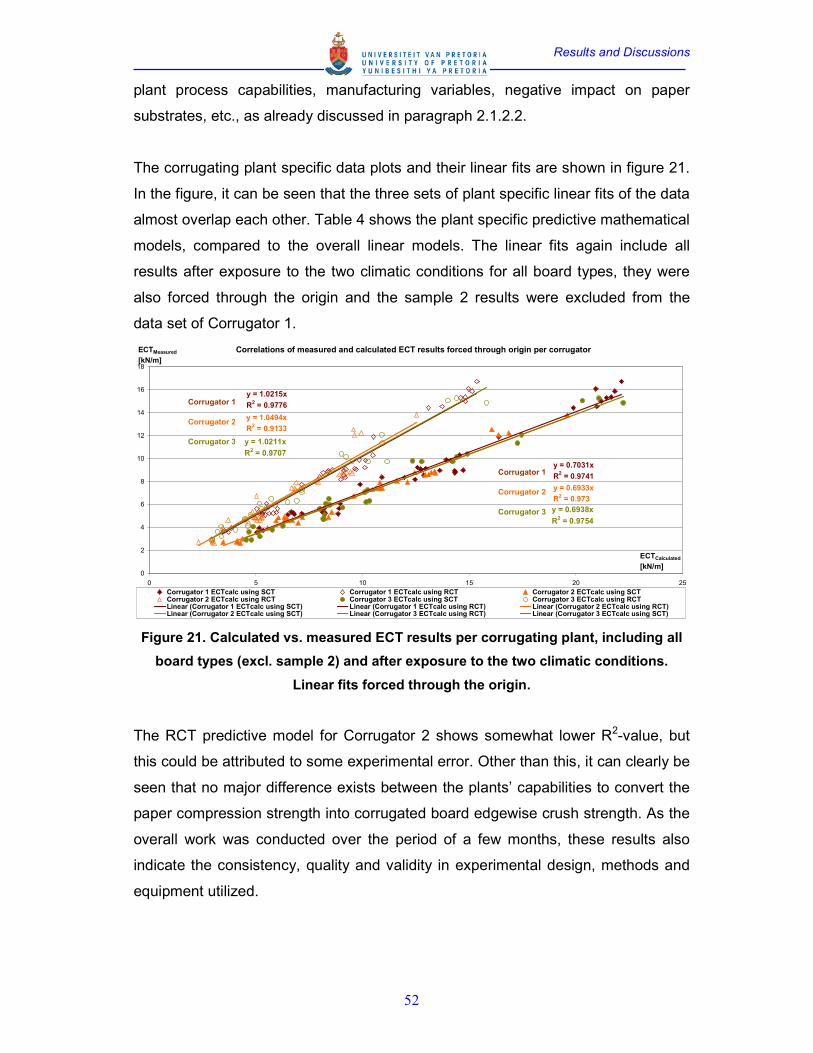
Results and Discussions
52
plant process capabilities, manufacturing variables, negative impact on paper
substrates, etc., as already discussed in paragraph 2.1.2.2.
The corrugating plant specific data plots and their linear fits are shown in figure 21.
In the figure, it can be seen that the three sets of plant specific linear fits of the data
almost overlap each other. Table 4 shows the plant specific predictive mathematical
models, compared to the overall linear models. The linear fits again include all
results after exposure to the two climatic conditions for all board types, they were
also forced through the origin and the sample 2 results were excluded from the
data set of Corrugator 1.
Correlations of measured and calculated ECT results forced through origin per corrugator
y = 0.7031x
R2 = 0.9741
y = 1.0215x
R2 = 0.9776
y = 1.0494x
R2 = 0.9133
y = 0.6933x
R2 = 0.973
y = 1.0211x
R2 = 0.9707
y = 0.6938x
R2 = 0.9754
0
2
4
6
8
10
12
14
16
18
0 5 10 15 20 25
ECTCalculated
[kN/m]
ECTMeasured
[kN/m]
Corrugator 1 ECTcalc using SCT Corrugator 1 ECTcalc using RCT Corrugator 2 ECTcalc using SCTCorrugator 2 ECTcalc using RCT Corrugator 3 ECTcalc using SCT Corrugator 3 ECTcalc using RCTLinear (Corrugator 1 ECTcalc using SCT) Linear (Corrugator 1 ECTcalc using RCT) Linear (Corrugator 2 ECTcalc using RCT)Linear (Corrugator 2 ECTcalc using SCT) Linear (Corrugator 3 ECTcalc using RCT) Linear (Corrugator 3 ECTcalc using SCT)
Corrugator 1
Corrugator 2
Corrugator 3
Corrugator 1
Corrugator 2
Corrugator 3
Figure 21. Calculated vs. measured ECT results per corrugating plant, including all
board types (excl. sample 2) and after exposure to the two climatic conditions.
Linear fits forced through the origin.
The RCT predictive model for Corrugator 2 shows somewhat lower R2-value, but
this could be attributed to some experimental error. Other than this, it can clearly be
seen that no major difference exists between the plants’ capabilities to convert the
paper compression strength into corrugated board edgewise crush strength. As the
overall work was conducted over the period of a few months, these results also
indicate the consistency, quality and validity in experimental design, methods and
equipment utilized.
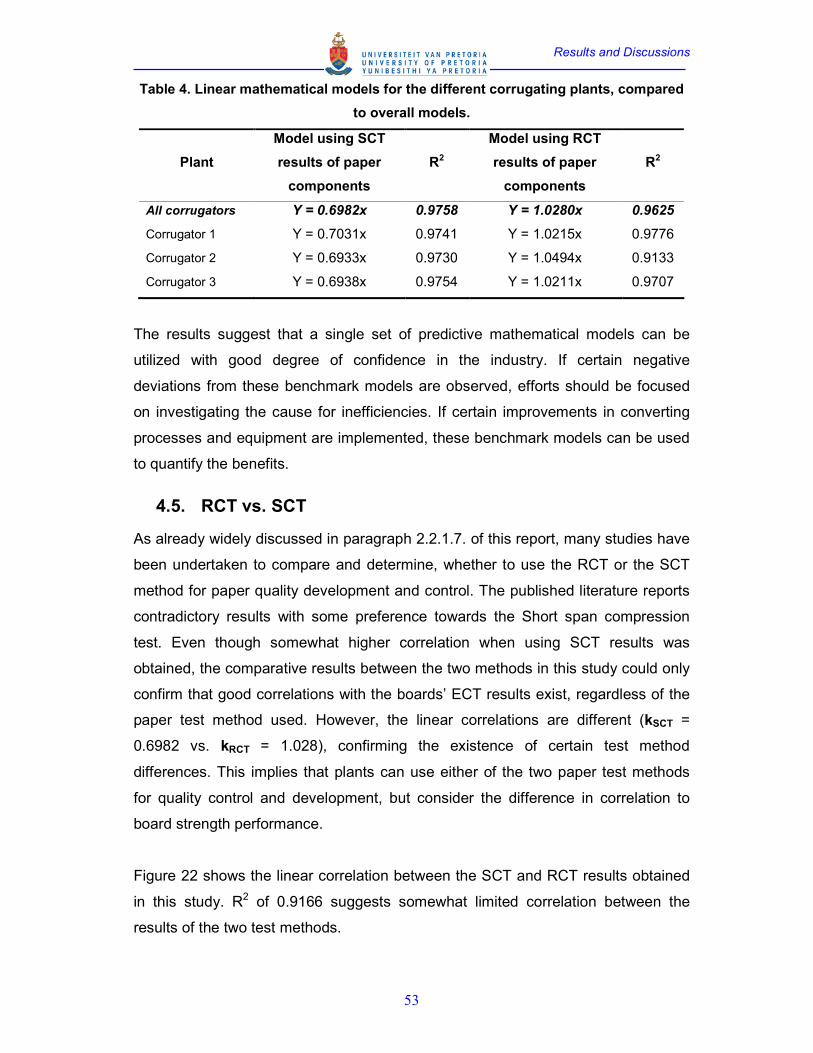
Results and Discussions
53
Table 4. Linear mathematical models for the different corrugating plants, compared
to overall models.
Plant
Model using SCT
results of paper
components
R2
Model using RCT
results of paper
components
R2
All corrugators Y = 0.6982x 0.9758 Y = 1.0280x 0.9625
Corrugator 1 Y = 0.7031x 0.9741 Y = 1.0215x 0.9776
Corrugator 2 Y = 0.6933x 0.9730 Y = 1.0494x 0.9133
Corrugator 3 Y = 0.6938x 0.9754 Y = 1.0211x 0.9707
The results suggest that a single set of predictive mathematical models can be
utilized with good degree of confidence in the industry. If certain negative
deviations from these benchmark models are observed, efforts should be focused
on investigating the cause for inefficiencies. If certain improvements in converting
processes and equipment are implemented, these benchmark models can be used
to quantify the benefits.
4.5. RCT vs. SCT
As already widely discussed in paragraph 2.2.1.7. of this report, many studies have
been undertaken to compare and determine, whether to use the RCT or the SCT
method for paper quality development and control. The published literature reports
contradictory results with some preference towards the Short span compression
test. Even though somewhat higher correlation when using SCT results was
obtained, the comparative results between the two methods in this study could only
confirm that good correlations with the boards’ ECT results exist, regardless of the
paper test method used. However, the linear correlations are different (kSCT =
0.6982 vs. kRCT = 1.028), confirming the existence of certain test method
differences. This implies that plants can use either of the two paper test methods
for quality control and development, but consider the difference in correlation to
board strength performance.
Figure 22 shows the linear correlation between the SCT and RCT results obtained
in this study. R2 of 0.9166 suggests somewhat limited correlation between the
results of the two test methods.
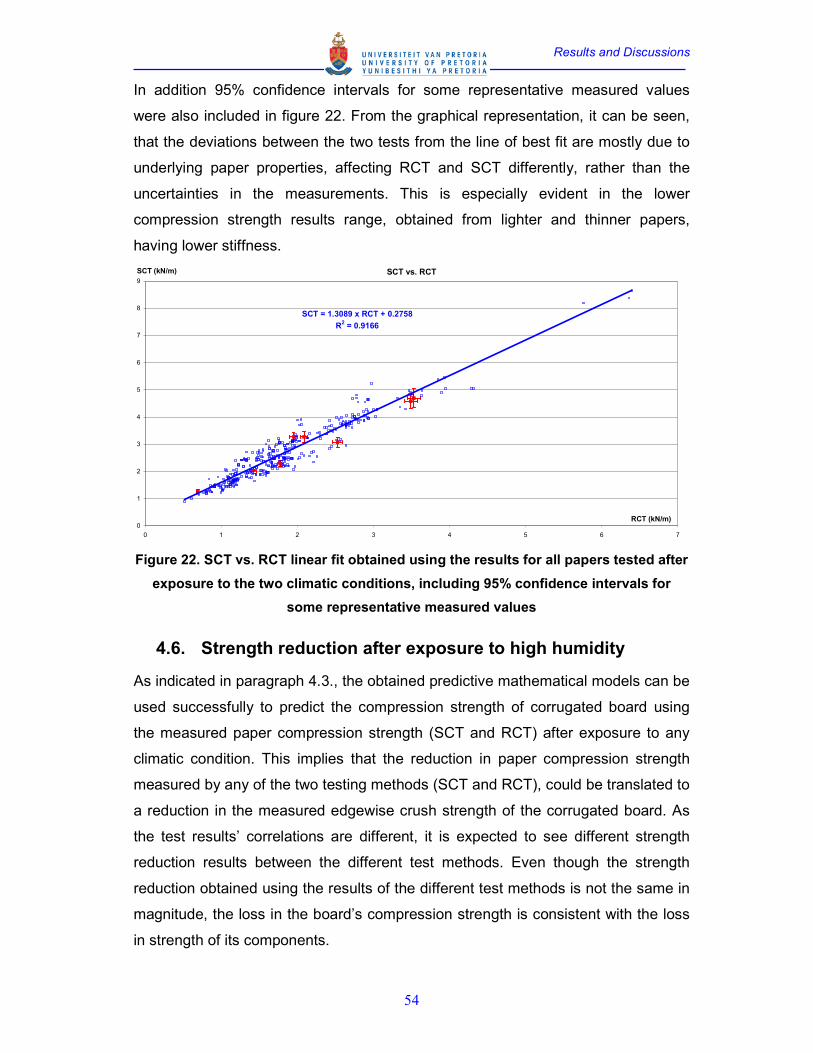
Results and Discussions
54
In addition 95% confidence intervals for some representative measured values
were also included in figure 22. From the graphical representation, it can be seen,
that the deviations between the two tests from the line of best fit are mostly due to
underlying paper properties, affecting RCT and SCT differently, rather than the
uncertainties in the measurements. This is especially evident in the lower
compression strength results range, obtained from lighter and thinner papers,
having lower stiffness.
SCT vs. RCT
SCT = 1.3089 x RCT + 0.2758
R2 = 0.9166
0
1
2
3
4
5
6
7
8
9
0 1 2 3 4 5 6 7
RCT (kN/m)
SCT (kN/m)
Figure 22. SCT vs. RCT linear fit obtained using the results for all papers tested after
exposure to the two climatic conditions, including 95% confidence intervals for
some representative measured values
4.6. Strength reduction after exposure to high humidity
As indicated in paragraph 4.3., the obtained predictive mathematical models can be
used successfully to predict the compression strength of corrugated board using
the measured paper compression strength (SCT and RCT) after exposure to any
climatic condition. This implies that the reduction in paper compression strength
measured by any of the two testing methods (SCT and RCT), could be translated to
a reduction in the measured edgewise crush strength of the corrugated board. As
the test results’ correlations are different, it is expected to see different strength
reduction results between the different test methods. Even though the strength
reduction obtained using the results of the different test methods is not the same in
magnitude, the loss in the board’s compression strength is consistent with the loss
in strength of its components.
Results and Discussions
55
The results in table A7 in Appendix 6 show the % reduction in ECT, SCT and RCT
of all boards and papers after exposure to high humidity. They confirm the above
expectations of different, but consistent, reduction in the measured strength, when
using the test methods under consideration.
Table 5 shows the average reduction in paper components’ SCT and RCT, as well
as in boards’ ECT, after exposure to high relative humidity conditions. As cited in
paragraph 2.3.2.2., Byrd (1984) reported that after exposure to somewhat similar
environmental conditions, the reduction in compressive strength of linerboard and
medium was about 56% and the corrugated board made of the same papers lost
about 60% of its edgewise compression strength. However, the test methods used
were different – FPL Lateral support for the papers and the waxed edges TAPPI
T811 for the boards (Byrd & Koning, 1978).
Somewhat similar results to the ones in table 5 were obtained by Whitsitt and
McKee (1972), who reported losses in edgewise compression strength of around
43% after exposure to 85%RH at 73°F, but the authors did not report the test
method used in their evaluation. As it was shown in figures 11 and 12, Van Eperen
and Robbins (1994) reported reduction of about 40% and 32% in SCT and RCT,
respectively, after the different papers were exposed to 80%RH at 23°C, which is
consistent with the results obtained in this study.
Table 5. Average percentage reduction in SCT and RCT results after exposure of
samples to high relative humidity conditions. For reference the reduction in ECT of
the board was 39.2%
Average reduction in compression strength of paper components Test
method Liner 1 Flute 1 Liner 2 Flute 2* Liner 3*
∆∆∆∆SCT 44.8% 41.0% 42.7% 37.8% 39.0%
∆∆∆∆RCT 37.2% 32.8% 34.9% 31.9% 32.8%
*Only double wall board types
From the results generated in this study a few additional observations can be
made. As these findings fall outside the objectives of this study, they will only be
outlined here and could be used to initiate further research in future:
Results and Discussions
56
• The reduction in compression strength (SCT and RCT) after exposure to
the same conditions is different for different papers (see table A7 in
Appendix 6). However, the combined effect of the different reduction in
strength of the components is reflected in the board’s ECT reduction, which
supports the conclusions already made above;
• In table 5, it can be seen that the average reduction in flute SCT and RCT
is lower than the average reduction in linerboards’ strength.
• The reduction in strength of Flute 2 and Liner 3 is on average lower than
Liner 1 and 2, and Flute 1.
The above difference in strength reduction after exposure to high humidity could be
somewhat related to the different paper grades and their furnish composition. Even
though Van Eperen and Robbins (1994) reported in their study no significant
difference in paper compression performance at high humidity conditions for papers
of different types or obtained from different sources, the results in this study clearly
show different strength reduction between papers. The results in table A7
(Appendix 6) do not show the paper grades and their furnish composition, as this
differentiation was outside the scope of this study. However, without referring to
specific paper manufacturers and their products, it was evident that Liner 1 on
average showed the highest reduction in SCT and RCT. Papers used in Liner 1
position were often white top linerboards, which indicates somewhat poorer
performance of these papers after exposure to high humidity conditions, increasing
the average SCT and RCT reduction for Liner 1. Further, for single wall boards,
often the fluting grade used had recycled fiber furnish, compared to the double wall
boards. Double wall boards are often used for corrugated boxes requiring high
stacking strength. These boards were mostly made with fluting grades made of
semi-chemical furnish, thus the lower average reduction in SCT and RCT of Flute 2
compared to Flute 1. This differentiated performance of the semi-chemical fluting
grades contributes to the observed difference in strength reduction between the
liners and the flutings average results. Most of the double wall boards in this study
were also constructed using high performance virgin linerboards, compared to the
single wall boards, where often linerboards made of recycled fiber furnish are
utilized. The differentiated performance at high humidity of these high performance

Results and Discussions
57
virgin linerboard grades is evident from the SCT and RCT average results, when
comparing Liner 1 and 2, against Liner 3 in table 5.
These observations could explain the stated above points, but as indicated earlier,
further research is recommended to investigate and confirm these findings.
Conclusions
58
5. Conclusions
The extensive literature investigation indicated that the compression strength of any
corrugated board box is a direct measure of its stacking strength. Box stacking life
depends in part on the perimeter of the box, as well as on the combined board
edgewise compression strength and its flexural rigidity. In general, the higher the
edgewise compression strength and flexural rigidity of the corrugated board, the
higher the box stacking strength, with the first having much larger influence, as
expressed by the McKee equation (1).
The relationship between the corrugated board edgewise compression strength
(ECT) and its components’ characteristics can be analyzed in many ways. Some of
the reported in literature relationships between paper and board properties have
become progressively more complex as the models have been refined to take into
account all of the important structural and component characteristics. These
models can be used for detailed research and development purposes, but they are
too complicated for practical use.
A more useful approach to predict the compression strength of the corrugated
board is to sum the compressive strengths of the linerboards and medium making
up the corrugated board, allowing for the draw of the medium. This approach gives
good predictive accuracies, if based on appropriate statistical weighting factors.
The general format of this mathematical model is given by the so called Maltenfort
equation:
ECT = k (σσσσc,L1 + σσσσc,L2 + ασασασασc,F)
The constant k is dependent on the paper and board compression strength test
methods used, as well as on the impact from manufacturing variables at the
corrugating plants.
The FPL Neck-Down test method resembles best the failure of the corrugated
board under pure compression, but this method is somewhat difficult to be used in
manufacturing environment and commercially available equipment for sample
Conclusions
59
preparation is limited. Therefore the more user-friendly and widely spread FEFCO
No. 8 (ISO 3037:1994(E)) was utilized in this investigation, knowing its limitations.
In order to develop a representative mathematical model correlating the
compression strengths of board and its components, adequate paper and board
compression strength test methods should be selected. The two most widely used
paper compression strength test methods in the industry are the Ring crush test
(RCT) and the STFI Short-span compression test (SCT). Certain limitations
regarding the Ring crush testing method exist, pointing out that this method does
not measure the true intrinsic edgewise compressive strength. Preferences were
given in literature to the use of the STFI Short-span compression test.
As boxes are generally being transported at different climatic conditions stacked on
top of each other, when environmental conditions change, the compression
strength of the boxes changes. A corrugated box loses 50-60% or more of its short-
term top load box compression strength when the relative humidity is increased
from 50 to 90%. The major factor affecting the stacking performance of corrugated
containers is the moisture content of the board. The equilibrium moisture content of
paper is dependent on the ambient temperature and relative humidity among other
factors. Moisture and temperature are perhaps the most important environmental
variables affecting the strength properties of paper and board. As moisture content
increases, ultimate paper strength properties are reduced, due to a reduction in
inter-fiber bonding rather than fiber tensile strength. Corrugated board loses about
60% of its initial strength, when the relative humidity is increased from 50 to 90%.
For the same change in climatic conditions, paper loses about 32% to 55% of its
compression strength, depending on the test method used to measure the strength.
The reduction in compression strength of paper, board and the final box product
are correlated, but the reduction is dependent on the testing methodology
employed.
The above literature findings indicated that by selecting suitable paper and board
compression strength testing methods, reliable predictive mathematical models can
be established. The mathematical models should be able to correlate board
performance at any climatic conditions, by measuring the paper properties at these
Conclusions
60
conditions. This can further be extrapolated to predict indirectly the final corrugated
box stacking performance at the anticipated climatic conditions.
It must be noted that the compressive strength of a material does not accurately
predict the compressive creep performance for any environmental condition. It had
been reported that under cyclic humidity conditions, creep rate is faster than it is at
any constant humidity level. This phenomenon is known as accelerated creep.
Unlike the compressive strength tests, creep tests allow the material to deform and
distribute the stresses in an optimal manner. However, the scope of this study was
limited to the evaluation of the short-term compression strength of corrugated board
and its components after exposure to certain environmental conditions, thus
moisture-accelerated creep behaviour of paper and its derivatives was only noted.
The experimental work conducted in this investigation and the results generated
were used to determine the linear regression constants in the Maltenfort model,
correlating the measured ECT with the predicted ECT, using the paper
components’ compression strengths, measured using the SCT and RCT methods.
The obtained predictive mathematical models are as follows:
ECT = 0.6982 (SCTL1 + SCTL2 + SCTL3 + αααα1111SCTF1 + αααα2222SCTF2)
R2SCT = 0.9758
ECT = 1.028 (RCTL1 + RCTL2 + RCTL3 + αααα1111RCTF1 + αααα2222RCTF2)
R2RCT = 0.9625
where the ECT, SCT and RCT are in kN/m, the correlating constant (k) is
dimensionless and αααα is the profile and plant specific flute take up factor. The
models showed very high coefficients of determination, which confirmed that the
two models can be used successfully to predict the compression strength of any
type of corrugated board, using the measured paper compression strength (SCT
and RCT) after exposure to any constant climatic condition. These predictive
mathematical models are comparable to similar models reported in literature.
Conclusions
61
It was also of interest for this study to determine whether the models obtained for
the participating corrugating plants differ. The results indicated that the plant
specific predictive mathematical models compared well to the overall linear models
and that no major difference exists between the plants’ capabilities to convert the
paper compression strength into corrugated board edgewise crush strength. These
results suggested that a single set of predictive mathematical models can be
utilized with good degree of confidence in the South African industry. If certain
negative deviations from these benchmark models are observed, efforts should be
focused on investigating the cause for inefficiencies. If certain improvements in
converting processes and equipment are implemented, these benchmark models
can be used to quantify the benefits.
The models would allow packaging technologists in the field to select adequate
paper substrates, with certain strength characteristics, to manufacture corrugated
board with the necessary compression strength for achieving a desired carton
performance for certain climatic condition.
One of the objectives of this study was to compare the board strength predictability
when using the RCT or the SCT paper test methods. Even though somewhat
higher correlation when using SCT results was obtained, the comparative results
between the two methods in this study could only confirm that good correlations
with the boards’ ECT results exist, regardless of the paper test method used. This
implies that plants can use either of the two paper test methods for quality control
and development, but consider the difference in correlation to board strength
performance. The linear correlation between the SCT and RCT results obtained in
this study, suggested somewhat limited correlation between the results of the two
test methods:
SCT = 1.3089 x RCT + 0.2758
R2 = 0.9166
The results in this study showed that the reduction in compression strength (SCT
and RCT) after exposure to the same conditions is different for different papers, but
the combined effect of the board’s components is reflected in the board’s ECT
Conclusions
62
reduction. It was speculated that the difference in strength reduction after exposure
to high humidity could be somewhat related to the different paper grades and their
furnish composition. In general high performance virgin linerboards and semi-
chemical fluting papers showed lower reduction in SCT and RCT after exposure to
high humidity conditions. However, these observations suggest the need to conduct
further research in this area in order to investigate the fundamentals behind these
findings.
Reference List
63
6. Reference List
Alava, M. and Niskanen, K. (2006) “The physics of paper”, Reports on Progress in
Physics, (69), 669 – 723.
Back, E. L., Salmen, L. and Richardson, G. (1983) “Transient effects of moisture
sorption on the strength properties of paper and wood-based materials”, Svensk.
Papperstid., 86(15), R61 – R71.
Back, E. L., Salmen, L. and Richardson, G. (1985) “Means to reduce transient
effects on mechanical properties of paper during moisture sorption”, J. Pulp Paper
Sci., 11(1), J8 – J12.
Barkas, W. W. (1951) “The Swelling of Wood under Stress. A Discussion of its
Hygroscopic, Elastic and Plastic Properties”, H. M. Stationary Office, London.
Batelka, J. J. (2000) “The comparative response of ring crush test and STFI short
span crush test to paper mill process variable changes”, Corrugating International,
2(4), 163 – 169.
Batten, G. L. Jr. and Nissan, A. H. (1987) “Unified theory of the mechanical
properties of paper and other H-bond-dominated solids – Part 1”, Tappi J., 70(9),
119 – 123.
Boonyasarn, A., Harte, B. R., Twede, D. and Lee, J. L. (1992) “The effect of cyclic
environments on the compression strength of boxes made from high-performance
(fiber-efficient) corrugated fiberboard”, Tappi J., 75(10), 79 – 85.
Byrd, V. L. (1972) “Effect of relative humidity changes during creep on handsheet
paper properties”, Tappi J., 55(2), 247 – 252.
Byrd, V. L. and Koning, J. W., Jr. (1978) “Edgewise compression creep in cyclic
relative humidity environments”, Tappi J., 61(6), 35 – 37.
Reference List
64
Byrd, V. L. (1984) “Edgewise compression creep of fiberboard components in a
cyclic-relative-humidity environment”, Tappi J., 67(7), 86 – 90.
Cavlin, S. and Fellers, C. (1945) “A new method for measuring the edgewise
compression properties of paper”, Svensk Papperstidn, 78(9), 321 – 332.
Chalmers, I. (2001) “A comparison between static and cyclic humidity compression
creep performance of linerboard”, Appita J., 54(5), 435 – 438.
Coffin, D. and Habeger, C. (1999) “Accelerated Creep Mechanics: Parts I and II”,
IPST Technical Paper Series, Number 795.
Considine, J. M., Gunderson, D. E., Thelin, P. and Fellers, C. (1989) “Compressive
creep behavior of paperboard in a cyclic humidity environment - exploratory
experiment”, Tappi J., 82(11), 131.
Considine, J. M., Stoker, D. L., Laufenberg, T. L. and Evans, J. E. (1994)
“Compressive creep behavior of corrugating components affected by humid
environment”, Tappi J., 77(1), 87 – 95.
Crook, D. M. and Bennett, W. E. (1965) “The effect of humidity and temperature on
the physical properties of paper”, The British Paper and Board Industry Research
Association.
Dahl, C.B. (1985) “Limited range of the ring crush test”, Tappi J., 68(10), 108 – 109.
Ericksson, L. E. (1979a) “A review of the edge crush test. Part 1”, Boxboard
Containers, 86(8), 34 – 38.
Ericksson, L. E. (1979b) “A review of the edge crush test. Part 2”, Boxboard
Containers, 86(9), 64 – 67.
Everett, D. H. (1967) The Solid Gas-Interface, in E. A. Flood, Ed., Marcel Dekker,
New York, Vol. 2.
Reference List
65
Fellers, C. and Jonsson, P. (1975) “Compression strength of linerboard and
corrugated medium: An analysis of testing methods”, Svensk Papperstidn, 78(5),
172 – 175.
Fellers, C., de Ruvo, A., Elfstrom, J. and Htun, M. (1980) “Edgewise compression
properties. A comparison of hand sheets made from pulps of various yields”, Tappi
J., 63(6), 109 – 112.
Fellers, C. and Donner, B. C. (2002) Edgewise compression strength of paper, in
Handbook of Physical Testing of Paper, Vol. 1, 2nd Ed., M. Dekker, Inc., Basel,
Switzerland.
Fellers, C and Laufenberg, T. L. (1995) “Moisture-induced creep behaviour of paper
and board”, STFI, Stockholm.
Frank, B. (2003) “Ring crush and short span compression for predicting edgewise
compressive strength”, Tappi J., 2(9), 1 – 4.
Frank, B. (2007) “Revisiting paper strength measurements for estimating combined
board strength”, Tappi J., 6(9), 10 – 17.
Gunderson, D. (1983) “Edgewise compression of paperboard: A new concept of
lateral support”, Appita J., 37(2), 137 – 141.
Gunderson, D. (1984) “A comparison of three methods for determining the
edgewise compressive properties of paperboard”, Appita J., 37(4), 307 – 314.
Gunderson, D. E. and Tobey, W. E. (1990), Tensile creep of paperboard-effect of
humidity change rates. In: Passaretti JD, Caulfield DF, Roy R, Setterholm V (eds),
“Materials interactions relevant to the pulp, paper and wood industries”, MRS
Symposium Proceedings vol. 197. Warrendale: Materials Research Society.
Reference List
66
Gutmann, H., Nelson W. J. and Yerke, J. F. (1993) “Rule 41 implications for
linerboard producers”, Tappi J., 76(1), 158 – 163.
Haslach, H. W. (2000) “The moisture and rate-dependent mechanical properties of
paper: A review”, Mech. Time-Depend. Mater., 4, 169 – 210.
Jackson, C. A., Koning, J. W. and Gatz, W. A. (1978) “Edgewise compression test
of paperboard by a new method”, Pulp Paper Mag. Can., 77(10), T180 – T183.
Jackson, T. and Parker, I. (1998) “The shape of the ring crush curve”, Appita J.,
51(5), 349.
Jonson, G. and Ponton, S. (1984) “Utilization of liner/fluting weight in corrugated
board for best box performance”, Corrugated Containers Conference, Tappi
Proceedings.
Johnson, M. W., Urbanik, J. J. and Denniston, W. E. (1979), U.S. Forest Products
Laboratory Report No. 348.
Johnson, M. W. and Urbanik, J. J. (1989) “Analysis of the localized buckling in
composite plate strictures with application to determining the strength of corrugated
fiberboard”, Journal of Composites Technology & Research, JCTRER, 11(4), 121 –
127.
Ju, S., Gurnagul, N. and Shallhorn, P. (2005) “A comparison of the effects of
papermaking variables on ring crush strength and short-span compressive strength
of paperboard”, Paper presented at the Annual Meeting of the Pulp and Paper
Technical Association of Canada, Montreal, 7–10 February.
Kajanto, I. and Niskanen, K. (1998) Dimensional stability, in Paper Physics, K.
Niskanen (Ed.), Fapet Oy, Helsinki, Finland.
Kellicutt, K. Q. (1960) “Structural design notes for corrugated containers: stacking.
Note no. 17”, Packaging Engineering, 5(6), 124-126.
Reference List
67
Kellicutt, K. Q. (1961) “How paperboard properties affect corrugated container
performance”, Tappi J., 44(1), 201A – 204A.
Kloth, G. R. Whitsitt, W. J. and Fox, T. S. (1977) “Comparative evaluation of
methods of evaluating edgewise compression strength of containerboard”, A
Summary Report to the Technical Division of the FKBI, Inc., Project 2694-13, July
15.
Koning, J. W., Jr. (1964) “A short column test of corrugated fiberboard”, Tappi J.,
47(3), 134 – 137.
Koning, J. W., Jr. (1975) “Compressive properties of linerboard as related to
corrugated fiberboard containers: a theoretical model”, Tappi J., 58(12), 105 – 108.
Koning, J. W., Jr. (1978), “Compressive properties of linerboard as related to
corrugated fiberboard containers”, Tappi J., 61(8), 69 – 71.
Koning, J. W., Jr. (1983) Corrugated Fiberboard, in Handbook of Physical and
Mechanical Testing of Paper and Paperboard, Vol. I, 1st Ed., R. E. Mark, Marcel
Dekker, New York.
Koning, J. W., Jr. and Moody, R. C. (1971) “Predicting flexural stiffness of
corrugated fiberboard”, Tappi J., 54(11), 1879 – 1881.
Koning, J. W. and Stern, R. K. (1977) “Long-term creep in corrugated fiberboard
containers”, Tappi J., 60(12), 128 – 131.
Langaard, O. (1968) “Optimization of corrugated board construction with regard to
compressive resistance of boxes”, Verpackungs-Folien/Papiere, 11, 14 – 20.
Maltenfort, G. G. (1956) Compression strength of corrugated containers. Parts 1-4.,
in Fiber Containers 41.
Reference List
68
Maltenfort, G. G. (1988) “Testing IV. Methods for combined board”, in Corrugated
Shipping Containers: An Engineering Approach, Jelmar, Plainview, NY, Chap. 19.
Markstrom, H. (1999) Testing Methods and Instruments for Corrugated Boards, 5th
Ed., Lorentzen & Wettre, Ostervala.
McKee, R. C. and Gander, J. W. (1962) “A study of the dominant factors of box
compression strength. Verification of the simplified formula for top-load
compression strength of commercial boxes”, A Preliminary Report to the Technical
Division of the FKBI, Inc., Project 1108-4, January 12.
McKee, R. C., Gander, J. W. and Wachuta, J. R. (1961) “Edgewise compression
strength of corrugated board”, Paperboard Packaging, 46(11), 70 – 76.
McKee, R. C., Gander, J. W. and Wachuta, J. R. (1962) “Flexural stiffness of
corrugated board”, Report One to the Technical Division of the FKBI, March 4.
Moody, R. C. (1965) "Edgewise compressive strength of corrugated fiberboard as
determined by local instability", USDA For. Serv. Res. Pap., FPL 46, Forest
Products Laboratory, Madison, Wis.
Moody, R.C. and Koning, J.W., Jr., (1966) "Effect of loading rate on the edgewise
compressive strength of corrugated fiberboard", USDA For. Serv. Res. Note: FPL-
0121, Forest Products Laboratory, Madison, Wis.
Ostrowski, H. J. (1960) “The new H&D stiffness test for predicting the stacking
strength of corrugated containers”, Pulp Paper Mag. Can., 61(C), T130 – T132.
Popil, R. E., Coffin, D. C. and Kaewmanee, P. (2004) “The role of liner buckling on
the edgewise compressive strength of corrugated board”, Abstract for 2004
Progress in Paper Physics Seminar.
Prahl, J. M. (1968) “Thermodynamics of Paper Fiber and Water Mixtures”, PhD
thesis, Harvard Univ., Cambridge, MA.
Reference List
69
Rennie, G. S. (1995) “Quantifying the relationship between the short span
compression and ring crush tests”, Tappi J., 78(7), 183.
Salmen, N. L. and Back, E. L. (1977) “The influence of water on the glass transition
temperature of cellulose”, Tappi J., 60(12), 137 – 141.
Salmen, N. L. (1982) “Temperature and water induced softening behaviour of wood
fiber based materials” in Paper structure and properties, Ph.D. thesis, Royal Inst.
Technol., Stockholm.
Schrampfer, K. E., Whitsitt, W. J. and Baum, G. A. (1987) “Combined board edge
crush (ECT) technology”, A Progress Report to the Technical Division of the FKBI,
Inc., Project 2695-24, February 27.
Seth, R. S. and Soszynski, R. M. (1979) “An evaluation of methods for measuring
the intrinsic edgewise compressive strength of paper”, Tappi J., 62(10), 125 – 127.
Seth, R. S. (1983) “Intrinsic edgewise compressive strength of paper: A comparison
of the short and finite span methods”, Tappi J., 66(5), 97 – 100.
Seth, R. S. (1984) “Edgewise compressive strength of paperboard and the ring
crush test”, Tappi J., 67(2), 114 – 115.
Seth, R. S. (1985) “Relationship between edgewise compressive strength of
corrugated board and its components”, Tappi J., 68(3), 98 – 101.
Setterholm, V. C. and Gertjejansen, R. O. (1965) “Method for measuring the
edgewise compressive properties of paper”, Tappi J., 48(5), 308 – 312.
Shallhorn, P., Ju, S. and Gurnagul, N. (2005) “A model for ring crush test of
paperboard”, JPPS, 31(3), 143 – 146.
Reference List
70
Steadman, R. (2002) Corrugated board, in Handbook of Physical Testing of Paper,
Vol. 1, 2nd Ed., Mark, Haberger, Borch and Lyne, Marcel Dekker, Inc., Basel,
Switzerland.
Stockmann, V. (1976) “Measurement of intrinsic compressive strength of paper”,
Tappi J., 59(7), 93 – 97.
The Institute of Paper Chemistry (1963a) “Relationship between the edgewise
compression strength of combined board and component properties”, A Preliminary
Report to the Technical Division of the FKBI, Inc., Project 1108-4, June 18.
The Institute of Paper Chemistry (1963b) “An investigation of test methods for
determining the edgewise compression strength of the components of combined
board. Part II. Development of a modified ring compression test and its relationship
to combined board strength. Compression report 78.
The Institute of Paper Chemistry (1965) “Effect of test rate and conditioning time on
edgewise compression”, A Preliminary Report to the Technical Division of the FKBI,
Inc., Project 1108-4, February 2.
Twede, D. and Selke, E. M. (2005), Cartons Crates and Corrugated Board.
Handbook Paper and Wood Packaging Technology, DESTech Publications,
Pennsylvania.
Urquhart, A. R. and Williams, A. M. (1924) “The moisture relations of cotton, the
effect of temperature on the absorption of water by soda-boiled cotton”, J. Textile
Inst., 15(12), T559.
Van Eperen, R. H. and Sprague, C. H. (1983) “ECT/component relationships”,
Report Two: A progress report to FKBG of the American Paper Institute and Fiber
Box Association, Institute of Paper Chemistry, Project 3511, Appleton, Wisconsin.
Van Eperen, R. H. and Robbins, W. B. (1994) “The effect of moisture content on
ring crush and short span compressive strength”, A Summary Report to the
Reference List
71
Containerboard and Kraft Paper Group of the American Forest and Paper
Association, The Institute of Paper Science and Technology, Project 3817, Atlanta,
Georgia.
Waterhouse, J. F. (1984) “The Ultimate Strength of Paper”, Progress in Paper
Physics - A Seminar, Design Criteria for Paper Performance, Stockholm, Sweden,
June 25-29.
Westerlind, B. S. and Carlsson, L. A. (1992) “Compressive response of corrugated
board”, Tappi J., 75(7), 145 – 154.
Whitsitt, W. J., Gander, J. W. and McKee, R. C. (1967) “Stacking behaviour of
boxes and corrugated board”, A Summary Report to the Technical Division of the
FKBI, Inc., Project 1108-30, April 12.
Whitsitt, W. J., Gander, J. W. and McKee, R. C. (1968) “Effect of box dimensions
and combined board creep life on box creep life”, A Summary Report to the
Technical Division of the FKBI, Inc., Project 2695-2, November 15.
Whitsitt, W. J. and McKee, R. C. (1972) “Effect of relative humidity and temperature
on stacking performance”, A Summary Report to the Technical Division of the
FKBI, Inc., Project 2695-9, November 10.
Whitsitt, W. J. (1985) “Compressive strength relationships and factors”, IPC
Technical Paper Series, Number 163.
Whitsitt, W. J. and Baum, G. A. (1985) “Relationships between elastic properties
and end-use performance”, Report One to the Technical Division of the FKBI, Inc.,
Project 2695-23, January 30.
Whitsitt, W. J. and Sprague, C. H. (1986) “Compressive strength retention during
fluting. Part I. Strength losses in fluting”, IPC Technical Paper Series, No. 167, May.
Reference List
72
Whitsitt, W. J. (1988) “Papermaking factors affecting box properties”, IPC Technical
Paper Series, No. 288, May.
Wink, W. A. (1961) “The effects of relative humidity and temperature on paper
properties”, Tappi J., 44(177), 171A – 180A.
Yamazaki, H. and Munakata, Y. (1993) in Products of Papermaking, C. F. Baker,
Ed., Pira International, Leatherhead, Vol. 2.
Yeh, K. C., Considine, J. M. and Suhling, J. C. (1991) “The influence of moisture
content on the nonlinear constitute behaviour of cellulosic materials”, International
Paper Physics Conference Proceedings, Tappi Press, Atlanta, Book 2.
Zauscher, S., Caulfield, D. F. and Nissan, A. H. (1996) “The influence of water on
the elastic modulus of paper”, Tappi J., 79(12), 178 – 182.
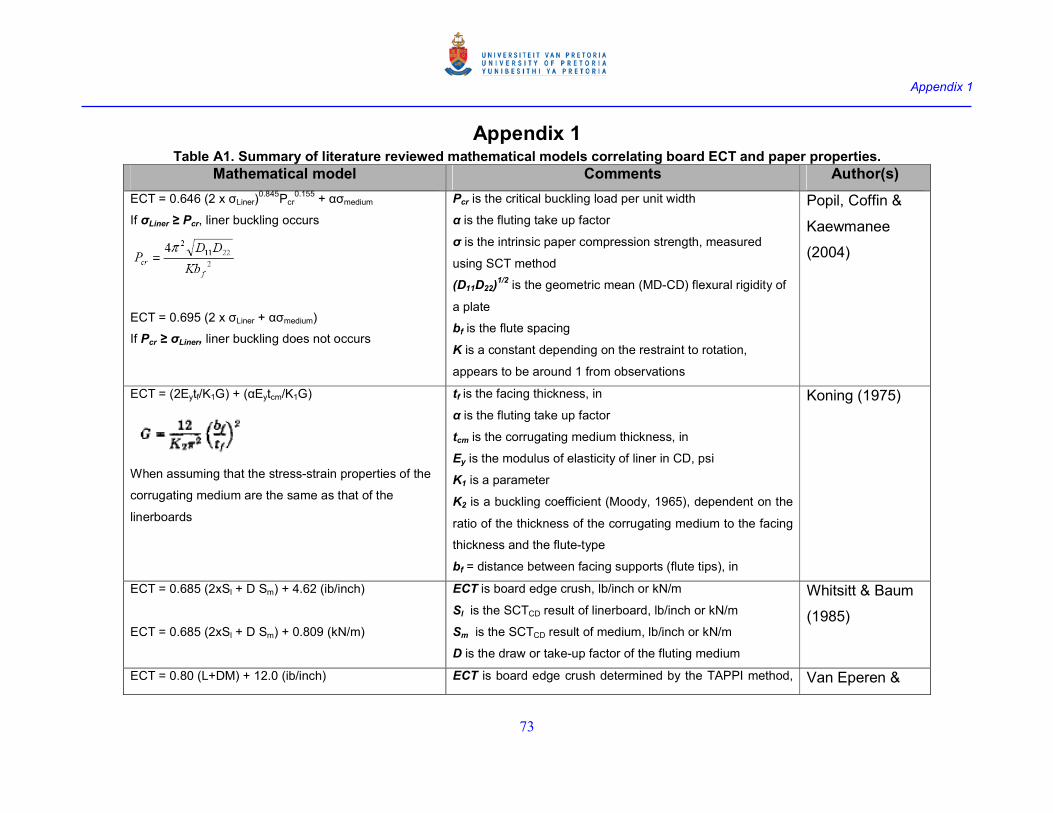
Appendix 1
73
Appendix 1 Table A1. Summary of literature reviewed mathematical models correlating board ECT and paper properties.
Mathematical model Comments Author(s)
ECT = 0.646 (2 x σLiner)0.845
Pcr0.155
+ ασmedium
If σLiner ≥ Pcr, liner buckling occurs
ECT = 0.695 (2 x σLiner + ασmedium)
If Pcr ≥ σLiner, liner buckling does not occurs
Pcr is the critical buckling load per unit width
α is the fluting take up factor
σ is the intrinsic paper compression strength, measured
using SCT method
(D11D22)1/2 is the geometric mean (MD-CD) flexural rigidity of
a plate
bf is the flute spacing
K is a constant depending on the restraint to rotation,
appears to be around 1 from observations
Popil, Coffin &
Kaewmanee
(2004)
ECT = (2Eytf/K1G) + (αEytcm/K1G)
When assuming that the stress-strain properties of the
corrugating medium are the same as that of the
linerboards
tf is the facing thickness, in
α is the fluting take up factor
tcm is the corrugating medium thickness, in
Ey is the modulus of elasticity of liner in CD, psi
K1 is a parameter
K2 is a buckling coefficient (Moody, 1965), dependent on the
ratio of the thickness of the corrugating medium to the facing
thickness and the flute-type
bf = distance between facing supports (flute tips), in
Koning (1975)
ECT = 0.685 (2xSl + D Sm) + 4.62 (ib/inch)
ECT = 0.685 (2xSl + D Sm) + 0.809 (kN/m)
ECT is board edge crush, lb/inch or kN/m
Sl is the SCTCD result of linerboard, lb/inch or kN/m
Sm is the SCTCD result of medium, lb/inch or kN/m
D is the draw or take-up factor of the fluting medium
Whitsitt & Baum
(1985)
ECT = 0.80 (L+DM) + 12.0 (ib/inch) ECT is board edge crush determined by the TAPPI method, Van Eperen &
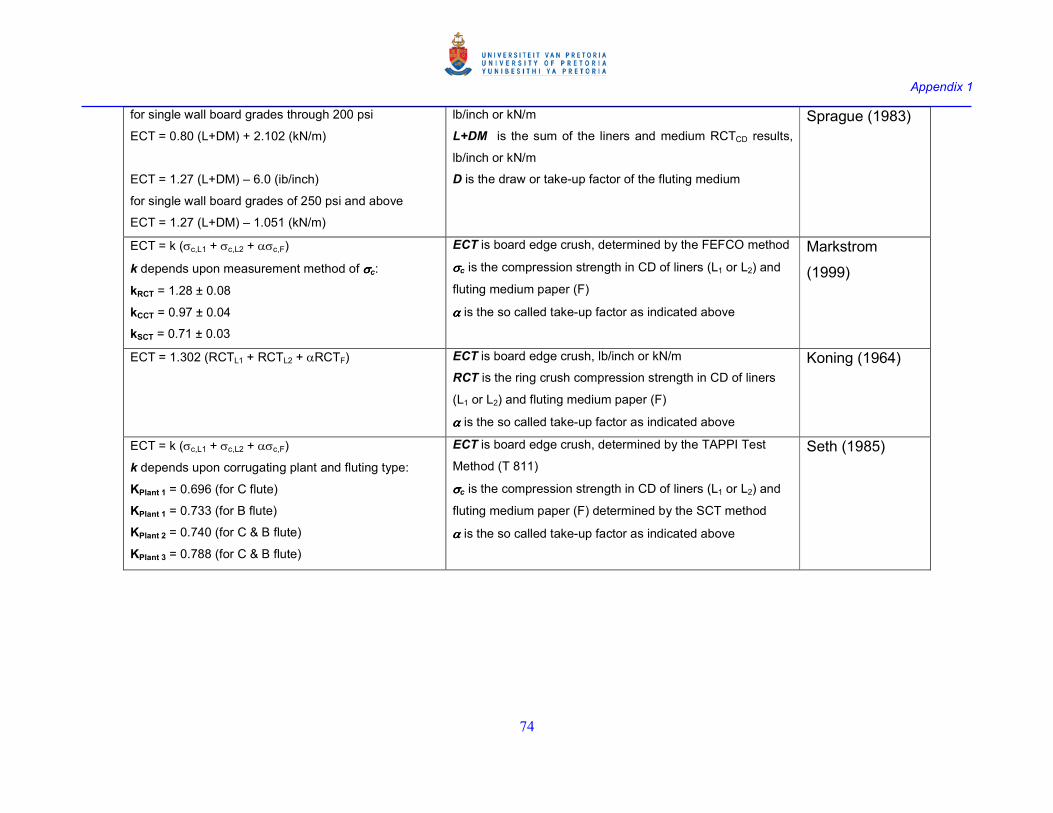
Appendix 1
74
for single wall board grades through 200 psi
ECT = 0.80 (L+DM) + 2.102 (kN/m)
ECT = 1.27 (L+DM) – 6.0 (ib/inch)
for single wall board grades of 250 psi and above
ECT = 1.27 (L+DM) – 1.051 (kN/m)
lb/inch or kN/m
L+DM is the sum of the liners and medium RCTCD results,
lb/inch or kN/m
D is the draw or take-up factor of the fluting medium
Sprague (1983)
ECT = k (σc,L1 + σc,L2 + ασc,F)
k depends upon measurement method of σσσσc:
kRCT = 1.28 ± 0.08
kCCT = 0.97 ± 0.04
kSCT = 0.71 ± 0.03
ECT is board edge crush, determined by the FEFCO method
σσσσc is the compression strength in CD of liners (L1 or L2) and
fluting medium paper (F)
αααα is the so called take-up factor as indicated above
Markstrom
(1999)
ECT = 1.302 (RCTL1 + RCTL2 + αRCTF) ECT is board edge crush, lb/inch or kN/m
RCT is the ring crush compression strength in CD of liners
(L1 or L2) and fluting medium paper (F)
αααα is the so called take-up factor as indicated above
Koning (1964)
ECT = k (σc,L1 + σc,L2 + ασc,F)
k depends upon corrugating plant and fluting type:
KPlant 1 = 0.696 (for C flute)
KPlant 1 = 0.733 (for B flute)
KPlant 2 = 0.740 (for C & B flute)
KPlant 3 = 0.788 (for C & B flute)
ECT is board edge crush, determined by the TAPPI Test
Method (T 811)
σσσσc is the compression strength in CD of liners (L1 or L2) and
fluting medium paper (F) determined by the SCT method
αααα is the so called take-up factor as indicated above
Seth (1985)
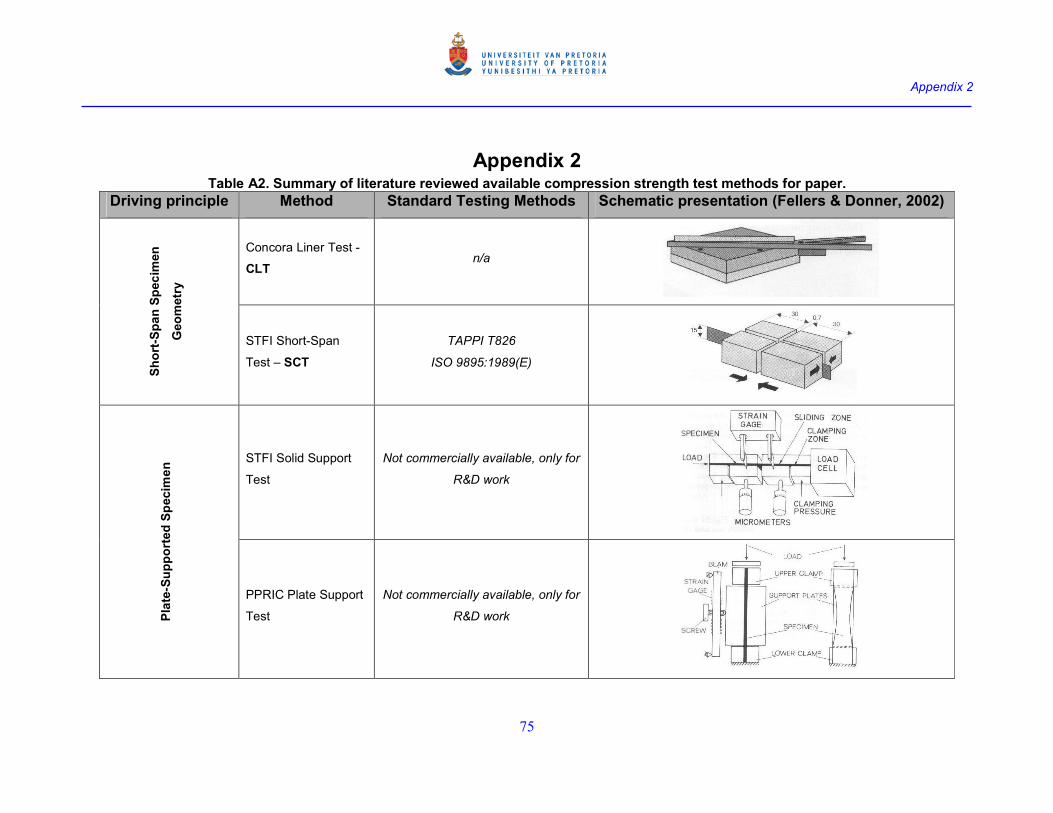
Appendix 2
75
Appendix 2 Table A2. Summary of literature reviewed available compression strength test methods for paper.
Driving principle Method Standard Testing Methods Schematic presentation (Fellers & Donner, 2002)
Concora Liner Test -
CLT n/a
Short-Span Specim
en
Geometry
STFI Short-Span
Test – SCT
TAPPI T826
ISO 9895:1989(E)
STFI Solid Support
Test
Not commercially available, only for
R&D work
Plate-Supported Specim
en
PPRIC Plate Support
Test
Not commercially available, only for
R&D work
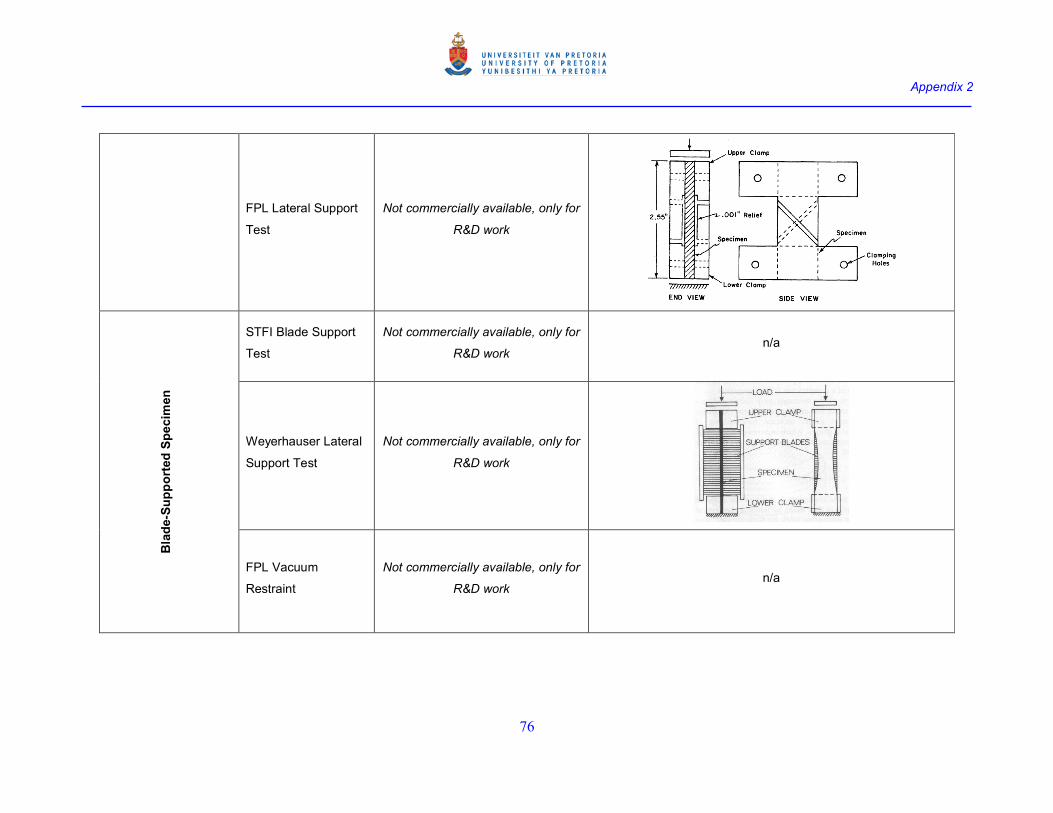
Appendix 2
76
FPL Lateral Support
Test
Not commercially available, only for
R&D work
STFI Blade Support
Test
Not commercially available, only for
R&D work n/a
Weyerhauser Lateral
Support Test
Not commercially available, only for
R&D work
Blade-Supported Specim
en
FPL Vacuum
Restraint
Not commercially available, only for
R&D work n/a
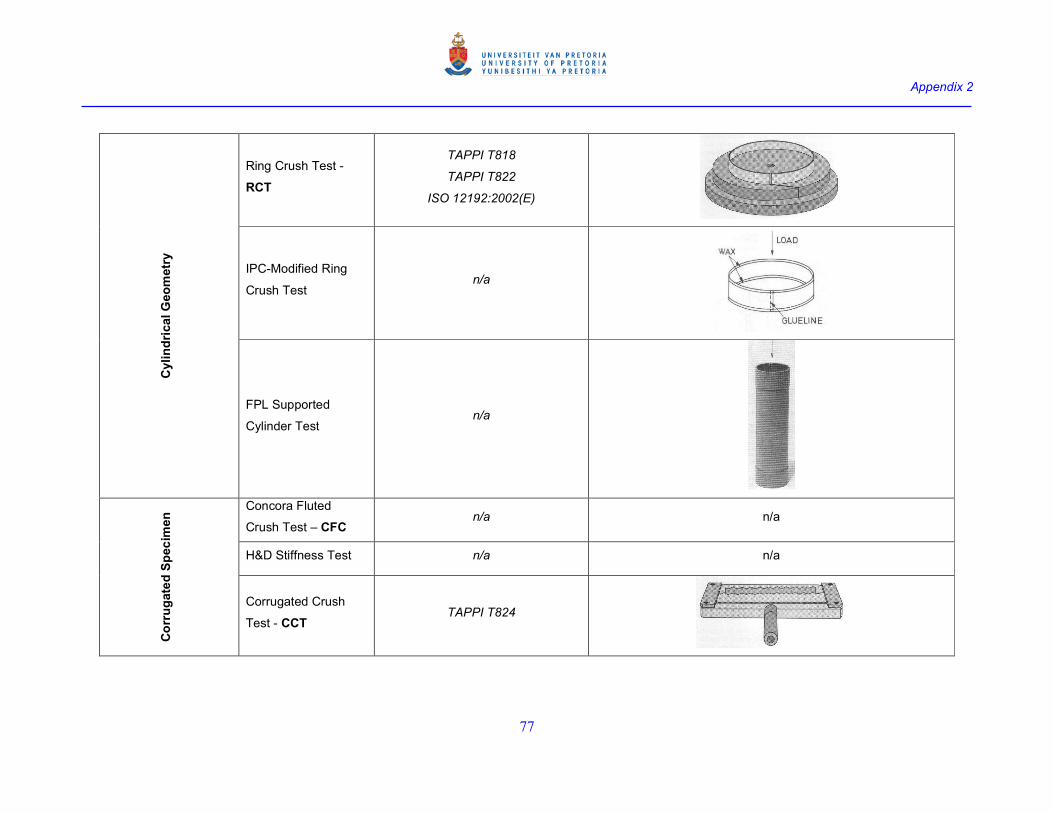
Appendix 2
77
Ring Crush Test -
RCT
TAPPI T818
TAPPI T822
ISO 12192:2002(E)
IPC-Modified Ring
Crush Test n/a
Cylindrical Geometry
FPL Supported
Cylinder Test n/a
Concora Fluted
Crush Test – CFC n/a n/a
H&D Stiffness Test n/a n/a
Corrugated Specim
en
Corrugated Crush
Test - CCT TAPPI T824
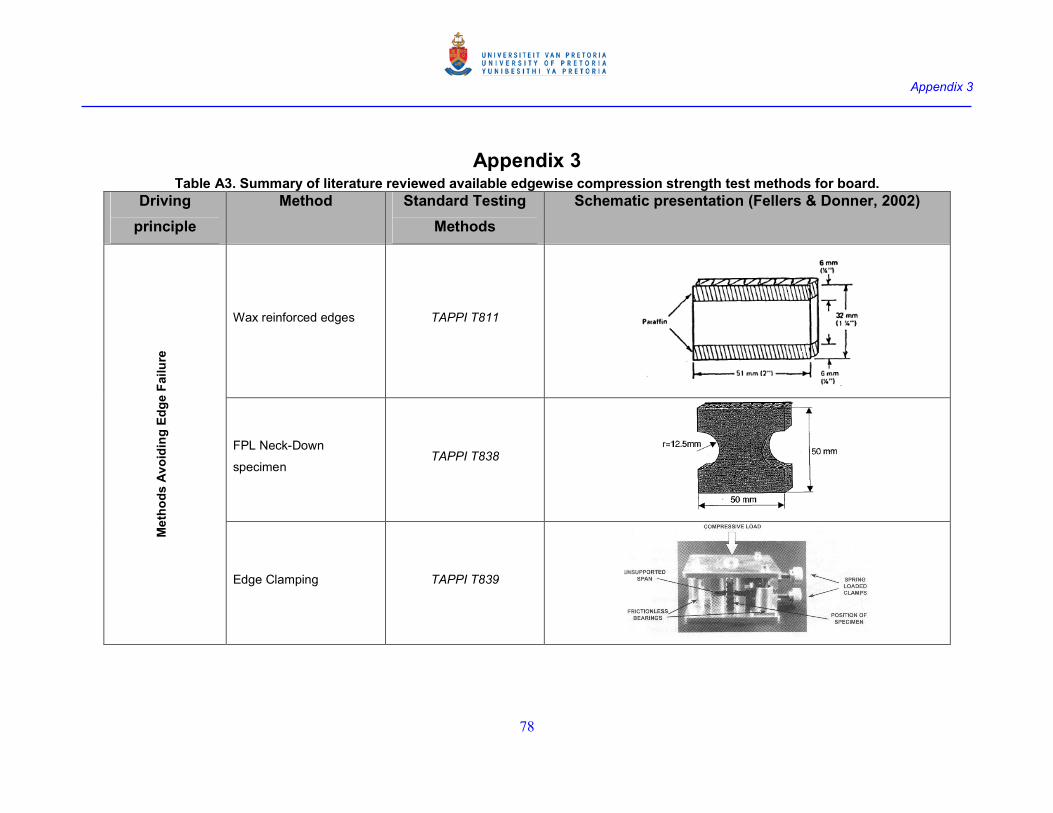
Appendix 3
78
Appendix 3 Table A3. Summary of literature reviewed available edgewise compression strength test methods for board.
Driving
principle
Method Standard Testing
Methods
Schematic presentation (Fellers & Donner, 2002)
Wax reinforced edges TAPPI T811
FPL Neck-Down
specimen TAPPI T838
Methods Avoiding Edge Failure
Edge Clamping TAPPI T839
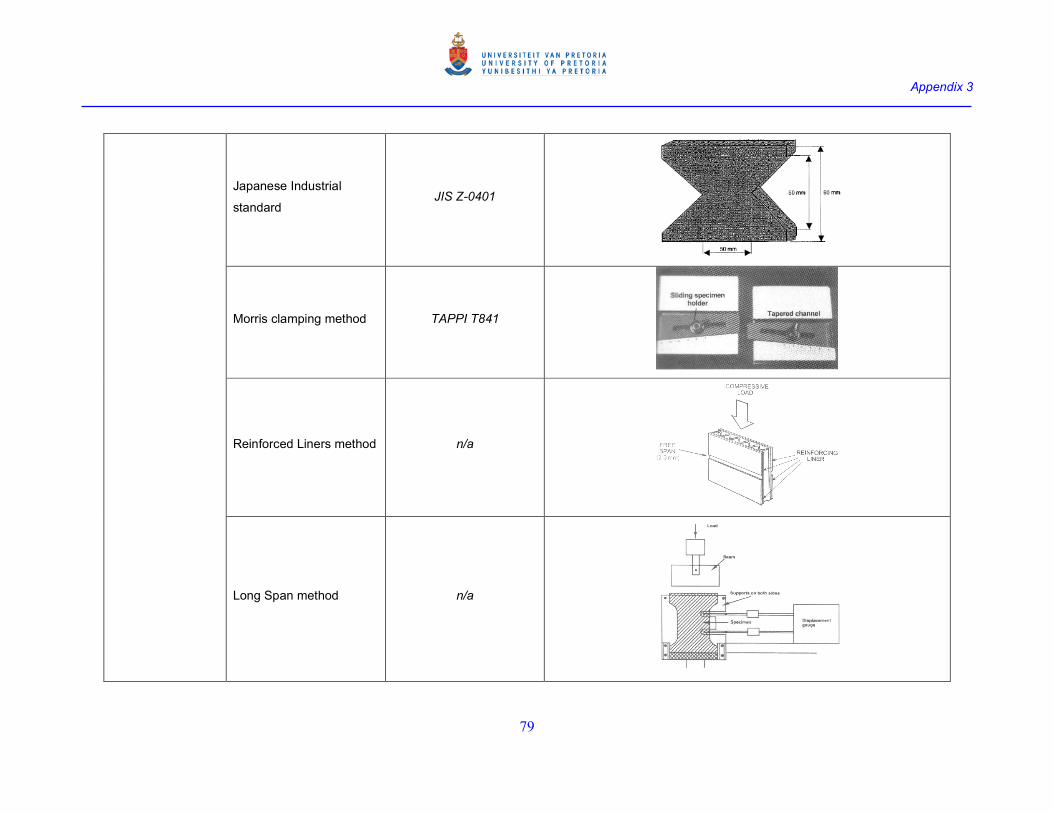
Appendix 3
79
Japanese Industrial
standard JIS Z-0401
Morris clamping method TAPPI T841
Reinforced Liners method n/a
Long Span method n/a
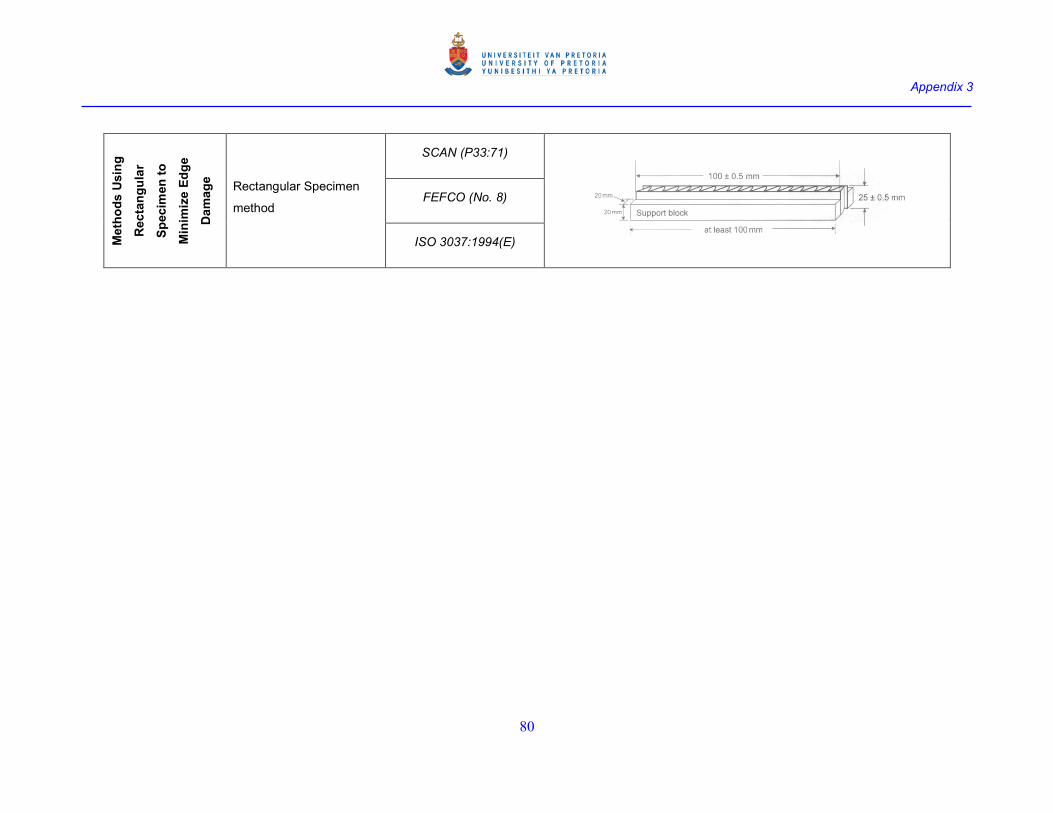
Appendix 3
80
SCAN (P33:71)
FEFCO (No. 8)
Methods Using
Rectangular
Specim
en to
Minim
ize Edge
Damage
Rectangular Specimen
method
ISO 3037:1994(E)
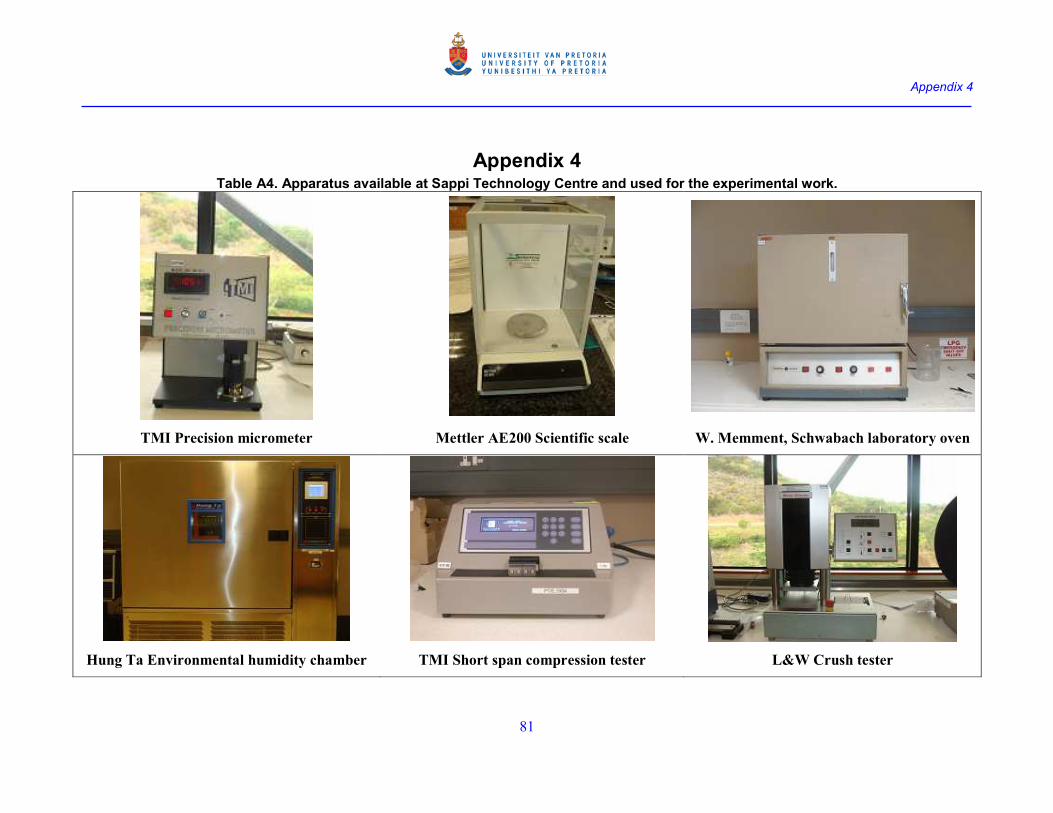
Appendix 4
81
Appendix 4 Table A4. Apparatus available at Sappi Technology Centre and used for the experimental work.
TMI Precision micrometer Mettler AE200 Scientific scale W. Memment, Schwabach laboratory oven
Hung Ta Environmental humidity chamber TMI Short span compression tester L&W Crush tester
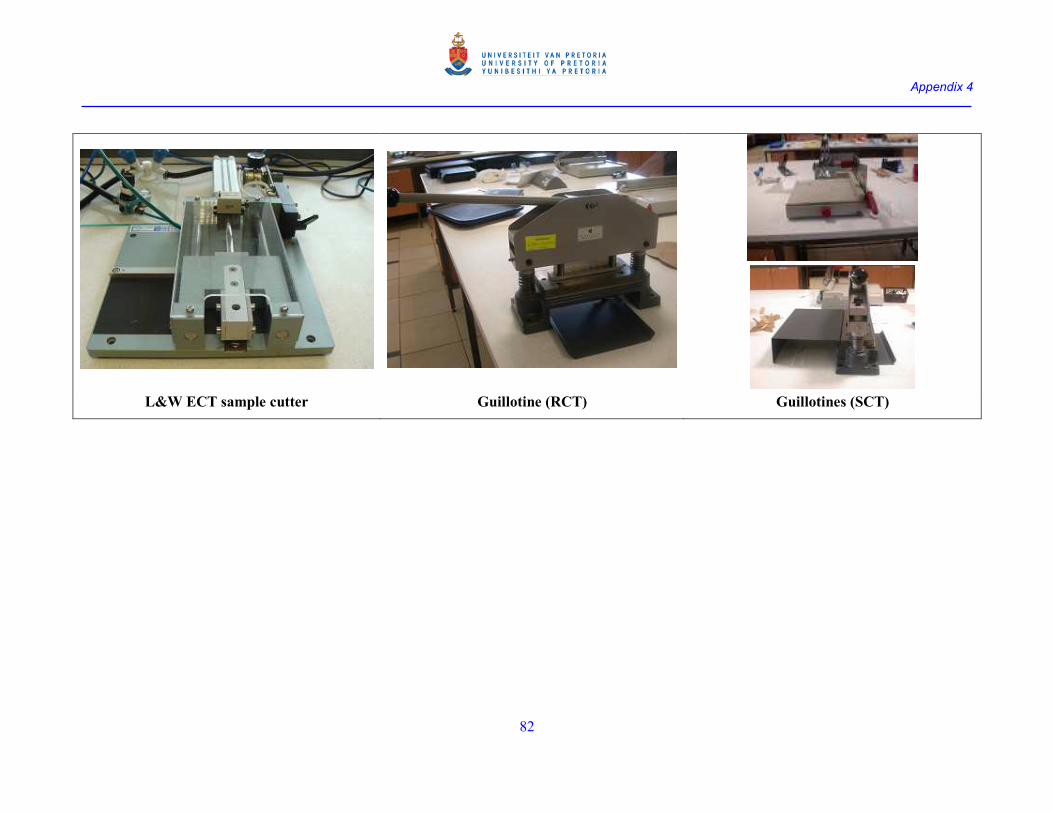
Appendix 4
82
L&W ECT sample cutter Guillotine (RCT) Guillotines (SCT)
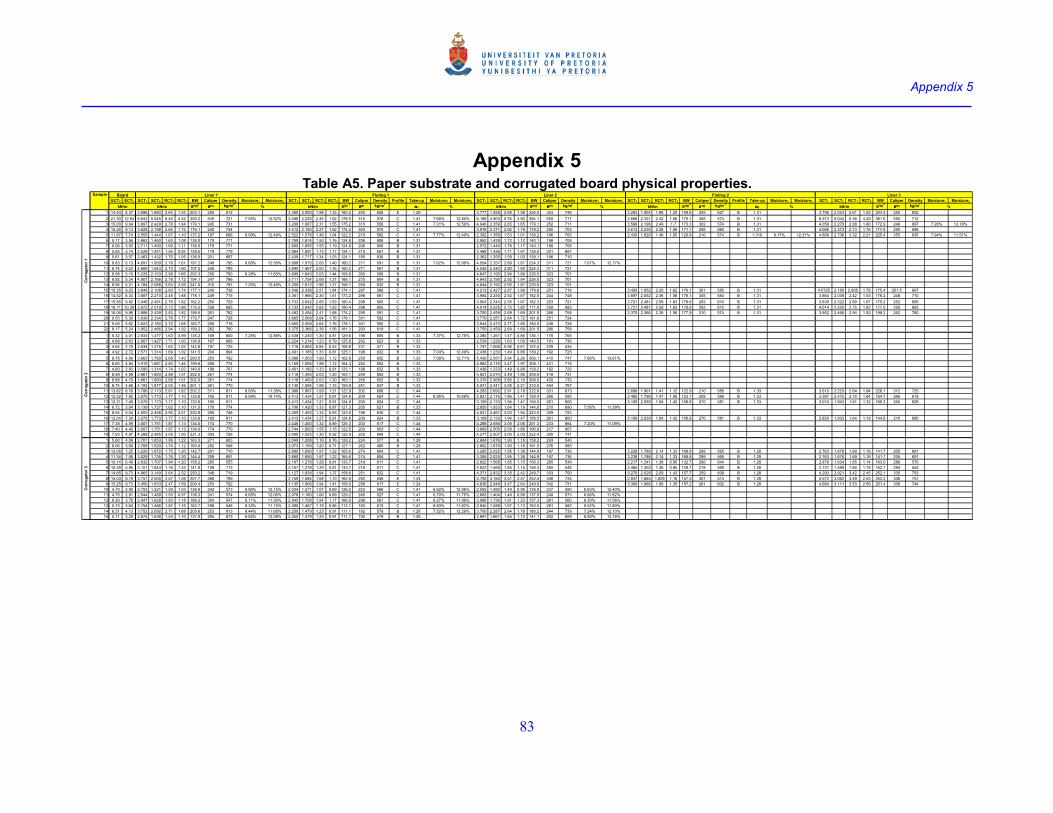
Appendix 5
83
Appendix 5 Table A5. Paper substrate and corrugated board physical properties.
ECT1 ECT2 SCT1 SCT2 RCT1 RCT2 BW Caliper Density Moisture1 Moisture2 SCT1 SCT2 RCT1 RCT2 BW Caliper Density Profile Take-up Moisture1 Moisture2 SCT1 SCT2 RCT1 RCT2 BW Caliper Density Moisture1 Moisture2 SCT1 SCT2 RCT1 RCT2 BW Caliper Density Profile Take-up Moisture1 Moisture2 SCT1 SCT2 RCT1 RCT2 BW Caliper Density Moisture1 Moisture2
g/m2
µµµµm kg/m3
g/m2
µµµµm kg/m3
αααα1 g/m2
µµµµm kg/m3
g/m2
µµµµm kg/m3
αααα2 g/m2
µµµµm kg/m3
1 14.40 8.37 3.696 1.880 2.64 1.54 203.1 250 812 3.360 2.000 1.98 1.33 160.2 255 628 E 1.29 3.777 1.929 2.69 1.58 226.0 303 746 3.263 1.904 1.98 1.25 159.8 255 627 B 1.31 3.796 2.024 2.61 1.52 204.5 255 802
2 21.30 12.94 8.642 5.045 6.40 4.32 393.2 545 721 7.55% 12.52% 3.496 2.225 2.45 1.62 178.5 310 576 C 1.41 7.68% 12.80% 8.189 4.903 5.76 3.90 394.1 550 717 3.666 2.331 2.42 1.66 175.1 305 574 B 1.31 8.373 5.042 6.36 4.29 391.5 550 712
3 15.00 9.04 3.897 2.429 2.78 1.84 179.1 245 731 3.200 1.987 2.31 1.55 175.2 315 556 C 1.41 7.31% 12.59% 4.040 2.359 2.65 1.65 179.1 252 711 3.568 2.196 2.49 1.7 173.3 302 574 B 1.31 4.059 2.270 2.88 1.80 172.9 248 697 7.26% 13.18%
4 15.28 9.13 3.828 2.198 2.64 1.72 176.1 240 734 3.412 2.190 2.27 1.62 174.2 303 575 C 1.41 3.978 2.371 2.92 1.79 179.2 255 703 3.613 2.238 2.38 1.59 171.1 295 580 B 1.31 4.086 2.373 2.73 1.76 177.9 255 698
5 11.87 7.74 2.555 1.444 1.67 1.10 137.2 197 696 8.09% 12.49% 2.522 1.578 1.48 1.04 122.2 210 582 C 1.41 7.77% 12.40% 2.392 1.358 1.53 1.01 138.2 196 705 2.430 1.620 1.46 1.05 120.6 210 574 B 1.310 8.17% 12.31% 4.699 2.736 3.32 2.21 225.4 355 635 7.94% 11.51%
6 5.17 3.56 2.662 1.460 1.63 1.08 138.0 179 771 2.769 1.674 1.50 1.16 124.8 206 606 B 1.31 2.562 1.439 1.72 1.12 140.1 198 708
7 6.06 3.93 2.711 1.490 1.69 1.11 138.0 179 771 2.800 1.695 1.55 1.19 124.8 206 606 B 1.31 2.572 1.449 1.78 1.17 140.1 198 708
8 5.65 3.74 2.528 1.421 1.54 0.92 139.5 179 779 2.984 1.891 1.73 1.17 124.1 210 591 B 1.31 2.468 1.436 1.71 1.07 138.0 201 687
9 5.61 3.57 2.463 1.432 1.70 1.05 138.0 201 687 2.439 1.717 1.34 1.03 124.1 195 636 B 1.31 2.362 1.355 1.59 1.03 139.1 196 710
10 8.83 5.13 4.691 1.959 2.78 1.61 197.2 248 795 6.69% 12.59% 3.898 1.975 2.05 1.40 160.2 271 591 B 1.31 7.62% 12.99% 4.554 2.257 2.89 1.87 224.3 311 721 7.67% 12.17%
11 8.74 5.23 4.685 1.943 2.73 1.60 197.2 248 795 3.890 1.967 2.00 1.35 160.2 271 591 B 1.31 4.545 2.240 2.80 1.80 224.3 311 721
12 8.98 5.10 5.226 2.153 2.98 1.66 202.3 256 790 6.28% 11.65% 3.699 1.643 2.03 1.44 158.8 265 599 B 1.31 4.647 2.195 2.94 1.89 226.5 323 701
13 8.92 5.34 4.807 2.166 2.78 1.72 194.1 247 786 3.711 1.754 2.06 1.37 166.1 275 604 B 1.31 4.643 2.190 2.92 1.84 226.5 323 701
14 8.96 5.21 4.784 2.588 3.63 2.09 247.0 310 797 7.25% 12.49% 3.200 1.812 1.96 1.27 158.1 250 632 B 1.31 4.644 2.192 2.93 1.87 226.5 323 701
15 15.35 9.23 3.846 2.108 2.60 1.74 177.1 240 738 3.546 2.338 2.51 1.84 174.1 297 586 C 1.41 4.213 2.427 2.87 1.88 179.6 251 716 3.450 1.952 2.29 1.62 176.1 301 585 B 1.31 4.0725 2.180 2.805 1.78 175.4 251.5 697
16 14.52 8.33 3.687 2.210 2.45 1.68 178.1 249 715 3.361 1.966 2.30 1.61 173.2 298 581 C 1.41 3.984 2.250 2.52 1.67 182.5 244 748 3.597 2.052 2.36 1.56 178.1 305 584 B 1.31 3.864 2.038 2.42 1.53 176.2 248 710
17 15.85 9.82 3.946 2.491 2.76 1.82 182.2 250 729 3.733 2.642 2.65 1.83 180.4 298 605 C 1.41 3.904 2.344 2.55 1.67 182.3 253 721 3.721 2.481 2.59 1.83 178.6 293 610 B 1.31 3.839 2.322 2.69 1.67 175.2 252 695
18 16.71 10.30 3.972 2.519 2.73 1.86 179.3 258 695 3.733 2.642 2.65 1.83 180.4 298 605 C 1.41 4.014 2.525 2.75 1.82 177.0 259 683 3.721 2.481 2.59 1.83 178.6 293 610 B 1.31 4.014 2.525 2.75 1.82 177.0 259 683
19 16.06 9.88 3.888 2.439 2.83 1.82 199.0 261 762 3.492 2.454 2.41 1.68 174.2 295 591 C 1.41 3.750 2.459 2.69 1.69 201.5 266 758 3.375 2.366 2.38 1.56 177.9 310 574 B 1.31 3.952 2.466 2.94 1.92 199.2 262 760
20 8.55 5.30 3.939 2.334 2.76 1.77 179.7 247 728 3.665 2.509 2.64 1.76 178.1 301 592 C 1.41 3.770 2.251 2.64 1.72 181.6 251 724
21 9.06 5.62 3.623 2.180 2.72 1.68 183.7 256 718 3.665 2.509 2.64 1.76 178.1 301 592 C 1.41 3.944 2.473 2.77 1.85 180.5 248 728
22 8.17 5.24 3.952 2.466 2.94 1.92 199.2 262 760 3.375 2.366 2.38 1.56 181.3 293 619 C 1.41 3.750 2.459 2.69 1.69 201.5 266 758
1 5.32 3.01 2.933 1.477 1.63 0.99 135.2 169 800 7.25% 12.88% 2.438 1.240 1.30 0.81 129.6 198 655 B 1.33 7.37% 12.75% 2.380 1.261 1.47 0.86 136.1 178 765
2 4.88 2.63 2.907 1.427 1.71 1.00 134.9 167 808 2.224 1.214 1.23 0.79 125.8 202 623 B 1.33 2.539 1.226 1.63 1.00 140.5 191 736
3 4.64 2.70 2.634 1.275 1.62 1.02 142.8 197 725 1.716 0.893 0.84 0.52 108.8 231 471 B 1.33 1.791 1.006 0.96 0.61 122.5 229 535
4 4.92 2.72 2.571 1.314 1.69 1.02 141.5 204 694 2.401 1.185 1.33 0.81 125.1 198 632 B 1.33 7.04% 12.49% 2.436 1.233 1.49 0.88 139.2 192 725
5 8.78 4.89 3.663 1.780 2.68 1.40 200.5 253 792 3.096 1.503 1.99 1.12 162.9 250 652 B 1.33 7.09% 12.71% 5.436 2.551 3.94 2.26 306.1 410 747 7.86% 13.61%
6 8.60 4.84 3.915 1.881 2.80 1.46 199.8 258 774 3.159 1.506 1.98 1.12 164.3 252 652 B 1.33 4.982 2.176 3.47 1.97 308.1 431 715
7 4.80 2.83 2.595 1.314 1.74 1.02 140.0 198 707 2.401 1.185 1.33 0.81 125.1 198 632 B 1.33 2.436 1.233 1.49 0.88 139.2 192 725
8 8.58 4.59 3.861 1.893 2.88 1.51 202.0 261 774 3.118 1.493 2.03 1.20 163.1 250 652 B 1.33 4.921 2.074 3.49 1.95 305.5 418 731
9 8.88 4.79 3.861 1.893 2.88 1.51 202.0 261 774 3.118 1.493 2.03 1.20 163.1 250 652 B 1.33 5.370 2.568 3.85 2.16 308.0 420 733
10 8.74 4.66 4.193 1.877 2.93 1.46 201.1 261 770 3.145 1.594 1.98 1.15 159.9 251 637 B 1.33 5.041 2.341 3.95 2.21 310.0 404 767
11 13.82 8.76 3.786 2.173 2.81 1.82 252.2 311 811 6.93% 11.28% 2.998 1.967 1.59 1.21 122.9 202 608 C 1.44 4.283 2.692 2.91 2.19 222.6 331 673 2.698 1.901 1.41 1.12 122.9 210 585 B 1.33 3.615 2.225 2.64 1.84 226.1 312 725
12 12.52 7.92 3.070 1.773 1.77 1.10 133.8 165 811 6.99% 10.14% 2.413 1.434 1.27 0.91 124.8 200 624 C 1.44 6.95% 10.69% 2.821 2.116 1.86 1.41 158.4 266 595 2.485 1.799 1.47 1.08 123.1 209 589 B 1.33 3.387 2.472 2.16 1.64 164.7 266 619
13 12.21 7.40 3.070 1.773 1.77 1.10 133.8 165 811 2.413 1.434 1.27 0.91 124.8 200 624 C 1.44 3.109 2.133 1.94 1.47 156.5 261 600 3.109 2.039 1.94 1.42 156.8 270 581 B 1.33 3.074 1.943 1.81 1.32 160.3 255 629
14 6.72 3.94 3.139 1.727 1.62 1.10 131.5 170 774 2.706 1.420 1.33 0.87 127.3 205 621 B 1.33 2.850 1.933 1.64 1.19 144.8 210 690 7.56% 11.39%
15 8.04 5.04 4.053 2.458 2.90 2.01 220.8 295 748 2.455 1.493 1.32 0.93 123.5 196 630 C 1.44 4.021 2.461 3.03 1.94 223.5 309 723
16 12.04 7.30 3.070 1.773 1.77 1.10 133.8 165 811 2.413 1.434 1.27 0.91 124.8 200 624 B 1.33 3.109 2.133 1.94 1.47 156.5 261 600 3.109 2.039 1.94 1.42 156.8 270 581 B 1.33 2.850 1.933 1.64 1.19 144.8 210 690
17 7.38 4.59 3.007 1.751 1.87 1.13 134.0 174 770 2.446 1.450 1.32 0.89 125.3 203 617 C 1.44 4.288 2.656 3.05 2.06 201.3 233 864 7.20% 11.09%
18 7.40 4.40 3.007 1.751 1.87 1.13 134.0 174 770 2.744 1.893 1.55 1.15 122.5 203 603 C 1.44 3.969 2.505 2.58 1.89 196.8 217 907
19 7.93 4.87 4.288 2.485 3.05 1.93 221.3 305 726 2.460 1.525 1.30 0.92 122.9 202 608 C 1.44 4.277 2.507 3.00 2.03 222.4 300 741
1 5.60 4.06 2.701 1.653 1.86 1.22 163.3 271 603 2.049 1.208 1.16 0.76 129.2 224 577 B 1.28 2.684 1.676 1.90 1.18 158.2 293 540
2 6.06 3.60 2.768 1.520 1.74 1.12 160.0 292 548 2.073 1.158 1.20 0.71 127.1 262 485 B 1.28 2.862 1.679 1.90 1.18 161.5 276 585
3 12.06 7.25 3.220 1.872 1.75 1.20 142.7 201 710 2.890 1.690 1.97 1.22 165.6 274 604 C 1.41 3.265 2.025 1.95 1.38 144.9 197 736 3.228 1.788 2.14 1.33 168.8 299 565 B 1.28 2.763 1.676 1.69 1.16 141.7 205 691
4 11.34 7.06 3.029 1.735 1.76 1.20 144.4 209 691 2.890 1.690 1.97 1.22 165.6 274 604 C 1.41 3.265 2.025 1.95 1.38 144.9 197 736 3.228 1.788 2.14 1.33 168.8 299 565 B 1.28 2.763 1.676 1.69 1.16 141.7 205 691
5 10.14 6.49 2.832 1.707 1.94 1.20 158.2 285 555 2.167 1.278 1.29 0.81 133.7 219 611 C 1.41 2.822 1.568 1.85 1.15 156.3 285 548 2.217 1.341 1.38 0.85 132.7 206 644 B 1.28 2.878 1.634 1.85 1.14 163.0 286 570
6 10.39 5.95 3.151 1.843 1.76 1.33 141.9 199 713 2.167 1.278 1.29 0.81 133.7 219 611 C 1.41 2.822 1.568 1.85 1.15 156.3 285 548 2.465 1.303 1.36 0.85 128.7 218 590 B 1.28 2.731 1.589 1.84 1.19 162.7 294 553
7 14.85 9.73 4.965 3.149 3.64 2.52 250.2 348 719 3.127 1.938 1.94 1.37 158.6 251 632 C 1.41 4.371 2.832 3.35 2.42 249.7 333 750 3.270 2.028 2.09 1.43 157.7 259 609 B 1.28 4.293 2.921 3.42 2.45 252.1 335 753
8 15.03 9.79 3.757 2.000 2.57 1.59 207.7 260 799 2.759 1.584 1.68 1.10 162.9 292 558 E 1.24 4.793 3.160 3.51 2.57 252.4 348 725 2.937 1.685 1.829 1.16 157.5 307 513 B 1.28 4.572 3.062 3.49 2.53 252.2 336 751
9 15.25 9.73 3.450 1.833 2.47 1.59 200.4 253 792 3.135 1.906 1.94 1.41 158.0 256 617 E 1.24 4.836 2.949 3.47 2.64 249.9 342 731 3.300 1.966 1.98 1.35 157.2 261 602 B 1.28 4.684 3.111 3.53 2.56 251.4 338 744
10 4.70 2.90 2.702 1.521 1.50 1.03 138.6 242 573 6.86% 12.15% 2.034 1.271 1.07 0.69 126.2 223 566 C 1.41 6.62% 12.06% 2.592 1.480 1.49 0.96 139.9 237 590 6.83% 12.40%
11 4.75 2.91 2.544 1.489 1.53 0.97 138.3 241 574 6.65% 12.06% 2.078 1.180 1.06 0.69 129.2 245 527 C 1.41 6.70% 11.75% 2.683 1.404 1.48 0.99 137.5 240 573 6.66% 11.82%
12 6.20 3.78 2.947 1.628 1.83 1.18 166.2 304 547 6.11% 11.59% 2.945 1.708 1.94 1.17 166.0 296 561 C 1.41 6.27% 11.99% 3.066 1.736 1.91 1.23 157.3 281 560 6.30% 11.56%
13 5.73 3.64 2.754 1.486 1.87 1.16 162.7 298 546 6.33% 11.73% 2.390 1.467 1.19 0.86 112.1 183 613 C 1.41 6.83% 11.82% 2.945 1.589 1.97 1.13 163.5 281 582 6.52% 11.80%
14 6.31 4.13 3.752 2.092 2.71 1.68 205.6 253 813 6.44% 11.68% 2.250 1.479 1.23 0.91 111.1 192 579 B 1.28 7.52% 12.29% 3.700 2.287 2.64 1.78 180.2 244 739 7.24% 12.10%
15 5.11 3.20 2.674 1.636 1.53 1.10 137.9 205 673 6.82% 12.08% 2.250 1.479 1.23 0.91 111.1 192 579 B 1.28 2.667 1.661 1.65 1.12 141.1 202 699 6.80% 12.16%
Liner 3
%kN/m kN/m
Fluting 1 Liner 2 Fluting 2Liner 1Board
kN/m
Corrugator 1
Sample
% %
Corrugator 2
Corrugator 3
kN/m kN/m kN/m% %
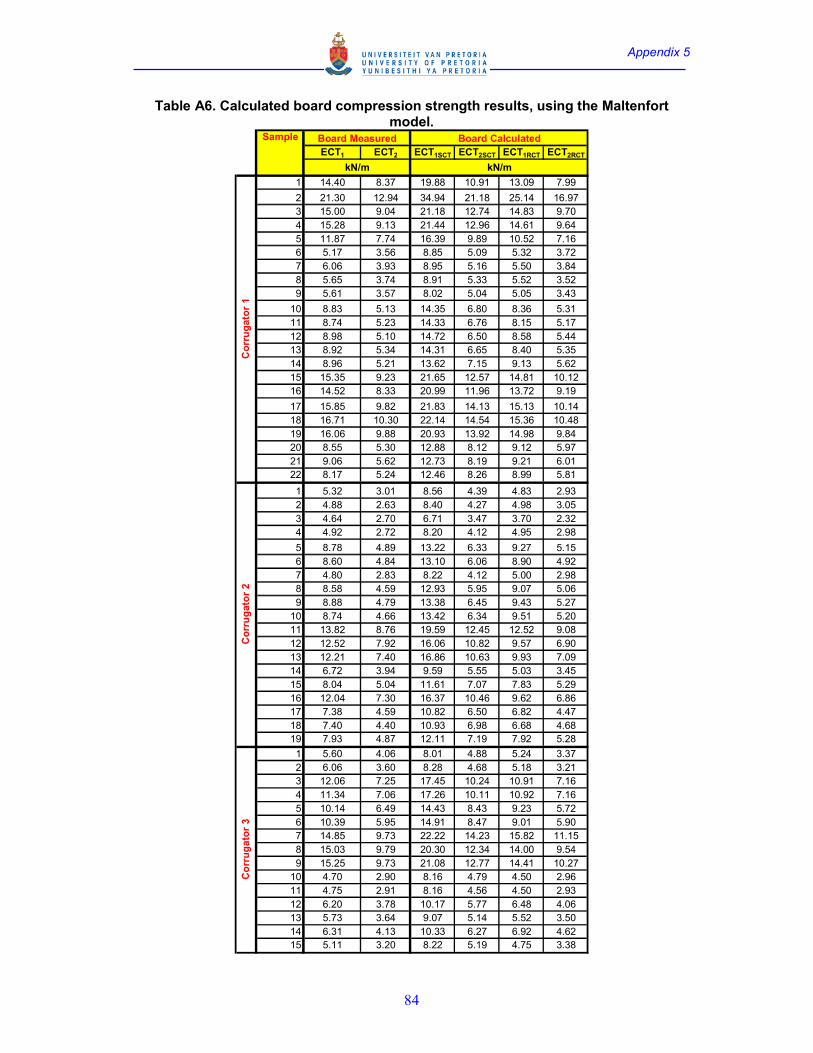
Appendix 5
84
Table A6. Calculated board compression strength results, using the Maltenfort model.
ECT1 ECT2 ECT1SCT ECT2SCT ECT1RCT ECT2RCT
1 14.40 8.37 19.88 10.91 13.09 7.99
2 21.30 12.94 34.94 21.18 25.14 16.97
3 15.00 9.04 21.18 12.74 14.83 9.70
4 15.28 9.13 21.44 12.96 14.61 9.64
5 11.87 7.74 16.39 9.89 10.52 7.16
6 5.17 3.56 8.85 5.09 5.32 3.72
7 6.06 3.93 8.95 5.16 5.50 3.84
8 5.65 3.74 8.91 5.33 5.52 3.52
9 5.61 3.57 8.02 5.04 5.05 3.43
10 8.83 5.13 14.35 6.80 8.36 5.31
11 8.74 5.23 14.33 6.76 8.15 5.17
12 8.98 5.10 14.72 6.50 8.58 5.44
13 8.92 5.34 14.31 6.65 8.40 5.35
14 8.96 5.21 13.62 7.15 9.13 5.62
15 15.35 9.23 21.65 12.57 14.81 10.12
16 14.52 8.33 20.99 11.96 13.72 9.19
17 15.85 9.82 21.83 14.13 15.13 10.14
18 16.71 10.30 22.14 14.54 15.36 10.48
19 16.06 9.88 20.93 13.92 14.98 9.84
20 8.55 5.30 12.88 8.12 9.12 5.97
21 9.06 5.62 12.73 8.19 9.21 6.01
22 8.17 5.24 12.46 8.26 8.99 5.81
1 5.32 3.01 8.56 4.39 4.83 2.93
2 4.88 2.63 8.40 4.27 4.98 3.05
3 4.64 2.70 6.71 3.47 3.70 2.32
4 4.92 2.72 8.20 4.12 4.95 2.98
5 8.78 4.89 13.22 6.33 9.27 5.15
6 8.60 4.84 13.10 6.06 8.90 4.92
7 4.80 2.83 8.22 4.12 5.00 2.98
8 8.58 4.59 12.93 5.95 9.07 5.06
9 8.88 4.79 13.38 6.45 9.43 5.27
10 8.74 4.66 13.42 6.34 9.51 5.20
11 13.82 8.76 19.59 12.45 12.52 9.08
12 12.52 7.92 16.06 10.82 9.57 6.90
13 12.21 7.40 16.86 10.63 9.93 7.09
14 6.72 3.94 9.59 5.55 5.03 3.45
15 8.04 5.04 11.61 7.07 7.83 5.29
16 12.04 7.30 16.37 10.46 9.62 6.86
17 7.38 4.59 10.82 6.50 6.82 4.47
18 7.40 4.40 10.93 6.98 6.68 4.68
19 7.93 4.87 12.11 7.19 7.92 5.28
1 5.60 4.06 8.01 4.88 5.24 3.37
2 6.06 3.60 8.28 4.68 5.18 3.21
3 12.06 7.25 17.45 10.24 10.91 7.16
4 11.34 7.06 17.26 10.11 10.92 7.16
5 10.14 6.49 14.43 8.43 9.23 5.72
6 10.39 5.95 14.91 8.47 9.01 5.90
7 14.85 9.73 22.22 14.23 15.82 11.15
8 15.03 9.79 20.30 12.34 14.00 9.54
9 15.25 9.73 21.08 12.77 14.41 10.27
10 4.70 2.90 8.16 4.79 4.50 2.96
11 4.75 2.91 8.16 4.56 4.50 2.93
12 6.20 3.78 10.17 5.77 6.48 4.06
13 5.73 3.64 9.07 5.14 5.52 3.50
14 6.31 4.13 10.33 6.27 6.92 4.62
15 5.11 3.20 8.22 5.19 4.75 3.38
kN/m
Board CalculatedSample
Corrugator 2
Corrugator 3
Board Measured
kN/m
Corrugator 1
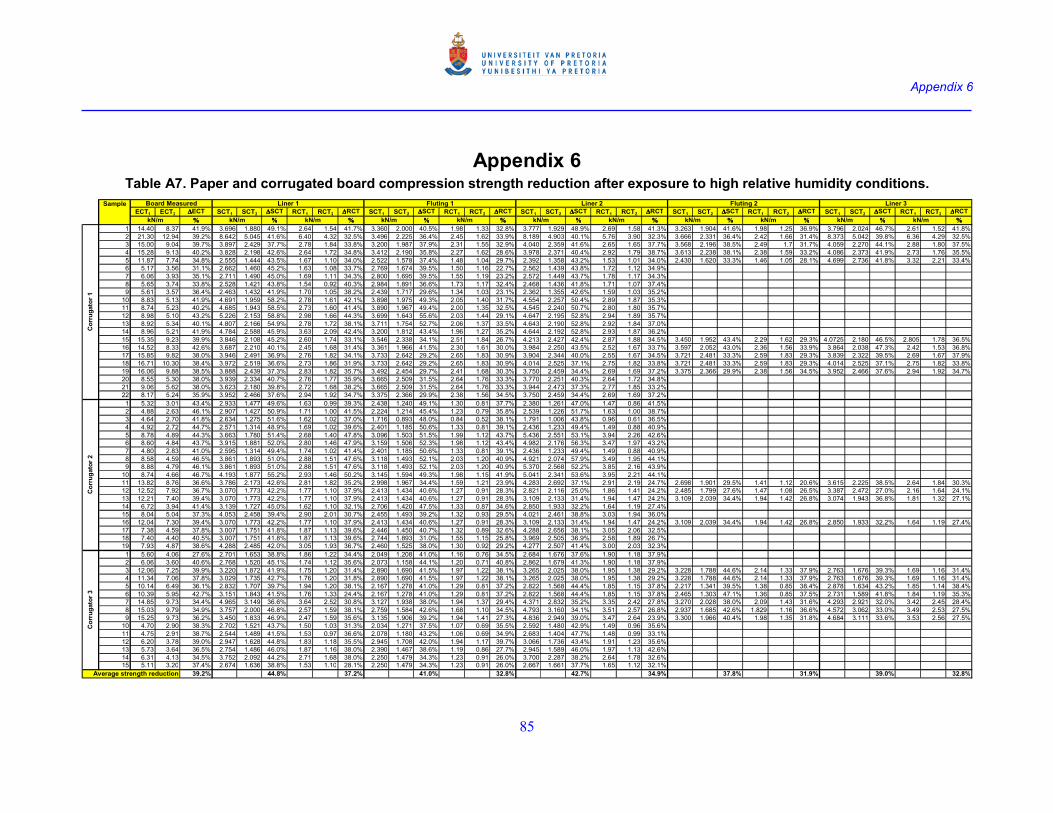
Appendix 6
85
Appendix 6 Table A7. Paper and corrugated board compression strength reduction after exposure to high relative humidity conditions.
ECT1 ECT2 ∆∆∆∆ECT SCT1 SCT2 ∆∆∆∆SCT RCT1 RCT2 ∆∆∆∆RCT SCT1 SCT2 ∆∆∆∆SCT RCT1 RCT2 ∆∆∆∆RCT SCT1 SCT2 ∆∆∆∆SCT RCT1 RCT2 ∆∆∆∆RCT SCT1 SCT2 ∆∆∆∆SCT RCT1 RCT2 ∆∆∆∆RCT SCT1 SCT2 ∆∆∆∆SCT RCT1 RCT2 ∆∆∆∆RCT
%%%% %%%% %%%% %%%% %%%% %%%% %%%% %%%% %%%% %%%% %%%%
1 14.40 8.37 41.9% 3.696 1.880 49.1% 2.64 1.54 41.7% 3.360 2.000 40.5% 1.98 1.33 32.8% 3.777 1.929 48.9% 2.69 1.58 41.3% 3.263 1.904 41.6% 1.98 1.25 36.9% 3.796 2.024 46.7% 2.61 1.52 41.8%
2 21.30 12.94 39.2% 8.642 5.045 41.6% 6.40 4.32 32.5% 3.496 2.225 36.4% 2.45 1.62 33.9% 8.189 4.903 40.1% 5.76 3.90 32.3% 3.666 2.331 36.4% 2.42 1.66 31.4% 8.373 5.042 39.8% 6.36 4.29 32.5%
3 15.00 9.04 39.7% 3.897 2.429 37.7% 2.78 1.84 33.8% 3.200 1.987 37.9% 2.31 1.55 32.9% 4.040 2.359 41.6% 2.65 1.65 37.7% 3.568 2.196 38.5% 2.49 1.7 31.7% 4.059 2.270 44.1% 2.88 1.80 37.5%
4 15.28 9.13 40.2% 3.828 2.198 42.6% 2.64 1.72 34.8% 3.412 2.190 35.8% 2.27 1.62 28.6% 3.978 2.371 40.4% 2.92 1.79 38.7% 3.613 2.238 38.1% 2.38 1.59 33.2% 4.086 2.373 41.9% 2.73 1.76 35.5%
5 11.87 7.74 34.8% 2.555 1.444 43.5% 1.67 1.10 34.0% 2.522 1.578 37.4% 1.48 1.04 29.7% 2.392 1.358 43.2% 1.53 1.01 34.0% 2.430 1.620 33.3% 1.46 1.05 28.1% 4.699 2.736 41.8% 3.32 2.21 33.4%
6 5.17 3.56 31.1% 2.662 1.460 45.2% 1.63 1.08 33.7% 2.769 1.674 39.5% 1.50 1.16 22.7% 2.562 1.439 43.8% 1.72 1.12 34.9%
7 6.06 3.93 35.1% 2.711 1.490 45.0% 1.69 1.11 34.3% 2.800 1.695 39.5% 1.55 1.19 23.2% 2.572 1.449 43.7% 1.78 1.17 34.3%
8 5.65 3.74 33.8% 2.528 1.421 43.8% 1.54 0.92 40.3% 2.984 1.891 36.6% 1.73 1.17 32.4% 2.468 1.436 41.8% 1.71 1.07 37.4%
9 5.61 3.57 36.4% 2.463 1.432 41.9% 1.70 1.05 38.2% 2.439 1.717 29.6% 1.34 1.03 23.1% 2.362 1.355 42.6% 1.59 1.03 35.2%
10 8.83 5.13 41.9% 4.691 1.959 58.2% 2.78 1.61 42.1% 3.898 1.975 49.3% 2.05 1.40 31.7% 4.554 2.257 50.4% 2.89 1.87 35.3%
11 8.74 5.23 40.2% 4.685 1.943 58.5% 2.73 1.60 41.4% 3.890 1.967 49.4% 2.00 1.35 32.5% 4.545 2.240 50.7% 2.80 1.80 35.7%
12 8.98 5.10 43.2% 5.226 2.153 58.8% 2.98 1.66 44.3% 3.699 1.643 55.6% 2.03 1.44 29.1% 4.647 2.195 52.8% 2.94 1.89 35.7%
13 8.92 5.34 40.1% 4.807 2.166 54.9% 2.78 1.72 38.1% 3.711 1.754 52.7% 2.06 1.37 33.5% 4.643 2.190 52.8% 2.92 1.84 37.0%
14 8.96 5.21 41.9% 4.784 2.588 45.9% 3.63 2.09 42.4% 3.200 1.812 43.4% 1.96 1.27 35.2% 4.644 2.192 52.8% 2.93 1.87 36.2%
15 15.35 9.23 39.9% 3.846 2.108 45.2% 2.60 1.74 33.1% 3.546 2.338 34.1% 2.51 1.84 26.7% 4.213 2.427 42.4% 2.87 1.88 34.5% 3.450 1.952 43.4% 2.29 1.62 29.3% 4.0725 2.180 46.5% 2.805 1.78 36.5%
16 14.52 8.33 42.6% 3.687 2.210 40.1% 2.45 1.68 31.4% 3.361 1.966 41.5% 2.30 1.61 30.0% 3.984 2.250 43.5% 2.52 1.67 33.7% 3.597 2.052 43.0% 2.36 1.56 33.9% 3.864 2.038 47.3% 2.42 1.53 36.8%
17 15.85 9.82 38.0% 3.946 2.491 36.9% 2.76 1.82 34.1% 3.733 2.642 29.2% 2.65 1.83 30.9% 3.904 2.344 40.0% 2.55 1.67 34.5% 3.721 2.481 33.3% 2.59 1.83 29.3% 3.839 2.322 39.5% 2.69 1.67 37.9%
18 16.71 10.30 38.4% 3.972 2.519 36.6% 2.73 1.86 31.9% 3.733 2.642 29.2% 2.65 1.83 30.9% 4.014 2.525 37.1% 2.75 1.82 33.8% 3.721 2.481 33.3% 2.59 1.83 29.3% 4.014 2.525 37.1% 2.75 1.82 33.8%
19 16.06 9.88 38.5% 3.888 2.439 37.3% 2.83 1.82 35.7% 3.492 2.454 29.7% 2.41 1.68 30.3% 3.750 2.459 34.4% 2.69 1.69 37.2% 3.375 2.366 29.9% 2.38 1.56 34.5% 3.952 2.466 37.6% 2.94 1.92 34.7%
20 8.55 5.30 38.0% 3.939 2.334 40.7% 2.76 1.77 35.9% 3.665 2.509 31.5% 2.64 1.76 33.3% 3.770 2.251 40.3% 2.64 1.72 34.8%
21 9.06 5.62 38.0% 3.623 2.180 39.8% 2.72 1.68 38.2% 3.665 2.509 31.5% 2.64 1.76 33.3% 3.944 2.473 37.3% 2.77 1.85 33.2%
22 8.17 5.24 35.9% 3.952 2.466 37.6% 2.94 1.92 34.7% 3.375 2.366 29.9% 2.38 1.56 34.5% 3.750 2.459 34.4% 2.69 1.69 37.2%
1 5.32 3.01 43.4% 2.933 1.477 49.6% 1.63 0.99 39.3% 2.438 1.240 49.1% 1.30 0.81 37.7% 2.380 1.261 47.0% 1.47 0.86 41.5%
2 4.88 2.63 46.1% 2.907 1.427 50.9% 1.71 1.00 41.5% 2.224 1.214 45.4% 1.23 0.79 35.8% 2.539 1.226 51.7% 1.63 1.00 38.7%
3 4.64 2.70 41.8% 2.634 1.275 51.6% 1.62 1.02 37.0% 1.716 0.893 48.0% 0.84 0.52 38.1% 1.791 1.006 43.8% 0.96 0.61 36.5%
4 4.92 2.72 44.7% 2.571 1.314 48.9% 1.69 1.02 39.6% 2.401 1.185 50.6% 1.33 0.81 39.1% 2.436 1.233 49.4% 1.49 0.88 40.9%
5 8.78 4.89 44.3% 3.663 1.780 51.4% 2.68 1.40 47.8% 3.096 1.503 51.5% 1.99 1.12 43.7% 5.436 2.551 53.1% 3.94 2.26 42.6%
6 8.60 4.84 43.7% 3.915 1.881 52.0% 2.80 1.46 47.9% 3.159 1.506 52.3% 1.98 1.12 43.4% 4.982 2.176 56.3% 3.47 1.97 43.2%
7 4.80 2.83 41.0% 2.595 1.314 49.4% 1.74 1.02 41.4% 2.401 1.185 50.6% 1.33 0.81 39.1% 2.436 1.233 49.4% 1.49 0.88 40.9%
8 8.58 4.59 46.5% 3.861 1.893 51.0% 2.88 1.51 47.6% 3.118 1.493 52.1% 2.03 1.20 40.9% 4.921 2.074 57.9% 3.49 1.95 44.1%
9 8.88 4.79 46.1% 3.861 1.893 51.0% 2.88 1.51 47.6% 3.118 1.493 52.1% 2.03 1.20 40.9% 5.370 2.568 52.2% 3.85 2.16 43.9%
10 8.74 4.66 46.7% 4.193 1.877 55.2% 2.93 1.46 50.2% 3.145 1.594 49.3% 1.98 1.15 41.9% 5.041 2.341 53.6% 3.95 2.21 44.1%
11 13.82 8.76 36.6% 3.786 2.173 42.6% 2.81 1.82 35.2% 2.998 1.967 34.4% 1.59 1.21 23.9% 4.283 2.692 37.1% 2.91 2.19 24.7% 2.698 1.901 29.5% 1.41 1.12 20.6% 3.615 2.225 38.5% 2.64 1.84 30.3%
12 12.52 7.92 36.7% 3.070 1.773 42.2% 1.77 1.10 37.9% 2.413 1.434 40.6% 1.27 0.91 28.3% 2.821 2.116 25.0% 1.86 1.41 24.2% 2.485 1.799 27.6% 1.47 1.08 26.5% 3.387 2.472 27.0% 2.16 1.64 24.1%
13 12.21 7.40 39.4% 3.070 1.773 42.2% 1.77 1.10 37.9% 2.413 1.434 40.6% 1.27 0.91 28.3% 3.109 2.133 31.4% 1.94 1.47 24.2% 3.109 2.039 34.4% 1.94 1.42 26.8% 3.074 1.943 36.8% 1.81 1.32 27.1%
14 6.72 3.94 41.4% 3.139 1.727 45.0% 1.62 1.10 32.1% 2.706 1.420 47.5% 1.33 0.87 34.6% 2.850 1.933 32.2% 1.64 1.19 27.4%
15 8.04 5.04 37.3% 4.053 2.458 39.4% 2.90 2.01 30.7% 2.455 1.493 39.2% 1.32 0.93 29.5% 4.021 2.461 38.8% 3.03 1.94 36.0%
16 12.04 7.30 39.4% 3.070 1.773 42.2% 1.77 1.10 37.9% 2.413 1.434 40.6% 1.27 0.91 28.3% 3.109 2.133 31.4% 1.94 1.47 24.2% 3.109 2.039 34.4% 1.94 1.42 26.8% 2.850 1.933 32.2% 1.64 1.19 27.4%
17 7.38 4.59 37.8% 3.007 1.751 41.8% 1.87 1.13 39.6% 2.446 1.450 40.7% 1.32 0.89 32.6% 4.288 2.656 38.1% 3.05 2.06 32.5%
18 7.40 4.40 40.5% 3.007 1.751 41.8% 1.87 1.13 39.6% 2.744 1.893 31.0% 1.55 1.15 25.8% 3.969 2.505 36.9% 2.58 1.89 26.7%
19 7.93 4.87 38.6% 4.288 2.485 42.0% 3.05 1.93 36.7% 2.460 1.525 38.0% 1.30 0.92 29.2% 4.277 2.507 41.4% 3.00 2.03 32.3%
1 5.60 4.06 27.6% 2.701 1.653 38.8% 1.86 1.22 34.4% 2.049 1.208 41.0% 1.16 0.76 34.5% 2.684 1.676 37.6% 1.90 1.18 37.9%
2 6.06 3.60 40.6% 2.768 1.520 45.1% 1.74 1.12 35.6% 2.073 1.158 44.1% 1.20 0.71 40.8% 2.862 1.679 41.3% 1.90 1.18 37.9%
3 12.06 7.25 39.9% 3.220 1.872 41.9% 1.75 1.20 31.4% 2.890 1.690 41.5% 1.97 1.22 38.1% 3.265 2.025 38.0% 1.95 1.38 29.2% 3.228 1.788 44.6% 2.14 1.33 37.9% 2.763 1.676 39.3% 1.69 1.16 31.4%
4 11.34 7.06 37.8% 3.029 1.735 42.7% 1.76 1.20 31.8% 2.890 1.690 41.5% 1.97 1.22 38.1% 3.265 2.025 38.0% 1.95 1.38 29.2% 3.228 1.788 44.6% 2.14 1.33 37.9% 2.763 1.676 39.3% 1.69 1.16 31.4%
5 10.14 6.49 36.1% 2.832 1.707 39.7% 1.94 1.20 38.1% 2.167 1.278 41.0% 1.29 0.81 37.2% 2.822 1.568 44.4% 1.85 1.15 37.8% 2.217 1.341 39.5% 1.38 0.85 38.4% 2.878 1.634 43.2% 1.85 1.14 38.4%
6 10.39 5.95 42.7% 3.151 1.843 41.5% 1.76 1.33 24.4% 2.167 1.278 41.0% 1.29 0.81 37.2% 2.822 1.568 44.4% 1.85 1.15 37.8% 2.465 1.303 47.1% 1.36 0.85 37.5% 2.731 1.589 41.8% 1.84 1.19 35.3%
7 14.85 9.73 34.4% 4.965 3.149 36.6% 3.64 2.52 30.8% 3.127 1.938 38.0% 1.94 1.37 29.4% 4.371 2.832 35.2% 3.35 2.42 27.8% 3.270 2.028 38.0% 2.09 1.43 31.6% 4.293 2.921 32.0% 3.42 2.45 28.4%
8 15.03 9.79 34.9% 3.757 2.000 46.8% 2.57 1.59 38.1% 2.759 1.584 42.6% 1.68 1.10 34.5% 4.793 3.160 34.1% 3.51 2.57 26.8% 2.937 1.685 42.6% 1.829 1.16 36.6% 4.572 3.062 33.0% 3.49 2.53 27.5%
9 15.25 9.73 36.2% 3.450 1.833 46.9% 2.47 1.59 35.6% 3.135 1.906 39.2% 1.94 1.41 27.3% 4.836 2.949 39.0% 3.47 2.64 23.9% 3.300 1.966 40.4% 1.98 1.35 31.8% 4.684 3.111 33.6% 3.53 2.56 27.5%
10 4.70 2.90 38.3% 2.702 1.521 43.7% 1.50 1.03 31.3% 2.034 1.271 37.5% 1.07 0.69 35.5% 2.592 1.480 42.9% 1.49 0.96 35.6%
11 4.75 2.91 38.7% 2.544 1.489 41.5% 1.53 0.97 36.6% 2.078 1.180 43.2% 1.06 0.69 34.9% 2.683 1.404 47.7% 1.48 0.99 33.1%
12 6.20 3.78 39.0% 2.947 1.628 44.8% 1.83 1.18 35.5% 2.945 1.708 42.0% 1.94 1.17 39.7% 3.066 1.736 43.4% 1.91 1.23 35.6%
13 5.73 3.64 36.5% 2.754 1.486 46.0% 1.87 1.16 38.0% 2.390 1.467 38.6% 1.19 0.86 27.7% 2.945 1.589 46.0% 1.97 1.13 42.6%
14 6.31 4.13 34.5% 3.752 2.092 44.2% 2.71 1.68 38.0% 2.250 1.479 34.3% 1.23 0.91 26.0% 3.700 2.287 38.2% 2.64 1.78 32.6%
15 5.11 3.20 37.4% 2.674 1.636 38.8% 1.53 1.10 28.1% 2.250 1.479 34.3% 1.23 0.91 26.0% 2.667 1.661 37.7% 1.65 1.12 32.1%
39.2% 44.8% 37.2% 41.0% 32.8% 42.7% 34.9% 37.8% 31.9% 39.0% 32.8%
Liner 3Sample Fluting 1 Liner 2 Fluting 2Liner 1
kN/m
Corrugator 3
Corrugator 2
Board Measured
kN/m
Corrugator 1
kN/m kN/m
Average strength reduction
kN/m kN/m kN/m kN/mkN/m kN/m kN/m