Embed Size (px)
Citation preview

T3G2
RELATIONSHIP BETWEEN PERCEIVED
BENEFITS AND UNDERGRADUATES’
ONLINE SHOPPING DECISIONS
IN MALAYSIA
BY
IVONNE CHAN YI WEN
LEE HOOI LING
LEONG HUI YING
TAN SIOK HIANG
TEOH SOOK KUAN
A research project submitted in partial fulfillment of the
requirement for the degree of
BACHELOR OF COMMERCE (HONS)
ACCOUNTING
UNIVERSITI TUNKU ABDUL RAHMAN
FACULTY OF BUSINESS AND FINANCE
DEPARTMENT OF COMMERCE
AND ACCOUNTANCY
MAY 2012

Perceived Benefits and Online Shopping Decisions
ii
Copyright @ 2012
ALL RIGHTS RESERVED. No part of this paper may be reproduced, stored in a
retrieval system, or transmitted in any form or by any means, graphic, electronic,
mechanical, photocopying, recording, scanning, or otherwise, without the prior
consent of the authors.

Perceived Benefits and Online Shopping Decisions
iii
DECLARATION
We hereby declare that:
(1) This undergraduate research project is the end result of our own work and
that due acknowledgement has been given in the references to ALL
sources of information be they printed, electronic, or personal.
(2) No portion of this research project has been submitted in support of any
application for any other degree or qualification of this or any other
university, or other institutes of learning.
(3) Equal contribution has been made by each group member in completing
the research project.
(4) The word count of this research report is 10495 words .
Name of Student: Student ID: Signature:
1. Ivonne Chan Yi Wen 09ABB07105 _________________
2. Lee Hooi Ling 09ABB06533 _________________
3. Leong Hui Ying 09ABB07718 _________________
4. Tan Siok Hiang 09ABB05647 _________________
5. Teoh Sook Kuan 09ABB06558 _________________
Date: 23 MARCH 2012

Perceived Benefits and Online Shopping Decisions
iv
ACKNOWLEDGEMENT
We sincerely appreciate that given this chance to express our greatest gratitude to
all people who have made this research project possible. We are grateful and truly
appreciate for their kindness in giving us thoughtful advices, guidance,
suggestions and encouragement to assist us to complete our research project.
Firstly, we are deeply grateful to our supervisor, Mr. Khor, who guides, supports,
and assists us throughout the entire research. His patience, useful comments, and
valuable feedback had helped us a lot in carrying out our research project.
Moreover, he is willing to provide us with timely, insightful, and thoughtful
advices during our research process. This has lead us to learning and broadening
up our view towards the right way.
Furthermore, we also appreciate all the respondents who spend their precious time
and patience in helping us to complete the survey questionnaires. We would have
been impossible to complete our research project without their honest contribution
and help. These saved us a lot of time in completing the process of collecting data.
Beside, gratefulness is also paid to our group members. We are fully co-operating
with each other and willing to sacrifice our valuable time to enable smooth
processes in our research project. Without patient, co-operation, contribution,
sacrifice, concern, and understanding with each other, we are unable to complete
our research project on time with pleasure and glee. Once again, we truly,
gratefully, and honestly cherish everyone who assisted us in our research project.

Perceived Benefits and Online Shopping Decisions
v
DEDICATION
We would like to dedicate our precious work to our family, friends, and relatives
for giving their unlimited support, encouragement, help, and motivation
throughout the completion of this research project.

Perceived Benefits and Online Shopping Decisions
vi
TABLE OF CONTENTS
Page
Copyright Page .................................................................................................. ii
Declaration ........................................................................................................ iii
Acknowledgement ............................................................................................ iv
Dedication ......................................................................................................... v
Table of Contents .............................................................................................. vi
List of Tables .................................................................................................... xii
List of Figures ................................................................................................... xiv
List of Appendices ............................................................................................ xv
List of Abbreviations ........................................................................................ xvi
Preface ............................................................................................................... xvii
Abstract ............................................................................................................. xviii
CHAPTER 1 RESEARCH OVERVIEW .................................................... 1
1.0 Introduction ............................................................................ 1
1.1 Research Background ............................................................ 1
1.2 Problem Statement ................................................................. 2
1.3 Research Objectives ............................................................... 3
1.3.1 General Objective ...................................................... 3
1.3.2 Specific Objectives .................................................... 3
1.4 Research Questions ................................................................ 4
1.4.1 General Question ....................................................... 4
1.4.2 Specific Questions ..................................................... 4

Perceived Benefits and Online Shopping Decisions
vii
1.5 Hypotheses of the Study ........................................................ 5
1.6 Significance of the Study ....................................................... 5
1.7 Chapter Layout ....................................................................... 6
1.8 Conclusion ............................................................................. 6
CHAPTER 2 LITERATURE REVIEW ...................................................... 7
2.0 Introduction ............................................................................ 7
2.1 Review of the Literature ........................................................ 7
2.1.1 Webpage Design ........................................................ 7
2.1.2 Product Choice ........................................................... 8
2.1.3 Price ........................................................................... 9
2.1.4 Convenience ............................................................... 9
2.1.5 Customer Service ....................................................... 10
2.1.6 Product Quality .......................................................... 10
2.2 Review of Relevant Theoretical Models ................................ 11
2.3 Proposed Theoretical Framework .......................................... 13
2.4 Hypotheses Development ...................................................... 15
2.5 Conclusion ............................................................................. 16
CHAPTER 3 METHODOLOGY ................................................................ 17
3.0 Introduction ............................................................................ 17
3.1 Research Design ..................................................................... 17
3.1.1 Quantitative Research ................................................ 17
3.1.2 Cross Sectional Study Design .................................... 17
3.2 Data Collection Method ......................................................... 18
3.2.1 Primary Data .............................................................. 18
3.3 Sampling Design .................................................................... 18

Perceived Benefits and Online Shopping Decisions
viii
3.3.1 Target Population ....................................................... 18
3.3.2 Sampling Frame and Sampling Location ................... 18
3.3.3 Sampling Elements .................................................... 19
3.3.4 Sampling Technique .................................................. 20
3.3.5 Sampling Size ............................................................ 20
3.4 Research Instrument ............................................................... 21
3.4.1 Questionnaire Survey ................................................. 21
3.4.2 Pilot Test .................................................................... 21
3.5 Constructs Measurement ........................................................ 22
3.5.1 Independent Variables and Measurement .................. 22
3.5.1.1 Webpage Design ......................................... 22
3.5.1.2 Product Choice ............................................ 22
3.5.1.3 Price ............................................................ 23
3.5.1.4 Convenience ................................................ 23
3.5.1.5 Customer Service ........................................ 23
3.5.1.6 Product Quality ........................................... 23
3.5.2 Dependent Variable and Measurement ...................... 24
3.5.2.1 Online Shopping Decision .......................... 24
3.6 Data Processing ...................................................................... 24
3.6.1 Data Checking ............................................................ 24
3.6.2 Data Editing ............................................................... 25
3.6.3 Data Coding ............................................................... 25
3.6.4 Data Transcribing ....................................................... 26
3.7 Data Analysis ......................................................................... 26
3.7.1 Descriptive Analysis .................................................. 26

Perceived Benefits and Online Shopping Decisions
ix
3.7.2 Scale Measurement .................................................... 27
3.7.2.1 Internal Consistency Reliability Test .......... 27
3.7.2.2 Normality Test ............................................ 27
3.7.3 Inferential Analysis .................................................... 27
3.7.3.1 Pearson’s Correlation Analysis ................... 28
3.7.3.2 Multiple Regression Analysis ..................... 28
3.8 Conclusion ............................................................................. 28
CHAPTER 4 DATA ANALYSIS ................................................................ 29
4.0 Introduction ............................................................................ 29
4.1 Descriptive Analysis .............................................................. 29
4.1.1 Demographic Profile of the Respondents .................. 29
4.1.1.1 Age .............................................................. 30
4.1.1.2 Gender ......................................................... 32
4.1.1.3 Ethnic Group ............................................... 33
4.1.1.4 University .................................................... 35
4.1.1.5 Field of Study .............................................. 37
4.1.1.6 Online Shopping Experience ...................... 39
4.1.2 Central Tendencies Measurement of Constructs ....... 41
4.2 Scale Measurement ................................................................ 56
4.2.1 Internal Consistency Reliability Test ......................... 56
4.2.2 Normality Test ........................................................... 57
4.3 Inferential Analysis ................................................................ 59
4.3.1 Pearson’s Correlation Analysis .................................. 59
4.3.2 Multiple Regression Analysis .................................... 61
4.4 Conclusion ............................................................................. 67

Perceived Benefits and Online Shopping Decisions
x
CHAPTER 5 DISCUSSION, CONCLUSION AND IMPLICATIONS ..... 68
5.0 Introduction ............................................................................ 68
5.1 Summary of Statistical Analysis ............................................ 68
5.1.1 Descriptive Analysis .................................................. 68
5.1.1.1 Demographic Profile of the Respondents ... 68
5.1.1.2 Central Tendencies Measurement of
Constructs ................................................... 69
5.1.2 Scale Measurement .................................................... 72
5.1.2.1 Internal Consistency Reliability Test .......... 72
5.1.2.2 Normality Test ............................................ 73
5.1.3 Inferential Analysis .................................................... 73
5.1.3.1 Pearson’s Correlation Analysis ................... 73
5.1.3.2 Multiple Regression Analysis ..................... 73
5.2 Discussions of Major Findings .............................................. 75
5.2.1 Webpage Design ........................................................ 76
5.2.2 Product Choice ........................................................... 76
5.2.3 Price ........................................................................... 76
5.2.4 Convenience ............................................................... 77
5.2.5 Customer Service ....................................................... 77
5.2.6 Product Quality .......................................................... 77
5.3 Implications of the Study ....................................................... 78
5.3.1 Theoretical Implications ............................................ 78
5.3.2 Managerial Implications ............................................ 78
5.4 Limitations of the Study ......................................................... 79
5.5 Recommendations for Future Research ................................. 80

Perceived Benefits and Online Shopping Decisions
xi
5.6 Conclusion ............................................................................. 80
References ......................................................................................................... 82
Appendices ........................................................................................................ 90

Perceived Benefits and Online Shopping Decisions
xii
LIST OF TABLES
Page
Table 2.1 : Hypotheses of the Study and Explanation 15
Table 3.1 : Sampling Location and Sample Distribution 19
Table 4.1 : Age of the Respondents 30
Table 4.2 : Gender of the Respondents 32
Table 4.3 : Ethnic Groups of the Respondents 33
Table 4.4 : Universities of the Respondents 35
Table 4.5 : Field of Study of the Respondents 37
Table 4.6 : Online Shopping Experience of the Respondents 39
Table 4.7 : Central Tendencies Measurement of Constructs: Webpage
Design 42
Table 4.8 : Central Tendencies Measurement of Constructs: Product Choice 44
Table 4.9 : Central Tendencies Measurement of Constructs: Price 46
Table 4.10 : Central Tendencies Measurement of Constructs: Convenience 48
Table 4.11 : Central Tendencies Measurement of Constructs: Customer
Service 50
Table 4.12 : Central Tendencies Measurement of Constructs: Product
Quality 52
Table 4.13 : Central Tendencies Measurement of Constructs: Online
Shopping Decision 54
Table 4.14 : Internal Consistency Reliability Test 56

Perceived Benefits and Online Shopping Decisions
xiii
Table 4.15 : Normality Test: Descriptives 57
Table 4.16 : Correlations between Independent Variables and Dependent
Variable 59
Table 4.17 : Multiple Regression Test: Model Summary 61
Table 4.18 : Multiple Regression Test: ANOVA 62
Table 4.19 : Multiple Regression Test: Coefficients 63
Table 5.1 : Webpage Design 69
Table 5.2 : Product Choice 69
Table 5.3 : Price 70
Table 5.4 : Convenience 70
Table 5.5 : Customer Service 71
Table 5.6 : Product Quality 71
Table 5.7 : Online Shopping Decision 72
Table 5.8 : Results of Hypothesis Testing 75

Perceived Benefits and Online Shopping Decisions
xiv
LIST OF FIGURES
Page
Figure 2.1 : Valence Framework 12
Figure 2.2 : Relationship between Perceived Benefits and Online Shopping
Decision 14
Figure 4.1 : Age of the Respondents 30
Figure 4.2 : Gender of the Respondents 32
Figure 4.3 : Ethnic Groups of the Respondents 33
Figure 4.4 : Universities of the Respondents 35
Figure 4.5 : Field of Study of the Respondents 37
Figure 4.6 : Online Shopping Experience of the Respondents 39

Perceived Benefits and Online Shopping Decisions
xv
LIST OF APPENDICES
Page
Appendix 2.1 : Summary of Past Empirical Studies ............. 90
Appendix 3.1 : Permission Letter to Conduct Survey ........... 93
Appendix 3.2 : Survey Questionnaire ................................... 94
Appendix 3.3 : Variables and Measurement ......................... 100

Perceived Benefits and Online Shopping Decisions
xvi
LIST OF ABBREVIATIONS
CN Convenience
CS Customer Service
MMU Multimedia University
MONASH Monash University Malaysia
OS Online Shopping Decision
OUM Open University Malaysia
PC Product Choice
PQ Product Quality
PR Price
SPSS Statistical Package for Social Science
TAYLOR Taylor’s University College
UNISEL Universiti Industri Selangor
UniTAR Universiti Tun Abdul Razak
UNiTEN Universiti Tenage Nasional
UNM University of Nottingham Malaysia
UTAR Universiti Tunku Abdul Rahman
UTP Universiti Teknologi PETRONAS
WD Webpage Design

Perceived Benefits and Online Shopping Decisions
xvii
PREFACE
Online shopping generally refers to online transactions where products or services
are sold to consumers via Internet. Increased Internet usage in Malaysia had
encouraged the development of E-commerce in the Malaysia. Thus, this has
caused a tremendous change in traditional business methods which require
physical stores to conduct a business instead of virtual shopping environment.
After exploring into the vast literature on the concept of online shopping, a few
theoretical frameworks of past studies were selected to test in our local context.
For instance, in adopting Kim, Cho and Rao (2000) valence framework, this study
seek to explore its variables of perceived benefits. It is chosen as we wish to
further understand how perceived benefits variables affect the online shopping
decisions in Malaysia.
Perceived benefits means consumer’s belief in which aspects they will be
beneficial of from the online transactions with certain Websites. The examples of
perceived benefits variables are Websites design, product choice, price,
convenience, customer service and product quality.
In other words, this research explore how does a consumer believe in he or she
will be benefit from conducting online shopping and to what extent that what they
believe affected their decision.

Perceived Benefits and Online Shopping Decisions
xviii
ABSTRACT
The increase usage of Internet has brought opportunities to E-commerce
application in Malaysia. This research is conducted based on valence framework
to investigate the relationship of perceived benefits and Malaysian undergraduates’
online shopping decision. A better understanding on the influential effects in
perceived benefits towards online shopping will be beneficial to Entrepreneurs,
investors, and E-marketers since it is useful in determining their strategy towards
E-commerce establishment. This research also contributes to academicians and
future researcher to have more in-depth knowledge on the potential market share
for E-commerce. The independent variables include Webpage design, product
choices, prices, convenience, customer service, and product choices. Online
shopping decision is the dependent variable of this study. Quota sampling is used
to collect data of 500 target undergraduates from 10 private universities in
Malaysia. Normality test, reliability test, Pearson Correlation, and Multiple Linear
Regression analysis are being conducted on the variables of this research. This
research aims to provide more persuasive information on which perceived benefits
variables will give the greatest impact on the E-commerce implementation.

Perceived Benefits and Online Shopping Decisions
Page 1 of 102
CHAPTER 1: RESEARCH OVERVIEW
1.0 Introduction
In this chapter, background of the study will be discussed. Besides, the purposes
and objectives of the study can also be found in problem statement, research
questions and objectives. Furthermore, the importance and contribution of this
study will be explained in significance of the study. There is also a brief outlines
for each chapters in the study.
1.1 Research Background
The rapid growth of Internet usage is no doubt in this information technology era.
In Malaysia, the growth of Internet users is 356.8 % since 2000. The internet
penetration as at March 31, 2011 is 58.8% (Internet World Stats, 2011). The
extensive uses of Internet have resulted in mounting popularity in online shopping.
In the world history, there is no other industry which has accomplished a rapid
growth in as short a time as E-commerce (Khatibi, Thyagarajan, & Seetharaman,
2003). Due to this rapid growth, it grabs the attention for further research (Osman,
Chan, & Bei, 2010).
Online shopping typically refers to online transactions where products or services
are sold to consumers via Internet. As the largest shopping mall globally, the
Internet allows consumers today to make online transactions from anywhere at
anytime by just a few clicks (Kim, Lee, & Kim, 2004). The traditional boundaries
will soon be replaced by a new intermediary for purchasing goods and services
(Paynter & Lim, 2001).
Students are the largest group of Internet users (Lichtenstein & Swatman, 1997).
They are the most important because they would be the main purchasing force in
future. Thus, their purchasing power and drivers of their purchasing decision

Perceived Benefits and Online Shopping Decisions
Page 2 of 102
cannot be overlooked. Understanding these will contribute to further development
of marketing strategies in online shopping context (Delafrooz, Paim, & Khatibi,
2010).
1.2 Problem Statement
In the latest era of technology, Internet has become a major component in the
business environment. As a result, Internet is used as a tool to enhance businesses.
In 2001, 48.9% of Internet users have online purchasing experience, with three
quarters of the online buyers expect that they purchase online for at least 10 times
in a year. More than 627 million people in the world have the experience in
shopping online (Delafrooz, 2009).
Despite having rapid growth in online shopping industry, there is undeniable
evidence that there are customers who may make decision of not to buy online
even if they have made several searches throughout the retail Websites. 81% of
those who browse Websites for goods and services do not actually purchase online
(Delafrooz, 2009).
According to the survey by BizRate.com on 9500 shoppers, 55% online shoppers
abandon their purposes when they are searching for products while 32% of them
discard when making payment (Sim, Eastlick, Lotz, & Warrington, 2004).
However, the result cannot be generalized as it was done overseas and it does not
represent Malaysian online shoppers. Closer examination is needed on specific
countries because there are differences between countries in the context of culture
and other factors.
Different researchers have different perspective on the factors influencing online
shopping decision significantly. Ranganthan and Ganapathy (2002) argued that
security or privacy is the main considerations of the consumers; whereas Shergill
and Chen (2005) argued that the key factor is Website design.

Perceived Benefits and Online Shopping Decisions
Page 3 of 102
As online consumers tend to be better educated, younger, and more affluent than
the general population, this segment is extremely attractive to marketers
(Berkowitz, Kerin, Hartley, & Rudelius, 2000). With the expansion of educational
services in Malaysia, undergraduates are becoming one of the most important
market segments as they are the ones who have online shopping interest and high
purchasing power (Delafrooz, 2009). Furthermore, E-commerce in Malaysia is
still at the early stage of development (Yulihasri, Islam, & Daud, 2011). Hence,
online retailers need to have an understanding on this channel.
1.3 Research Objectives
1.3.1 General Objective
The general objective of this study is to investigate the perceived benefits
which affect undergraduates’ online shopping decision.
1.3.1 Specific Objectives
The objectives of this research are:
1. To investigate the relationship between Webpage design and online
shopping decision.
2. To investigate the relationship between product choice and online
shopping decision.
3. To investigate the relationship between price and online shopping
decision.
4. To investigate the relationship between convenience and online
shopping decision.
5. To investigate the relationship between customer service and online
shopping decision.

Perceived Benefits and Online Shopping Decisions
Page 4 of 102
6. To investigate the relationship between product quality and online
shopping decision.
7. To investigate which element of perceived benefits has the largest
influence on online shopping decision.
1.4 Research Questions
1.4.1 General Question
What are the elements of perceived benefits which affect undergraduates
to make decision to shop online?
1.4.2 Specific Questions
1. Is there a significant relationship between Webpage design and online
shopping decision?
2. Is there a significant relationship between product choice and online
shopping decision?
3. Is there a significant relationship between price and online shopping
decision?
4. Is there a significant relationship between convenience and online
shopping decision?
5. Is there a significant relationship between customer service and online
shopping decision?
6. Is there a significant relationship between product quality and online
shopping decision?
7. Which element of perceived benefits has the largest influence on
online shopping decision?

Perceived Benefits and Online Shopping Decisions
Page 5 of 102
1.5 Hypotheses of the Study
H1 : There is a significant relationship between Webpage design and
undergraduates’ online shopping decision.
H2 : There is a significant relationship between product choices and
undergraduates’ online shopping decision.
H3 : There is a significant relationship between prices and undergraduates’
online shopping decision.
H4 : There is a significant relationship between convenience and
undergraduates’ online shopping decision.
H5 : There is a significant relationship between customer service and
undergraduates’ online shopping decision.
H6 : There is a significant relationship between product quality and
undergraduates’ online shopping decision.
1.6 Significance of the Study
With a better understanding of the relationship between perceived benefits and
online shopping decisions, managers can analyse and amend their strategies to
boost up online shopping business. Interested parties such as entrepreneurs and
investors that have the intention to march into the E-commerce business can also
gain benefits through this study as to identify the largest influential effect of
perceived benefits which will affect the undergraduates’ online purchase decision.
They can focus on the significant factor and stay alert about the trends and factors
of online shopping.
E-marketers can also have a better knowledge on perception of students on
benefits gained on purchasing decisions. They can know how to market their
Websites in order to attract students. An improved insight can also be developed
to improve their perspective on the factors affecting the decisions.

Perceived Benefits and Online Shopping Decisions
Page 6 of 102
As no study has been conducted on the direct relationship between perceived
benefits and online purchase decisions in Malaysia, this study can be used as a
reference for future researcher. Moreover, academician can use this research to
have further understanding and study.
1.7 Chapter Layout
In Chapter One, purposes and objectives of this study can be found. The reason of
conducting this study and how future researches benefit from this study is also
explained. In Chapter Two, valence framework is explained. Past studies on the
independent variables are reviewed. Conceptual framework is built and
hypotheses are formed to test in this research. Sampling techniques and data
collection method are explained in Chapter Three. The way to analyze data is also
planned and explained in this chapter. In Chapter Four, there will be the analysis
of data that collected from the questionnaire that distributed to 500 target
respondents in this study. Descriptive analysis and inferential analysis will be
carried out. Lastly, Chapter Five will focus on the discussion of the results and
limitations in this study. Besides, recommendations and implications will also be
provided for the reference of future researchers and practitioners respectively.
1.8 Conclusion
In conclusion, this chapter studies the background of online shopping in recent
years. Also, it identifies the purpose, objectives, hypotheses and significance of
this research. In next chapter, researcher will review on the related past studies
which study on the influences of perceived benefits factors on the consumers’
buying decision. Then, the researcher will propose a conceptual framework based
on the past review on other researchers’ studies. Also, hypotheses will be
developed based on this framework.

Perceived Benefits and Online Shopping Decisions
Page 7 of 102
CHAPTER 2: LITERATURE REVIEW
2.0 Introduction
In previous chapter, current trend of online shopping are exposed. The major
perceived benefits affecting online shopping are identified. Their relationship is
studied in this research. This chapter documents the comprehensive review of the
past studies conducted on the perceived benefits. A conceptual framework is
proposed and hypotheses are formed.
2.1 Review of the Literature
Nowadays, the usage of Internet is very common. It acts as the channel to search
for information and to shop online. Taylor Nelson Sofres’ Report 2001 (as cited in
Hannula & Chuck, 2003) stated that the percentage of worldwide online shoppers
has increased by 50% from 2000 to 2001. Consumers’ perceived benefits
comprises of the sum of online shopping advantages or satisfactions that meet
their demands (Wu, 2003). There are six perceived benefits considered in this
research, which are Webpage design, product choice, price, convenience,
customer service, and product quality.
2.1.1 Webpage Design
According to Zhang, Dran, Small, and Barcellos (1999, 2000) and Zhang
and Dran (2000) (as cited in Li & Zhang, 2002), Website design has two
features, which are hygiene and motivator elements. These elements
contribute to user dissatisfaction and satisfaction. Hygiene elements are
those features making the website functional. Its absence will cause user

Perceived Benefits and Online Shopping Decisions
Page 8 of 102
dissatisfaction. Motivator elements add value to the Website. For E-
retailing, Webpage design is crucial as it acts as the marketplaces.
Ho and Wu (1999) (as cited in Shergill et al., 2005) stated that Webpage
design is a major reason affecting customer satisfactions towards online
shopping. Shergill et al. (2005) found that Webpage design is the second
most important element emphasized by most online shopper. There was
also a positive relationship between Webpage and online shopping’s
attitude (Delafrooz et al., 2010). Liang and Lai (2001) found that
consumers prefer to shop at well-designed Website. These findings prove
that there is a significant relationship between online shopping attitudes
and Webpage design.
2.1.2 Product Choice
Dillon and Reif (2004) state that product choices are important as it
provides shoppers with the opportunity to compare, contrast, and select
from multiple potential solutions which meet their needs.
Harn, Khatibi, and Ismail (2006) stated that there are wider product
choices over the Internet since there is no physical space limit. This shows
that Malaysians are looking for wider choices of goods when shopping
online. According to Simon, Palma, and Thisse (1992), consumer choice is
greatly dependent on product differentiation. Differentiations will motivate
consumer to shop online (Delafrooz, Paim, & Khatibi, 2011). Finding in
Han, Bullington, and Case (2006) shows that product variety is important
to online shoppers. Similar results of these studies prove that wider
product choice will increase online shopping frequency.

Perceived Benefits and Online Shopping Decisions
Page 9 of 102
2.1.3 Price
Price is defined as total monetary cost to purchase (Dillon et al., 2004). All
consumers perceived that online purchasing is cheaper than offline
(Goldsmith & Goldsmith, 2002). In Rowley (2000) (as cited in Harn et al.,
2006), price is the dominant factor that influences consumers’ decision to
shop online.
Harn et al. (2006) proves that online shoppers in Malaysia look forward for
cheaper product. Su and Huang (2011) also proved that online shopping
intention for undergraduates is significantly influenced by prices. Similarly,
Ahuja, Gupta, and Raman (2003) proved that price is the second strongest
motivator for students to shop online. In earlier research by Goldsmith and
Bridges (2000), lower price was a positive attribute that encourages online
buying.
2.1.4 Convenience
According to Hanson (1999) (as cited in Harn et al., 2006), convenience is
measured in form of time consumed, location to shop and purchasing
process. It motivates consumers to shop online.
Harn et al. (2006) stated that the usage of Internet is much more
convenient than other traditional methods of purchasing. They mentioned
that the 24-hour availability of online shopping and accessibility makes
online shopping more convenient.
Girard, Korgaonkar, and Silverblatt (2003) said that convenience is a
stronger motivator to shop online (as cited in Amoroso & Hunsinger,
2008). Result shows that convenience tends to influence E-Loyalty
significantly (Amoroso et al., 2008). It is consistent with the findings in
Ahuja et al. (2003). Lastly, Chiger (2001) and Supphellen and Nysveen

Perceived Benefits and Online Shopping Decisions
Page 10 of 102
(2001) (as cited in Kim & Kim, 2004) found that convenience play
significant roles in intention to revisit certain site.
2.1.5 Customer Service
Customer service means the ability of customer to reach the vendor if they
face problem while shopping and post-purchase service problems (Ahuja
et al., 2003). Good customer service led to customer satisfaction would
result in consumer loyalty (Shergill et al., 2005).
Less attention is given on the customer services elements. However,
Delafrooz et al. (2010, 2011) showed significant correlation between
shopping intention and customer service. This is same with the results in
Harn et al. (2006) and Ahuja et al. (2003), which perceived that customer
services influence the buying behavior significantly.
2.1.6 Product Quality
Product quality means actual functionality of product, consistency between
the quality specification of Internet shopping mall and real quality of the
physical product (Ahn, Ryu, & Han, 2004). Product quality was found
positively affecting consumers’ online shopping intention (Ahn et al., 2004;
Han et al, 2006).
In Arnold, Handelman, and Tiger (1996) and Baker, Levy, and Grewal
(1992) (as cited in Dillon et al., 2004), product quality has the highest
influential effect on online shoppers. Dillon et al. (2004) also proved that
students who tend to shop online are likely to be affected by the product
quality. Han et al, (2006) studied product quality as it is one of the
motivators derived by other online research firm.

Perceived Benefits and Online Shopping Decisions
Page 11 of 102
In conclusion, the past results showed that the above elements are the most
common elements motivating online purchase. Conflicts arose in past researches.
Thus, a research on perceived benefits should be conducted to clarify and find out
which element has the largest influence on online shopping decision.
2.2 Review of Relevant Theoretical Models
According to Goodwin (1996), the ideas of valence framework is primarily
derived from economics and psychology literature (as cited in Kim, Ferrin, & Rao,
2003). Valence framework considers both perceived benefits and perceived risks
(Lu, Cao, Wang, & Yang, 2011).
Perceived benefit refers to consumer's belief in the aspects where they will be
beneficial of from the online transaction with a certain Website (Kim, Ferrin &
Rao, 2008). Also, Kim et al. (2008) defined perceived risk as a consumer’s belief
in the possible negative effects from conducting online purchasing.
The basic ideas of valence framework have been adopted in the game research
(Harrington & Hess, 1996) and marketing research (Peter & Tarpey, 1975) even
though it has not been established. The marketing research investigates
consumer’s behaviors in views of these two perceptions toward risks and benefits
(Peter et al., 1975).
Several marketing management researches (Jacoby & Kaplan, 1972; Petter &
Ryan, 1976; Zikmund & Scott, 1973) are done on the purchasing behavior of
consumers in perception of risks (as cited in Kim, Cho, & Rao, 2000). However,
perception of risks is not the only factor influencing purchasing behavior. Wilkie
and Pessemier (1973) showed significant result that consumers regard perceived
benefits as fundamental reason for the purchasing behavior.
The concept of this framework was originated from Peter et al. (1975) (as cited in
Lu et al., 2011), which assumes that consumer perceived the products to have both

Perceived Benefits and Online Shopping Decisions
Page 12 of 102
positive (perceived benefits) and negative (perceived risks) traits, and the
purchasing decision made is according to the maximised net valence of these two
attributes. Peter et al. (1975) (as cited in Kim et al., 2000) recognized three
fundamentals concept for consumer decision making, which are perceived risks,
perceived benefits, and net valence.
In short, Peter et al. (1975) stated that perceived benefits and perceived risks are
fundamental aspects to influence consumers’ purchasing behavior (as cited in Kim
et al., 2003).
Figure 2.1: Valence Framework
Adapted from: Kim, D.J., Cho, B., & Rao, H.R. (2000). Effects of consumer
lifestyle on purchasing behavior on the Internet: a conceptual framework and
empirical validation. Proceeding of the ICIS’00 Proceedings of the twenty first
international conference on information system, 688-695.
Valence framework is applied in Kim et al. (2000) as well. Figure 2.1 shows the
basic theoretical framework of the study. In Kim et al. (2000), the primary concept
is that consumers’ purchasing decisions are based on the perception of risk and
benefits regarding online shopping. This is relevant to the study on relationship
between perceived benefits factors towards undergraduates’ online shopping
behavior.
The underlying logic is consumer’s buying behavior is influenced by perceived
risks and benefits. However, researchers’ primary concern is to study on how the
perceived benefits attributes would influence online buying decisions of
undergraduates in Malaysia. This can be done by further investigating into each
perceived benefits, which includes Webpage design, product choice, price,
Perceived
Risks Purchasing
Behavior
Perceived
Benefits

Perceived Benefits and Online Shopping Decisions
Page 13 of 102
convenience, customer service, and product quality. Thus, valence framework is
chosen in this study to conduct a test on the relationship between perceived
benefits and decisions to shop online.
2.3 Proposed Theoretical Framework
The proposed framework is illustrated in Figure 2.2 and the hypotheses of this
study are formed based on this framework.

Perceived Benefits and Online Shopping Decisions
Page 14 of 102
Figure 2.2: Relationship between Perceived Benefits and Online Shopping
Decision
Adapted from: Delafrooz, N., Paim, L.H., & Khatibi, A. (2010). Students’ Online
Shopping Behavior: An Empirical Study. Journal of American Science, 6(1),
137-147.
Webpage Design
Price
Product Choice
Online Shopping Decision
Customer Service
Convenience
Product Quality
H2
Perceived Benefits
H1
H3
H4
H5
H6

Perceived Benefits and Online Shopping Decisions
Page 15 of 102
2.4 Hypotheses Development
Hypotheses of this study are explained in Table 2.1.
Table 2.1: Hypotheses of the Study and Explanation
Hypotheses Explanation
H1 : There is a significant
relationship between
Webpage design and
undergraduates’ online
shopping decision.
Webpage of the online retailers may affect
undergraduates’ decision. They will purchase
from the retailer that provide an attractive and
user friendly Webpage.
H2 : There is a significant
relationship between
product choice and
undergraduates’ online
shopping decision.
Product choice will drive the decision of
undergraduates during purchasing online. An
online retailer that provides wider selection on
the product will attract undergraduates to buy
from them.
H3 : There is a significant
relationship between price
and undergraduates’ online
shopping decision.
Price will affect undergraduates’ decision on
online shopping. Given a same type of product,
student will choose to buy the product with
lower price due to limited cost.
H4 : There is a significant
relationship between
convenience and
undergraduates’ online
shopping decision.
Convenience will be a factor that affects
undergraduates’ online shopping decision.
Online retailer that can make undergraduates
save time and money will be chosen.
H5 : There is a significant
relationship between a
customer service and
undergraduates’ online
shopping decision.
Undergraduates’ decision will be affected by
customer service such as e-form inquiry and
customer comment provided by online retailers,
a retailer that provides better customer service
will be chosen by undergraduates.
H6 : There is a significant
relationship between
product quality and
undergraduates’ online
shopping decision.
Undergraduates will make decision based on the
quality of product that the online retailers sold.
The retailer that offer good quality product will
be undergraduates’ choice.

Perceived Benefits and Online Shopping Decisions
Page 16 of 102
2.5 Conclusion
This chapter reviews the relevant past studies on the influences of six
perceived benefits towards consumers’ purchasing decision. Valence
framework is chosen as the theoretical model for this research. This study
only focuses on perceived benefits attributes in valence framework. Lastly,
hypotheses are being developed from the proposed framework. After
reviewing and developing the framework, researcher would decide on how to
conduct the research in next chapter.

Perceived Benefits and Online Shopping Decisions
Page 17 of 102
CHAPTER 3: RESEARCH METHODOLOGY
3.0 Introduction
In this chapter, the research design in term of quantitative research and cross
sectional study design will be described. Besides, the population, sample and
sampling method would also be determined. The method to collect data from
target respondents would be explained. Furthermore, the measurement of
variables and the technique for analysis of data would be discussed.
3.1 Research Design
3.1.1 Quantitative Research
Quantitative research is a business research that adopts empirical
assessments involving numerical measurement and analysis in order to
address research objectives (Zikmund, Babin, Carr, & Griffin, 2010). This
research uses the information from sample being studied as the result of
analysis. Therefore, it is classified as quantitative research.
3.1.2 Cross Sectional Study Design
This research is a cross sectional study. Data collected from the sample is
representing a point of time only where it only determines the relationship
between independent variables and the dependent variable (Olsen & St.
George, 2004). Cross sectional study is used because it allows the
comparison of many different variables in a same time (Gibson, 2009).

Perceived Benefits and Online Shopping Decisions
Page 18 of 102
3.2 Data Collection Method
3.2.1 Primary Data
Primary data collection method in the form of self-administrated
questionnaire is chosen to collect data from respondents. Respondents are
required to answer all questions in the questionnaire. The questionnaires
are distributed to the target respondents by hand and are collected back
once they have answered.
3.3 Sampling Design
3.3.1 Target Population
The unit of analysis in this research is undergraduates of private
universities in Malaysia. Online consumers are better educated, younger,
and more affluent which makes them an attractive market to explore
(Berkowitz et al. 2000). Gardyn (2002) (as cited in Delafrooz et al., 2010)
state that undergraduates access the Internet 90% daily. According to Sabri,
MacDonald, Masud, Paim, Hira, and Othman (2008) (as cited in Delafrooz
et al., 2010), with the expansion of education level, undergraduates have
became common consumers in Malaysia.
3.3.2 Sampling Frame and Sampling Location
Table 3.1 shows the universities chosen as the sampling location and the
sample distribution in each university. Sampling method is used due to
budget and time constraints. It is impracticable to reach all private

Perceived Benefits and Online Shopping Decisions
Page 19 of 102
universities in Malaysia (Saunders, Lewis, & Thornhill, 2003). It is
impossible to obtain names of all students in all universities.
Table 3.1: Sampling Location and Sample Distribution
Universities Sample Size
Multimedia University (MMU) 50
Universiti Tenaga Nasional (UNiTEN) 50
Open University Malaysia (OUM) 50
University of Nottingham Malaysia (UNM) 50
Universiti Teknologi PETRONAS (UTP) 50
Taylor's University College (Taylor) 50
Universiti Tunku Abdul Rahman (UTAR) 50
Universiti Tun Abdul Razak (UniTAR) 50
Monash University Malaysia (Monash) 50
Universiti Industri Selangor (Unisel) 50
3.3.3 Sampling Elements
500 undergraduates between the ages of 18 to 26 from top ten local and
international private universities in Malaysia is the sample chosen. These
huge samples are needed to provide an adequate level of confidence to the
study (Delafrooz et al., 2011).

Perceived Benefits and Online Shopping Decisions
Page 20 of 102
3.3.4 Sampling Technique
Non-probability sampling is adopted because the probability of each case
to be selected from the population is unknown (Saunders et al., 2003).
Also, it is lower cost, speedy in collecting the data and more convenient
(Zikmund et al., 2010). Quota sampling is used in this research. Data is
collected in the ten chosen universities until each university has reached 50
cases.
3.3.5 Sampling Size
A total of 500 samples will be chosen where each universities accounts for
50 samples. According to Sekaran (2003), 30-500 samples are most
suitable for most research. The sample must possess certain similar
characteristics to the populations (Jackson, 2008). Respondents from ten
universities are chosen to avoid bias by surveying from only one university.
The sample selections are arbitrary as researcher relied on personal
judgement. By accumulating all 50 cases from ten universities, a
representative samples from the populations will be generated (Zikmund,
2003).
Barlett, Kotrlik, and Higgins (2001) used two factors, the margin of error
and the alpha level, to estimate the reliability of the sample size. 5% of
margin of error is acceptable (Barlett et al., 2001). Therefore, the sample
size of 500 respondents is considered appropriate as it produces only 4.5%
margin of error (Margin of error = ). The result obtained has 95.5%
of accuracy. In order to test reliability of the sample size, Cochran’s
formula can be used by inserting selected alpha value for utilizing t-value.
Generally, most research accepts an alpha level of 0.05. Thus, for the sample
size of more than 120, the t-value will be around 1.96 for alpha value of
0.05 (Barlett et al., 2001).

Perceived Benefits and Online Shopping Decisions
Page 21 of 102
3.4 Research Instrument
3.4.1 Questionnaire Survey
Questionnaire is used because it is an efficient way to collect responses
from large sample where each respondent is asked to answer on the same
set of questions (Saunders, Lewis, & Thornhill, 2009). It is absolutely
necessary that the layout of the questionnaire is made simple so that the
respondents can easily understand, and answer them without taking much
of their time. The reason is because the form of questions asked, the
language used, and the length of the questionnaire will affect the response
rate.
The questionnaire of this research was sequenced accordingly into three
sections namely Section A, B, and C. In the first part, respondents are
asked to answer questions about their socio-demographic background such
as gender, race, and education. The other two parts are closed-ended
questions about perceived benefits and online purchasing decision.
3.4.2 Pilot Test
A pilot test is conducted prior to the survey. According to Kim et al.
(2004), pre-test of questionnaire is to ensure that the questionnaire items
are readable and in logical arrangement. Besides, pre-test may help to
ensure that the items suit the study’s requirement (Osman et al., 2010).
According to Neuman (1997), only small set of respondents is needed for
pilot test. Monette, Sullivan, and DeJong (2002) suggested that 20 people
from the sample should be contacted randomly for testing. After collecting
the answered questionnaires, reliability test is carried out. Cronbach Alpha
which gives a value of 0.7 or greater, shows the scale has good reliability.
The suggestions and comments from these respondents are then evaluated

Perceived Benefits and Online Shopping Decisions
Page 22 of 102
and incorporated into the questionnaire. Finally, the revised questionnaires
are sent to the 500 target respondents by hands.
3.5 Constructs Measurement
3.5.1 Independent Variables and Measurement
Each of the independent variable is measured by five or six items (Refer to
Appendix 3.3). Respondents are requested to rate all items by five-point
Likert’s scale. Five-point Likert’s scale is used as it is simple to develop
and less time consuming (Salkind, 2007). The scale is ranged from
strongly disagree (1) to strongly agree (5). All independent variables are
interval data.
3.5.1.1 Webpage Design
The six items to measure Webpage design are adapted from Chai,
Eze, and Ndubisi (2011), Forsythe, Petee, and Jai (2003),
Delafrooz, Paim, and Khatibi (2009a), and Rishi (2008).
3.5.1.2 Product Choice
The five items to measure product choice are developed from
different researches, which are Osman et al. (2010), Robin (2009),
Forsythe et al. (2003), Kim et al. (2004), and Chan and Chow
(2010).

Perceived Benefits and Online Shopping Decisions
Page 23 of 102
3.5.1.3 Price
Adapted from Osman et al., (2010), Chai et al. (2011), Dabhade
(2008), and Tak and Wan (2006) are the six items to measure price.
3.5.1.4 Convenience
Researches of Robin (2009), Forsythe et al. (2003), Osman et al.
(2010), and Kim et al. (2004) has developed the six items used to
measure the variable of convenience in this research.
3.5.1.5 Customer Service
The five items to measure customer service are adapted from Chai
et al. (2011), Chan et al. (2010), and Delafrooz et al. (2009a).
3.5.1.6 Product Quality
The five items to measure product quality are adapted from
Torkzadeh and Dhillon (2002), Chai et al. (2011), Dabhade (2008),
and Osman et al. (2010).
The reason for the items adapted from these studies is because these
researches also focus on online shopping.

Perceived Benefits and Online Shopping Decisions
Page 24 of 102
3.5.2 Dependent Variable and Measurement
The dependent variable is measured by five items (Refer to Appendix 3.3).
Respondents are requested to rate all items by five-point Likert’s scale.
The scale is ranged from strongly disagree (1) to strongly agree (5). The
dependent variable is interval data.
3.5.2.1 Online Shopping Decision
There are five items to measure online shopping decision. These
five items are adapted from Delafrooz, Paim, and Khatibi (2009b),
Goldsmith (2002), Chan et al. (2010), and Osman et al., (2010).
3.6 Data Processing
The questionnaires would be analysed once they are collected from the
respondents. Before the analysis of data, steps of checking, editing, coding, and
transcribing, as well as specifying any special or unusual treatments of data would
be carried out.
3.6.1 Data Checking
Data checking is carried out at first to ensure no omission on all
questionnaires. Before the distribution, pilot test had been conducted by
distributing to twenty respondents. Then, reliability test is conducted to
ensure the reliability of data.

Perceived Benefits and Online Shopping Decisions
Page 25 of 102
3.6.2 Data Editing
Each questionnaire is then be reviewed and edited. Any incomplete,
inconsistent, unsatisfactory, or ambiguous answers would be discarded to
minimise the response bias and the precision of the data can be reinforced.
3.6.3 Data Coding
The third step is assigning a code to represent a specific response of a
specific question (Malhotra, 2004).
For the first question in Section A of the questionnaire, “18-20” years old
is coded as 1, “21-23” years old is coded as 2, “24-26” years old is coded
as 3, and “26 and above” is coded as 4. As for question 2, “Male” is coded
as 1 and “Female” is coded as 2. For question 3, “Malay” is coded as 1,
“Chinese” is coded as 2, “Indian” is coded as 3, and “Others” is coded as 4.
For question 4, “MMU” is coded as 1, “UNiTEN” is coded as 2, “OUM” is
coded as 3, “UNM” is coded as 4, “UTP” is coded as 5, “Taylor” is coded
as 6, “UTAR” is coded as 7, “UniTAR” is coded as 8, “Monash” is coded
as 9, “Unisel” is coded as 10, and “Others” is coded as 11.
For question 5, “Business” is coded as 1, “Engineering” is coded as 2,
“Social Science” is coded as 3, “Science” is coded as 4, “Arts and Design”
is coded as 5, “Language and Linguistics” is coded as 6, and “Others” is
coded as 7. For the last question, “Never” is coded as 1, “1-5” is coded as
2, “6-10” is coded as 3, “11-15” is coded as 4, and “15 and above” is
coded as 5.
For every question in Section B and C, “Strongly Disagree” is coded as 1,
“Disagree” is coded as 2, “Neutral” is coded as 3, “Agree” is coded as 4,
and “Strongly Agree” is coded as 5.

Perceived Benefits and Online Shopping Decisions
Page 26 of 102
To complete this research, the Statistical Package for Social Science (SPSS)
software would be used for data coding and data transcribing.
3.6.4 Data Transcribing
The final step is keypunching the coded data from the questionnaires into
computers (Malhotra, 1993). Coded data would be transcribed into SPSS
version 16.0 for data analysis.
3.7 Data Analysis
3.7.1 Descriptive Analysis
Descriptive statistic analysis is conducted to conclude and profile the
sample characteristics (Dabhade, 2008). The respondents' feedback is
summarised by descriptive analytical tools such as mean and standard
deviation (Chai et al., 2010). Mean is used to measure the central tendency
of the data while standard deviation measures the variability that will give
a quantitative index of the dispersion of the distributions (Zikmund et al.,
2010). According to Cao and Mokhtarian (2005), descriptive analysis is
showing what happened for a particular sample at a particular time, which
provides a clear picture of observed behavior.

Perceived Benefits and Online Shopping Decisions
Page 27 of 102
3.7.2 Scale Measurement
3.7.2.1 Internal Consistency Reliability Test
Reliability test should be conducted. It is a test on the consistency
of raw data collected and if there is transparency in how the data is
made up (Saunders et al., 2009). Cronbach Alpha can be used as it
is one of the most frequently reported internal consistency
estimates (Brown, 2002). According to Shergill et al. (2005), the
nearer the reliability coefficient to value of 1, the better the
reliability measures it is. The construct are said to be reliable when
the Cronbach’s Alpha for the model constructs are at or above the
recommended threshold of 0.7 (Chan et al., 2010).
3.6.2.2 Normality Test
Besides, normality test is needed to be conducted to ensure that
samples are normally distributed. This study has a sample size of
500, which is large enough to employ Central Limit Theorem.
Therefore, the data should be normally distributed (Alam & Yasin,
2009).
3.7.3 Inferential Analysis
Inferential analysis is conducted to project the characteristics from a
sample to entire population (Zikmund et al., 2010).

Perceived Benefits and Online Shopping Decisions
Page 28 of 102
3.7.3.1 Pearson’s Correlation Analysis
A correlation analysis is conducted to investigate the specific
hypothesis about whether a certain variable affects dependent
variable. It is also used to explore the magnitude of the influence
towards the dependent variable (Cao et al., 2005). Thus, Pearson
Correlation is used in this study as this correlation test is able to
express the strength of the relationship between variables.
3.7.3.2 Multiple Regression Analysis
There is a need to conduct a multiple regression test to measure the
relationship between several independent variables and the
dependent variable (Delafrooz et al., 2010). To test the hypothesis,
the independent variable is said to have relationship with
dependent variable when the p-value of regression coefficient is
less than the significant level of 0.05. Otherwise, there is no
relationship between variables (Chan et al., 2010).
3.8 Conclusion
In conclusion, this is a quantitative study and a cross sectional study. The
population in this research is undergraduates of private universities in Malaysia
while 500 undergraduates between the ages of 18 to 26 from top ten local and
international private universities in Malaysia is the sample chosen. Quota
sampling of is used. Primary data collection method in the form of self-
administrated questionnaire is conducted to collect data from the target
respondents. Each independent variable is measured by five or six items and rated
by five-point Likert’s scale. Descriptive analysis and inferential analysis are used
in this research. These will be discussed further in next chapter.
Perceived Benefits and Online Shopping Decisions
Page 29 of 102
CHAPTER 4: DATA ANALYSIS
4.0 Introduction
Data of this research are collected by using methods stated in previous chapter. In
this chapter, data are analysed according to analysis techniques stated in previous
chapter. The discussion in this chapter includes descriptive analysis (demographic
profile of the respondents and central tendencies measurement of constructs),
scale measurement (internal consistency reliability test and normality test), and
inferential analysis (Pearsons’ correlation analysis and multiple regression
analysis).
4.1 Descriptive analysis
4.1.1 Demographic Profile of the Respondents
In the questionnaire survey, there are several questions raised for each
respondent. These are gender, age, ethic group, university, and field of
study and also the experience of online shopping. In this part, it provides
analysis on the respondent demographic profile based on frequencies.

Perceived Benefits and Online Shopping Decisions
Page 30 of 102
4.1.1.1 Age
Table 4.1: Age of the Respondents
Frequency Percent Valid Percent
Cumulative
Percent
Valid 18-20 166 33.2 33.2 33.2
21-23 306 61.2 61.2 94.4
24-26 28 5.6 5.6 100.0
Total 500 100.0 100.0
Source: Data developed for research
Figure 4.1 Age of the Respondents
Source: Data developed for research
Table 4.1 shown presents the analysis of the age group of 500
respondents. Among the 500 undergraduates, 306 undergraduates
fall under the age group of 21-23. This means that a majority of
61.20% of the undergraduates are under age 21-23. Next, the age
group that has a significant number of undergraduates is 18-20. In
this age group, it has a total number of 166 undergraduates. In
33.20%
61.20%
5.60%
Age
18-20
21-23
24-26

Perceived Benefits and Online Shopping Decisions
Page 31 of 102
other words, 33.20% of the undergraduates represent the age group
of 18-20. Nevertheless, there is a small portion of undergraduates
fall under the age group of 24-26 which is 5.6% or 24
undergraduates. Hence, majority of the undergraduates
(respondents) fall under the age group of 21-23 as the common age
of fresh graduates are within this range.

Perceived Benefits and Online Shopping Decisions
Page 32 of 102
4.1.1.2 Gender
Table 4.2: Gender of the Respondents
Frequency Percent Valid Percent
Cumulative
Percent
Valid Male 216 43.2 43.2 43.2
Female 284 56.8 56.8 100.0
Total 500 100.0 100.0
Source: Data developed for research
Figure 4.2 Gender of the Respondents
Source: Data developed for research
Table 4.2 presents the composition of gender among 500
respondents. Firstly, 284 out of 500 respondents are female
undergraduates. This comprises 57% of the respondents. On the
other hand, male respondents comprise 43% of it. In other words,
there are 216 male undergraduates.
43%
57%
Gender
male
female

Perceived Benefits and Online Shopping Decisions
Page 33 of 102
4.1.1.3 Ethnic Group
Table 4.3: Ethnic groups of the Respondent
Frequency Percent Valid Percent
Cumulative
Percent
Valid Malay 136 27.2 27.2 27.2
Chinese 260 52.0 52.0 79.2
Indian 62 12.4 12.4 91.6
Others 42 8.4 8.4 100.0
Total 500 100.0 100.0
Source: Data developed for research
Figure 4.3 Ethnic Groups of the Respondents
Source: Data developed for research
In table 4.3, it shows that most of the respondents are Chinese
which comprises 52% or 260 respondents, followed by Malay, 27.2%
or 136 respondents; Indian ,12.4% or 62 respondents and other
ethnic groups ,8.4% 42 respondents. From the survey, some ethnic
27.20%
52%
12.40%8.40%
Ethnic group
Malay
Chinese
Indian
Others

Perceived Benefits and Online Shopping Decisions
Page 34 of 102
group such as Iban, Kadazan, Punjabi and others are identified and
categorized under other ethnic groups.

Perceived Benefits and Online Shopping Decisions
Page 35 of 102
4.1.1.4 University
Table 4.4: Universities of the Respondents
Frequency Percent
Valid
Percent
Cumulative
Percent
Valid MMU 50 10.0 10.0 10.0
UNiTEN 50 10.0 10.0 20.0
OUM 50 10.0 10.0 30.0
UNM 50 10.0 10.0 40.0
UTP 50 10.0 10.0 50.0
TAYLOR 50 10.0 10.0 60.0
UTAR 50 10.0 10.0 70.0
UniTAR 50 10.0 10.0 80.0
MONASH 50 10.0 10.0 90.0
UNISEL 50 10.0 10.0 100.0
TOTAL 500 100.0 100.0
Source: Data developed for research
Figure 4.4: Universities of the Respondents
Source: Data developed for research
50
50
50
50
5050
50
50
50
50
UniversityMMU
UNiTEN
OUM
UNM
UTP
TAYLOR
UTAR
UniTAR
MONASH
UNISEL

Perceived Benefits and Online Shopping Decisions
Page 36 of 102
Table 4.4 shows the proportion of the respondents selected from
ten targeted universities. The ten targeted universities are
Multimedia University (MMU), University Tenaga National
(UNiTEN), Open University Malaysia (OUM), University of
Nottingham Malaysia (UNM), University Teknologi PETRONAS
(UTP), Taylor’s University College (TAYLOR), University of
Tunku Abdul Rahman (UTAR), Univesity of Tun Abdul Razak
(UniTAR), Monash University Malaysia (MONASH), Universiti
Industri Selangor (UNISEL). 50 undergraduates are selected evenly
from each of these universities to carry out the survey. The total
number of respondents selected to complete the survey is 500
respondents.

Perceived Benefits and Online Shopping Decisions
Page 37 of 102
4.1.1.5 Field of Study
Table 4.5: Field of Study of the Respondents
Frequency Percent
Valid
Percent
Cumulative
Percent
Valid Business 241 48.2 48.2 48.2
Engineering 128 25.6 25.6 73.8
Social Science 15 3.0 3.0 76.8
Science 41 8.2 8.2 85.0
Arts&design 17 3.4 3.4 88.4
Language 8 1.6 1.6 90.0
Others 50 10.0 10.0 100.0
Total 500 100.0 100.0
Source: Data developed for research
Figure 4.5 Field of Study of the Respondents
Source: Data developed for research
48.20%25.60%
3.00%
8.20%
3.40%1.60%
10%
Field Business
Engineer
ingSocial
ScienceScience
Arts
&DesignLanguag
eOthers

Perceived Benefits and Online Shopping Decisions
Page 38 of 102
In the questionnaire, question 5 is asked to identify the field that
each respondent is enrolled to. The fields that are stated in the
questionnaire are business, engineering, social sciences, sciences,
arts and design, language and linguistics and also others. Business
course is identified as the field of study that majority of the
respondents are enrolled to. It comprises of 48.2% (241
respondents).
Next, engineering course is ranked second with 25.6% (128
respondents), followed by courses that are categorized as others
with 10% (50 respondents). Courses that are categorized as others
are Public Relations, Hotel Management, and others that are not
stated in the questionnaire.
The next field of study that is ranked third is science courses (8.2%
or 41 respondents); followed by arts and design (3.4% or 17
respondents), social science (3% or 15 respondents) and last but
not least language and linguistic (1.6% or 8 respondents).

Perceived Benefits and Online Shopping Decisions
Page 39 of 102
4.1.1.6 Online Shopping Experience
Table 4.6: Online Shopping Experience of the Respondents
Frequency Percent
Valid
Percent
Cumulative
Percent
Valid Never 181 36.2 36.2 36.2
1-5 times 226 45.2 45.2 81.4
6-10 times 38 7.6 7.6 89.0
11-15 times 11 2.2 2.2 91.2
16 times and above 44 8.8 8.8 100.0
Total 500 100.0 100.0
Source: Data developed for research
Figure 4.6: Online Shopping Experience of the Respondents
Source: Data developed for research
From the survey, the online shopping experiences of the
respondents are identified. Majority of the respondents have the
experience of shopping online. This is because 45.2% or 226
36.2%
45.2%
7.6%
2.2%
8.8%
Online shopping experience
Never
1-5 times
6-10 times
11-
15times
16 times
and above

Perceived Benefits and Online Shopping Decisions
Page 40 of 102
respondents have at least 1 -5 times of online shopping experience
followed by 8.8% or 44 respondents have shop online for more
than 16 times.
Next, 7.6% or 38 respondents also have shop online for 6-10 times
and likewise, 2.2% or 11 respondents have 11-15 times of online
shopping experience. In total, 63.8% of the respondents have the
experience of online shopping. In other words, 319 respondents
have shop online before.
Nevertheless, there are 36.2% or 181 respondents do not shop
online before.

Perceived Benefits and Online Shopping Decisions
Page 41 of 102
4.1.2 Central Tendencies Measurement of Constructs
A total of 38 items (questions) with particular mean score and standard
deviation were obtained from the SPSS output. All of the items/questions
are being asked using 5-point Likert scale with 1 indicating Strongly
Disagree, 2 indicating Disagree, 3 indicating Neutral, 4 indicating Agree,
and 5 indicating Strongly Agree.

Table 4.7: Central Tendencies Measurement of Constructs: Webpage Design
Source: Data Developed for research
Items Description SD D N A SA Mean Standard
Deviation
WD1 I prefer to purchase from Websites which are user
friendly. 3.2% 7.2% 30% 35.2% 24.4% 3.70 1.017
WD2
I prefer to purchase from Websites with great
functionality (payment option, product filter option,
product customization, etc.)
2.4% 8.0% 24.2% 42% 23.4% 3.76 0.978
WD3 I prefer to purchase from Websites that are updated
frequently. 2.0% 6.4% 17.8% 44.2% 29.6% 3.93 0.952
WD4 I prefer to purchase from Websites that provide
detailed product information. 2.0% 4.0% 13.0% 38.8% 42.2% 4.15 0.933
WD5
Websites which display products by pictures and
purchase button together will make my shopping
easier.
2.4% 3.4% 17.2% 38.8% 38.2% 4.07 0.950
WD6 I prefer to purchase from Websites with attractive
design. 3.2% 8.8% 29.0% 36.4% 22.6% 3.66 1.022
Perceiv
ed B
enefits an
d O
nlin
e Sh
op
pin
g D
ecision
s
Pag
e 42
of 1
02

Perceived Benefits and Online Shopping Decisions
Page 43 of 102
Table 4.7 presents the percentage, mean, standard deviation for each of the
item for webpage design.
Majority of the respondents (59.6%) agreed with item WD1, while 30%
are neutral with the statement. Secondly, 65.4% of the respondents agreed
with WD2 whereas 10.4 % of the respondents disagreed with the statement.
There are 30% of the undergraduates standing neutral in position.
For WD3, 73.8% agreed with the statement and 8.4% does not stand with
the statement. 81% of the sample agreed that they would like to purchase
from Website that provides detailed product information. 6.0% of it did
not agreed with the statement. In addition, 13% of the target respondents
stayed neutral.
77% of the target respondents agreed that display product pictures and
purchase button together make their shopping easier. However, 5.6% of
the undergraduates did not agree with it and 17.2% of the undergraduates
remain neutral. Lastly, 59% of the sample likes to purchase Websites with
attractive design whereas 12% do not prefer to purchase from attractive
Website. 29% of the undergraduates are neutral with the statement.
The item with the highest mean is WD4 (4.15). The item ranked second is
WD5, with 4.07, followed by WD3 which has a mean record of 3.93. The
next item is WD2 with mean record of 3.76, followed by WD1 with the
mean of 3.70. WD6 has the lowest mean, which is 3.66.
The item with the highest standard deviation is WD6, with 1.022. WD1
has the second highest standard deviation, 1.017. The item with the lowest
standard deviation is WD4, with 0.933.

Table 4.8: Central Tendencies Measurement of Constructs: Product Choice
Source: Data Developed for research
Items Description SD D N A SA Mean Standard
Deviation
PC1 Selection of goods available on the internet is very
broad. 1.2% 5.2% 28.4% 41.6% 23.6% 3.81 0.896
PC2 I will be able to access many brands and retailers
when I shop online. 1.8% 11.2% 27.2% 39.6% 20.2% 3.65 0.982
PC3 Items from different countries are easily available. 2.0% 8.4% 30.8% 39.2% 19.6% 3.66 0.952
PC4 Online shopping allows inter-comparable information. 0.8% 5.0% 25.6% 46.0% 22.6% 3.85 0.855
PC5 I can get specialized products through online
shopping. 1.6% 6.0% 29.4% 42.4% 20.6% 3.74 0.906
Perceiv
ed B
enefits an
d O
nlin
e Sh
op
pin
g D
ecision
s
Pag
e 44
of 1
02

Perceived Benefits and Online Shopping Decisions
Page 45 of 102
Table 4.8 shows the percentage, mean, standard deviation for each of the
item for product choice.
For PC1, 65.2% of the undergraduates agreed with the statement while 6.4%
of them do not agree with the statement. 59.8% of the sample group agreed
with PC2 whereas 13% disagreed with it. 58.8% of the sample group has
the same opinion as PC3 while 10.4% of the sample group disagreed with
it. 68.6% of the respondents agreed with PC4 while 5.8% does not have
the same opinion. Lastly, 63% of the respondents agreed with PC5 while
there is 7.6% of the respondents do not agreed with it.
PC4 has the highest mean value (3.85) and is followed by PC1 (3.81). PC2
has the lowest mean, which is 3.65. Furthermore, PC2 also has the highest
standard deviation, which is 0.982. PC3 (0.952) has the second highest
standard deviation. The item with the lowest standard deviation value is
PC1, which is 0.896.

Table 4.9: Central Tendencies Measurement of Constructs: Price
Source: Data Developed for research
Items Description SD D N A SA Mean Standard
Deviation
PR1 I will prefer online shopping only if online prices are
lower. 37.2% 34.6% 20.8% 6.2% 1.2% 2.00 0.968
PR2 I believe that online retailers always offer the lowest
price. 11.0% 24.0% 37.6% 23.0% 4.4% 2.86 1.033
PR3 I pay a lot of attention to prices. 40.6% 36.2% 18.0% 4.2% 1.0% 1.89 0.913
PR4 I shop a lot for special deals. 20.0% 32.6% 32.0% 12.6% 2.8% 2.46 1.035
PR5 It is easy to compare prices from different online
retailers. 20.4% 44.2% 26.4% 8.2% 0.8% 2.25 0.899
PR6 Online shopping allows ones to look for the best price
before purchasing. 21.4% 46.6% 24.8% 5.8% 1.4% 2.19 0.886
Perceiv
ed B
enefits an
d O
nlin
e Sh
op
pin
g D
ecision
s
Pag
e 46
of 1
02
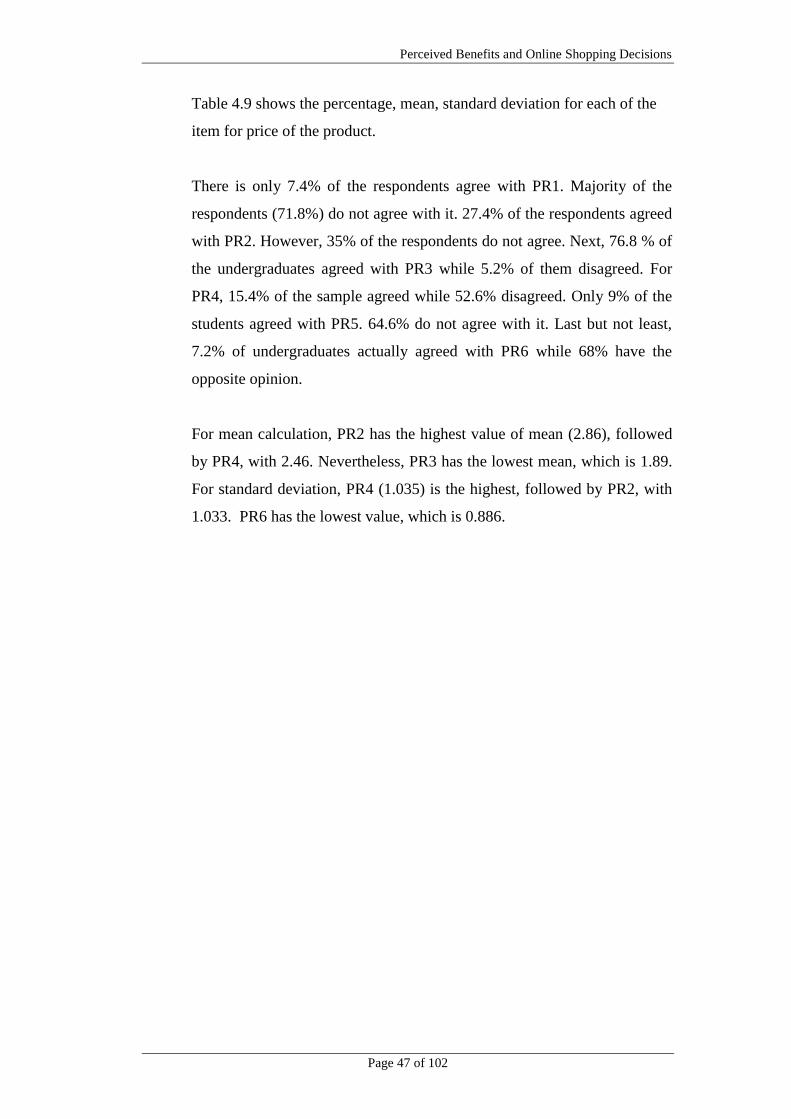
Perceived Benefits and Online Shopping Decisions
Page 47 of 102
Table 4.9 shows the percentage, mean, standard deviation for each of the
item for price of the product.
There is only 7.4% of the respondents agree with PR1. Majority of the
respondents (71.8%) do not agree with it. 27.4% of the respondents agreed
with PR2. However, 35% of the respondents do not agree. Next, 76.8 % of
the undergraduates agreed with PR3 while 5.2% of them disagreed. For
PR4, 15.4% of the sample agreed while 52.6% disagreed. Only 9% of the
students agreed with PR5. 64.6% do not agree with it. Last but not least,
7.2% of undergraduates actually agreed with PR6 while 68% have the
opposite opinion.
For mean calculation, PR2 has the highest value of mean (2.86), followed
by PR4, with 2.46. Nevertheless, PR3 has the lowest mean, which is 1.89.
For standard deviation, PR4 (1.035) is the highest, followed by PR2, with
1.033. PR6 has the lowest value, which is 0.886.

Table 4.10: Central Tendencies Measurement of Constructs: Convenience
Source: Data Developed for research
Items Description SD D N A SA Mean Standard
Deviation
CN1 I don’t have to leave home for shopping. 4.6% 10.4% 21.4% 35.0% 28.6% 3.73 1.121
CN2 I can shop whenever I want. 1.0% 6.8% 21.0% 42.8% 28.4% 3.91 0.922
CN3 I can save the effort of visiting stores. 2.6% 7.0% 23.6% 38.8% 28.0% 3.83 1.001
CN4 I can shop in the privacy of home. 2.0% 6.0% 25.0% 38.4% 28.6% 3.86 0.968
CN5 Shopping over the Web would allow me to do my
shopping more quickly. 4.4% 13.0% 25.2% 38.2% 19.2% 3.55 1.076
CN6 I can use online shopping Website to search for
product information. 1.0% 6.0% 23.0% 44.0% 26.0% 3.88 0.898
Perceiv
ed B
enefits an
d O
nlin
e Sh
op
pin
g D
ecision
s
Pag
e 48
of 1
02

Perceived Benefits and Online Shopping Decisions
Page 49 of 102
Table 4.10 shows the percentage, mean, standard deviation for each of the
item for convenience.
63.6% of the undergraduates agreed with CN1 while 15% of the
undergraduates do not agree with the statement. There are 71.2% of
targeted respondents agreed that they can shop whenever they want while
only 7.8% do not agree with the statement. In addition, 66.8% of the
respondents have the same opinion that online shopping save the effort of
visiting stores while 9.6% of the respondents do not agreed with it. Next,
67% of our sample group agreed that online shopping enable them to shop
in the privacy of home while 8% of the sample opposes the statement. 57.4%
of the sample has the opinion that shopping over the Web allows them to
do shopping more quickly whereas 17.4% do not has the same opinion.
Lastly, 70% of the respondents said that they can use online shopping
Website to search for product information while 7% did not agree.
CN2 has the highest mean value, which is 3.91, followed by CN6, which is
3.88. Nevertheless, CN5 (3.55) has the lowest mean value. CN1 has the
highest standard deviation, which is 1.121 while the item that has the
lowest standard deviation is CN6, with 0.898.

Table 4.11: Central Tendencies Measurement of Constructs: Customer Service
Source: Data Developed for research
Items Description SD D N A SA Mean Standard
Deviation
CS1
Greater value-added services (pre-sales service, post-
sales service) provided on the Websites would attract
me to shop online.
1.2% 8.8% 36.2% 38.0% 15.8% 3.58 0.899
CS2 I will purchase products/services online, if it is easy to
make changes even after I made the payment. 1.0% 9.6% 27.0% 39.8% 22.6% 3.73 0.949
CS3 I can find specific person or group for help when I
have difficulties in the online shopping Website. 3.6% 16.0% 35.8% 33.8% 10.8% 3.32 0.986
CS4 Online shopping would provide me with a timely
response to my request. 2.0% 14.2% 39.4% 30.8% 13.6% 3.40 0.958
CS5 I prefer Website with customer support such as e-form
inquiry, order status tracing and customer comment. 1.0% 5.0% 29.2% 39.0% 25.8% 3.84 0.903
Perceiv
ed B
enefits an
d O
nlin
e Sh
op
pin
g D
ecision
s
Pag
e 50
of 1
02

Perceived Benefits and Online Shopping Decisions
Page 51 of 102
Table 4.11 shows the percentage, mean, standard deviation for each of the
item for customer service.
A total percentage of 53.8% of undergraduates agreed with greater value-
added services provided on the Websites would attract them to shop online
while 10% has the opposite opinion. 62.4% of undergraduates have the
opinion that they will purchase products/services online, if it is easy to
make changes even after payment while 10.6% of it does not. 44.6% of the
respondents agreed that they can find specific person or group for help
when I have difficulties in the online shopping Website while 19.6% of the
respondents do not agree. Next, 44.4% of the respondents agree that online
shopping would provide a timely response to their request. On the other
hand, 16.2% of the respondents do not agree. A majority of 64.8% of the
respondents prefer Website with customer support such as e-form inquiry,
order status tracing and customer comment while only 6% of it do not has
the same opinion.
Item CS5 has the highest mean value, which is 3.84, followed by item CS2,
which is 3.73. However, CS3 has the lowest mean value (3.32).
Meanwhile, CS3 has the highest standard deviation, which is 0.986
whereas CS1 has the lowest standard deviation, which is 0.899.

Table 4.12: Central Tendencies Measurement of Constructs: Product Quality
Source: Data Developed for research
Items Description SD D N A SA Mean Standard
Deviation
PQ1 It is important to ensure quality of product. 1.8% 4.4% 11.4% 31.8% 50.6% 4.25 0.947
PQ2 I will purchase online from Websites that offer quality
products or services. 1.0% 2.4% 17.6% 38.4% 40.6% 4.15 0.864
PQ3 A well-known brand implies good quality. 2.2% 10.4% 28.8% 34.6% 24.0% 3.68 1.020
PQ4 I believe that I can get quality products through online
shopping. 3.8% 18.0% 43.2% 23.8% 11.2% 3.21 0.989
PQ5
I believe that the product features shown on the
Website are the same with real products that I
purchase online.
8.2% 23.4% 36.8% 22.4% 9.2% 3.01 1.075
Perceiv
ed B
enefits an
d O
nlin
e Sh
op
pin
g D
ecision
s
Pag
e 52
of 1
02

Perceived Benefits and Online Shopping Decisions
Page 53 of 102
Table 4.12 shows the percentage, mean, standard deviation for each of the
item for product quality.
A majority of 82.4% of the respondents supports the statement “It is
important to ensure quality of product.” while only 6.2% of the
respondents do not support the statement. 79% of the respondents agreed
that they will purchase online from Websites that offer quality products or
service while 3.4% do not agree. Subsequently, there are 58.6% of the
respondents agreed with the statement “A well-known brand implies good
quality” whereas there is 12.6% of the respondents do not agree with it. 35%
of the respondents believe that they can get quality products through
online shopping while 21.8% of the respondents do not have the same
opinion. Last but not least, 31.6% of the respondents believe that the
product features shown on the Website are the same with real products that
I purchase online while 31.6% of the group has the opposite opinion.
PQ1 has the highest mean, which is 4.25. It is followed by item PQ2 which
achieved 4.15. PQ5 has the lowest mean, which is 3.01. PQ5 also has the
highest standard deviation (1.075) while the item with the lowest standard
deviation is PQ2, which is 0.864.

Table 4.13: Central Tendencies Measurement of Constructs: Online Shopping Decision
Source: Data Developed for research
Items Description SD D N A SA Mean Standard
Deviation
OS1 Online shopping is different from traditional shopping. 1.0% 2.2% 19.8% 47.4% 29.6% 4.02 0.820
OS2
If I heard a new product that I am interested in is
available over the Internet, I would be interested to
buy it.
1.8% 9.4% 33.6% 40.6% 14.6% 3.57 0.914
OS3 I intend to purchase goods on the Internet. 3.4% 15.85 44.25 26.0% 10.6% 3.25 0.959
OS4 The possibility that I will purchase goods on the
Internet in the future is high. 4.6% 10.8% 38.6% 31.8% 14.2% 3.40 1.009
OS5 I prefer online shopping than traditional shopping. 12.0% 21.0% 41.0% 16.8% 9.2% 2.90 1.104
Perceiv
ed B
enefits an
d O
nlin
e Sh
op
pin
g D
ecision
s
Pag
e 54
of 1
02

Perceived Benefits and Online Shopping Decisions
Page 55 of 102
Table 4.13 shows the percentage, mean, standard deviation for each of the
item for online shopping decision.
A total of 77% of the sample group has the opinion that online shopping is
different from traditional shopping whereas there is only 3.2% of the group
does not have the same opinion. There is 55.2% of the group agreed with
the statement “If I heard a new product that I am interested in is available
over the Internet, I would be interested to buy it”. On the other hand, 11.2%
of the group does not agree with it. Next, 36.6% of the respondents have
the intention to purchase goods on the Internet while 19.25% of the group
does not. Furthermore, 46% agreed that the possibility that they will
purchase goods on the Internet in the future is high while 15.4% do not
agree. Last but not least, there are 26% of the respondents prefer online
shopping compare to traditional shopping whereas 33% of the respondents
prefer traditional shopping compare to online shopping.
OS1 has the highest mean, 4.02 and is followed by item OS2, which is
3.57. The item OS5 has the lowest mean value, which is 2.90. In addition,
referring to the same item, it has the highest standard deviation, which is
1.104. Nevertheless, item OS1 has the lowest standard deviation (0.820).

Perceived Benefits and Online Shopping Decisions
Page 56 of 102
4.2 Scale Measurement
4.2.1 Internal Consistency Reliability Test
Table 4.14: Internal Consistency Reliability Test
Variables Cronbach’s Alpha N of items
Webpage Design 0.865 6
Product Choices 0.791 5
Prices 0.707 6
Convenience 0.855 6
Customer Service 0.728 5
Product Quality 0.703 5
Online Shopping Decision 0.780 5
Source: Data developed for research
Reliability test was conducted to test the internal consistency of the data.
According to Chan et al. (2010), when the Cronbach’s Alpha for a variable
is more than 0.7, the data is said to be reliable. The result of reliability test
was recorded in table 4.14.
The variable of Webpage design is measured by 6 items and has a
Cronbach’s Alpha of 0.865. Measured by 5 items, the variable of product
choices has a Cronbach’s Alpha of 0.791. The variable of prices a
Cronbach’s Alpha of 0.707 and is measured by 6 items. The variable of
convenience, which is also measured by 6 items, has a Cronbach’s Alpha
of 0.855. Each measured by 5 items, the variables of customer service and
product quality have Cronbach’s Alpha of 0.728 and 0.703 respectively.
Finally, the dependent variable, online shopping decision, has a
Cronbach’s Alpha of 0.780, is measured by 5 items.

Perceived Benefits and Online Shopping Decisions
Page 57 of 102
The Cronbach’s Alpha of all the six independent variables and the
dependent variables are more than 0.7. In other words, the data collected
for all these variables are reliable.
4.2.2 Normality Test
Table 4.15: Normality Test: Descriptives
Statistic Std. Error
OS Mean 3.4284 .03150
95% Confidence
Interval for Mean
Lower Bound 3.3665
Upper Bound 3.4903
5% Trimmed Mean 3.4320
Median 3.4000
Variance .496
Std. Deviation .70435
Minimum 1.40
Maximum 5.00
Range 3.60
Interquartile Range 1.00
Skewness -.039 .109
Kurtosis -.116 .218
Source: Data developed for research
According to Zhang(2000), Kaynak (2003), and Jun, Cai, and Shin (2006),
the data is said to be normally distributed when the skewness and kurtosis
score of all variables do not exceed the value of ±1 (as cited in Sit, Ooi,
Lin, & Chong, 2009). From table 4.15, the skewness score (-0.039) and
kurtosis score (-0.116) did not exceed the value of ±1. Thus, the data of
this research is said to be normally distributed.

Perceived Benefits and Online Shopping Decisions
Page 58 of 102
Besides that, Alam et al. (2009) stated that according to Central Limit
Theorem, regardless of the distribution of population, the distribution of
sample is assumed to be approximately normal when the sample size is
large enough. They further suggested that a sample size of more than 30
samples is large enough for such an assumption.
In this research, the sample size is 500. According to Central Limit
Theorem, sample size of 500 is large enough to make an assumption that
this sample is normally distributed.

Perceived Benefits and Online Shopping Decisions
Page 59 of 102
4.3 Inferential Analysis
4.3.1 Pearson’s Correlation Analysis
Table 4.16: Correlations between Independent Variables
and Dependent Variable
WD PC PR CN CS PQ OS
WD Pearson Correlation 1
Sig. (2-tailed)
N 500
PC Pearson Correlation .508**
1
Sig. (2-tailed) .000
N 500 500
PR Pearson Correlation -.456**
-.462**
1
Sig. (2-tailed) .000 .000
N 500 500 500
CN Pearson Correlation .462**
.464**
-.500**
1
Sig. (2-tailed) .000 .000 .000
N 500 500 500 500
CS Pearson Correlation .492**
.499**
-.509**
.531**
1
Sig. (2-tailed) .000 .000 .000 .000
N 500 500 500 500 500
PQ Pearson Correlation .384**
.348**
-.406**
.435**
.510**
1
Sig. (2-tailed) .000 .000 .000 .000 .000
N 500 500 500 500 500 500
OS Pearson Correlation .378**
.362**
-.456**
.509**
.503**
.504**
1
Sig. (2-tailed) .000 .000 .000 .000 .000 .000
N 500 500 500 500 500 500 500
**. Correlation is significant at the 0.01 level (2-tailed).
Source: Data developed for research

Perceived Benefits and Online Shopping Decisions
Page 60 of 102
According to Harber, Marriott, and Idrus (1991), multicollinearity occurs
when a score of 0.8 is achieved for a bivariate correlation.
In this research, the correlations between each variable are tested by
conducting Pearson’s correlation test in SPSS 16.0. Results of the test are
shown in table 4.16. The correlations between Webpage design and
product choice (0.508), price (0.456), convenience (0.462), customer
service (0.492), product quality (0.384), and online shopping decision
(0.378) are below 0.8. The construct of product choice has correlation of
less than 0.8 with price (0.462), convenience (0.464), customer service
(0.492), product quality (0.348), and online shopping decision (0.362). The
correlation of price with convenience (0.500), customer service (0.509),
product quality (0.406), and online shopping decision (0.456) are also
below 0.8. Convenience also has correlation of lower than 0.8 with
customer service (0.531), product quality (0.435), and online shopping
decision (0.509). The correlation of customer service with product quality
(0.510) and online shopping decision (0.503) are below 0.8. Lastly, the
correlation of product quality and online shopping decision is 0.504, which
is below 0.8. The negative sign of the correlation is ignored in this
situation as the direction of relation is not important here.
In conclusion, the correlations among all independent variables are below
the level of 0.8. Multicollinearity problem does not occur in this research.

Perceived Benefits and Online Shopping Decisions
Page 61 of 102
4.3.2 Multiple Regression Analysis
Multiple Regression test is conducted by using SPSS 16.0. The results are
shown in table 4.17, table 4.18, and table 4.19.
Table 4.17: Multiple Regression Test: Model Summary
Model Summaryb
Model R R Square Adjusted R Square
Std. Error of
the Estimate
1 .634a .402 .395 .54791
a. Predictors: (Constant), Webpage Design, Product Choice,
Price, Convenience, Customer Service, Product Quality
b. Dependent Variable: Online Shopping Decision
Source: Data developed for research
Table 4.17 indicates that the value of R Square of the six independent
variables (Webpage design, product choice, price, convenience, customer
service, and product quality) is 0.402. The value of 0.402 indicates that the
six independent variables can explain 40.2% of the variation of the
dependent variable (online shopping decision). However, there is 59.8% of
variation of the dependent variable left unexplained in this research. In
other words, based on valence framework, the factor of perceived risks and
some other elements of perceived benefits also contribute in explaining
online shopping decision, which are not considered in this research.

Perceived Benefits and Online Shopping Decisions
Page 62 of 102
Table 4.18: Multiple Regression Test: ANOVA
ANOVAb
Model Sum of Squares df Mean Square F Sig.
1 Regression 99.558 6 16.593 55.273 .000a
Residual 147.999 493 .300
Total 247.557 499
a. Predictors: (Constant), Webpage Design, Product Choice,
Price, Convenience, Customer Service, Product Quality
b. Dependent Variable: Online Shopping Decision
Source: Data developed for research
From table 4.18, the p-value of 0.000 in this research is less than alpha
value of 0.05. This means that as a whole, the relationship between
independent variables (Webpage design, product choice, price,
convenience, customer service, and product quality) and dependent
variable (online shopping decision) in this research is significant.
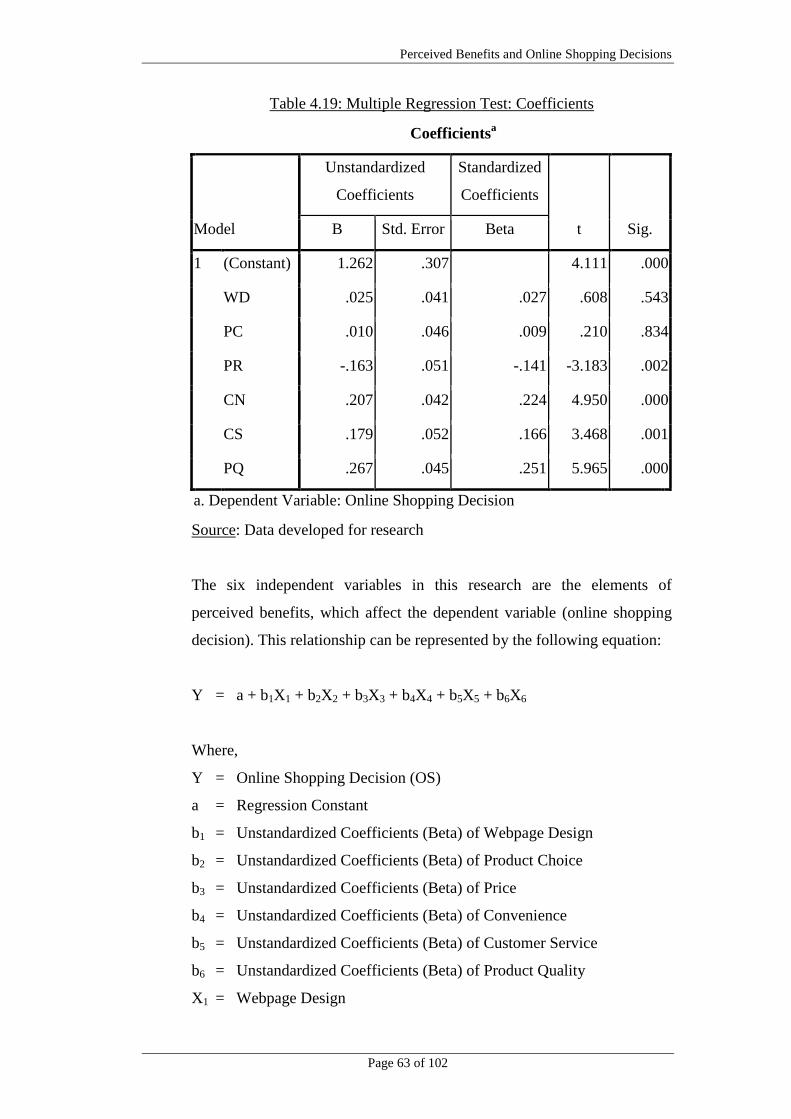
Perceived Benefits and Online Shopping Decisions
Page 63 of 102
Table 4.19: Multiple Regression Test: Coefficients
Coefficientsa
Model
Unstandardized
Coefficients
Standardized
Coefficients
t Sig. B Std. Error Beta
1 (Constant) 1.262 .307 4.111 .000
WD .025 .041 .027 .608 .543
PC .010 .046 .009 .210 .834
PR -.163 .051 -.141 -3.183 .002
CN .207 .042 .224 4.950 .000
CS .179 .052 .166 3.468 .001
PQ .267 .045 .251 5.965 .000
a. Dependent Variable: Online Shopping Decision
Source: Data developed for research
The six independent variables in this research are the elements of
perceived benefits, which affect the dependent variable (online shopping
decision). This relationship can be represented by the following equation:
Y = a + b1X1 + b2X2 + b3X3 + b4X4 + b5X5 + b6X6
Where,
Y = Online Shopping Decision (OS)
a = Regression Constant
b1 = Unstandardized Coefficients (Beta) of Webpage Design
b2 = Unstandardized Coefficients (Beta) of Product Choice
b3 = Unstandardized Coefficients (Beta) of Price
b4 = Unstandardized Coefficients (Beta) of Convenience
b5 = Unstandardized Coefficients (Beta) of Customer Service
b6 = Unstandardized Coefficients (Beta) of Product Quality
X1 = Webpage Design

Perceived Benefits and Online Shopping Decisions
Page 64 of 102
X2 = Product Choice
X3 = Price
X4 = Convenience
X5 = Customer Service
X6 = Product Quality
Based on table 4.19, the regression equation for online shopping decision
is as below:
OS = 1.262 + 0.025(WD) + 0.010(PC) – 0.163(PR) + 0.207(CN)
+ 0.179(CS) + 0.267(PQ)
Where,
OS = Online Shopping Decision
WD = Webpage Design
PC = Product Choice
PR = Price
CN = Convenience
CS = Customer Service
PQ = Product Quality
From the results in table 4.19, product quality has the most significant
relationship with online shopping decision, as the unstandardized
coefficients (Beta) of product quality (0.267) is the highest among all
independent variables.

Perceived Benefits and Online Shopping Decisions
Page 65 of 102
Hypothesis 1
H0 : There is no significant relationship between Webpage design and
undergraduates’ online shopping decision.
H1 : There is a significant relationship between Webpage design and
undergraduates’ online shopping decision.
Based on the results shown in table 4.19, the p-value of Webpage design
(0.543) is more than the alpha value of 0.05. Therefore, null hypothesis
(H0) is not rejected. Alternative hypothesis (H1) is rejected. In conclusion,
there is no significant relationship between Webpage design and
undergraduates’ online shopping decision.
Hypothesis 2
H0 : There is no significant relationship between product choices and
undergraduates’ online shopping decision.
H1 : There is a significant relationship between product choices and
undergraduates’ online shopping decision.
Based on the results shown in table 4.19, the p-value of product choices
(0.834) is more than the alpha value of 0.05. Therefore, null hypothesis
(H0) is not rejected. Alternative hypothesis (H1) is rejected. In conclusion,
there is no significant relationship between product choices and
undergraduates’ online shopping decision.

Perceived Benefits and Online Shopping Decisions
Page 66 of 102
Hypothesis 3
H0 : There is no significant relationship between prices and
undergraduates’ online shopping decision.
H1 : There is a significant relationship between prices and
undergraduates’ online shopping decision.
Based on the results shown in table 4.19, the p-value of prices (0.002) is
more than the alpha value of 0.05. Therefore, null hypothesis (H0) is
rejected. Alternative hypothesis (H1) is accepted. In conclusion, there is a
significant relationship between prices and undergraduates’ online
shopping decision.
Hypothesis 4
H0 : There is no significant relationship between convenience and
undergraduates’ online shopping decision.
H1 : There is a significant relationship between convenience and
undergraduates’ online shopping decision.
Based on the results shown in table 4.19, the p-value of convenience
(0.000) is more than the alpha value of 0.05. Therefore, null hypothesis
(H0) is rejected. Alternative hypothesis (H1) is accepted. In conclusion,
there is a significant relationship between convenience and undergraduates’
online shopping decision.

Perceived Benefits and Online Shopping Decisions
Page 67 of 102
Hypothesis 5
H0 : There is no significant relationship between customer service and
undergraduates’ online shopping decision.
H1 : There is a significant relationship between customer service and
undergraduates’ online shopping decision.
Based on the results shown in table 4.19, the p-value of customer service
(0.001) is more than the alpha value of 0.05. Therefore, null hypothesis
(H0) is rejected. Alternative hypothesis (H1) is accepted. In conclusion,
there is a significant relationship between customer service and
undergraduates’ online shopping decision.
Hypothesis 6
H0 : There is no significant relationship between product quality and
undergraduates’ online shopping decision.
H1 : There is a significant relationship between product quality and
undergraduates’ online shopping decision.
Based on the results shown in table 4.19, the p-value of product quality
(0.000) is more than the alpha value of 0.05. Therefore, null hypothesis
(H0) is rejected. Alternative hypothesis (H1) is accepted. In conclusion,
there is a significant relationship between product quality and
undergraduates’ online shopping decision.
4.4 Conclusion
Results of data collected from questionnaire survey were generated by using SPSS
16.0. The generated results were analyzed and interpreted. The analysis was
conducted in three parts, which are descriptive analysis, scale measurement, and
inferential analysis. Discussions, conclusion and implications in next chapter
would be derived according to these analyzed results and interpretation.

Perceived Benefits and Online Shopping Decisions
Page 68 of 102
CHAPTER 5: DISCUSSION, CONCLUSION AND
IMPLICATIONS
5.0 Introduction
In this chapter, the results of the previous chapters on descriptive and inferential
analysis are summarized. The discussions on the findings are supported with
evidence. Moreover, contribution to academicians and practitioners are explained.
Limitations of the research and recommendations are also provided. Finally, it
ends with a conclusion of this research.
5.1 Summary of Statistical Analysis
5.1.1 Descriptive Analysis
5.1.1.1 Demographic Profile of the Respondents
In this research, the respondents are mainly female (61.2%). In
addition, majority of the respondents fall under the age group of
21-23 years old. The respondents are mainly Chinese (52%) and
are pursuing business related courses (48.2%). Lastly, 45.2% of the
undergraduates have 1-5 times online shopping experience.

Perceived Benefits and Online Shopping Decisions
Page 69 of 102
5.1.1.2 Central Tendencies Measurement of Construct
Table 5.1: Webpage Design
Items Description
WD1 I prefer to purchase from Websites which are user
friendly.
WD2
I prefer to purchase from Websites with great
functionality (payment option, product filter option,
product customization, etc.)
WD3 I prefer to purchase from Websites that are updated
frequently.
WD4 I prefer to purchase from Websites that provide detailed
product information.
WD5 Websites which display products by pictures and
purchase button together will make my shopping easier.
WD6 I prefer to purchase from Websites with attractive design.
WD4 has the highest mean (4.15). WD6 has the lowest mean (3.66).
The item with the highest standard deviation is WD6 (1.022).
Nevertheless, the item with the lowest standard deviation (0.933) is
WD4.
Table 5.2: Product Choice
Items Description
PC1 Selection of goods available on the internet is very broad.
PC2 I will be able to access many brands and retailers when I
shop online.
PC3 Items from different countries are easily available.
PC4 Online shopping allows inter-comparable information.
PC5 I can get specialized products through online shopping.
PC4 has the highest mean value (3.85) while PC2 has the lowest
mean (3.65). PC2 has the highest standard deviation value (0.982).

Perceived Benefits and Online Shopping Decisions
Page 70 of 102
Nonetheless, the item that has the lowest standard deviation value
is PC1, which is 0.896.
Table 5.3: Price
Items Description
PR1 I will prefer online shopping only if online prices are
lower.
PR2 I believe that online retailers always offer the lowest
price.
PR3 I pay a lot of attention to prices.
PR4 I shop a lot for special deals.
PR5 It is easy to compare prices from different online
retailers.
PR6 Online shopping allows ones to look for the best price
before purchasing.
PR2 (2.86) has the highest value of mean while PR3 has the lowest
mean (1.89). Standard deviation of PR4 (1.035) is the highest value
while it is the lowest for PR6 (0.886).
Table 5.4: Convenience
Items Description
CN1 I don’t have to leave home for shopping.
CN2 I can shop whenever I want.
CN3 I can save the effort of visiting stores.
CN4 I can shop in the privacy of home.
CN5 Shopping over the Web would allow me to do my
shopping more quickly.
CN6 I can use online shopping Website to search for product
information.
Mean of CN2 is the highest, which is 3.91. CN5 with 3.55 is the
lowest mean. CN1 has the highest standard deviation, which is

Perceived Benefits and Online Shopping Decisions
Page 71 of 102
1.121 while the item with the lowest standard deviation is CN6
(0.898).
Table 5.5: Customer Service
Items Description
CS1
Greater value-added services (pre-sales service, post-
sales service) provided on the Websites would attract me
to shop online.
CS2 I will purchase products/services online, if it is easy to
make changes even after I made the payment.
CS3 I can find specific person or group for help when I have
difficulties in the online shopping Website.
CS4 Online shopping would provide me with a timely
response to my request.
CS5
Online shopping would provide me with customer
support such as e-form inquiry, order status tracing and
customer comment.
CS5 has the highest mean, which is 3.84. Mean of CS3 (3.32) is the
lowest. CS3 also has the highest standard deviation, which is 0.986.
CS1 (0.899) has the lowest standard deviation.
Table 5.6: Product Quality
Items Description
PQ1 It is important to ensure quality of product.
PQ2 I will purchase online from Websites that offer quality
products or services.
PQ3 A well-known brand implies good quality.
PQ4 I believe that I can get quality products through online
shopping.
PQ5 I believe that product features shown are what I will get
if I conduct the purchase through online.

Perceived Benefits and Online Shopping Decisions
Page 72 of 102
PQ1 has the highest mean, which is 4.25. PQ5 (3.01) has the lowest
mean. In addition, PQ5 has the highest standard deviation, which is
1.075. The item with the lowest standard deviation is PQ2 (0.864).
Table 5.7: Online Shopping Decision
Items Description
OS1 Online shopping is different from traditional shopping.
OS2
If I heard a new product that I am interested in is
available over the Internet, I would be interested to buy
it.
OS3 I intend to purchase goods on the Internet.
OS4 The possibility that I will purchase goods on the Internet
in the future is high.
OS5 I prefer online shopping than traditional shopping.
OS1 has the highest mean, 4.02. The mean of OS5 (2.90) is the
lowest. In addition, OS5 has the highest standard deviation, which
is 1.104. Nevertheless, OS1 has the lowest standard deviation,
which is 0.820.
5.1.2 Scale Measurement
5.1.2.1 Internal Consistency Reliability Test
Reliability test is performed to examine 38 items/questions in the
questionnaire survey for internal reliability of scales. According to
Chan et al. (2010), Cronbach’s Alpha of 0.7 or higher is acceptable.
The alpha coefficient of independent variables, Webpage design
(0.865), product choice (0.791), price (0.707), convenience (0.855),
customer service (0.728), and product quality (0.703), and

Perceived Benefits and Online Shopping Decisions
Page 73 of 102
dependent variable, online shopping decision (0.780) are more than
0.7. Thus, data is said to be reliable.
5.1.2.2 Normality Test
According to Zhang (2000), Kaynak (2003), and Jun et al. (2006),
the data is normally distributed when the skewness and kurtosis
score of all variables do not exceed the value of ±1 (as cited in Sit
et al., 2009). Data of this research is normally distributed as the
skewness score (-0.039) and kurtosis score (-0.116) fulfill the
above condition.
According to Central Limit Theorem, the distribution of sample is
approximately normal when the sample size is more than 30.
Therefore, a sample of 500 is normally distributed.
5.1.3 Inferential Analysis
5.1.3.1 Pearson’s Correlation Analysis
According to Harber et al. (1991), multicollinearity problem occurs
when a score of 0.8 is achieved for a bivariate correlation. Since
the coefficient values of the independent variables and dependent
variable are less than 0.8, multicollinearity problem does not occur.
5.1.3.2 Multiple Regression Analysis
In multiple regression analysis, R² of this research (0.401) shows
that 40.1% of the variation in online shopping decision is explained

Perceived Benefits and Online Shopping Decisions
Page 74 of 102
by Webpage design, product choice, price, convenience, customer
service and product quality.
When the p-value of regression coefficient is less than 0.05
(significant level), there is a significant relationship between the
independent variables and dependent variable. Otherwise, there is
no relationship between variables.
The multiple regression equation is as follows:
OS = 1.262 + 0.025(WD) + 0.010(PC) – 0.163(PR) + 0.207(CN)
+ 0.179(CS) + 0.267(PQ)
Where,
OS = Online Shopping Decision
WD = Webpage Design
PC = Product Choice
PR = Price
CN = Convenience
CS = Customer Service
PQ = Product Quality

Perceived Benefits and Online Shopping Decisions
Page 75 of 102
5.2 Discussions of Major Findings
Table 5.8: Results of Hypotheses Testing
Hypotheses
Supported Not
Supported
H1 : There is a significant relationship
between Webpage design and
undergraduates’ online shopping
decision.
p = 0.543
(>0.05)
H2 : There is a significant relationship
between product choice and
undergraduates’ online shopping
decision.
p = 0.834
(>0.05)
H3 : There is a significant relationship
between price and undergraduates’
online shopping decision.
p = 0.002
(<0.05)
H4 : There is a significant relationship
between convenience and
undergraduates’ online shopping
decision.
p = 0.000
(<0.05)
H5 : There is a significant relationship
between customer service and
undergraduates’ online shopping
decision.
p = 0.001
(<0.05)
H6 : There is a significant relationship
between product quality and
undergraduates’ online shopping
decision.
p = 0.000
(<0.05)
Source: Data developed for research
As shown in table 5.8, among the six hypotheses developed, there are four
hypotheses supported by the results of this research.

Perceived Benefits and Online Shopping Decisions
Page 76 of 102
5.2.1 Webpage Design
The result of this research showed that Webpage design and
undergraduates’ online shopping decision do not have any relationship.
Delafrooz et al. (2010) has obtained the same result for this hypothesis in
their research. The research result of Han et al. (2006) has also proven that
Website design does not have a significant relationship with online
purchasing decision.
5.2.2 Product Choice
The result of this research showed that product choice and undergraduates’
online shopping decision do not have any relationship. Young shoppers
prefer to shop online not because of wider product selection (Chang &
Samuel, 2006). They choose to shop online due to other perceived benefits.
5.2.3 Price
The result of this research showed that prices and undergraduates’ online
shopping decision has a significant relationship. Su et al. (2011) have
proven that price has influence in online shopping intention. According to
Goldsmith et al. (2002), consumers think that online shopping is cheaper
than traditional shopping. E-consumers today are alert about the prices
offered to them (Raman & Annamalai, 2011).
Shoppers would like to buy products at lowest price or get the best value
for what they paid (Zhou, Dai, & Zhang, 2007). Consumers always want to
fully utilize every cent they spend. Thus, price of a product always affect
their decision in purchasing. Harn et al. (2006) proved that price is an
important factor in determining the decision to purchase online.

Perceived Benefits and Online Shopping Decisions
Page 77 of 102
5.2.4 Convenience
The result of this research showed that convenience and undergraduates’
online shopping decision has a significant relationship. Proven by the
research results, convenience would cause buyers to purchase online
(Delafrooz et al., 2011; Kim et al., 2004). Research of Ahuja et al. (2003)
also shows that convenience is influencing consumers’ online purchase
decision.
Busy consumers can shop in convenience online as the online retailers
would serve their needs contrarily (Harn et al., 2006). Therefore,
convenience is one of the factors considered by consumers to shop online.
5.2.5 Customer Service
The result of this research showed that customer service and
undergraduates’ online shopping decision has a significant relationship.
Delafrooz et al. (2011) proved that customer service is a dominant factor
of online purchasing. Customer service is important for consumers to
make their online shopping decision (Shergill et al., 2005). Online
purchasing decision is affected by customer service personnel (Lin, 2009).
5.2.6 Product Quality
The result of this research showed that product quality and undergraduates’
online shopping decision has a significant relationship. Dillon et al. (2004)
found that product quality is affecting the decision of consumers to buy
online. Product quality was proved to be positively influencing customers’
intention to purchase online (Ahn et al., 2004; Han et al., 2006).

Perceived Benefits and Online Shopping Decisions
Page 78 of 102
5.3 Implications of the Study
5.3.1 Theoretical Implications
The conceptual framework that is applied in this research only take the
variables in perceived benefits and the online shopping decision into
consideration while the valence framework test whether perceived benefits
and perceived risks affect the decisions. This framework expansion on
perceived benefits can bring further understanding on how would the
variables in perceived benefits affect the decision making without
including the perceived risks.
5.3.2 Managerial Implications
As the result shown, most of the benefits perceived by the undergraduates
are positively related to their online purchase decision, which means that
they will affect their decision to shop online. Product quality is the most
significant component that affects online shopping decision. Thus, the
online retailers should ensure the products are in good quality before they
are sold. By having Certificate of Authenticity can help to enhance the
confidence of the consumers.
The second most significant perceived benefit is convenience. Students
demand more on time and effort saving. This result is consistent with
Delafrooz et al. (2006) and Girard et al. (2003. Online retailers should
consistently maintain their server to prevent server breakdown during peak
hours. Customer service comes after convenience. According to Shergill et
al. (2005), good customer service can improve customer satisfaction and
thus customer’s loyalty. Hence, E-marketers should assist the customers
during purchase and update the status of purchase or delivery to enhance
the contentment of the customers.

Perceived Benefits and Online Shopping Decisions
Page 79 of 102
The negative relationship between decision and price proved that the lower
the price, the higher the possibility for one to purchase online. According
to Paynter (2001), Websites without promotional activities do not attract
customer. Online retailers should occasionally review and compare with
their competitors’ price. The product choice and Webpage design showed
the most inferior influence. However, they should not be neglected.
Delafrooz et al. (2009b, 2010, & 2011) proved that online purchasers
prefer user friendly Websites with wider product selection. Online retailers
should maintain their Webpage accessibility to be friendly and with wider
choices.
In conclusion, online retailers should constantly review competitors’
Websites to compare the price, Webpage design and product choice.
Services and maintenance of Websites are also important to be successful
in the E-market.
5.4 Limitations of the Study
There are limitations in this study. Firstly, this research only examines
relationship between perceived benefits and online shopping decision but in
valence framework, perceived risks and perceived benefits would affect online
shopping decision. Thus, the result of 40.2% influential effect only covers a
portion of causes which affect online purchase decision.
Other than that, the target respondents are only undergraduates from private
universities. The results may not be suitable to conclude the perception of all
undergraduates in Malaysia about the degree of benefits that eventually affect
their decision in online shopping.
The causal effect relationship is absent in this study as it is not the objective to test
the effect of decisions without factors. Moreover, this study is based on
individuals’ beliefs in the benefits enjoyed. The situational factors are ignored.

Perceived Benefits and Online Shopping Decisions
Page 80 of 102
Even though individual factors played an important role, there are still arguments
that environmental factors will impair one’s decision.
5.5 Recommendations for Future Research
Future researchers can include perceived risks and other variables of perceived
benefits in view of further expanding the theoretical framework in the research if
they are adopting valence framework. This can further prove this study and
identify more significant factors that will affect the decisions.
Other than that, future researches should try to target other group of respondents
that have the significant influence in the online shopping industry. This can assist
the online retailers to get to know their consumer groups and levels. It also helps
fresh E-marketers to understand the target groups for their products.
Future researchers can include the objective of investigating the causal effect of
the variables in their study. Furthermore, they can also include situational factors
to improve the preciseness and reliability of the data tested. This kind of research
can test on how the individual responds to the environmental changes and
eventually affects the final decision. It helps the E-marketers in comprehending
how the consumers respond to the changes.
5.6 Conclusion
In this study, it is made known that perceived benefits (Webpage design, product
choice, convenience, customer service, and product quality) are positively related
to online shopping decisions except for the price which is negatively related. The
most significant variable is the product choice, followed by convenience and
customer service. The price is after customer service, then Webpage design and
lastly product choice. Although in valence framework consists of perceived risks
which are not tested in this research, this study still proves that these variables

Perceived Benefits and Online Shopping Decisions
Page 81 of 102
have significant effects on the decisions. It is recommended to include perceived
risks in the future research.

Perceived Benefits and Online Shopping Decisions
Page 82 of 102
REFERENCES
Ahn, T., Ryu, S., & Han, T. (2004). The impact of the online and offline features
on the user acceptance of internet shopping malls. Electronic Commerce
Research and Applications, 3(4), 405-420.
Ahuja, M., Gupta, B., & Raman, P. (2003). An Empirical Investigation of Online
Consumer Purchasing Behavior. Communications of the ACM, 46(12),
145-151.
Alam, S.S. & Yasin, N.M. (2009). An investigation of into the antecedents of
customer satisfaction of online shopping, ANZMAC, 1-9.
Amoroso, D.L. & Hunsinger, D.S. (2008). Analysis of the Factors that Influence
Online Purchasing. Pueblo. B. 2008 EDSIG, 1-16.
Arnold, S.J., Handelman, J., & Tiger, D.J. (1996). Organizational legitimacy and
retail store patronage. Journal of Business Research, 35, 229-239.
Ary, D., Jacobs, L.C., & Razavieh, A. (1996). Introduction to research in
education. Fort Worth, TX: Harcourt Brace College Publishers.
Baker, J., Levy, M., & Grewal, D. (1992). An experimental approach to making
retail store environment decisions. Journal of Retailing, 64(4), 445-460.
Bartlett, J.E., Hotrlik, J.W., & Higgins, C.C. (2001). Organizational Research:
Determining Appropriate Sample Size in Survey Research. Information
Technology, Learning, and Performance Journal, 19(1), 1-8.
Berkowitz, E.N., Kerin, R.A., Hartley, S.W., & Rudelius, W. (2000). Interactive
Marketing and Electronic Commerce, Marketing. Boston: Irwin, McGraw-
Hill.
Brown, J.D. (2002). Statistics Corner: Questions and Answers about Language
Testing Statistics: The Cronbach Alpha Reliabilty Estimate. Shiken: JALT
Testing & Evaluation SIG Newsletter, pp. 17,18.
Cao, X. & Mokhtarian, P.L. (2005). The Intended and Actual Adoption of Online
Purchasing: A Brief Review of Recent Literature. University of California.
Retrieved from: http://www.escholarship.org/uc/item/45q5p1vb
Chai, H.L., Eze, U.C., & Ndubisi, N.O. (2011). Analyzing key determinants of
online repurchase intentions. Asia Pacific Journal of Marketing and
Logistics, 23(2), 200-221.

Perceived Benefits and Online Shopping Decisions
Page 83 of 102
Chan, W.M.A. & Chow, W.Y.S. (2010). Factors affecting web-users to shop
online. Unpublished honours degree’s project, Hong Kong Baptist
University, Hong Kong.
Chang, J., & Samuel, N. (2006). Why Purchase Online? An Empirical Study of
Australian Internet Shoppers. Studies in Business and Economics, 12(1),
69-79.
Chiger, S. (2001). Consumer shopping survey: part 2. Catalog Age, 18(11), pp.47-
51.
Creative Research System. (2011). Significance in Statistics & Surveys. Retrieved
August 5, 2011, from http://www.surveysystem.com/signif.htm
Cronin, M.J. (1996). Global advantage on the World Wide Web. New York: Van
Nostrand Reinhold.
Dabhade, A. (2008). Antecedents of Older Consumers' Internet Shopping for
Apparel Products: Perceived Risk and Benefits and Shopping Orientation.
Unpublished master’s thesis, Auburn University, Auburn, Alabama,
United States.
Delafrooz, N. (2009). Factors affecting students’ online shopping attitude and
purchase intention. Unpublished Doctoral dissertation, University of Putra
Malaysia.
Delafrooz, N., Paim, L.H., & Khatibi, A. (2009a). Developing an Instrument for
Measurement of Attitude Toward Online Shopping. European Journal of
Social Sciences, 7(3), 166-177.
Delafrooz, N., Paim, L.H., & Khatibi, A. (2009b). Students’ Online Shopping
Behavior: An Empirical Study. Journal of American Science, 5(8), 39-49.
Delafrooz, N., Paim, L.H., & Khatibi, A. (2010). Students’ Online Shopping
Behavior: An Empirical Study. Journal of American Science, 6(1), 137-
147.
Delafrooz, N., Paim, L.H., & Khatibi, A. (2011). Understanding consumer’s
internet purchase intention in Malaysia. Afr. J. Bus. Manag., 3(5), 2837-
2846.
Dillon, T.W. & Reif, H.L. (2004). Factors Influencing Consumers’ E-Commerce
Commodity Purchases. Information Technology, Learning, and
Performance Journal, 22(2).

Perceived Benefits and Online Shopping Decisions
Page 84 of 102
Forsythe, S., Petee, T., & Jai, O.K. (2003). Modeling Consumer Behavior in On-
line Environments: Scale Validation. (Research Project, Auburn
University, 2003). NTC Project, S02-AC23.
Gardyn, R. (2002). Educated consumers. American Demographics, 24(10), 18-19.
Gibson, J. (2009). At Work Issue 55. Winter 2009: Institute for Work & Health.
Girard, T., Korgaonkar, P., & Silverblatt, R. (2003). Relationship of Type of
Product, Shopping Orientations, and Demographics with Preference for
Shopping on the Internet. Journal of Business and Psychology, 18(1).
Goldsmith, R.E. & Bridges, E. (2000). E-tailing versus retailing: using attitudes to
predict online buying behavior. Quarterly Journal of Electronic
Commerce, 1, 245-253.
Goldsmith, R.E. & Goldsmith, E.B. (2002). Buying apparel over the Internet.
Journal of Product and Brand Management, 11, 89–100.
Goldsmith. (2002). Explaining and predicting consumer intention to purchase over
the Internet: An exploratory study. Journal of Marketing Theory and
Practice
Goodwin. (1996). Economic Meanings of Trust and Responsibility. The
University of Michigan Press, Ann Arbor, MI.
Han, H.J., Bullington J., & Case T. (2006). A survey of Online Purchasing
Decision Factors and shopping purchasing behaviors of University
students. Proceedings of the 2006 Southern Association for Information
Systems Conference, 56-65.
Hannula, M. & Chuck, C. (2003). Students’ online buying behavior: a
comparative study between Finland and The USA. E-Business Research
Center, Research Report 7.
Hanson, W. (1999). Principles of Internet Marketing. Ohio: South-Western
College Publishing.
Harber, D., Marriott, F., & Idrus, N. (1991). Employee Participation in TQC: The
Effect of Job Levels on Participation and Job Satisfaction. International
Journal of Quality & Reliability Management, 8(5), 35-54.
Harn, A.C.P., Khatibi, A., & Ismail, H. (2006). E-commerce: A study on online
shopping in Malaysia. Journal of Social Science, 13(3), 232-242.

Perceived Benefits and Online Shopping Decisions
Page 85 of 102
Harrington, J. & Hess, G. (1996). A spatial theory of positive and negative
campaigning. Games and Economic Behavior, 17, 209-229.
Ho, C.F. & Wu, W.H. (1999). Antecedents of Customer Satisfaction on The
Internet: An empirical study of online shopping. Proceedings of 32nd
Hawaii International Conference on System Sciences, Institute of
Electrical and Electronics Engineers (IEEE), 1-9
Internet World Stats. (2011). Retrieved July 29, 2011, from
http://www.internetworldstats.com/
Jackson, S.L. (2008). Descriptive Methods. Research Methods and Statistics: A
Critical Thinking Approach (3rd ed.). 79-99.
Jacoby, J., and Kaplan, L. (1972). The Components of Perceived Risk. Advances
in Consumer Research, 3, 382-383.
Jun, M., Cai, S., & Shin, H. (2006). TQM practice in Maquiladora: antecedents of
employee satisfaction and loyalty. Journal of Operations Management, 24,
791-812.
Kaynak, H. (2003). The relationship between total quality management practices
and their effects on firm performance. Journal of Operations Management,
21, 405-35.
Khatibi, A., Thyagarajan, V., & Seetharaman, A. (2003). E-commerce in Malaysia:
Perceived Benefits and Barriers. Vikalpa, 28(3), 77-82.
Kim, D.J., Cho, B., & Rao, H.R. (2000). Effects of consumer lifestyle on
purchasing behavior on the Internet: a conceptual framework and
empirical validation. Proceeding of the ICIS’00 Proceedings of the twenty
first international conference on information system, 688-695.
Kim, D.J., Ferrin, D.L., & Rao, H.R. (2003). Trust and satisfaction, two stepping
stones for successful E-Commerce relationships: a longitudinal exploration.
Information System Research.
Kim, D.J., Ferrin, D.L., & Rao, H.R. (2008). A trust-based consumer decision-
making model in electronic commerce: the role of trust, perceived risk,
and their antecedents. Decision Support System, 44, 544-564.
Kim, E.Y. & Kim, Y.K. (2004). Predicting online purchase intentions for clothing
products. Eur. J. Mark., 38(7), 883-97.

Perceived Benefits and Online Shopping Decisions
Page 86 of 102
Kim, J.I., Lee, H.C., & Kim, H.J. (2004). Factors Affecting Online Search
Intention and Online Purchase Intention. Seoul Journal of Business, 10(2),
27-48.
Li, N. & Zhang, P. (2002). Consumer Online Shopping Attitudes and Behavior:
An Assessment of Research. Eighth Americas Conference on Information
Systems, 508-517.
Liang, T.P. & Lai, H.J. (2001). Effect of Store Design on Consumer Purchases:
van empirical study of on-line bookstores. Information & Management,
39(2002), 431-444.
Lichtenstein, S., & Swatman, P.M.C. (1997). Internet Acceptable Usage Policy:
Arguments and Perils. PAWEC'97, the 1st Pacific Asia Workshop on
Electronic Commerce, Brisbane, Queensland.
Lin, P.J. (2009). Factors Influencing Purchase Intention for Online Travel
Products – Case Study of Taiwanese Consumers. Unpublished doctoral
dissertation, University of Wales Institute, Cardiff, United Kingdom.
Lu, Y., Cao, Y., Wang, B., & Yang, S. (2011). A study on factors that affect users’
behavioral intention to transfer usage from the offline to the online channel.
Computers in Human Behavior, 27, 355-364.
Malhotra, N.K. (1993). Marketing Research: An Applied Orientation. Englewood
Cliffs, NJ: Prentice Hall.
Malhotra, N.K. (2004). Marketing Research: An Applied Orientation (4th ed.).
Upper Saddle River, NJ: Prentice Hall.
Monette, D.R., Sullivan, T.J., & DeJong, C.R. (2002). Applied Social Research.
Orlando, FLA: Harcourt Press.
Monsuwe, T.P., Dellaert, B.G.C., & Ruyter, K.R. (2004). What drives consumers
to shop online? A literature review. International Journal of Services
industry Management, 15(1), 102-121.
Neuman, W.L. (1997). Social Research Methods: Qualitative and Quantitative
Approaches. 3rd ed. Boston: Allyn and Bacon.
Olsen & St. George. (2004). Cross-Sectional Study Design and Data Analysis.
Retrieved August 31, 2011, from
http://www.collegeboard.com/prod_downloads/yes/4297_MODULE_05.p
df

Perceived Benefits and Online Shopping Decisions
Page 87 of 102
Osman, S., Chan, B.Y.F., & Bei, H.C. (2010). Undergraduates and Online
Purchasing Behavior. Asian Social Science, 6(10), 133-146.
Paynter, J., & Lim, J. (2001). Drivers and Impediments to E-Commerce in
Malaysia. Malaysian Journal of Library & Information Science, 6(2), 1-19.
Peter, P.J. & Tarpey, L.X. (1975). A comparative analysis of three consumer
decision strategies. Journal of Consumer Research, 2(1), 29-37.
Petter, J.P., & Ryan, M. (1976). An Investigation of Perceived Risk at the Brand
Level,” Journal of Marketing Research, 13, 184-188.
Raman, A. & Annamalai, V. (2011). Web Services and e-Shopping Decisions: A
Study on Malaysian e-Consumer. Wireless Information Networks &
Business Information System.
Ranganathan, C., & Ganapathy, S. (2002). Key dimensions of business-to-
consumer web sites. Information and Management, 39(6), 457-465.
Rishi. (2008). An empirical study of online shopping behavior: A factor analysis
approach. Journal of Marketing & Communication, 3(3).
Robin, R.P.D. (2009). The Impact of Perceived Value on Purchase Intension.
Consumer Behavior Research on Online Shopping, 1-22.
Rowley, J. (2000). Product Search in E-shopping: A Review and Research
Propositions. Journal of Consumer Marketing, 17(1), 124-135.
Sabri, M.F., MacDonald, M., Masud, J., Paim, L., Hira, T.K., & Othman, M.A.
(2008). Financial Behavior and Problems among College Students in
Malaysia: Research and Education Implication. Consumer Interests
Annual, 54.
Salkind, N.J. (2007). Exploring Research (6th
ed.). New Jersey. Pearson Prentice
Hall.pp.134.
Saunders, M., Lewis, P., & Thornhill, A. (2003). Research methods for business
students (5th ed.). United Kingdom: Prentice Hall.
Saunders, M., Lewis, P., & Thornhill, A. (2009). Research methods for business
students (5th ed.). United Kingdom: Prentice Hall.
Sekaran, U. (2003). Research methods for business: A skill building approach (4th
ed.). New York: John Wiley & Sons Inc.

Perceived Benefits and Online Shopping Decisions
Page 88 of 102
Shergill, G.S. & Chen, Z. (2005). Web-based shopping: Consumers’ attitudes
towards online shopping in New Zealand. J. Elect. Com. Res., 6(2), 78-92.
Sim, S., Eastlick, M.A., Lotz, S.L., & Warrington, P. (2001). An Online
Prepurchase Intentions Model: The Role of Intention to Search. Journal of
Retailing, 77, 397-416.
Simon, P.A., Palma, A., & Thisse, J.F. (1992). Discrete Choice Theory of Product
Differentiation. Cambridge, Mass.: MIT press 1992. Retrieved July 29,
2011, from
http://books.google.com/books/about/Discrete_choice_theory_of_product_
differ.html?id=xiXGtz47p5oC
Sit, W.Y., Ooi, K.B., Lin, B.S., & Chong, A.Y.L. (2009). TQM and customer
satisfaction in Malaysia’s service sector. Industrial Management & Data
Systems, 109(7), 957-975.
Su, D. & Huang, X. (2011). Research on online shopping intention of
undergraduate consumer in China: based on the theory of planned behavior.
International Business Research, 4(1), 1-7.
Supphellen, M. & Nysveen, H. (2001). Drivers of intention to revisit the Web sites
of well-known companies. International Journal of Market Research,
43(3), pp. 341-52.
Syed, S.A., Bakar, Z., Ismail, H., & Ahsan, M. N. (2008). Young consumers
online shopping: empirical study. Journal of Internet Business, (5), 81-98.
Tak & Wan. (2006). Factors affecting Internet shopping behaviour in Singapore:
gender and educational issues. International Journal of Consumer Studies,
310-316.
The Taylor Nelson Sofres Interactive. Global E-Commerce Report 2001.
Retrieved 25 July 2011, from
http://www.tnsofres.com/ger2001/pressoffice/index.cfm
Top 50 Ranking Universiti Terbaik Malaysia 2011. (2011). Retrieved 25 July
2011, from http://beritasemasa.com/ranking-universiti
Torkzadeh, G. & Dhillon, G. (2002). Measuring Factors that Influence the Success
of Internet Commerce. Information Systems Research, 13(2), 187-204.
Wilkie, W.L. & Pessimier, E.A. (1973). Issues in marketing’s use of multi-
attribute attitude models. Journal of Marketing Research, 10(4), 428-441.

Perceived Benefits and Online Shopping Decisions
Page 89 of 102
Wolfinbarger, M. & Gilly, M.C. (2001). Shopping Online for Freedom, Control,
and Fun. California Management Review, 43(2), 34-55.
Wu, S.I. (2003). The relationship between consumer characteristics and attitude
toward online shopping. Management Intelligence & Planing, 21(1), 37-44.
Yulihasri, Islam, A., & Daud. (2011). Factors that Influence Customers' Buying
Intention on Shopping Online. Intemational Joumal of Marketing Studies,
3(1).
Zhang, P. & von Dran, G.M. (2000). Satisfactor and dissatisfactorers: A two-
factor model for website design and evaluation. Journal of the American
Society for Information Science, 51(4), 1253-1268.
Zhang, P., von Dran, G.M., Small, R.V., & Barcellos, S. (1999). Websites that
satisfy users: a theoretical framework for web user interface design and
evaluation. Proceedings of the 32nd Annual Hawaii International
Conference on System Sciences (HICSS32), 1-8.
Zhang, P., von Dran, G.M., Small, R.V., & Barcellos, S. (2000). A two-factor
theory for website design. Proceedings of the 33rd
Annual Hawaii
International Conference on System Sciences (HICSS33), 1-10
Zhang, Z.H. (2000). Implementation of total quality management: an empirical
study of Chinese manufacturing forms. Unpublished doctoral thesis,
University of Groningen, Groningen.
Zhou, L., Dai, L.W., & Zhang, D.S. (2007). Online Shopping Acceptance Model
— A Critical Survey of Consumer Factors in Online Shopping. Journal of
Electronic Commerce Research, 8(1), 41-62.
Zikmund, W. G. (2003). Business Research Methods, (8th ed.). Thomson-South-
Western, Ohio.
Zikmund, W., & Scott, J. (1973). A Factor Analysis of the Multi-dimensional
Nature of Perceived Risk. Proceedings of the Southern Marketing
Association, Houston, TX, 1036.
Zikmund, W.G., Babin, B.J., Carr, J.C., & Griffin, M. (2010). Business Research
Method (8th
ed.). USA: South Western Cengage Learning.

APPENDICES
Appendix 2.1: Summary of Past Empirical Studies
Study Country Data Major Findings
Ahn, Tony,
Ryu, & Han,
2004
Korea Web-based survey was conducted to
user of Internet shopping malls
where banner related to the
questionnaires was linked to 6
Internet shopping malls.
Online quality such as system quality, information quality and
service quality have a positive impact on perceived ease of use
and usefulness, while offline quality like product quality and
delivery service only have a positive impact on usefulness.
Ahuja, Gupta &
Raman, 2003
US Two distinct groups of population:
student (n=190) and non students
(n=75) are surveyed.
Convenience (28%) and lower prices (25%) are strongest
motivators for online purchasing if present. However, security
and privacy concerns (28%) were the biggest barriers to online
shopping.
Amoroso &
Hunsinger, 2008
US,
Australia
Online survey conducted over 1850
undergraduate student in US and
Australia.
Significant correlations were also
found between E-Loyalty and the following
constructs: Inertia (r=.452), Convenience
(r=.565), E-Satisfaction (r=.555), and Per-
ceived Value (r=.529), providing support for
H7, H8, H9, and 10a.
Delafrooz, Paim
& Khatibi, 2010
Malaysia 500 questionnaires distributed
among postgraduate students from a
public university in Malaysia only
370 were analyzed.
The most influential determinants of user’s online shopping
attitudes are convenience, price and wider selection. All of them
have a significantly positive impact on users’ attitude toward
online shopping.
Perceiv
ed B
enefits an
d O
nlin
e Sh
op
pin
g D
ecision
s
Pag
e 90
of 1
02

Study Country Data Major Findings
Delafrooz, Paim
& Khatibi, 2011
Malaysia 370 surveys distributed to student
enrolled in public university located
in Selangor.
There are significant correlations between purchase convenience,
price, wider selection, utilitarian orientation, customer service,
and buying attitudes. Meanwhile, the attitude towards online
shopping had no significant relationship with hedonic orientation,
homepage and fun/entertaining webpage.
Dillon & Reif,
2004
US Survey conducted with 142 of
business major students and 27
integrated science students.
Specific factors that were more influential to students that have
made e-commerce purchases include the product perception
(price and quality), and the positive aspects of the shopping
experience (lifestyle compatibility and enjoyment).
Goldsmith, &
Goldsmith,
2002
US Survey of 566 students at large
southern university in US.
Both online purchaser and non-purchaser perceived that online
shopping is cheaper and more fun.
Han, Bullington
& Case, 2006
US More than 400 recruited students
from medium size, residential and
public university in Southeast were
asked to complete an online
(WEbcT) survey in their computer
related classes.
Out of ten factors considered, only product variety and quality
were considered to be more important for online shoppers. It is
followed by price, delivery time, and customer service. Others are
positively related to attitudes of online buyer but with
insignificant amount.
Harn, Khatibi &
Ismail, 2006
Malaysia 360 survey questionnaires conducted
through email or face-to-face
interview with current internet users
in Klang Valley.
The most important and dominant factors that
influenced online consumers to shop online are
“Convenience” with mean value of 3.83, “cannot get items
elsewhere” with mean value of 3.83 and “cheaper price” with
mean of 3.73.
Kim & Kim,
2004
US Mailing survey conducted on 303
adults with a computer at home and
had Internet access in the US.
Online privacy, convenience and prices play an important role in
online purchasing of clothing products.
Perceiv
ed B
enefits an
d O
nlin
e Sh
op
pin
g D
ecision
s
Pag
e 91
of 1
02

Study Country Data Major Findings
Liang & Lai,
2001
Taiwan Thirty student volunteers (21 males,
9 females) recruited to participate in
experiment.
Findings show that design quality is as important as product price
and consumers are more likely to buy at well-designed websites.
Shergill &
Chen, 2005
New
Zealand
Mail intercept survey of 102
respondents in Auckland’s shopping
mall with Web shop experience.
New Zealand’s buyer viewed security as the most important
aspect to buying online followed by website design. They are
found to be satisfied with the customer services.
Su & Huang,
2011
China 70 questionnaires distributed by
email and QQ to undergraduates but
60 are usable.
Price advantage affects the most due to limited income of the
undergraduates. Computer literacy affects online shopping. Other
factors( convenience, security) do not significantly affect
intention.
Wu, 2003 Taiwan Interview 600 randomly selected
Internet users in Taiwan.
All consumer benefits perception factors are showing positive
influence (p<0.05) on online shopping’s attitudes. Relevant
factors are purchase convenience, information abundance,
service, quality, homepage design and selection.
Perceiv
ed B
enefits an
d O
nlin
e Sh
op
pin
g D
ecision
s
Pag
e 92
of 1
02

Perceived Benefits and Online Shopping Decisions
Page 93 of 102
Appendix 3.1: Permission Letter to Conduct Survey

Perceived Benefits and Online Shopping Decisions
Page 94 of 102
Appendix 3.2: Survey Questionnaire
UNIVERSITI TUNKU ABDUL RAHMAN
FACULTY OF BUSINESS AND FINANCE
BACHELOR OF COMMERCE (HONS) ACCOUNTING
FINAL YEAR PROJECT
TITLE OF TOPIC : Relationship between Perceived Benefits and
Undergraduates’ Online Shopping Decisions in
Malaysia
Survey Questionnaire
Dear respondent,
We are final year undergraduate students of Bachelor of Commerce (Hons)
Accounting, from Universiti Tunku Abdul Rahman (UTAR). The purpose of this
survey is to investigate the relationship between perceived benefits and
undergraduates’ online shopping decisions in Malaysia.
Thank you for your participation.
Instructions:
1) There are THREE (3) sections in this questionnaire. Please answer
ALL questions in ALL sections.
2) Completion of this form will take you approximately 10 to 15 minutes.
3) Please feel free to share your comment in the space provided. The
contents of this questionnaire will be kept strictly confidential.

Perceived Benefits and Online Shopping Decisions
Page 95 of 102
Section A: Demographic
Please tick at the most appropriate box and fill in the blank (if relevant) for the
following questions.
1. Age
18-20
21-23
24-26
> 26
2. Gender
Male
Female
3. Ethnic Group
Malay
Chinese
Indian
Others (Please specify : ______________________ )
4. University
Multimedia University (MMU)
Universiti Tenaga Nasional (UNiTEN)
Open University Malaysia (OUM)
University of Nottingham Malaysia (UNM)
Universiti Teknologi PETRONAS (UTP)
Taylor's University College (Taylor)
Universiti Tunku Abdul Rahman (UTAR)
Universiti Tun Abdul Razak (UniTAR)
Monash University Malaysia (Monash)
Universiti Industri Selangor (Unisel)
Others (Please specify : ______________________ )

Perceived Benefits and Online Shopping Decisions
Page 96 of 102
5. Field of study
Business
Engineering
Social Sciences (eg. Psychology)
Sciences (eg. Chemistry, Biomedical Science)
Arts & Design
Language & Linguistics
Others (Please specify : ______________________ )
6. How many times have you shopped online before?
Never
1-5 times
6-10 times
11-15 times
> 15 times

Perceived Benefits and Online Shopping Decisions
Page 97 of 102
Section B: Perceived Benefits
Please circle the most appropriate rate for each of the following questions.
Items Description
Str
on
gly
Dis
ag
ree
Dis
ag
ree
Neu
tral
Ag
ree
Str
on
gly
Ag
ree
Webpage Design
WD1 I prefer to purchase from Websites
which are user friendly. 1 2 3 4 5
WD2
I prefer to purchase from Websites with
great functionality (payment option,
product filter option, product
customization, etc.)
1 2 3 4 5
WD3 I prefer to purchase from Websites that
are updated frequently. 1 2 3 4 5
WD4 I prefer to purchase from Websites that
provide detailed product information. 1 2 3 4 5
WD5
Websites which display products by
pictures and purchase button together
will make my shopping easier.
1 2 3 4 5
WD6 I prefer to purchase from Websites with
attractive design. 1 2 3 4 5
Product Choice
PC1 Selection of goods available on the
internet is very broad. 1 2 3 4 5
PC2 I will be able to access many brands and
retailers when I shop online. 1 2 3 4 5
PC3 Items from different countries are easily
available. 1 2 3 4 5
PC4 Online shopping allows inter-
comparable information. 1 2 3 4 5
PC5 I can get specialized products through
online shopping. 1 2 3 4 5
Price
PR1 I will prefer online shopping only if
online prices are lower. 1 2 3 4 5
PR2 I believe that online retailers always
offer the lowest price. 1 2 3 4 5
PR3 I pay a lot of attention to price. 1 2 3 4 5
PR4 I shop a lot for special deals. 1 2 3 4 5
PR5 It is easy to compare prices from
different online retailers. 1 2 3 4 5
PR6 Online shopping allows ones to look for
the best price before purchasing. 1 2 3 4 5

Perceived Benefits and Online Shopping Decisions
Page 98 of 102
Items Description
Str
on
gly
Dis
ag
ree
Dis
ag
ree
Neu
tral
Ag
ree
Str
on
gly
Ag
ree
Convenience
CN1 I don’t have to leave home for
shopping. 1 2 3 4 5
CN2 I can shop whenever I want. 1 2 3 4 5
CN3 I can save the effort of visiting stores. 1 2 3 4 5
CN4 I can shop in the privacy of home. 1 2 3 4 5
CN5 Shopping over the Web would allow me
to do my shopping more quickly. 1 2 3 4 5
CN6 I can use online shopping Website to
search for product information. 1 2 3 4 5
Customer Service
CS1
Greater value-added services (pre-sales
service, post-sales service) provided on
the Websites would attract me to shop
online.
1 2 3 4 5
CS2
I will purchase products/services online,
if it is easy to make changes even after I
paid.
1 2 3 4 5
CS3
I can find specific person or group for
help when I have difficulties in the
online shopping Website.
1 2 3 4 5
CS4 Online shopping would provide me with
a timely response to my request. 1 2 3 4 5
CS5
I prefer Website with customer support
such as e-form inquiry, order status
tracing and customer comment.
1 2 3 4 5
Product Quality
PQ1 It is important to ensure quality of
product. 1 2 3 4 5
PQ2 I will purchase online from Websites
that offer quality products or services. 1 2 3 4 5
PQ3 A well-known brand implies good
quality. 1 2 3 4 5
PQ4 I believe that I can get quality products
through online shopping. 1 2 3 4 5
PQ5
I believe that the product features
shown on the Website are the same with
real products that I purchase online.
1 2 3 4 5

Perceived Benefits and Online Shopping Decisions
Page 99 of 102
Section C: Online Shopping Decision
Please circle the most appropriate rate for each of the following questions.
Items Description
Str
on
gly
Dis
ag
ree
Dis
ag
ree
Neu
tral
Ag
ree
Str
on
gly
Ag
ree
Online Shopping Decision
OS1 Online shopping is different from
traditional shopping. 1 2 3 4 5
OS2
If I heard a new product that I am
interested in is available over the
Internet, I would be interested to buy it.
1 2 3 4 5
OS3 I intend to purchase goods on the
Internet. 1 2 3 4 5
OS4
The possibility that I will purchase
goods on the Internet in the future is
high.
1 2 3 4 5
OS5 I prefer online shopping than traditional
shopping. 1 2 3 4 5
Comments and Suggestions:
....................................................................................................................................
....................................................................................................................................
....................................................................................................................................
....................................................................................................................................
....................................................................................................................................
....................................................................................................................................

Perceived Benefits and Online Shopping Decisions
Page 100 of 102
Appendix 3.3: Variables and Measurement
Variables Items Description References Measurement
Independent Variables W
ebp
age
Des
ign
WD1 I prefer to purchase from
Websites which are user friendly.
Chai, Eze,
and
Ndubisi
2011
Interval
WD2 I prefer to purchase from
Websites with great functionality
(payment option, product filter
option, product customization,
etc.)
WD3 I prefer to purchase from
Websites that are updated
frequently.
WD4 I prefer to purchase from
Websites that provide detailed
product information.
Forsythe,
Petee, and
Jai 2003
WD5 Websites which display products
by pictures and purchase button
together will make my shopping
easier.
Delafrooz,
Paim, and
Khatibi
2009a
WD6 I prefer to purchase from
Websites with attractive design.
Rishi 2008
Pro
duct
Choic
e
PC1 Selection of goods available on
the internet is very broad.
Osman,
Chan, and
Bei 2010
Interval
PC2 I will be able to access to many
brands and retailers when I shop
online.
Robin 2009
PC3 Items from different countries are
easily available. Forsythe,
Petee, and
Jai 2003 PC4 Online shopping allows inter-
comparable information. Kim, Lee,
and Kim
2004
PC5 I can get specialized products
through online shopping. Chan and
Chow 2010

Perceived Benefits and Online Shopping Decisions
Page 101 of 102
Variables Items Description References Measurement
Independent Variables
Pri
ce
PR1 I will prefer online shopping only
if online prices are lower.
Osman,
Chan, and
Bei 2010
Interval
PR2 I believe that online retailers
always offer the lowest price.
Chai, Eze,
and
Ndubisi
2011
PR3 I pay a lot of attention to price. Dabhade
2008 PR4 I shop a lot for special deals.
PR5 It is easy to compare prices from
different online retailers.
PR6 Online shopping allows ones to
look for the best price before
purchasing.
Tak and
Wan 2006
Conven
ience
CN1 I don’t have to leave home for
shopping.
Robin 2009 Interval
CN2 I can shop whenever I want.
CN3 I can save the effort of visiting
stores.
CN4 I can shop in the privacy of home. Forsythe,
Petee, and
Jai 2003
CN5 Shopping over the Web would
allow me to do my shopping more
quickly.
Osman,
Chan, and
Bei 2010
CN6 I can use online shopping Website
to search for product information. Kim, Lee,
and Kim
2004
Cu
stom
er S
erv
ice
CS1 Greater value-added services (pre-
sales service, post-sales service)
provided on the Websites would
attract me to shop online.
Chai, Eze,
and
Ndubisi
2011
Interval
CS2 I will purchase products/services
online, if it is easy to make
changes even after I paid.
CS3 I can find specific person or group
for help when I have difficulties
in the online shopping Website.
Chan and
Chow 2010
CS4 Online shopping would provide
me with a timely response to my
request.
Delafrooz,
Paim, and
Khatibi
2009a CS5 I prefer Website with customer
support such as e-form inquiry,
order status tracing and customer
comment.

Perceived Benefits and Online Shopping Decisions
Page 102 of 102
Variables Items Description References Measurement
Independent Variables
Pro
du
ct Q
ual
ity
PQ1 It is important to ensure quality of
product.
Torkzadeh
and
Dhillon
2002
Interval
PQ2 I will purchase online from
Websites that offer quality
products or services.
Chai, Eze,
and
Ndubisi
2011
PQ3 A well-known brand implies good
quality.
Dabhade
2008
PQ4 I believe that I can get quality
products through online shopping.
PQ5 I believe that the product features
shown on the Website are the
same with real products that I
purchase online.
Osman,
Chan, and
Bei 2010
Dependent Variable
Onli
ne
Shoppin
g D
ecis
ion
OS1 Online shopping is different from
traditional shopping. Delafrooz,
Paim, and
Khatibi
2009b
Interval
OS2 If I heard a new product that I am
interested in is available over the
Internet, I would be interested to
buy it.
Goldsmith
2002
OS3 I intend to purchase goods on the
Internet. Chan and
Chow 2010 OS4 The possibility that I will
purchase goods on the Internet in
the future is high. OS5 I prefer online shopping than
traditional shopping. Osman,
Chan, and
Bei 2010