Embed Size (px)
Citation preview
CHAPTER -5 Relationship of MAS with Employee’s Productivity and Profitability
114
After analyzing the secondary data, in this chapter the researcher has dealt with
“The relationship between MAS and Employee‟s Productivity” and “The
relationship between MAS and Profitability” in order to have precise comparison
between the banks. Hypotheses have also been tested in this chapter. Some
important statistical tools such as, Karl Pearson‟s coefficient correlation,
Coefficient of Determination and Fisher‟s z- transformation have also been
applied to make this analysis more scientific.
In this chapter has been divided into two parts.
5.1 Relationship between MAS and Employee‟s Productivity.
5.2 Relationship between MAS and Profitability.
In order to have an in-depth study, the researcher has framed the
following hypotheses i.e.
Ho1: The MAS and Employee’s productivity are independent to each other.
Ho2: The MAS and Profitability are independent to each other.
5.1 Relationship between MAS and Employee’s
Productivity
This chapter has also been divided into following sub- parts.
5.1.1 The concept of Employee‟s Productivity.
5.1.2 Employee‟s Productivity in Banks.
5.1.3 Relationship between MAS and Employee‟s Productivity.
5.1.4 Comparison of PNB and HDFC Bank on the basis of Employee‟s
Productivity.
5.1.1 Concept of Employee’s Productivity
Productivity is one of the most common terms under used of people.
Particularly, business community is more concerned about this term.
Historically this term never remained out of the dictionary of the human being.
CHAPTER -5 Relationship of MAS with Employee’s Productivity and Profitability
115
There are many definitions of productivity. But widely it is considered as ratio of
output to input. There is a constant change in the generic concept
of productivity. There are many concept related to productivity. In different
periods, people focused on different facets of productivity. Sometime
labor productivity is important and other time resource productivity becomes
significant.
In simple words we can define employee productivity as the output per worker
or output per hour. With the increase in part-time employment and temporary
and contract workers, many businesses use hours worked rather than output per
worker to measure productivity.
Definition
“Economists define employee productivity as the output per worker or output
per hour. With the increase in part-time employment and temporary and
contract workers, many businesses use hours worked rather than output per
worker to measure productivity.”
“The amount of output per unit of input (labor, equipment, and capital). There
are many different ways of measuring productivity. For example, in a factory
productivity might be measured based on the number of hours it takes to
produce a good, while in the servicesector productivity might be measured
based on the revenue generated by an employee divided by his/her salary.”
According to economist Paul Krugman- “Businesses live and die by productivity. A productive company has lower
operating costs and can sell its products or services at lower prices, bringing
increased volume and profits. Employee productivity is key to organizational
success and to a country's economy. Employee productivity must increase if the
overall standard of living is to increase.”

CHAPTER -5 Relationship of MAS with Employee’s Productivity and Profitability
116
Why is Employee’s Productivity Calculated?
Any successful business knows much of its success is due to diligent workers
with excellent productivity. Employees who put forth extra effort often make a
big difference in company profits. The employees who do only what the job
duties require, and no more, can stymie the progress of a company. It is
important to motivate all employees to reach their full potential and maximal
level of productivity. Companies that recognize and encourage increased
productivity are likely to be more successful than their counterparts.
Economists define employee productivity as the output per worker or output per
hour. With the increase in part-time employment and temporary and contract
workers, many businesses use hours worked rather than output per worker to
measure productivity.
Factors Affecting Employees’ Productivity
Employees are more or less productive based on a variety of objective and
subjective factors, including the work environment, motivation, workflow
processes and technology. Objective data--such as billable hours, number of
products sold, items assembled or claims processed--measure employee
productivity. Employers also use subjective measures. The important factors are
given below:
1. Work Environment
Telecommuting and collaboration have changed the work
environment.
Telecommuting, flexible scheduling and staffing and collaboration are changing
how, where and when employees work. Regardless of their work environment,
having the necessary materials and tools to do their work is vital to employee
engagement and productivity.2

CHAPTER -5 Relationship of MAS with Employee’s Productivity and Profitability
117
2. Employee Motivation
Workers take pride in their contributions to success.
Open and honest communication, positive feedback and shared performance
expectations all affect productivity. Being able to see a project through to its
completion or having a clear understanding of their role in the work motivates
employees better than top-down management approaches.
3. Work Processes
Look for improvement opportunities in work processes.
All work is a process--a series of actions that bring about a result. Frequently,
workers develop processes over time with little or no formal planning. Work-
flow processes affect employee productivity, and managers of productive work
groups understand this and champion process improvement.
Alfred Edward Perlman, president of Penn Central Railroad, once said that if a
process has been used for two years, it should be re-evaluated for improvement
opportunities.
4. Technology
Learning new computer programs affects productivity.
Technology has improved productivity in areas such as supply-chain
management and financial transactions. Technology can also reduce
productivity, at least in the initial phases of implementation. Often, employees
are expected to learn a new technology while doing their daily work. This
reduces their immediate productivity and lengthens the learning curve for the
new technology, which, in turn, delays the anticipated productivity associated
with the new technology.
A lag is created between technology implementation and increased employee
productivity. Technology requires that employers revise their definition of
employee productivity. When employees complain about the amount of time
they must spend writing and responding to e-mails, they're viewing this as
CHAPTER -5 Relationship of MAS with Employee’s Productivity and Profitability
118
nonproductive time. But in the information economy, sharing information via e-
mails is part of the work and a component of productivity.
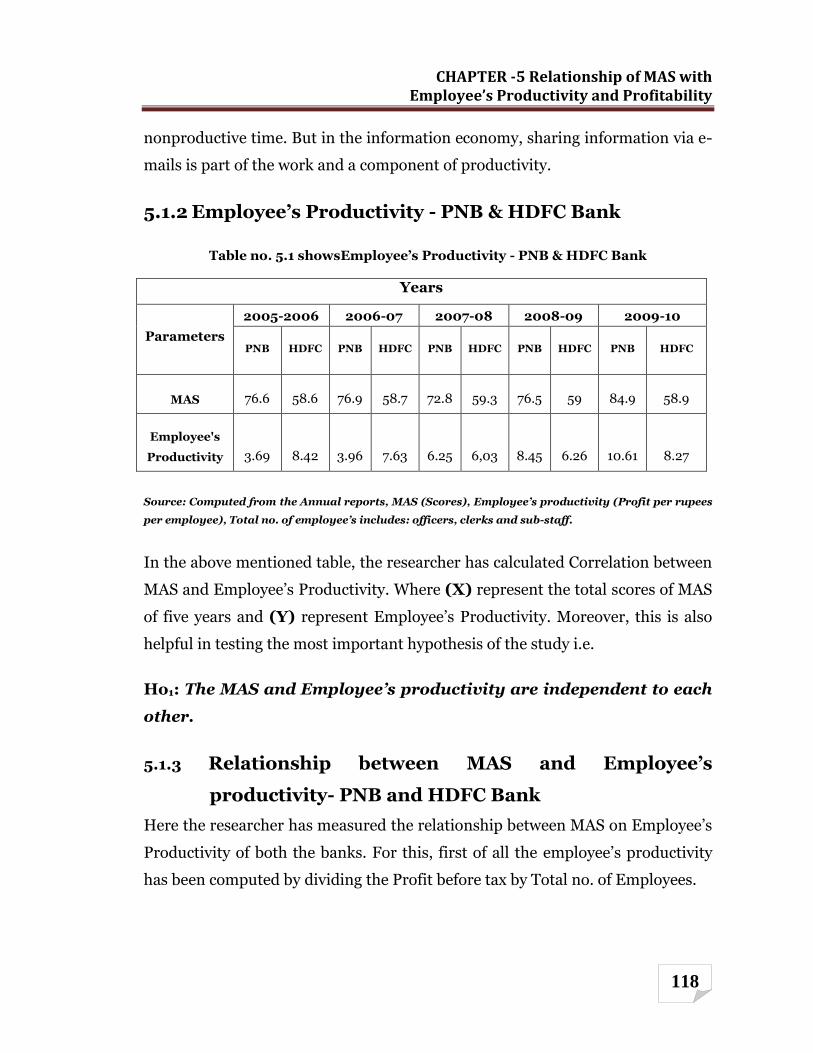
5.1.2 Employee’s Productivity - PNB & HDFC Bank
Table no. 5.1 showsEmployee’s Productivity - PNB & HDFC Bank
Years
Parameters
2005-2006 2006-07 2007-08 2008-09 2009-10
PNB HDFC PNB HDFC PNB HDFC PNB HDFC PNB HDFC
MAS 76.6 58.6 76.9 58.7 72.8 59.3 76.5 59 84.9 58.9
Employee's
Productivity 3.69 8.42 3.96 7.63 6.25 6,03 8.45 6.26 10.61 8.27
Source: Computed from the Annual reports, MAS (Scores), Employee’s productivity (Profit per rupees
per employee), Total no. of employee’s includes: officers, clerks and sub-staff.
In the above mentioned table, the researcher has calculated Correlation between
MAS and Employee‟s Productivity. Where (X) represent the total scores of MAS
of five years and (Y) represent Employee‟s Productivity. Moreover, this is also
helpful in testing the most important hypothesis of the study i.e.
Ho1: The MAS and Employee’s productivity are independent to each
other.
5.1.3 Relationship between MAS and Employee’s
productivity- PNB and HDFC Bank
Here the researcher has measured the relationship between MAS on Employee‟s
Productivity of both the banks. For this, first of all the employee‟s productivity
has been computed by dividing the Profit before tax by Total no. of Employees.

CHAPTER -5 Relationship of MAS with Employee’s Productivity and Profitability
119
Table no. 5.2 Computation of Employee’s Productivity of both the banks.
Computation of Employee's Productivity - PNB and HDFC Bank
Years PNB
HDFC Bank
PBT
Tot.
no. of
empl.
Employee's
Prod. MAS
PBT
Tot.
no. of
empl.
Employee's
Prod. MAS
2005-06 2140.5 58047 3.69 76.6 1253.5 14878 8.42 58.6
2006-07 2268.8 57316 3.96 76.9 1638.8 21477 7.63 58.7
2007-08 3500 56025 6.25 72.8 2280.6 37836 6.03 59.3
2008-09 4917 58205 8.45 76.5 3299.3 52687 6.26 59
2009-10 6042.7 56928 10.61 84.9 4289.1 51888 8.27 58.9
(Rs in crore)
Source: Computed from the Annual reports, Employee’s Productivity= profit per Rs. per employee.
On the basis of the above table, the correlation between MAS and Employee‟s
Productivity of two banks is shown in table below:
Table no. 5.3
Computation Karl Pearson's Correlation Coefficient of PNB and HDFC
Bank on the basis of Employee's Productivity
Parameters PNB HDFC Bank
Correlation r r2 r r2
MAS & Employee's Productivity 0.64 0.40 -0.83 0.69
Source: Annual reports

CHAPTER -5 Relationship of MAS with Employee’s Productivity and Profitability
120
The above table reveals that correlation value of PNB in the case of MAS and
Employee‟s Productivity is 0.64 which is positive high degree of correlation and
for HDFC is -0.83, which is negative moderate high degree of correlation. The
conclusion arrive that implementation of MAS increasing the employee‟s
productivity at a positive high rate in PNB, but in case of HDFC it is negative
moderate high rate.
So, in PNB the employee‟s productivity increases with the high score of MAS.
Though, the employee‟s productivity which is 40% depends on MAS. Here, it is
clear that the PNB is far better position than HDFC.
5.1.3 Comparison of PNB and HDFC Bank on the basis of
Employee’s Productivity
In order to test the hypothesis the above table no. 5.4 shows the coefficient of
correlation of PNB and HDFC and their z-test values, standard error and Z-value
for both the banks.
Comparison of PNB and HDFC Bank on the basis of Employee’s
Productivity
Parameter
PNB HDFC PNB HDFC
r1 r2 Z1 Z2
σ Z1-
Z2
Z-
va
lue
Ho(<1.96)
Employee's
Productivity 0.64 -0.83 0.76 -1.19 1 1.95 A
CHAPTER -5 Relationship of MAS with Employee’s Productivity and Profitability
121
The null hypothesis stated that the MAS and Employee’s productivity are
independent to each other. Since, the computed value of z 1.95is less than
the table value of z 1.96at 0.05 level of significance; therefore, the null
hypothesis is accepted. Hence it can be safely said that there is no significant
difference in the MAS and employees‟ productivity. So, it can be concluded that
the MAS and Employee‟s productivity are independent to each other.
But employee‟s productivity is a positive aspect which no company would like to
be negative. Here, the correlation between MAS and Employee‟s Productivity in
HDFC Bank is negative -0.83, whereas in PNB it is positive 0.64. Therefore, it
can be concluded that employee‟s productivity in PNB is better than HDFC
Bank.
5.2 Relationship between MAS and Profitability
This chapter has also been divided into following sub- sections.
5.2.1 The concept of profitability.
5.2.2 Profitability in Banks.
5.2.3 Relationship between MAS and Profitability.
5.2.4 Comparison of PNB and HDFC Bank on the basis of Profitability.
5.2.1 Meaning and Concept of Profitability
Profitability means ability to make profit from all the business activities of an
organization, company, firm, or an enterprise. It shows how efficiently the
management can make profit by using all the resources available in the market.
According to Harward & Upton, “profitability is the „the ability of a given
investment to earn a return from its use.” However, the term „Profitability‟ is not
synonymous to the term „Efficiency‟. Profitability is an index of efficiency; and is
regarded as a measure of efficiency and management guide to greater efficiency.
Though, profitability is an important yardstick for measuring the efficiency, the
extent of profitability cannot be taken as a final proof of efficiency. Sometimes
CHAPTER -5 Relationship of MAS with Employee’s Productivity and Profitability
122
satisfactory profits can mark inefficiency and conversely, a proper degree of
efficiency can be accompanied by an absence of profit. The net profit figure
simply reveals a satisfactory balance between the values receive and value given.
The change in operational efficiency is merely one of the factors on which
profitability of an enterprise largely depends. Moreover, there are many other
factors besides efficiency, which affect the profitability.
Definitions
“Each business unit works to earn maximum profits. The existence,
continuance and expansion of the business depends on its capacity to earn a
good amount of the business depends on its capacity to earn a good amount of
profits every year. The ability to earn profits is called profitability. The
profitability of a business concern is the net result of a large number of
decisions and policies.”
Dr.A.K. Garg
"Earnings are now the focus as results will be an indication of companies'
future profitability. Banks will benefit from increasing capital spending and
their stocks are still cheap."
TomokatsuMori R. S. Kulshrestha has rightly stated, “Profit in two separate business
concern may be identical, yet, many a times, it usually happens that their
profitability varies when measured in terms of size of investment”.
As Weston and Brigham rightly notes, “to the financial management profit
is the test of efficiency and a measure of control, to the owners a measure of the
worth of their investment, to the creditors the margin of safety, to the
government a measure of taxable capacity and a basis of legislative action and to
the country profit is an index of economic progress, national income generated
and the rise in the standard of living”, while profitability is an outcome of profit.
In other words, no profit drives towards profitability.
CHAPTER -5 Relationship of MAS with Employee’s Productivity and Profitability
123
Reasons for Computing Profitability
Whether you are recording profitability for the past period or projecting
profitability for the coming period, measuring profitability is the most important
measure of the success of the business. A business that is not profitable cannot
survive. Conversely, a business that is highly profitable has the ability to reward
its owners with a large return on their investment. Increasing profitability is one
of the most important tasks of the business managers. Managers constantly look
for ways to change the business to improve profitability. These potential changes
can be analyzed with a pro forma income statement or a Partial Budget. Partial
budgeting allows you to assess the impact on profitability of a small or
incremental change in the business before it is implemented.
CHAPTER -5 Relationship of MAS with Employee’s Productivity and Profitability
124
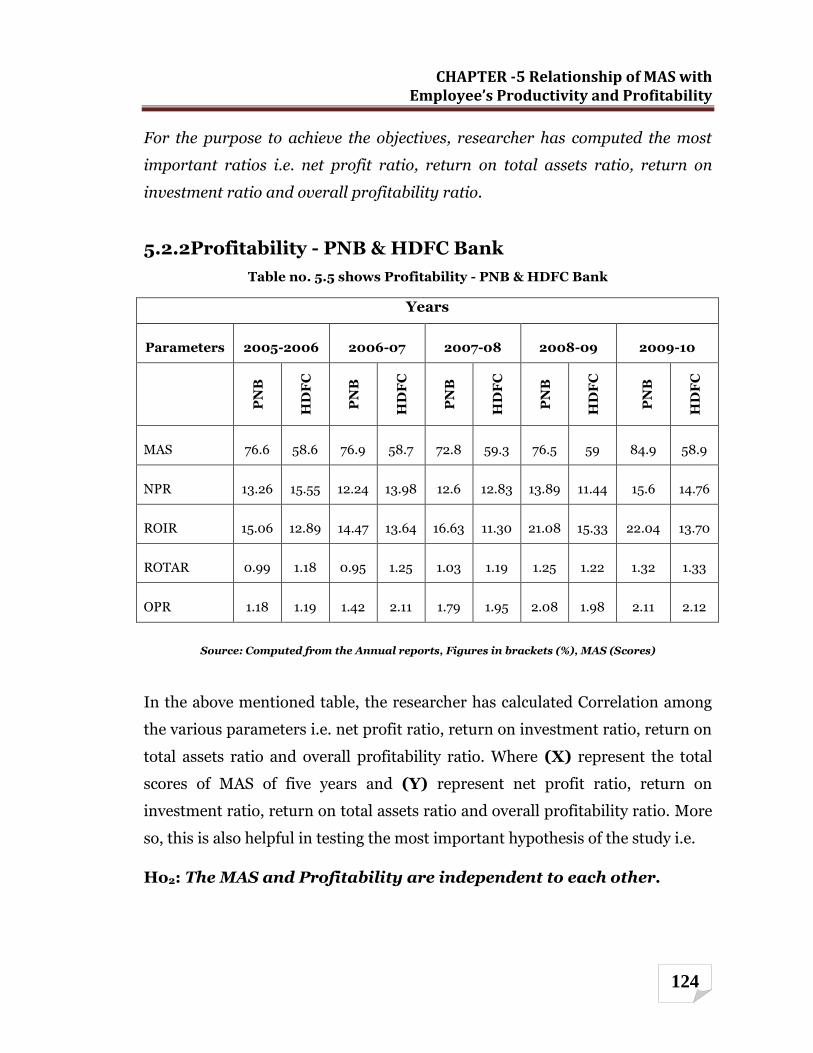
For the purpose to achieve the objectives, researcher has computed the most
important ratios i.e. net profit ratio, return on total assets ratio, return on
investment ratio and overall profitability ratio.
5.2.2Profitability - PNB & HDFC Bank
Table no. 5.5 shows Profitability - PNB & HDFC Bank
Years
Parameters 2005-2006 2006-07 2007-08 2008-09 2009-10
PN
B
HD
FC
PN
B
HD
FC
PN
B
HD
FC
PN
B
HD
FC
PN
B
HD
FC
MAS 76.6 58.6 76.9 58.7 72.8 59.3 76.5 59 84.9 58.9
NPR 13.26 15.55 12.24 13.98 12.6 12.83 13.89 11.44 15.6 14.76
ROIR 15.06 12.89 14.47 13.64 16.63 11.30 21.08 15.33 22.04 13.70
ROTAR 0.99 1.18 0.95 1.25 1.03 1.19 1.25 1.22 1.32 1.33
OPR 1.18 1.19 1.42 2.11 1.79 1.95 2.08 1.98 2.11 2.12
Source: Computed from the Annual reports, Figures in brackets (%), MAS (Scores)
In the above mentioned table, the researcher has calculated Correlation among
the various parameters i.e. net profit ratio, return on investment ratio, return on
total assets ratio and overall profitability ratio. Where (X) represent the total
scores of MAS of five years and (Y) represent net profit ratio, return on
investment ratio, return on total assets ratio and overall profitability ratio. More
so, this is also helpful in testing the most important hypothesis of the study i.e.
Ho2: The MAS and Profitability are independent to each other.
CHAPTER -5 Relationship of MAS with Employee’s Productivity and Profitability
125
5.2.3 Relationship between MAS and Profitability of PNB
and HDFC Bank
Here, the researcher has measured the impact of MAS on Profitability of both
the banks. For this, the profitability has been computed by calculated net profit
ratio, return on investment ratio, return on total assets ratio and overall
profitability ratio. The net profit ratio is calculated by dividing profit after tax by
net revenue.
Table no.5.6 shows Computation of Net Profit Ratio of both the banks.
(Rs in crore)
Computation of Net Profit Ratio - PNB and HDFC Bank
Years PNB
HDFC Bank
PAT
NR
(%)
NPR MAS
PAT
NR
(%)
NPR MAS
2005-06 14493109 108576525 13.26 76.6 870.8 5599.30 15.55 58.6
2006-07 15400842 125797829 12.24 76.9 1141.50 8164.20 13.98 58.7
2007-08 20487631 162625782 12.6 72.8 1590.20 12398.20 12.83 59.3
2008-09 30908809 222458526 13.89 76.5 22449392 196228646 11.44 59
2009-10 39053575 250322224 15.6 84.9 2947009 199805106 14.76 58.9
Source: Computed from the Annual reports, MAS (Scores)
CHAPTER -5 Relationship of MAS with Employee’s Productivity and Profitability
126
On the basis of the above table, the correlation between MAS and Profitability of
the two banks is shown in table below:
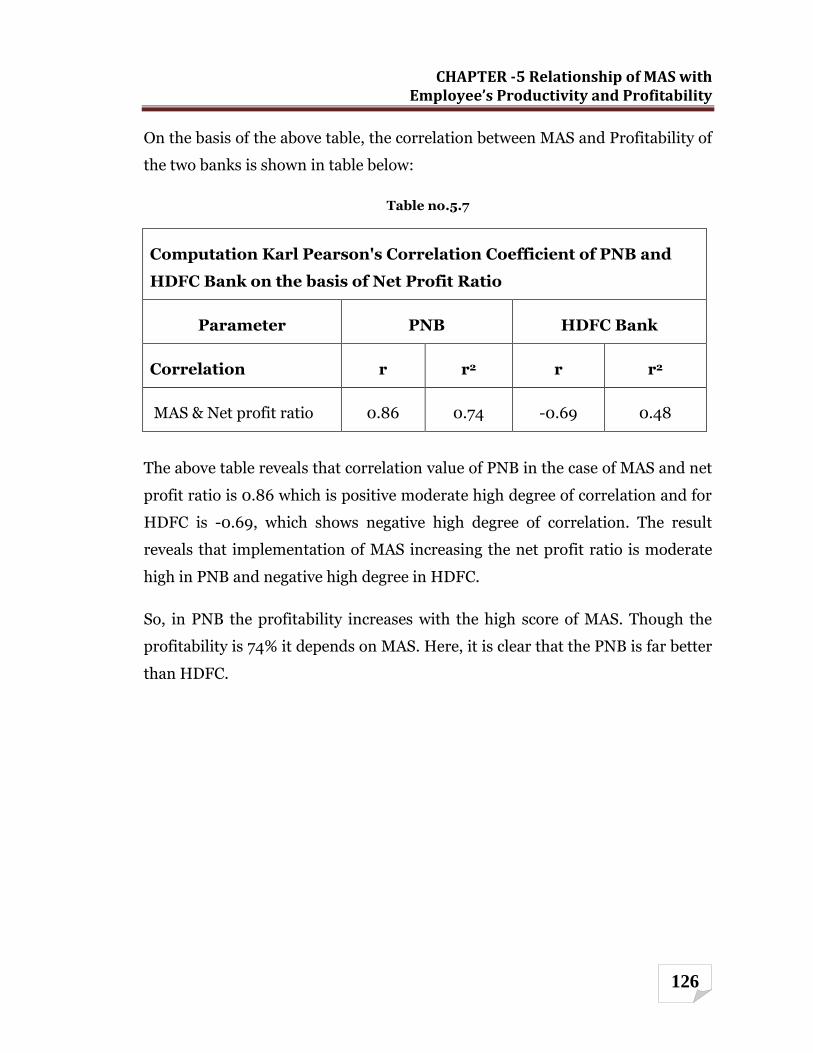
Table no.5.7
Computation Karl Pearson's Correlation Coefficient of PNB and
HDFC Bank on the basis of Net Profit Ratio
Parameter PNB HDFC Bank
Correlation r r2 r r2
MAS & Net profit ratio 0.86 0.74 -0.69 0.48
The above table reveals that correlation value of PNB in the case of MAS and net
profit ratio is 0.86 which is positive moderate high degree of correlation and for
HDFC is -0.69, which shows negative high degree of correlation. The result
reveals that implementation of MAS increasing the net profit ratio is moderate
high in PNB and negative high degree in HDFC.
So, in PNB the profitability increases with the high score of MAS. Though the
profitability is 74% it depends on MAS. Here, it is clear that the PNB is far better
than HDFC.
CHAPTER -5 Relationship of MAS with Employee’s Productivity and Profitability
127
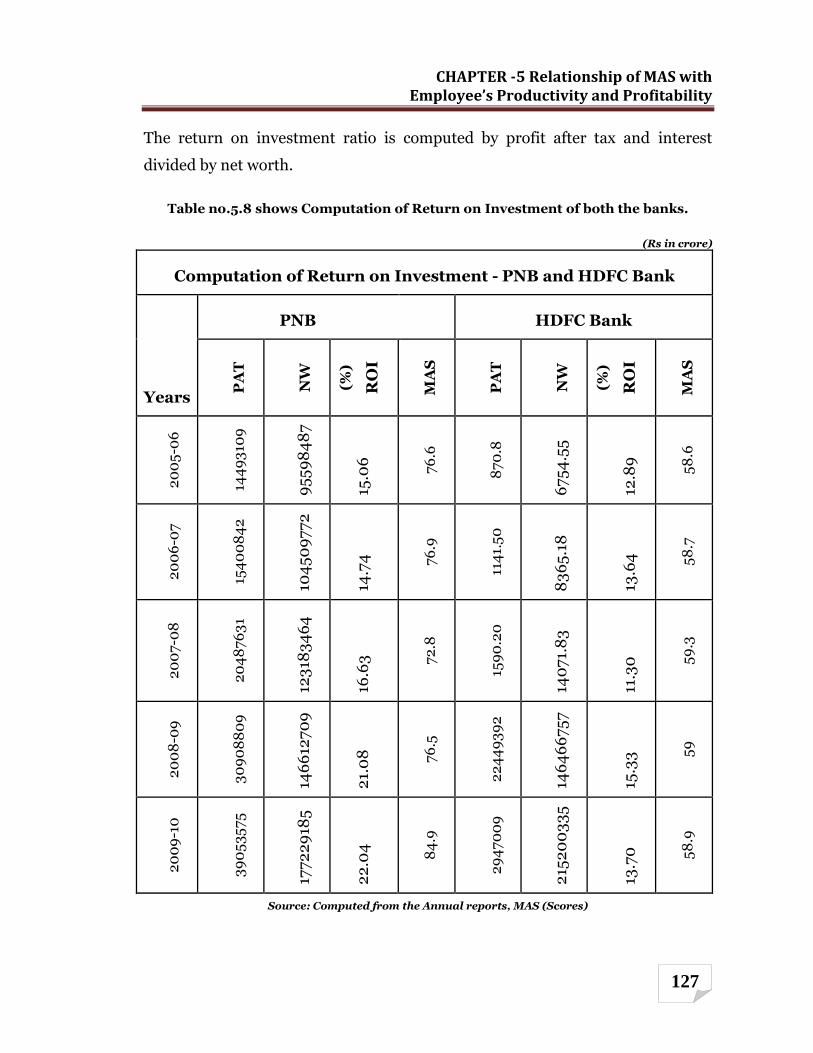
The return on investment ratio is computed by profit after tax and interest
divided by net worth.
Table no.5.8 shows Computation of Return on Investment of both the banks.
(Rs in crore)
Computation of Return on Investment - PNB and HDFC Bank
Years
PNB
HDFC Bank
PA
T
NW
(%)
RO
I
MA
S
PA
T
NW
(%)
RO
I
MA
S
20
05
-06
144
93
109
95
59
84
87
15.0
6
76
.6
87
0.8
67
54
.55
12.8
9
58
.6
20
06
-07
154
00
84
2
104
50
97
72
14.7
4
76
.9
114
1.5
0
83
65
.18
13.6
4
58
.7
20
07
-08
20
48
76
31
123
183
46
4
16.6
3
72
.8
159
0.2
0
140
71.
83
11.3
0
59
.3
20
08
-09
30
90
88
09
146
612
70
9
21.
08
76
.5
22
44
93
92
146
46
67
57
15.3
3 59
20
09
-10
39
05
35
75
177
22
918
5
22
.04
84
.9
29
47
00
9
215
20
03
35
13.7
0
58
.9
Source: Computed from the Annual reports, MAS (Scores)
CHAPTER -5 Relationship of MAS with Employee’s Productivity and Profitability
128
On the basis of the above table the correlation between MAS and Profitability of
two banks is shown in table below:
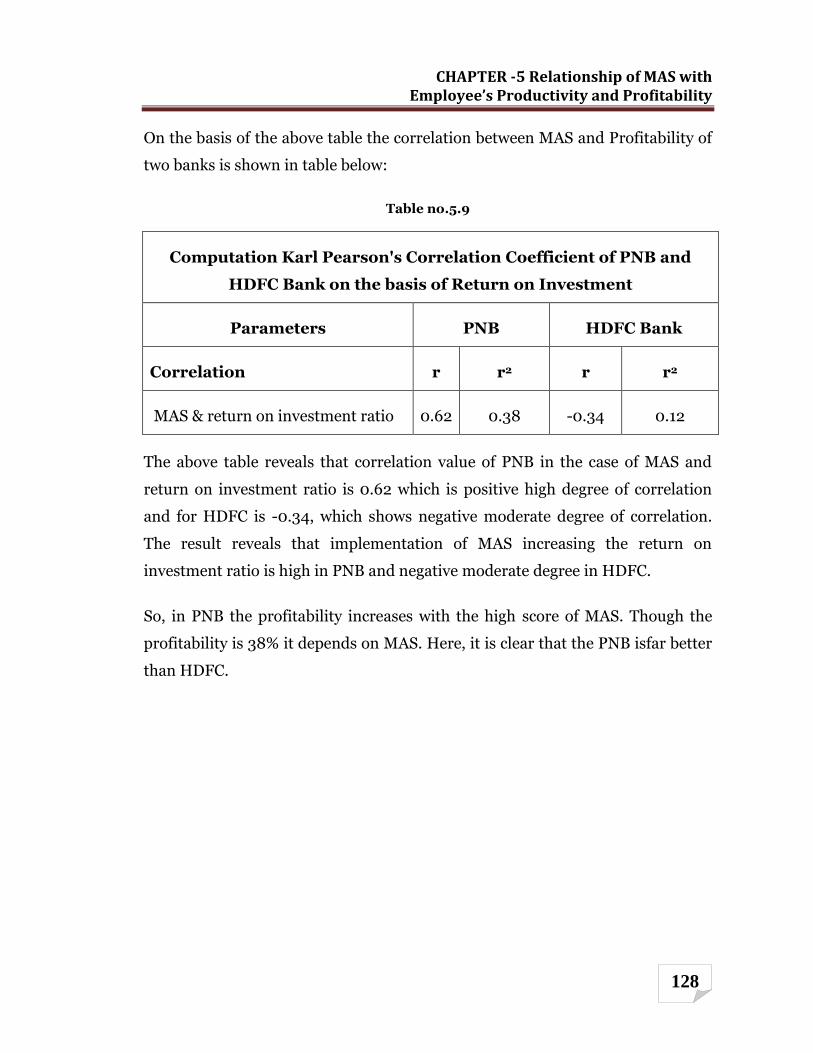
Table no.5.9
Computation Karl Pearson's Correlation Coefficient of PNB and
HDFC Bank on the basis of Return on Investment
Parameters PNB HDFC Bank
Correlation r r2 r r2
MAS & return on investment ratio 0.62 0.38 -0.34 0.12
The above table reveals that correlation value of PNB in the case of MAS and
return on investment ratio is 0.62 which is positive high degree of correlation
and for HDFC is -0.34, which shows negative moderate degree of correlation.
The result reveals that implementation of MAS increasing the return on
investment ratio is high in PNB and negative moderate degree in HDFC.
So, in PNB the profitability increases with the high score of MAS. Though the
profitability is 38% it depends on MAS. Here, it is clear that the PNB isfar better
than HDFC.
CHAPTER -5 Relationship of MAS with Employee’s Productivity and Profitability
129
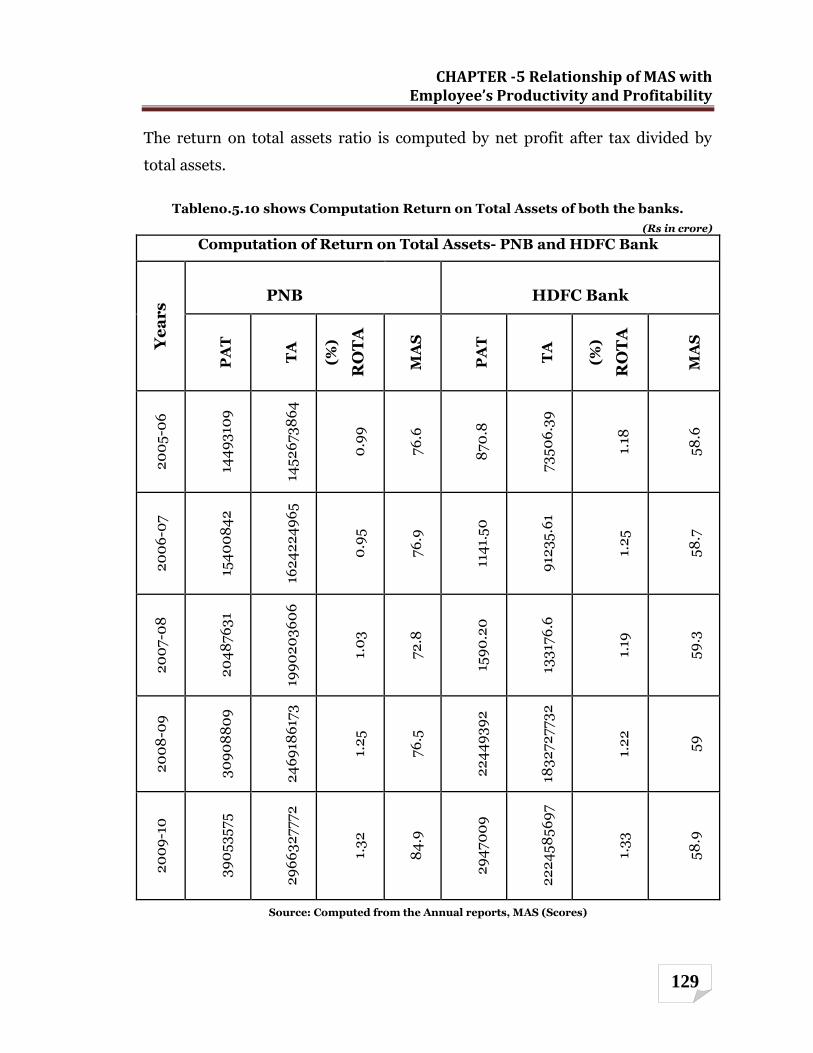
The return on total assets ratio is computed by net profit after tax divided by
total assets.
Tableno.5.10 shows Computation Return on Total Assets of both the banks.
(Rs in crore)
Computation of Return on Total Assets- PNB and HDFC Bank
Ye
ar
s PNB
HDFC Bank
PA
T
TA
(%)
RO
TA
MA
S
PA
T
TA
(%)
RO
TA
MA
S
20
05
-06
144
93
109
145
26
73
86
4
0.9
9
76
.6
87
0.8
73
50
6.3
9
1.18
58
.6
20
06
-07
154
00
84
2
162
42
24
96
5
0.9
5
76
.9
114
1.5
0
912
35
.61
1.2
5
58
.7
20
07
-08
20
48
76
31
199
02
03
60
6
1.0
3
72
.8
159
0.2
0
133
176
.6
1.19
59
.3
20
08
-09
30
90
88
09
24
69
186
173
1.2
5
76
.5
22
44
93
92
183
27
27
73
2
1.2
2
59
20
09
-10
39
05
35
75
29
66
32
77
72
1.3
2
84
.9
29
47
00
9
22
24
58
56
97
1.3
3
58
.9
Source: Computed from the Annual reports, MAS (Scores)
CHAPTER -5 Relationship of MAS with Employee’s Productivity and Profitability
130
On the basis of the above table the correlation between MAS and Profitability of
two banks is shown in table below:
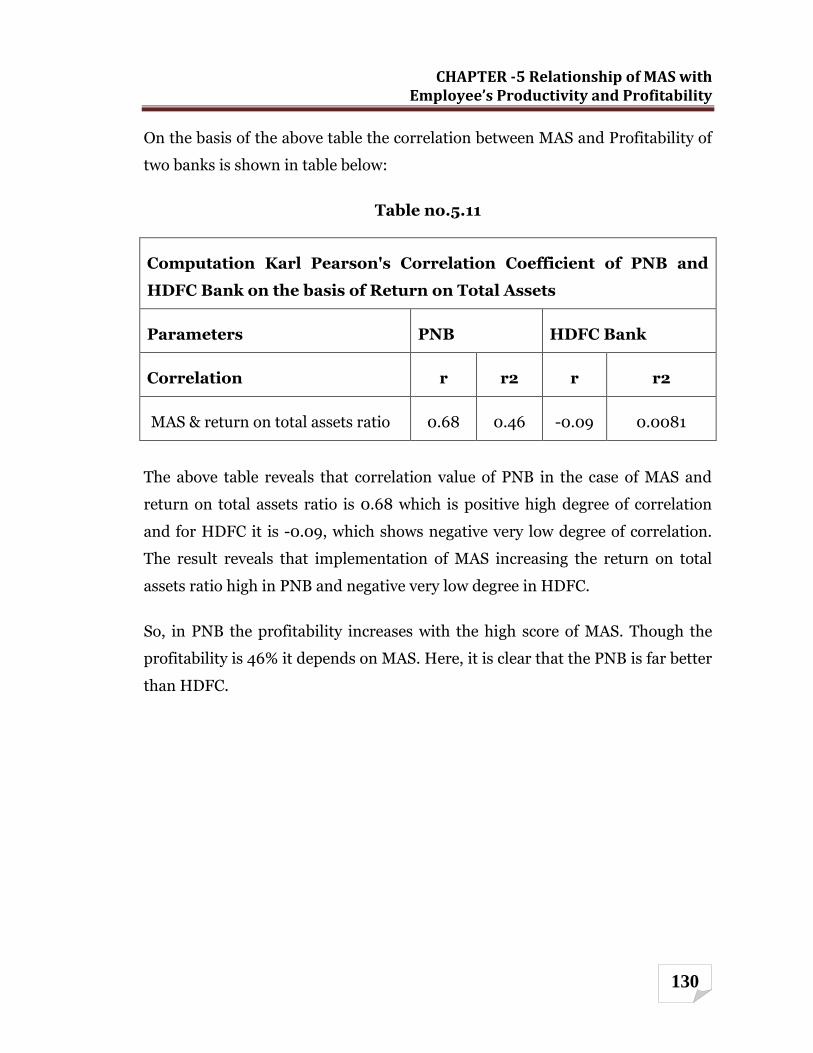
Table no.5.11
Computation Karl Pearson's Correlation Coefficient of PNB and
HDFC Bank on the basis of Return on Total Assets
Parameters PNB HDFC Bank
Correlation r r2 r r2
MAS & return on total assets ratio 0.68 0.46 -0.09 0.0081
The above table reveals that correlation value of PNB in the case of MAS and
return on total assets ratio is 0.68 which is positive high degree of correlation
and for HDFC it is -0.09, which shows negative very low degree of correlation.
The result reveals that implementation of MAS increasing the return on total
assets ratio high in PNB and negative very low degree in HDFC.
So, in PNB the profitability increases with the high score of MAS. Though the
profitability is 46% it depends on MAS. Here, it is clear that the PNB is far better
than HDFC.

CHAPTER -5 Relationship of MAS with Employee’s Productivity and Profitability
131
The overall profitability ratio is calculated by dividing profit before tax by capital
employed.
Table no.5.12 shows Computation of Overall Profitability Ratio of both the banks.
(Rs in crore)
Computation of Return on Total Assets- PNB and HDFC Bank
Years
PNB
HDFC Bank
PB
T
CE
(%)
OP
R
MA
S
PB
T
CE
(%)
OP
R
MA
S
20
05
-06
214
0.5
4
135
72
615
15
1.5
8
76
.6
125
3.5
1
65
65
.9
1.9
1
58
.6
20
06
-07
22
68
.80
152
24
29
87
6
1.4
2
76
.9
163
8.7
7
77
54
6.4
8
2.1
1
58
.7
20
07
-08
35
00
.63
184
22
213
20
1.7
9
72
.8
22
80
.63
116
74
4.6
9
1.9
5
59
.3
20
08
-09
49
16.9
9
23
68
22
93
73
2.0
8
76
.5
32
99
.25
167
02
84
910
1.9
8
59
20
09
-10
60
42
.66
28
62
137
57
2
2.1
1
84
.9
42
89
.14
20
184
26
25
6
2.1
2
58
.9
Source: Computed from the Annual reports, MAS (Scores)
CHAPTER -5 Relationship of MAS with Employee’s Productivity and Profitability
132
On the basis of the above table the correlation between MAS and Overall
Profitability Ratio of two banks is shown in table below:
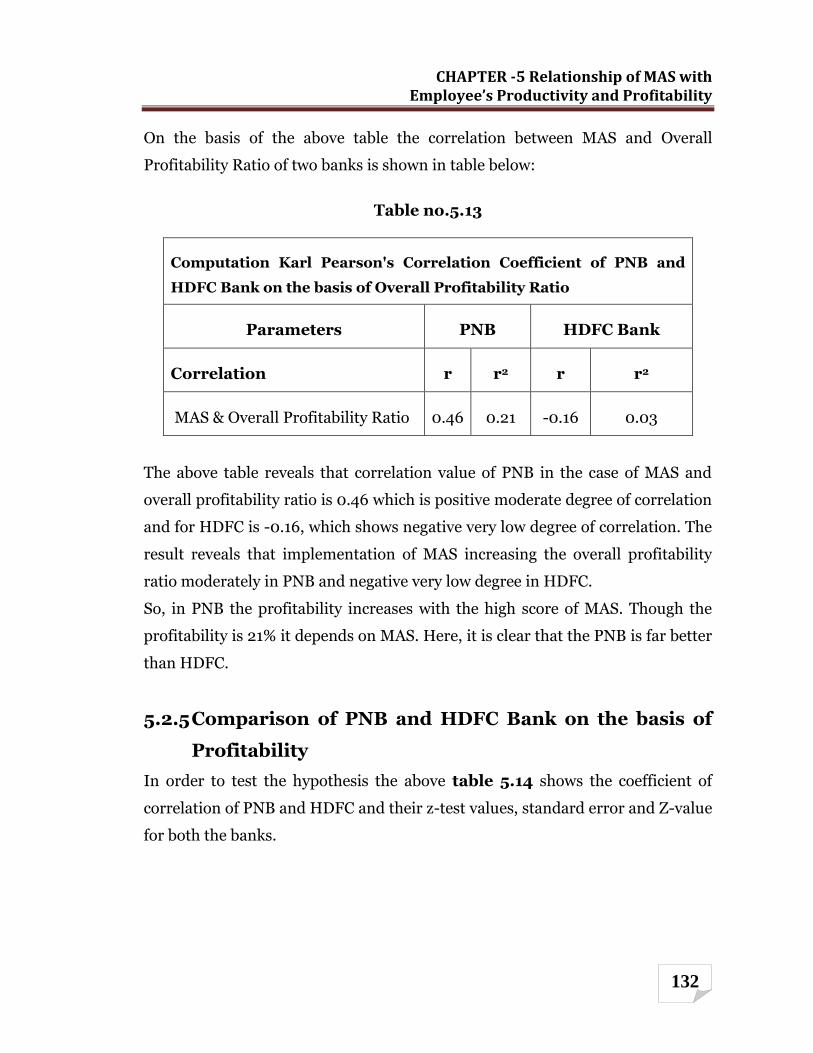
Table no.5.13
Computation Karl Pearson's Correlation Coefficient of PNB and
HDFC Bank on the basis of Overall Profitability Ratio
Parameters PNB HDFC Bank
Correlation r r2 r r2
MAS & Overall Profitability Ratio 0.46 0.21 -0.16 0.03
The above table reveals that correlation value of PNB in the case of MAS and
overall profitability ratio is 0.46 which is positive moderate degree of correlation
and for HDFC is -0.16, which shows negative very low degree of correlation. The
result reveals that implementation of MAS increasing the overall profitability
ratio moderately in PNB and negative very low degree in HDFC.
So, in PNB the profitability increases with the high score of MAS. Though the
profitability is 21% it depends on MAS. Here, it is clear that the PNB is far better
than HDFC.
5.2.5 Comparison of PNB and HDFC Bank on the basis of
Profitability
In order to test the hypothesis the above table 5.14 shows the coefficient of
correlation of PNB and HDFC and their z-test values, standard error and Z-value
for both the banks.
CHAPTER -5 Relationship of MAS with Employee’s Productivity and Profitability
133
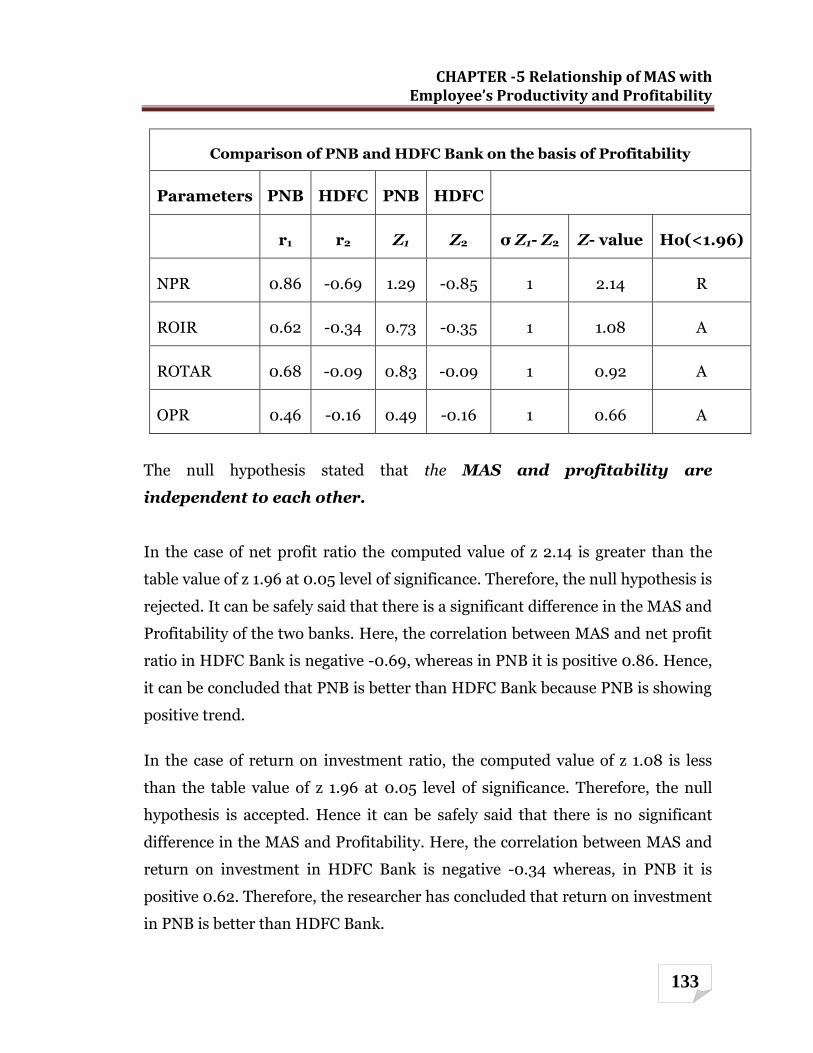
Comparison of PNB and HDFC Bank on the basis of Profitability
Parameters PNB HDFC PNB HDFC
r1 r2 Z1 Z2 σ Z1- Z2 Z- value Ho(<1.96)
NPR 0.86 -0.69 1.29 -0.85 1 2.14 R
ROIR 0.62 -0.34 0.73 -0.35 1 1.08 A
ROTAR 0.68 -0.09 0.83 -0.09 1 0.92 A
OPR 0.46 -0.16 0.49 -0.16 1 0.66 A
The null hypothesis stated that the MAS and profitability are
independent to each other.
In the case of net profit ratio the computed value of z 2.14 is greater than the
table value of z 1.96 at 0.05 level of significance. Therefore, the null hypothesis is
rejected. It can be safely said that there is a significant difference in the MAS and
Profitability of the two banks. Here, the correlation between MAS and net profit
ratio in HDFC Bank is negative -0.69, whereas in PNB it is positive 0.86. Hence,
it can be concluded that PNB is better than HDFC Bank because PNB is showing
positive trend.
In the case of return on investment ratio, the computed value of z 1.08 is less
than the table value of z 1.96 at 0.05 level of significance. Therefore, the null
hypothesis is accepted. Hence it can be safely said that there is no significant
difference in the MAS and Profitability. Here, the correlation between MAS and
return on investment in HDFC Bank is negative -0.34 whereas, in PNB it is
positive 0.62. Therefore, the researcher has concluded that return on investment
in PNB is better than HDFC Bank.
CHAPTER -5 Relationship of MAS with Employee’s Productivity and Profitability
134
In the case of return on total assets ratio the computed value of z 0.92 is less
than the table value of z 1.96 at 0.05 level of significance. Therefore, the null
hypothesis is accepted. Hence it can be safely said that there is insignificant
difference in the MAS and Profitability. Here, the correlation between MAS and
return on total assets in HDFC Bank is negative -0.09, whereasin PNB it is
positive 0.68. Therefore, the researcher has concluded that return on total assets
in PNB is better than HDFC Bank.
In the case of overall profitability ratio, the computed value of z 0.66 is less than
the table value of z 1.96 at 0.05 level of significance. Therefore, the null
hypothesis is accepted. Hence it can be safely said that there is insignificant
difference in the MAS and Profitability. Here, the correlation between MAS and
overall profitability in HDFC Bank is negative -0.16. However, in PNB it is
positive 0.46. Therefore, the researcher has concluded that overall profitability
in PNB is better than HDFC Bank.
CHAPTER -5 Relationship of MAS with Employee’s Productivity and Profitability
135
REFERENCES
1. A. J. Field, “The Concise Encyclopedia of Economics: Productivity"; 2008.
2. Annual reports of PNB.
3. Annual reports of HDFC Bank.
4. C.R.Kothari, Research Methodology- Methods and Techniques: New age
international (P) Ltd. Publishers.2nd Edition 2008
5. Gallup: Q12 Employee Engagement Surve2.
6. Harward&Upto, “Introduction to Business Finance”, McGraw Hill, New
York, 1961.
7. I. M. Pandey, “Financial Management”, 2002, Vikas Publishing House
Pvt.Ltd. New Delhi.
8. International Operations Management. Copenhagen, Denmark:
Copenhagen Business School Press, 2002.
9. Investor words.com.1
10. www.investors words.com.
11. K.K.Sharma, Arun Kumar, AlkaChaudhary-Statistics in Management
Studies: Krishna Prakashan Media (P) Ltd. 9th Edition 2008. Page no.8.212.
12. M. Y. Khan & P K Jain, “Financial Management – Text and Problems”, Tata
McGraw – Hill Publishing Company Limited, New Delhi, 2003.
13. New Economy Index: Technology, Innovation & New Economy Project.
14. P. Krugman,"The Age of Diminished Expectations: U.S. Economic Policy in
the 1990s";1997.
15. Plenert, Gerhard. The eManager: Value Chain Management in an
ecommerce World. Dublin, Ireland: Blackhall Publishing, 2001.
16. Productivity- Wikipedia.
17. Profitability-Wikipedia.
18. R.P.Varshney, Business Statistics: Jawahar Publication-Agra 5th Edition
2009-10.page,72.

CHAPTER -5 Relationship of MAS with Employee’s Productivity and Profitability
136
19. S.P.Guta, M.K.Gupta. Business Statistics: Sultan Chand & Sons Publishers
New Delhi 4th Edition. Page no.199,204, 525-526.
20. Stevenson, William J. Production and Operations Management. Boston,
MA: Irwin McGraw-Hill, 1999.
21. Vora, Jay A. "Productivity and Performance Measures: Who Uses Them."
Production and Inventory Management Journal 33, no. 1 (1992): 46-49.
22. www.businessdictionary.com.


![2 Movie Mas Febrero [Movie Mas Com]](https://img.pdfslide.us/doc/110x75/55947db61a28abb91b8b4698/2-movie-mas-febrero-movie-mas-com.jpg)