Embed Size (px)
Citation preview

Molecules 2015, 20, 9455-9467; doi:10.3390/molecules20059455
molecules ISSN 1420-3049
www.mdpi.com/journal/molecules
Article
Relationship between High-Performance Liquid Chromatography Fingerprints and Uric Acid-Lowering Activities of Cichorium intybus L.
Chun-Sheng Zhu, Bing Zhang *, Zhi-Jian Lin *, Xue-Jie Wang, Yue Zhou, Xiao-Xia Sun and
Ming-Liang Xiao
School of Chinese Pharmacy, Beijing University of Chinese Medicine, Beijing 100102, China;
E-Mails: [email protected] (C.-S.Z.); [email protected] (X.-J.W.);
[email protected] (Y.Z.); [email protected] (X.-X.S.);
[email protected] (M.-L.X.)
* Authors to whom correspondence should be addressed; E-Mails: [email protected] (B.Z.);
[email protected] (Z.-J.L.); Tel.: +86-10-6428-6335 (B.Z.); +86-10-8473-8606 (Z.-J.L.).
Academic Editor: Derek J. McPhee
Received: 26 March 2015 / Accepted: 18 May 2015 / Published: 22 May 2015
Abstract: This study aimed to explore the spectrum-effect relationships between
high-performance liquid chromatography fingerprints and the uric acid-lowering activities
of chicory. Chemical fingerprints of chicory samples from ten different sources were
determined by high-performance liquid chromatography, and then investigated by similarity
analysis and hierarchical clustering analysis. Pharmacodynamics experiments were
conducted in animals to obtain the uric acid-lowering activity information of each chicory
sample. The spectrum-effect relationships between chemical fingerprints and the uric
acid-lowering activities of chicory were established by canonical correlation analysis. The
structures of potential effective peaks were identified by liquid chromatography with tandem
mass spectrometry. The results showed that a close correlation existed between the spectrum
and effect of chicory. Aesculin, chlorogenic acid, chicoric acid, isochlorogenic acid A/B/C
and 13,14-seco-stigma5(6),14(15)-diene-3α-ol might be the main effective constituents.
This work provides a general model of the combination of high-performance liquid
chromatography and uric acid-lowering activities to study the spectrum-effect relationships
of chicory, which can be used to discover the principle components responsible for
the bioactivity.
OPEN ACCESS

Molecules 2015, 20 9456
Keywords: chicory; spectrum-effect relationships; uric acid-lowering
1. Introduction
Cichorium intybus L., commonly known as chicory, is a perennial herb of the Asteraceae family. In
the last years, there has been a growing interest in chicory due to its broad pharmacological action,
including antibacterial, anti-inflammatory, anti-oxidant, antidiabetic, hepatoprotective, antitumor,
anti-hyperlipidemic, hypoglycemic effects and so on [1–5]. Chicory contains a number of medicinally
important phytoconstituents, mainly belonging to the alkaloid, phenolic acid, sesquiterpene lactone,
aliphatic compounds and their derivatives, volatile oil, flavonoid, and polysaccharide classes, etc. [6,7].
Historically, chicory was grown by the ancient Egyptians as a medicinal plant, vegetable, and forage plant,
etc. [6]. Nowadays, its leaves and roots are still often used for making salads and vegetable dishes, while
the roots can also be processed and used as a coffee substitute or food ingredient. According to the FDA,
chicory extract fits the category of “generally regarded as safe” (GRAS) and appears in the list of
Everything Added to Food in the United States (EAFUS) [8]. In addition, some studies have proved the
health benefits of chicory when used as a food or medicinal plant [9]. For instance, in India, the whorls
are made into a decoction and used for the treatment of liver disorders, gout and rheumatism [6].
Uric acid (UA) is the end product of nucleic acid metabolism. When the blood UA levels exceed the
normal reference interval the resulting condition is generally defined as hyperuricemia. A number of
epidemiological reports have revealed that hyperuricemia is not only the central biochemical cause of
gout, but also a precursor of cardiovascular diseases, including hypertension, coronary artery disease,
cerebrovascular disease and vascular dementia [10,11]. High blood uric acid levels also have a close
relationship with kidney disease and metabolic syndrome [11]. In our previous research, quail was used
to establish a hyperuricemia model, because its UA metabolic process is similar to humans’, that is, both
quail and humans cannot oxidize UA into the more soluble compound allantoin due to their lack of the
enzyme uricase [12–14]. In previous studies, we found chicory could reduce serum UA levels, inhibit
liver xanthine dehydrogenase and xanthine oxidase in quail [15]. However, to the best of our knowledge,
little information on the systematic quality evaluation of chicory, and the major effective components in
the UA-lowering actions remain unclear so far.
As an important analytical method, high-performance liquid chromatography (HPLC) has been
widely applied to assess the quality of herbal medicines for its convenience to operate, fully automatable
technique with high resolution, selectivity, sensitivity as well as accuracy [16]. Liquid chromatography
with tandem mass spectrometry (LC/MSn) detection provides useful structural information, distinguishes
compounds with identical molecular weights, and allows for tentative compound identification when
standard reference compounds are unavailable. All these characteristics make LC/MSn a powerful tool
for mapping the chemical profiling of herbal medicines [17]. Therefore, in this study, HPLC is applied
to establish the fingerprints of chicory samples from different sources and collection times. Serum UA
is selected to evaluate the therapeutic effects of chicory in the treatment of hyperuricemia. By the
combination of HPLC fingerprints with UA-lowering activities, the spectrum-effect relationships of
chicory were investigated to screen the effective components with UA-lowering activities. The chemical
Molecules 2015, 20 9457
structures of the screened effective components were determined by LC/MSn. This study aims to reveal
the effective components of chicory for the treatment of hyperuricemia and quality control of chicory,
and provide a useful model for screening effective components from herbal medicine as well.
2. Results and Discussion
2.1. HPLC Experiment Results
2.1.1. HPLC Experiments
The methodology validation results showed that the precision of the same sample solution was in the
range of 0.02%–0.13% for retention times (tR) and 0.87%–4.36% for peak areas of common peaks. The
repeatability of this experiment was in the range of 0.02%–0.23% for tR and 0.85%–4.83% for peak areas
of common peaks. The sample stability was below 0.21% for tR and 5% for peak areas of common peaks.
All results indicated that the developed HPLC fingerprint method was valid and suitable for the sample
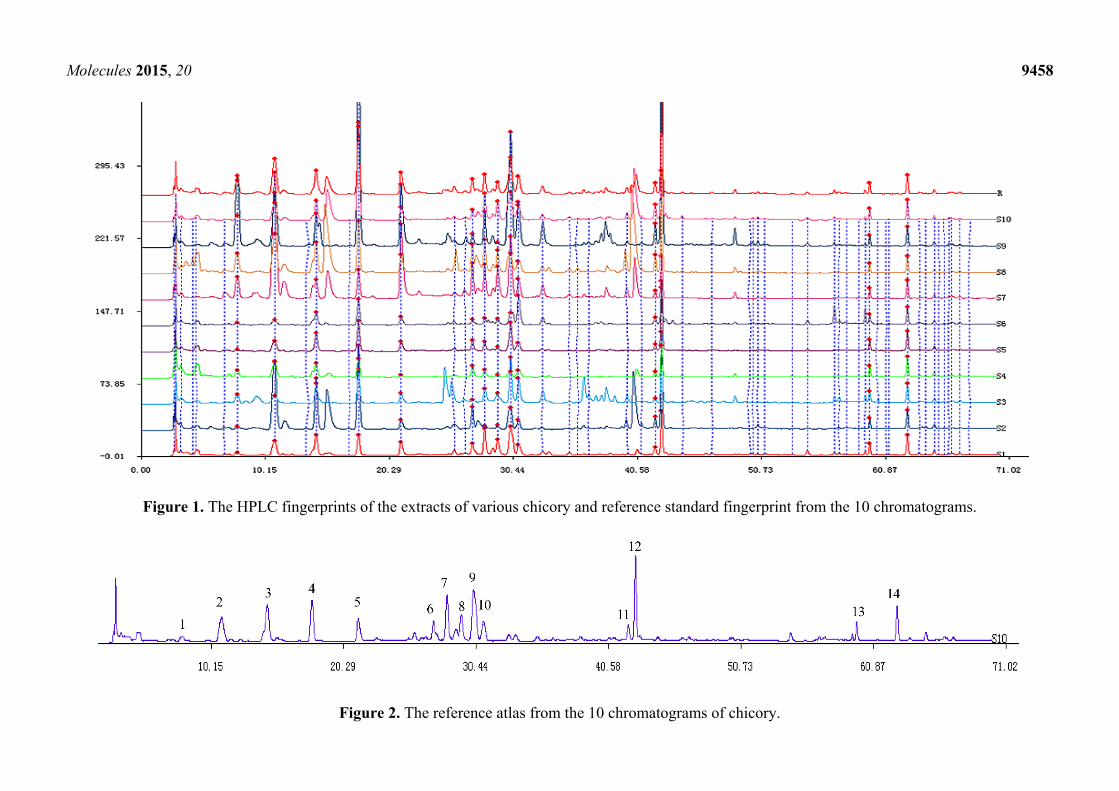
analysis. The optimized HPLC fingerprints of ten chicory samples and the reference standard fingerprint
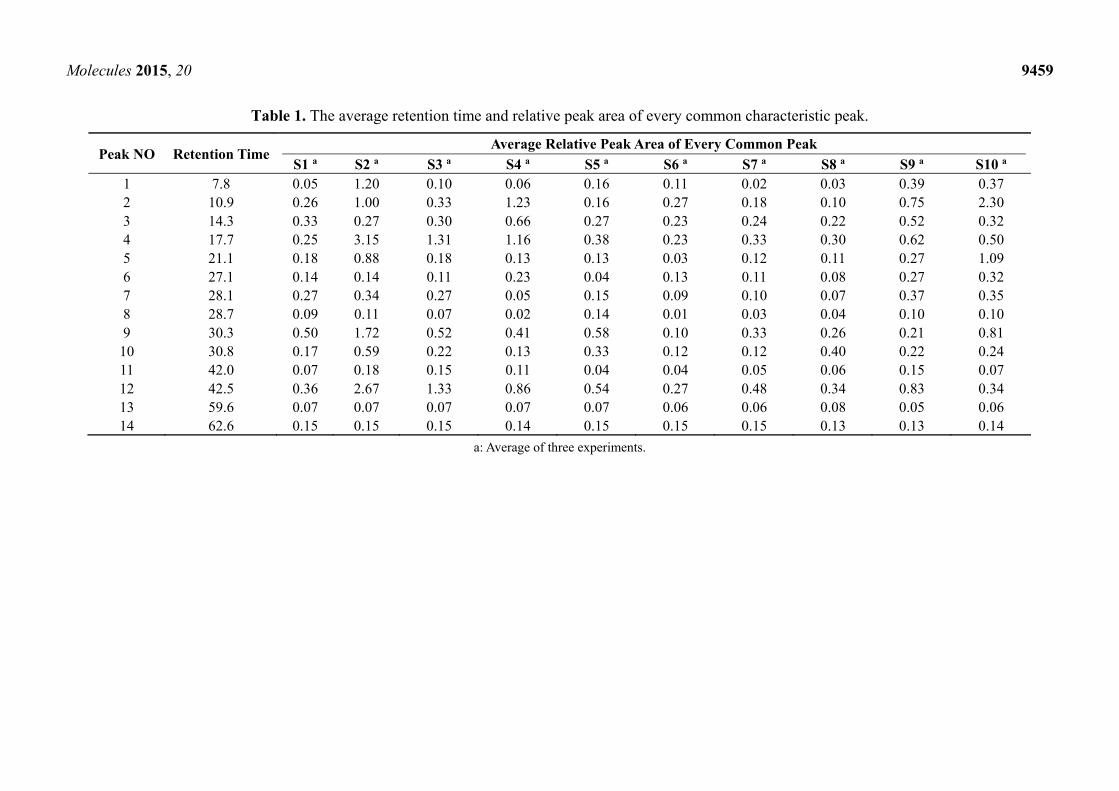
are shown in Figure 1. Fourteen peaks with large areas and good segregations were selected as the
‘common peaks’ (Figure 2). Peak 2 from S2 was defined as the reference peak to calculate the relative
peak areas of other common peaks. Table 1 shows the relative average peak area and tR of fourteen
common characteristic peaks.
2.1.2. Similarity of Fingerprints
The similarities between the reference standard fingerprint and the chromatographic fingerprints from
ten batches of chicory samples were compared, and their similarity values were 0.89, 0.92, 0.92, 0.92,
0.80, 0.80, 0.93, 0.85, 0.80 and 0.76, respectively. The differences of correlation coefficients further
showed variation of the fingerprints and internal qualities of these samples.
2.1.3. Results of HCA
HCA is a well-known method for discriminating different samples which has been widely used in
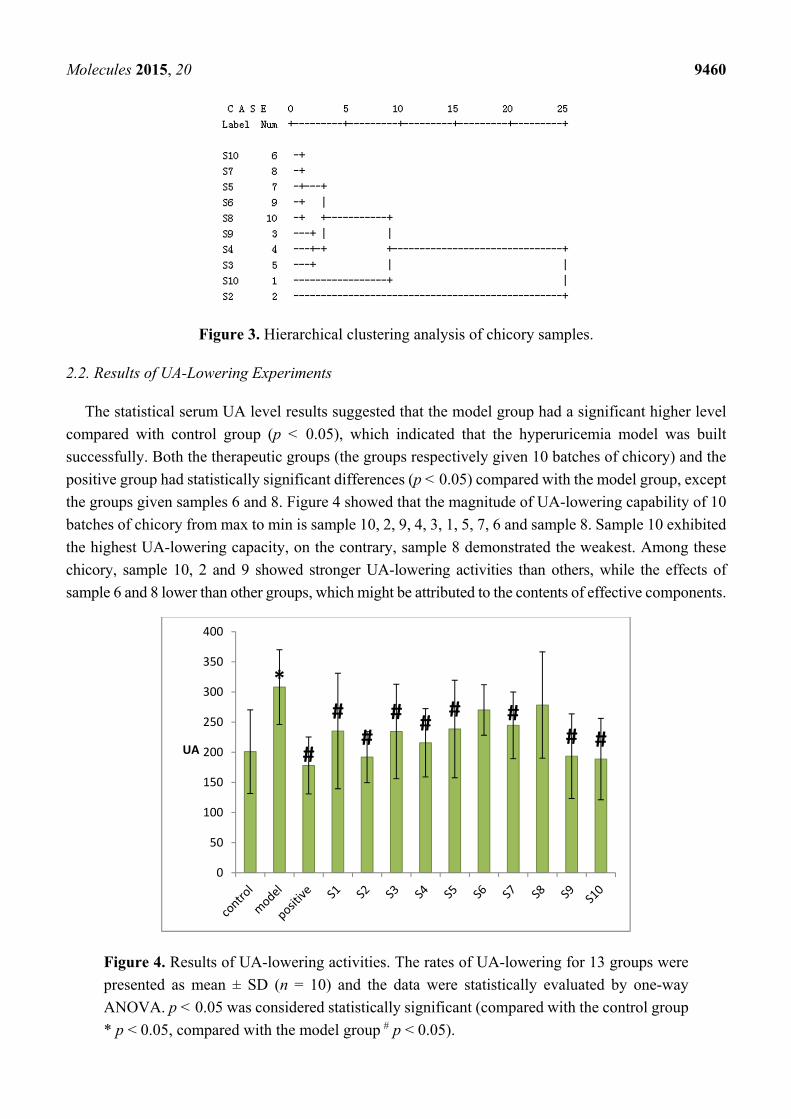
classification according to the common peaks. The results of HCA in Figure 3 clearly show that the
samples could be divided into three clusters. Cluster I consisted of sample 2, which was collected from
Haidian, Beijing. Cluster II included sample 10, which was purchased from Changji, Xinjiang. Cluster
III included sample 1, 3, 4, 5, 6, 7, 8 and sample 9, which were respectively collected or purchased from
Dalian, Liaoning; Dengta, Liaoning; Zhaoqing, Heilongjiang; Moyu, Xinjiang; Neimenggu; Pingshan,
Hebei; Shouguang, Shandong; Changji, Xinjiang . The results may be attributed to different conditions
of climate, soil and light, etc. For example, sample 2 (from Haidian, Beijing) and sample 8 (from
Shouguang, Shandong) were divided into different clusters, this means that the origin might affect the
quality of chicory.
Molecules 2015, 20 9458
Figure 1. The HPLC fingerprints of the extracts of various chicory and reference standard fingerprint from the 10 chromatograms.
Figure 2. The reference atlas from the 10 chromatograms of chicory.
Molecules 2015, 20 9459
Table 1. The average retention time and relative peak area of every common characteristic peak.
Peak NO Retention Time Average Relative Peak Area of Every Common Peak
S1 a S2 a S3 a S4 a S5 a S6 a S7 a S8 a S9 a S10 a 1 7.8 0.05 1.20 0.10 0.06 0.16 0.11 0.02 0.03 0.39 0.37 2 10.9 0.26 1.00 0.33 1.23 0.16 0.27 0.18 0.10 0.75 2.30 3 14.3 0.33 0.27 0.30 0.66 0.27 0.23 0.24 0.22 0.52 0.32 4 17.7 0.25 3.15 1.31 1.16 0.38 0.23 0.33 0.30 0.62 0.50 5 21.1 0.18 0.88 0.18 0.13 0.13 0.03 0.12 0.11 0.27 1.09 6 27.1 0.14 0.14 0.11 0.23 0.04 0.13 0.11 0.08 0.27 0.32 7 28.1 0.27 0.34 0.27 0.05 0.15 0.09 0.10 0.07 0.37 0.35 8 28.7 0.09 0.11 0.07 0.02 0.14 0.01 0.03 0.04 0.10 0.10 9 30.3 0.50 1.72 0.52 0.41 0.58 0.10 0.33 0.26 0.21 0.81
10 30.8 0.17 0.59 0.22 0.13 0.33 0.12 0.12 0.40 0.22 0.24 11 42.0 0.07 0.18 0.15 0.11 0.04 0.04 0.05 0.06 0.15 0.07 12 42.5 0.36 2.67 1.33 0.86 0.54 0.27 0.48 0.34 0.83 0.34 13 59.6 0.07 0.07 0.07 0.07 0.07 0.06 0.06 0.08 0.05 0.06 14 62.6 0.15 0.15 0.15 0.14 0.15 0.15 0.15 0.13 0.13 0.14
a: Average of three experiments.
Molecules 2015, 20 9460
Figure 3. Hierarchical clustering analysis of chicory samples.
2.2. Results of UA-Lowering Experiments
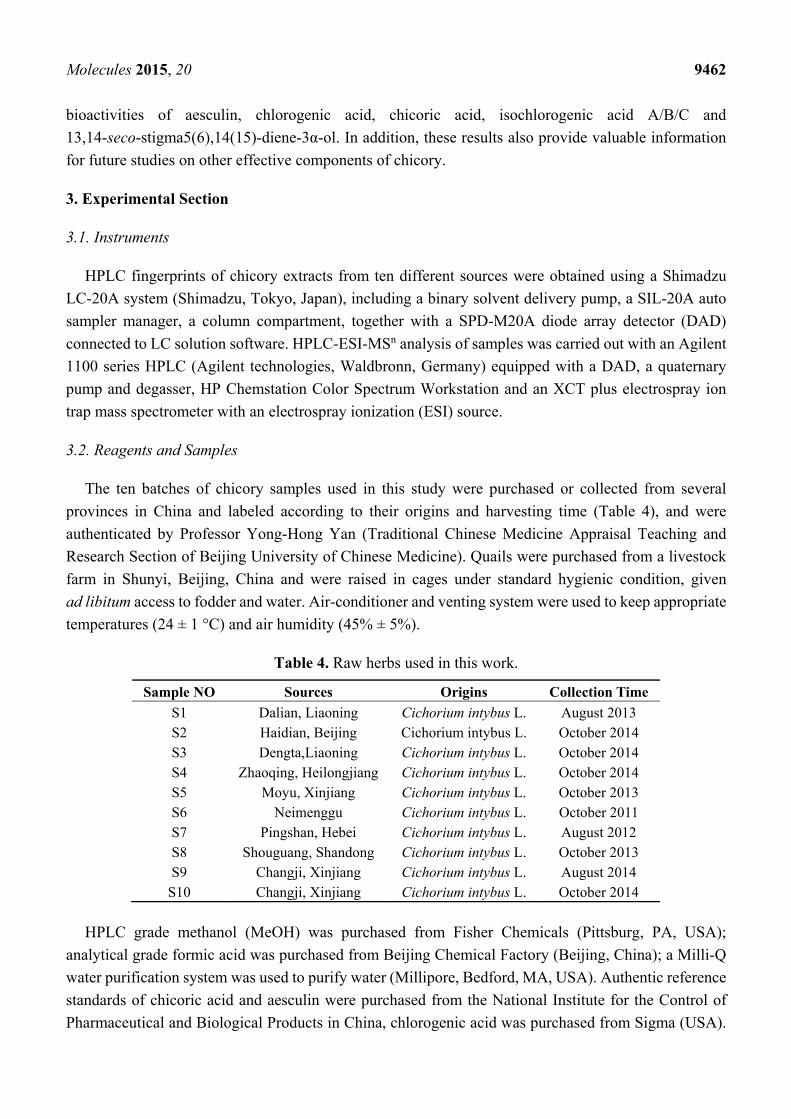
The statistical serum UA level results suggested that the model group had a significant higher level
compared with control group (p < 0.05), which indicated that the hyperuricemia model was built
successfully. Both the therapeutic groups (the groups respectively given 10 batches of chicory) and the
positive group had statistically significant differences (p < 0.05) compared with the model group, except
the groups given samples 6 and 8. Figure 4 showed that the magnitude of UA-lowering capability of 10
batches of chicory from max to min is sample 10, 2, 9, 4, 3, 1, 5, 7, 6 and sample 8. Sample 10 exhibited
the highest UA-lowering capacity, on the contrary, sample 8 demonstrated the weakest. Among these
chicory, sample 10, 2 and 9 showed stronger UA-lowering activities than others, while the effects of
sample 6 and 8 lower than other groups, which might be attributed to the contents of effective components.
Figure 4. Results of UA-lowering activities. The rates of UA-lowering for 13 groups were
presented as mean ± SD (n = 10) and the data were statistically evaluated by one-way
ANOVA. p < 0.05 was considered statistically significant (compared with the control group
* p < 0.05, compared with the model group # p < 0.05).
*
#
##
# ## #
# #
0
50
100
150
200
250
300
350
400
UA

Molecules 2015, 20 9461
2.3. Spectrum-Effect Relationships between HPLC Fingerprints and UA-Lowering Activities
In this paper, canonical correlation analysis was employed to deal with the spectrum-effect
relationships of chicory, which has been proved to be simple and operative. The canonical correlation
analysis between UA-lowering activities and peak areas of fourteen common characteristic peaks in the
HPLC fingerprints was achieved using the SPSS 17.0 statistical software. The results showed that peak
1, 2, 5, 6, 7 and 11 in HPLC fingerprints possess a close correlation on the UA-lowering activities of
chicory, and these peaks might be the main effective components of UA-lowering (Table 2).
Interestingly, peak 11 significantly influenced UA levels although its peak area (content) was small.
Conversely, peak 3, 4 and 12 elicited a slight influence on UA level although their peak areas (contents)
were large. Samples 2, 9 and 10 were the top three in peak areas of peaks 2 and 5, and coincidentally,
they were also the top three in UA-lowering activities. The results indicated that peaks 2 and 5 exhibited
a conspicuous effect on the UA-lowering activities.
Table 2. The correlation coefficient between UA-lowering and common characteristic peaks.
Peak NO. Correlation Coefficient Peak NO. Correlation Coefficient
1 0.64 8 0.53 2 0.76 9 0.58 3 0.50 10 0.23 4 0.52 11 0.62 5 0.74 12 0.50 6 0.73 13 −0.49 7 0.76 14 −0.33
2.4. Results of Chemical Structure Analysis
Peak identification and assignment in HPLC fingerprints of chicory were based on the comparison of
their tR, HPLC data, MS ion data with reference compounds and previously obtained data [18–20].
Table 3 lists the chemical structures of potential effective components.
Table 3. Identification of effective components in chicory by HPLC-DAD-ESI-MS3.
Peak tR
(min) M
[M−H]−
(m/z)
MS-MS
(m/z) MS3 (m/z) Tentative Identification
1 7.8 340 339.0 176.9 133.0 Aesculin
2 10.9 354 353.1 190.9 172.8, 154.9, 129.0 Chlorogenic acid
5 21.1 474 473.0 310.9 178.9, 148.9 Chicoric acid
6 27.1 516 515.2 353.0 190.9 Isochlorogenic acid A/B/C
7 28.1 516 515.2 353.0, 191.1 179.0, 135.1 Isochlorogenic acid A/B/C
11 42.0 414 412.6 259.0 199.9, 187.0, 171.0, 131.1 13,14-seco-stigma5(6),14(15)-diene-3α-ol
The results showed that aesculin, chlorogenic acid, chicoric acid, isochlorogenic acid A/B/C and
13,14-seco-stigma5(6),14(15)-diene-3α-ol have a close correlation with UA-lowering activities. However,
whether the indicating peaks potentially responsible for the given activity are the published effective
components or some new one remains unanswered. We future studies we will investigate the
Molecules 2015, 20 9462
bioactivities of aesculin, chlorogenic acid, chicoric acid, isochlorogenic acid A/B/C and
13,14-seco-stigma5(6),14(15)-diene-3α-ol. In addition, these results also provide valuable information
for future studies on other effective components of chicory.
3. Experimental Section
3.1. Instruments
HPLC fingerprints of chicory extracts from ten different sources were obtained using a Shimadzu
LC-20A system (Shimadzu, Tokyo, Japan), including a binary solvent delivery pump, a SIL-20A auto
sampler manager, a column compartment, together with a SPD-M20A diode array detector (DAD)
connected to LC solution software. HPLC-ESI-MSn analysis of samples was carried out with an Agilent
1100 series HPLC (Agilent technologies, Waldbronn, Germany) equipped with a DAD, a quaternary
pump and degasser, HP Chemstation Color Spectrum Workstation and an XCT plus electrospray ion
trap mass spectrometer with an electrospray ionization (ESI) source.
3.2. Reagents and Samples
The ten batches of chicory samples used in this study were purchased or collected from several
provinces in China and labeled according to their origins and harvesting time (Table 4), and were
authenticated by Professor Yong-Hong Yan (Traditional Chinese Medicine Appraisal Teaching and
Research Section of Beijing University of Chinese Medicine). Quails were purchased from a livestock
farm in Shunyi, Beijing, China and were raised in cages under standard hygienic condition, given
ad libitum access to fodder and water. Air-conditioner and venting system were used to keep appropriate
temperatures (24 ± 1 °C) and air humidity (45% ± 5%).
Table 4. Raw herbs used in this work.
Sample NO Sources Origins Collection Time
S1 Dalian, Liaoning Cichorium intybus L. August 2013 S2 Haidian, Beijing Cichorium intybus L. October 2014 S3 Dengta,Liaoning Cichorium intybus L. October 2014 S4 Zhaoqing, Heilongjiang Cichorium intybus L. October 2014 S5 Moyu, Xinjiang Cichorium intybus L. October 2013 S6 Neimenggu Cichorium intybus L. October 2011 S7 Pingshan, Hebei Cichorium intybus L. August 2012 S8 Shouguang, Shandong Cichorium intybus L. October 2013 S9 Changji, Xinjiang Cichorium intybus L. August 2014
S10 Changji, Xinjiang Cichorium intybus L. October 2014
HPLC grade methanol (MeOH) was purchased from Fisher Chemicals (Pittsburg, PA, USA);
analytical grade formic acid was purchased from Beijing Chemical Factory (Beijing, China); a Milli-Q
water purification system was used to purify water (Millipore, Bedford, MA, USA). Authentic reference
standards of chicoric acid and aesculin were purchased from the National Institute for the Control of
Pharmaceutical and Biological Products in China, chlorogenic acid was purchased from Sigma (USA).
Molecules 2015, 20 9463
Yeast extract powder (Basingstoke, Hampshire, UK) was used to build the hyperuricemia quail model
(15 g·kg−1 once a day) [21]. UA reagent kit was purchased from Biosino Bio-Technology and Science
Inc. (Beijing, China; Product No. 141161). Benzbromarone was purchased from Excella GmbH (Feucht,
Germany; Product No. 1208248).
3.3. HPLC Fingerprints
3.3.1. HPLC Conditions
The samples were injected into the HPLC system. Chromatography was carried out on an Agilent
ZORBAX SB-C18 column (4.6 mm × 250 mm, 5 μm), operated at 30 °C The mobile phase was
composed of 0.1% formic acid water solution (A) and MeOH (B) system with a gradient elution:
0–2 min, 23% B; 2–15 min, 23%–33% B; 15–20 min, 33%–40% B; 20–27 min, 40%–42% B;
27–40 min, 42%–60% B; 40–50 min, 60%–70% B; 50–51 min, 70%–78% B; 51–60 min, 78%–85% B;
and 60–70 min, 85%–90% B. The detection wavelength was set at 254 nm and the sample injection
volume was 10 μL. Under the present chromatographic conditions, higher resolution could be achieved
for most of the peaks.
3.3.2. HPLC-ESI-MS Conditions
The above HPLC system was interfaced with an Agilent 1100 LC/MSD Trap XCT ESI (Agilent
Technologies, Waldbronn, Germany). The HPLC–MS analysis was performed under the same gradient
program as HPLC-DAD using 0.1% (v/v) formic acid water solution (A) and MeOH (B). The ESI–MS
spectra were acquired in negative mode and using the full scan mode from m/z 100 to 1000. Capillary
voltage was 3.5 kV. Drying gas temperature was set at 350°C with a flow rate of 11.0 L/min and nebulizing
pressure was of 35.0 psi. Data was processed by HPLC/MSD Trap v. 4.2 software and Data Analysis 2.2.
3.3.3. Preparation of Reference Standard Solution
Standard solutions were prepared by adding accurately weighed amounts of chicoric acid, chlorogenic
acid and aesculin to a volumetric flask and dissolving with MeOH (50 mL) to give final concentrations
of 51.2 μg/mL, 39.0 μg/mL and 44.6 μg/mL respectively.
3.3.4. Preparation of Sample Solution
Chicory was crushed into powder, and 250 g of the powder was accurately weighed and extracted
with 2.5 L of water by heating to reflux for 1 h. The procedure was repeated twice. After extraction, the
solution was filtered, then concentrated by a rotary evaporator, and diluted to 600 mL with purified
water. Aliquots (2 mL) were taken and then filtered through a 0.45 μm micropore film to yield the sample
solutions for HPLC analysis. The procedure was repeated in triplicate. The preparation of all
10 samples was performed in the same way.
Molecules 2015, 20 9464
3.4. Analysis of HPLC Fingerprints
3.4.1. Validation of the Methodology
According to the established method programs, method precision and repeatability were evaluated by
analyzing five replicate injections of sample 1 and injections of five samples prepared independently
from sample 1 (Table 1), respectively. The stability study of sample 1 was performed at different
intervals over 24 h (0, 2, 4, 8, 16, and 24 h).
3.4.2. Similarity of HPLC Analysis
Devised by the Chinese Pharmacopoeia Committee, the HPLC similarity evaluation system (Version
2004A) automatically matched HPLC fingerprints for chromatographic fingerprints of traditional
Chinese medicines by a ‘similarity evaluation’ system, and then formed the reference atlas using the
median method from the general comparison of the chromatograms of ten batches of chicory extracts.
Similarity values between the reference fingerprint and the chromatograms of chicory extracts were
calculated by the software.
3.4.3. Hierarchical Clustering Analysis (HCA)
HCA is a multivariate analysis technique which is used to sort samples into groups. In this study, the
HCA of sample 1–10 was performed using SPSS statistics software (SPSS for Windows 17.0, SPSS
Inc., Chicago, IL, USA). The Average Linkage method was applied as the amalgamation rule and the
squared Euclidean distance as metric was used to establish clusters.
3.5. UA-Lowering Animal Experiment
3.5.1. Animal Experiment Procedure
A total of 130 quails (38 days of age) were randomly distributed to 13 groups, including control
group, model group, therapeutic groups, and positive group, with 10 birds in each group. Quails in the
model group were given yeast extract powder diet and received no drug treatment; quails in the control
group were given a regular diet and received no drug treatment; quails in the 10 therapeutic groups were
given yeast extract powder diet and received 10 batches of chicory 5 g kg−1 once a day as treatment,
respectively; quails in the positive group were given yeast extract powder diet and received
benzbromarone 20 mg kg−1 once a day as treatment. All quails were given unlimited access to diet and
water, blood was taken once a week after fasting 12 h and they were sacrificed after 3 weeks. The
experimental design was approved by the Laboratory Animal Management Committee of Beijing
University of Chinese Medicine and conformed to the guidelines of the Institutional Animal Care and
Use Committee of China.
3.5.2. Determination of UA
All of the groups were evaluated based on serum UA level, which was measured with a UA kit. The
serum UA values from different groups were presented as mean ± standard deviation (SD, n = 10)
Molecules 2015, 20 9465
and were evaluated by one-way analysis of variance (ANOVA), where p < 0.05 was considered
statistically significant.
3.6. Spectrum-Effect Relationships Analysis
Canonical correlation analysis is to further evaluate the spectrum-effect relationships between the
values of peak areas in HPLC fingerprints and the values of UA from ten therapeutic groups by the SPSS
statistical software (SPSS for Windows 17.0).
4. Conclusions
In the study, HPLC fingerprints and UA-lowering activities were first combined to research the
spectrum-effect relationships of chicory, making it possible to evaluate the internal quality and the
potential effective compounds in chicory. The UA-lowering activities of chicory samples were closely
related to the main effective compounds, whose levels were affected by the natural conditions of the
producing regions. The results indicated that aesculin, chlorogenic acid, chicoric acid, isochlorogenic
acid A/B/C and 13,14-seco-stigma5(6),14(15)-diene-3α-ol might be responsible for the given activities.
The results from the study can also be used in evaluating the quality of chicory as well as providing a
theoretical foundation for further study on the biological activity of chicory. More importantly, research
on the relationships between HPLC fingerprints and pharmacodynamics of herbal medicines makes the
holistic evaluation of the internal quality possible. It also provides a rational approach for discovering
the potential effective components from complex mixtures. Above all, the study of spectrum-effect
relationships provides a powerful tool for the quality control of herbal medicines.
Acknowledgments
The authors are grateful to the support of National Science Foundation (81403152), Ministry of
Education Research Fund for the Doctoral Program (20130013120001, 20120013130002); Beijing
University of Chinese Medicine young teachers of special autonomy issue (2013-QNJSZX008); Beijing
University of Chinese medicine scientific research innovation team (2011-CXTD-014), Autonomous
Subject of Graduated Student from Beijing University of Chinese Medicine (2015-jxs-164).
Author Contributions
Chun-Sheng Zhu drafted and revised the manuscript, Bing Zhang, Zhi-Jian Lin, Xue-Jie Wang,
Yue Zhou, Xiao-Xia Sun, Ming-Liang Xiao made suggestions and played an important role in preparing
this paper, and all the authors approved the final version.
Conflicts of Interest
The authors declare no conflict of interest.

Molecules 2015, 20 9466
References
1. Papetti, A.; Mascherpa, D.; Carazzone, C.; Stauder, M.; Spratt, D.A.; Wilson, M.; Pratten, J.; Ciric, L.;
Lingström, P.; Zaura, E.; et al. Identification of organic acids in Cichorium intybus inhibiting
virulence-related properties of oral pathogenic bacteria. Food Chem. 2013, 138, 1706–1712.
2. Rozpądeka, P.; Wężowicza, K.; Stojakowskab, A.; Malarz, K. Mycorrhizal fungi modulate
phytochemical production and antioxidant activity of Cichorium intybus L. (Asteraceae) under
metal toxicity. Chemosphere 2014, 112, 217–224.
3. Saini, M.; Khani, A.A.; Bala, M.; Abding, M.Z.; Farooqi, H. Development of a validated HPTLC
method for quantification of Esculin in different fractions of Cichorium intybus leaf extract. Int. J.
Pharm. Pharm. Sci. 2014, 6, 278–282.
4. Shalini, S.; Mohamed, I.S.; Nahla, Z. Ameliorating effect of chicory (Chichorium intybus L.)
fruit extract against 4-tert-octylphenol induced liver injury and oxidative stress in male rats.
Food Chem. Toxicol. 2014, 72, 138–146.
5. Rasmussen, M.K.; Klausen, C.L.; Ekstrand, B. Regulation of cytochrome P450 mRNA expression
in primary porcine hepatocytes by selected secondary plant metabolites from chicory (Cichorium
intybus L.). Food Chem. 2014, 146, 255–263.
6. Street, R.A.; Sidana, J.; Prinsloo, G. Cichorium intybus: Traditional uses, phytochemistry,
pharmacology, and toxicology. Evid. -Based Complement. Altern. Med. 2013, 2013, 1439–1457.
7. Carazzone, C.; Mascherpa, D.; Gazzani, G.; Papetti, A. Identification of phenolic constituents in
red chicory salads (Cichorium intybus) by high-performance liquid chromatography with diode
array detection and electrospray ionisation tandem mass spectrometry. Food Chem. 2013, 138,
1062–1071.
8. Schmidt, B.M.; Ilic, N.; Poulev, A.; Raskin, I. Toxicological evaluation of a chicory root extract.
Food Chem. Toxicol. 2007, 45, 1131–1139.
9. Rammal, H.; Younos, C.; Bouayed, J.; Chakou, A.; Bedouhene, S.; Soulimani, R. Aperçu
ethnobotanique et phytopharmacologique sur Cichorium intybus L. Phytotherapie 2008, 6, 184–186.
10. Grassi, D.; Ferri, L.; Desideri, G.; Giosia, P.D.; Cheli, P.; Pinto, R.D.; Properzi, G.; Ferri, C. Chronic
hyperuricemia, uric acid deposit and cardiovascular risk. Curr. Pharm. Des. 2013, 19, 2432–2438.
11. Jin, M.; Yang, F.; Yang, I.; Yin, Y.; Luo, J.J.; Wang, H.; Yang, H.F. Uric Acid, Hyperuricemia and
Vascular Diseases. Front. Biosci. 2012, 17, 656–669.
12. Liu, X.Q.; Zhang, B.; Liu, C.M.; Hong, Q.T.; Zhang, H.J.; Kong, Y.; Tang, Y.P. First exploration
and establish hyperuricemia model of quail. Chin. J. Pathophysiol. 2001, 10, 1038–1040.
13. Lin, Z.J.; Zhang, B.; Liu, X.Q.; Jin, R; Zhu, W.J. Effects of Chicory Inulin on Serum Metabolites
of Uric Acid, Lipids, Glucose, and Abdominal Fat Deposition in Quails Induced by Purine-Rich
Diets. J. Med. Food 2014, 17, 1214–1221.
14. Huang, S.N.; Lin, Z.J.; Zhang, B.; Geng, D.; Niu, H.J.; Zhu, C.S.; Wang, X.J.; Sun, B.Y. Effect of
Chicory on Uric Acid and Uricopoiesis Metabolic Enzymes Activities of Hyperuricemia Quail.
Tradit. Chin. Drug Res. Clin. Pharm. 2015, 26, 9–13.
15. Lin, Z.J.; Zhang, B.; Liu, X.Q.; Huang, S.N.; Li, L.Y.; Wang, H.P. Experimental study of chicory
intervening hyperuricemia and abdominal obesity on quail model. CJTCMP 2014, 29, 2493–2497.
Molecules 2015, 20 9467
16. Jiao, Y.; Zuo, Y.G. Ultrasonic extraction and HPLC determination of anthraquinones, aloe-emodine,
emodine, rheine, chrysophanol, and physcione, in Radix Polygoni multiflori. Phytochem. Anal.
2009, 20, 272–278.
17. Ciminiello, P.; Dell’Aversano, C.; Iacovo, E.D.; Fattorusso, E.; Forino, M.; Grauso, L.; Tartaglione, L.
High Resolution LC-MSn Fragmentation Pattern of Palytoxin as Template to Gain New Insights
into Ovatoxin-a Structure. The Key Role of Calcium in MS Behavior of Palytoxins. J. Am. Soc.
Mass Spectrom. 2012, 23, 952–963.
18. Zou, L. Studies on Chemical Constituents of Cichorium intybus L. and Kleinhovia hospital L.
Master Thesis, Zhejiang University, Zhejiang, China, 2013.
19. Zhang, Q.; Zhang, J.Y.; Sui, C.L.; Shi, X.Y.; Qiao, Y.J.; Lu, J.Q. Regularity of changes in
chlorogenic acids in Lonicera japonica extracts by HPLC-DAD-ESI-MS/MS. Chin. J. CMM 2012,
23, 3564–3568.
20. Llorach, R.; Martínez-Sánchez, A.; Tomás-Barberán, F.A.; Gil, M.I.; Ferreres, F. Characterisation
of polyphenols and antioxidant properties of five lettuce varieties and escarole. Food Chem. 2008,
108, 1028–1038.
21. Zhang, B.; Liu, X.Q.; Ding, Z.L.; Kong, Y.; Wang, Y.; Sa, Y. Pathogenesis of hyperuricacidemia in
quail model. J. Beijing Univ. TCM 2006, 29, 595–598.
Sample Availability: Not available.
© 2015 by the authors; licensee MDPI, Basel, Switzerland. This article is an open access article
distributed under the terms and conditions of the Creative Commons Attribution license
(http://creativecommons.org/licenses/by/4.0/).