Embed Size (px)
Citation preview

RELATIONSHIP BETWEEN CHILD CENTERED PLAY THERAPY AND
DEVELOPMENTAL LEVELS OF YOUNG CHILDREN:
A SINGLE CASE ANALYSIS
April Garofano-Brown, MS
Dissertation Prepared for the Degree of
DOCTOR OF PHILOSOPHY
UNIVERSITY OF NORTH TEXAS
December 2007
APPROVED: Dee Ray, Major Professor Sue Bratton, Committee Member Carolyn Kern, Committee Member Jan Holden, Chair of the Department of
Counselor and Higher Education M. Jean Keller, Dean of the College Education Sandra L. Terrell, Dean of the Robert B.
Toulouse School of Graduate Studies

Garofano-Brown, April. Relationship between child centered play therapy and
developmental levels of young children: A single case analysis. Doctor of Philosophy
(Counseling). December 2007, 113 pages, 45 figures, 3 tables, references, 55 titles.
This study used a single case design to explore the relationship between individual
child-centered play therapy on children with developmental delays by examining its
effectiveness in: 1) increasing measured developmental age; 2) reducing problematic
behaviors related to developmental delays; and 3) increasing developmentally appropriate
behaviors. Three participants were assessed weekly with both developmental and behavioral
measures during the three phases of the study: baseline, intervention, and follow up.
Additionally, parents of the participants completed behavioral measures at pretest, midpoint,
and posttest administrations. The participant’s weekly standard scores were graphed and
results were examined separately using visual analyses. Changes between phases: non-
intervention baseline, intervention, and non-intervention follow-up were examined; specifically,
the level, trend, and variability of the data across the phases were examined. Each of the
three participants served as their own control group in this single case analysis and their
results, and all three of the participants demonstrated improvement on the developmental
measures after receiving the play therapy intervention. Results from this single case analysis
suggest the need for further replication, use and reporting of single case interventions and
designs, to promote the efficacy of counseling interventions and to potentially enhance the
literature and research base for evidence based interventions.

Copyright 2007
by
April Garofano-Brown
ii

ACKNOWLEDGEMENTS
There are many individuals whose time and caring have contributed to the
development and completion of this dissertation. I would like to express my gratitude for
their support and guidance throughout this journey.
Dr. Dee Ray, my major professor, and friend, has been most supportive in her
guidance, wisdom, and encouragement throughout this endeavor. She has given so
much time and interest in my professional growth and selflessly ensured my success
throughout the entire process. She has impacted my life in so many ways professional,
as well as personally, and I am eternally grateful for our relationship.
My committee members, Dr. Sue Bratton and Dr. Carolyn Kern, have also
provided me with direction, support, and sharing of their expertise to support my course
of study. I am also grateful to April Schottelkorb, my friend and colleague, for her
support and eternal optimism throughout our journey together. I am also indebted to
Lezlie Burwell-Pender and Susan Shultz for their assistance with my study.
I also want to thank the children and parents who through their unselfish
participation, have contributed to sharing an understanding and appreciation for the
unique developmental and emotional needs of young children. I am also especially
indebted to Dr. Linda Homeyer and the Texas Association for Play Therapy for their
generous award that helped with the expenses of this research.
I am forever grateful to my loving, friends and family who have supported me
along the way. Thanks to my parents, as well as Angie, Lisa, and Melissa. Finally, and
most importantly, a special thank you to my loving husband Michael Brown, for his faith
in me, and his sacrifices throughout this journey. Thank you for sticking by me and
iii

never giving up on me when I often was ready to quit! Without your love and support,
this would not have been possible.
iv

TABLE OF CONTENTS
Page
ACKNOWLEDGEMENTS ...............................................................................................iii LIST OF TABLES..........................................................................................................viii LIST OF FIGURES..........................................................................................................ix Chapters
1. INTRODUCTION ....................................................................................... 1 Statement of the Problem ............................................................... 3
Review of Related Literature........................................................... 4
Characteristics of Normal/Typical Development................... 4
Erik Erikson’s Theory ........................................................... 7
Jean Piaget’s Theory.......................................................... 10
Lev Vygotsky’s Sociocultural Theory.................................. 12
Characteristics of Children with Mild Developmental Delay 13
Difficulties Assessing Young Children’s Development ....... 16
Single-Case Experimental Design...................................... 18
Rationale for Child Centered Play Therapy as Mental Health Intervention.............................................................. 20
Summary of Literature................................................................... 28 2. METHODS AND PROCEDURES ............................................................ 30
Research Questions...................................................................... 30
Definition of Terms........................................................................ 30
Instrumentation ............................................................................. 32
Gesell Developmental Observation .................................... 32
Child Behavior Checklist (Achenbach and Rescorla, 2000)34
Developmental Assessment of Young Children (Voress & Maddox, 1998)......................................................... 35
Parenting Stress Index ....................................................... 36
Participant Selection ..................................................................... 37
Treatment...................................................................................... 39
v

Data Collection.............................................................................. 41
Participant 1: Rachel .......................................................... 42
Participant 2: Brian ............................................................. 43
Participant 3: Nate.............................................................. 44 3. RESULTS AND DISCUSSION ................................................................ 46
Participant 1: Rachel ..................................................................... 48
DAYC Cognitive Subtest Individual Phase Analysis........... 50
Visual Analysis of Rachel’s DAYC Communication Subtest Results across All Phases ....................................... 52
DAYC Communication Subtest Individual Phase Analysis . 54
Visual Analysis of Rachel’s DAYC Social Emotional Subtest Results across All Phases ....................................... 56
DAYC Social Emotional Subtest Individual Phase Analysis57
Gesell Developmental Observation Results ....................... 59
Parent Data ........................................................................ 60
Participant 2: Brian........................................................................ 62
Visual Analysis of Brian’s DAYC Cognitive Subtest Results across All Phases .................................................... 63
DAYC Cognitive Subtest Individual Phase Analysis........... 64
Visual Analysis of Brian’s DAYC Communication Subtest Results across All Phases ....................................... 67
DAYC Communication Subtest Individual Phase Analysis . 68
Visual Analysis of Brian’s DAYC Social Emotional Subtest Results across All Phases ....................................... 70
DAYC Social Emotional Subtest Individual Phase Analysis71
Parent Data ........................................................................ 74
Partiicipant 3: Nate........................................................................ 76
Visual Analysis of Nate’s DAYC Cognitive Subtest Results across All Phases .................................................... 77
DAYC Cognitive Subtest Individual Phase Analysis........... 78
Visual Analysis of Nate’s DAYC Communication Subtest Results across All Phases ....................................... 80
DAYC Communication Subtest Individual Phase Analysis . 82
Visual Analysis of Nate’s DAYC Social Emotional Subtest Results across All Phases ....................................... 84
vi

DAYC Social Emotional Subtest Individual Phase Analysis ................................................................................. 85
Parent Data ........................................................................ 88
Discussion..................................................................................... 90
Participant 1 Rachel ........................................................... 91
Participant 2: Brian ............................................................. 92
Participant 3: Nate.............................................................. 95
Summary of All Three Participants Findings....................... 97
Implications for Future Research........................................ 99
Limitations................................................................................... 101
Conclusion .................................................................................. 102 Appendices
A. PLAY THERAPY SKILLS CHECKLIST.................................................. 105 B. PARENT CONSULTATION PROTOCOL .............................................. 108
REFERENCES............................................................................................................ 110
vii

LIST OF TABLES
Page
1. Rachel's Protocol across All Three Phases ........................................................ 43
2. Brian’s Protocol across All Three Phases........................................................... 44
3. Nate’s Protocol across All Three Phases. .......................................................... 45
viii

LIST OF FIGURES
Page
1. Rachel's DAYC combined phase Cognitive subtest results................................ 49
2. Rachel’s DAYC Cognitive baseline results. ........................................................ 50
3. Rachel’s DAYC Cognitive PT/intervention phase results.................................... 51
4. Rachel’s DAYC Cognitive follow-up phase without intervention. ........................ 52
5. Rachel’s DAYC Communication subtest combined total phase results. ............. 53
6. Rachel’s DAYC Communication subtest baseline results................................... 54
7. Rachel’s DAYC Communication PT/intervention phase results.......................... 55
8. Rachel’s DAYC Communication follow- up with no intervention phase. ............. 55
9. Rachel’s DAYC Social Emotional subtest combined phase results. ................... 56
10. Rachel’s DAYC Social Emotional subtest baseline phase results. ..................... 58
11. Rachel’s DAYC Social Emotional subtest PT/intervention phase results. .......... 58
12. Rachel’s DAYC Social Emotional follow-up phase results.................................. 59
13. Rachel’s Gesell Developmental Observation results. ......................................... 60
14. Rachel’s Child Behavior Checklist results. ......................................................... 61
15. Rachel’s Parenting Stress Index pre- and posttest results. ................................ 62
16. Brian’s DAYC Cognitive subtest combined phase overall results. ...................... 64
17. Brian’s DAYC Cognitive subtest baseline phase results..................................... 65
18. Brian’s DAYC Cognitive subtest PT/intervention phase results. ......................... 66
19. Brian’s DAYC Cognitive subtest follow-up phase results.................................... 66
20. Brian’s DAYC Communication subtest combined phase results......................... 68
21. Brian’s DAYC Communication subtest baseline phase. ..................................... 68
ix

22. Brian’s DAYC Communication subtest PT/intervention results........................... 69
23. Brian’s Communication subtest follow-up phase. ............................................... 70
24. Brian’s DAYC Social Emotional subtest combined phase results....................... 71
25. Brian’s DAYC Social Emotional baseline phase results. .................................... 72
26. Brian’s DAYC Social Emotional subtest PT/intervention phase.......................... 72
27. Brian’s DAYC Social Emotional subtest follow-up phase results. ....................... 73
28. Brian’s Gesell Developmental Observation pre- and posttest results. ................ 74
29. Brian’s CBCL scores pretest, mid-point, and posttest results. ............................ 75
30. Brian’s PSI pretest, midpoint, and posttest results. ............................................ 76
31. Nate’s DAYC Cognitive subtest combined phase results. .................................. 78
32. Nate’s DAYC Cognitive subtest baseline phase results. .................................... 79
33. Nate’ DAYC Cognitive PT/intervention phase results. ........................................ 79
34. Nate’s DAYC Cognitive subtest follow-up/no intervention phase results. ........... 80
35. Nate’s DAYC Communication subtest combined phase results. ........................ 81
36. Nate’s DAYC Communication subtest baseline results. ..................................... 82
37. Nate’s DAYC Communication subtest PT/intervention phase. ........................... 83
38. Nate’s DAYC Communication follow-up phase results. ...................................... 83
39. Nate DAYC Social Emotional subtest combined phase results. ......................... 84
40. Nate’s DAYC Social Emotional subtest baseline phase. .................................... 85
41. Nate’s DAYC Social Emotional subtest PT/intervention phase results. .............. 86
42. Nate’s DAYC Social Emotional subtest follow-up phase results......................... 87
43. Nate’s Gesell Developmental Observation results.............................................. 87
44. Nate’s CBCL pretest, midpoint, and posttest results........................................... 89
x

45. Nate’s PSI pretest, midpoint, and posttest results. ............................................. 90
xi

CHAPTER 1
INTRODUCTION
Young children are experiencing more stressful and often challenging
environments that hinder the development of necessary competencies for early
academic and social success (Coolahan, Iantuzzo, Mendez, & McDermott, 2000).
Children with developmental delays, specifically intellectual disabilities, appear to be at
an increased risk for developing emotional and behavioral problems. Emotional and
behavioral difficulties may be related to a child’s personality, or characteristics of their
age (Ilg, Ames, & Baker, 1981). A child’s temperament also plays a role in their
behavior and emotional expression (Spinrad, Eisenberg, Harris, Fabes, Kysanoff,
Ringwals, & Holmes, 2004). Children with developmental delays experience difficulties
across many areas including academic progress, social interactions, problem solving
abilities, and sustaining play both individually and in groups (Spinrad et al., 2004).
Children develop through common stages of development, although each child
goes through the developmental stages and expresses behavior according to their
individuality (Ilg et al., 1981). Developmental theorists Arnold Gesell, Jean Piaget, and
Erik Erikson described developmental stages occurring across distinct and predictable
stages. Arnold Gesell focused on norms of development and changes related to age
(Thelen, 1992). Children’s behavior is described according to stages of disequilibrium
and equilibrium for the first sixteen years of life (Ilg et al., 1981). Jean Piaget described
children’s development as occurring in four major stages including Sensori-motor
period, preoperational period, concrete operational period, and formal operations
(Santrock, 1999). Erik Erikson’s theory of development across the lifespan also
1

described growth patterns predicted by age with further growth and development being
conditional on the successful movement through and mastery of the previous
developmental stage (Elkind, 1981). Vygotsky’s sociocultural theory assumes all
learning takes place in the context of social situations and everyone is capable of
leaning and developing despite any handicapping or disabling factors (Berger, 2002).
Children who do not move successfully through the stages or who exhibit delays
as young as three years exhibit significantly more behavior problems than their same
age peers (Baker, Blacher, & Olsson, 2005). Schools often struggle with placement
decisions for children who are not functioning on level when compared to their typically
developing peers. Counselors are not exempt from this struggle and often find it difficult
to provide developmentally appropriate recommendations for parents in terms of school
placement, and emotional and behavioral concerns. Many times, parents look to
counselors to tell them if their child’s behavior is “normal” (Baker et al., 2005). It seems
as if some counselors have been trained to judge atypical behavior by the diagnostic
criteria in the Diagnostic and Statistic Manual-4th edition, (DSM-IV) text revision, rather
than to explore developmental phases and characteristics of children. Play therapy is an
intervention based on the developmental understanding of children and often used to
assist children and their families with developmental and emotional difficulties (Axline,
1947). An increase in awareness and training in the area of child development is
needed for counselors to best serve and provide recommendations for children and
their parents.
Increasing awareness in these areas often involves the assessment and
observation of children. There are many concerns related to the appropriate methods
2

for assessing children’s development. Many instruments purported to be effective in
assessing young children lack sufficient reliability and validity (Voress & Maddox, 1998).
Other concerns related to the valid assessment of children’s development are technical
issues, cost, and difficulties in administration. Due to the challenges of assessing young
children, alternative methods have been sought by counselors and other researchers.
Lundervold & Belwood (2000) describe single case analysis as the “best kept secret” in
counseling assessment and research because many experimental designs in
counseling research do not meet the needs of researchers seeking methods of
incorporating results into counseling practice. This method allows for a more in depth
and qualitative experience of assessing and gathering relevant data to make better
treatment decisions for children.
Statement of the Problem
Children demonstrate a particular set of behavioral patterns at each
chronological age. Studies found empirical support for the effectiveness of the Gesell
School Readiness Test (revised as Gesell Developmental Observation) as a predictor of
school achievement based on the observed developmental patterns and developmental
age (Kaufman, 1972). Young children with mild developmental delays experience more
academic, social, and peer relationship problems than their normal developing peers. Of
particular concern is their ability to sustain play with peers, failure to resolve conflicts
appropriately, and overall problems in social competence and academic progress.
Researchers highly suggest that supportive interventions during preschool and
kindergarten may benefit children with mild developmental delays in achieving more
3

competent forms of social interaction and play as well as accelerating development
(Guralnick, Hammond, Connor & Nelville, 2006). Child centered play therapy (CCPT) is
used as a developmentally appropriate intervention to treat children’s emotional,
developmental, and behavioral difficulties (Landreth, 2002). There is a need for
research designs that encompass both quantitative and qualitative data to use in
practical counseling settings.
Review of Related Literature
Characteristics of Normal/Typical Development
Four major theories have emerged to describe early child development and will
be briefly explored. Because development is a complex process, no single theorist has
been able to explain all of the aspects of development for children and adults. Each
theorist contributed valuable information and explores different concept across the
lifespan in terms of their relation to development. There may be points that are
contradictory to each of the other theorist, while some ideas complement points or
concepts from another developmental theorist. The developmental theorists that will be
covered are Arnold Gesell, Jean Piaget, Erik Erikson, and Lev Vygotsky.
Arnold Gesell focused his research efforts and career on norms of development
and age-related changes (Thelen, 1992). For each stage of development, Gesell
described a holistic behavioral pattern. He was motivated by his concern for providing
appropriate education for the capabilities of children and for identifying delays in
development for the purposes of intervention (Thelen, 1992).
4

The Gesell School Readiness Screening (currently Gesell Developmental
Observation) (Ilg, 1965) is widely used as a measure of school readiness. The concept
of developmental readiness for school success examines cognitive functioning and
potential as well as the child’s physical, social, emotional, and general language
development. It is deemed more important to assess the child’s overall ability to cope
within a school environment (Wood, Powell, & Knight, 1984).
Ilg, Ames, & Baker (1981) discovered through years of observing children at the
Gesell Institute of Human Development, children’s behavior tends to develop in an
upwardly spiraling fashion with alternating stages of disequilibrium and equilibrium
through the first sixteen years of life. This discovery led to the awareness that stages of
“good” behavior will break up before they can move to a more advanced stage of
equilibrium. This process must occur throughout life for developmental maturity to be
attained (Ilg et al., 1981).
Wood (1997) and Ilg, Ames, & Baker (1981) described children’s unique behavior
and developmental patterns and categorized them into age groups. The following
includes a partial glance at some of the varied and unique behaviors associated with
children aged three through six.
Three-Year-Olds
Three-year-olds enjoy making friends and share toys in order to avoid conflict.
Three-year-olds are in good equilibrium with themselves and others. They feel more
secure with themselves and their relationships. They no longer have to have everything
their way as when they were two and a half years old. They typically are more
5

conforming and you will often hear them uttering the word “yes” easily. Vocabulary and
ability to use language begins to increase during the early part of three, and they love
learning and using new words. When three-year-olds begin to move into three and a
half years, their equilibrium begins to break up during a period of significant change.
This break up lends itself to developmental patterns that are marked with insecurity,
poor coordination, and disequilibrium. The introduction to imaginary friends also begins
during this stage (Ilg, Ames, & Baker, 1981).
Four -Year-Olds
Four-year-olds are typically full of energy and always ready to try something
new. They tend to thrive in environments that support their creativity and flexibility. They
are especially interested in playing outdoors, dancing, and exaggerating stories. Four-
year-olds have short attention spans and learn best thorough their own play, fantasy
play, and manipulating objects and materials. Typically social beings, four-year-olds
quickly move from one thing to the next, and tend to be more independent instead of
being overly dependent on adults. As they move into being an “older four” they may
sometimes appear worried or fearful. Physical activity is enjoyable as their gross motor
skills are more developed, but fine motor skills are not yet fully developed. They may
sometimes appear clumsy and have frequent accidents (Ilg et al., 1981).
Five-Year-Olds
Five-year-olds experience two developmental phases during their kindergarten
year. During the first phase the five-year-old is cautious, compliant, and very literal. The
6

second phase is remarkably different and involves oppositional behavior, uncertainty,
and seeking approval. Taking perspectives of others is difficult for five-year-olds. They
respond well to encouragement when moving to new tasks. Dramatic play helps
children develop language and think out loud. Important developmental changes occur
as children move toward six. Socially, they become more oppositional, often testing
limits with authority, show feelings of insecurity, and are full of complaints. Often to the
dismay of their caretakers, these children behave at school but not at home, or vice
versa. Consistent rules and redirection are valuable and effective tools with this
developmental age group (Ilg et al., 1981).
Six-Year-Olds
The move from age five to six can be dramatic. This developmental shift lends
itself to an extremely open child, who is eager and enthusiastic, and is now able to
empathize with others and understand the rules of cause and effect. Socially, the six-
year-old thrives on encouragement and school becomes a more significant influence
than their home. The six-year-old tends to boss and criticize others and is extremely
competitive. Coloring, dramatic play, and learning through discovery are typical of
growth patterns in the six-year-old (Ilg et al., 1981).
Erik Erikson’s Theory
Erikson’s theory of development encompasses eight stages that unfold through
the life cycle. During each stage, individuals are faced with a developmental crisis that
must be confronted. Erikson believed the continual and successful resolution of these
7

crises lead to healthier development overall (Santrock, 1999). For the purpose of this
child-based study, only those stages related to early childhood will be covered.
Trust vs. Mistrust
The first psychosocial stage Erikson described is trust vs. mistrust. This stage
occurs during infancy through their first year of life. To have a sense of trust, a child
must experience a feeling of physical comfort without high amounts of fear and anxiety
about their future (Santrock, 1999). This sense of trust enables a child to expect that the
world is a safe and pleasant place to live (Elkind, 1981).
Autonomy vs. Shame
The second stage of development occurs in late infancy and toddler hood (1-3
yrs). During this stage, infants begin to acknowledge that their behavior is their own and
assert their independence. When they are punished or hindered excessively in their
explorations, they begin to develop a sense of shame or doubt. During this period
children’s sense of autonomy may be enhanced by allowing them to make decisions
that are developmentally appropriate (Elkind, 1981). From this, children begin to
develop an ability to take responsibility and make decisions. On the other hand, this is
also a stage in which doubt and feelings of shame become evident, if inappropriate
demands or expectations are placed ion the child (Santrock, 1999).
Initiative vs. Guilt
8

Erikson’s third stage of development occurs during a child’s preschool years.
Children in this stage begin to take more responsibility for themselves and their
belongings. Children at age four or five become inquisitive about their world, and have
an increase in motor control, language, and intellectual competence (Santrock, 1999).
They frequently ask “why” questions, and when parents take time to answer their
children’s questions their sense of initiative is encouraged. If parents are too busy to
answer or become angry about their frequent deconstructing of toys and objects out of
curiosity, the child may internalize feelings of guilt about their curiosity and desire to
explore. Also, if the child is not ready to assume these tasks and is irresponsible, he
may become too anxious (Elkind, 1981). Erikson believed that a child’s sense of
accomplishment typically alleviates feelings of guilt for their irresponsibility (Santrock,
1999).
Industry vs. Inferiority
This stage occurs during the child’s elementary school years. Children in this
stage are enthusiastic about learning and mastering knowledge and skills. Conversely,
they begin to feel incompetent and inferior if unsuccessful in their endeavors. Children
establish either a firm sense that they can do a job and do it well referred to as industry,
or a sense that no matter what they try, they will not be successful and will be a failure,
or inferior (Elkind, 1981).
Overall, Erikson believed the successful confrontation of these developmental crises
leads to healthy resolution and movement through the developmental stages (Elkind,
1981). When developmental crises are not resolved in stages it is difficult to move
9

through the next stage successfully. Often issues from the previous stages will be
present until resolved (Santrock, 1999).
Jean Piaget’s Theory
Jean Piaget described children’s development in four major stages. He described
stages where children actively contribute to their reality out of their experiences rather
than copying what they encounter. He believed children move through four stages in
understanding and constructing their worlds (Santrock, 1999). Each of the four stages
described below are qualitatively different, age related, and consists of distinct ways of
thinking (Santrock, 1999).
Sensori-Motor Period
This stage occurs from birth to two years. During this stage, infants construct an
understanding of their world by combining their sensory experiences with more physical
actions. Toward the end of this stage, they begin to operate with symbols (Santrock,
1999). Infants are concerned with permanent objects, attachment to their significant
others and establishing trust. Permanency of objects relates to infants’ inability to
recognize the existence of objects when removed from their presence. Piaget believed
infants do not perceive objects as distinct entities; rather objects must be constructed by
them. Infants’ active exploration of objects allows children to construct concepts about
the objects. Infants also share this perception regarding people. Young infants do not
believe people or objects exist once they are not in their presence (Elkind, 1981).
10

Preoperational Period
This stage occurs between the ages of two and six years. Children in this stage
acquire symbolic or representational function and can now begin to represent the
objects and relations they constructed during the sensori-motor period (Santrock, 1999).
This period is marked by the acquisition of language and the child’s ability to express
their feelings directly. Children also begin to express their fears and anxieties in their
dreams and in symbolic play during this period. Young children in this period become
attached to symbols much like their previous attachment to objects and people. Their
attachment and investment in symbols is evident when young children have to separate
from people and things they consider their own. This symbolic function also gives rise
tom magical thinking where children often believe that events that happen together
cause one another. They begin to move toward representing the world with words,
drawings, and images (Elkind, 1981).
Concrete Operational Period
This stage occurs during the ages of six and eleven. Children become able to
operate upon symbols much like they learned to manipulate objects during infancy.
They now are able to classify in a hierarchical manner (Elkind, 1981). Children in this
period are able to mentally manipulate symbols, which greatly extends the range and
variety of their explorations. Children begin to learn and operate according to rules
(Santrock, 1999).
Formal Operations
11

This stage occurs from eleven years to adolescence. During this stage, children
move beyond the above mentioned concrete reasoning toward thinking in abstract and
more logical terms (Santrock, 1999). Dramatic changes in physical appearance as well
as in thinking and reasoning occur during this stage. Emotional and social changes also
are evident. Attachments become more complex and movement toward independence
occurs. During formal operations, adolescents are able to think about their thinking as
well as think about others’ thinking. They begin to talk about their values and beliefs and
about faith and motives. They become more abstract in their thinking (Elkind, 1981).
Lev Vygotsky’s Sociocultural Theory
Vygotsky’s theory stresses the importance of the structure, guidance, and
support provided by the society in terms of contributing to the growth and development
of individuals (Berger, 2002). Vygotsky asserted that human development is the result
of a dynamic interaction between developing individuals and their surrounding culture.
This theory’s definition of culture is viewed as a unique “plan for living” that children
learn not only from parents, but teachers, and peers, in their homes, schools, and
neighborhoods (Berger, 2002).
Vygotsky’s theory differs from other theories in that he asserted that development
occurs through social situations, and he believed that everyone was capable of leaning
and developing despite any handicapping or disabling factors (Berger, 2002. Teachers
and students learn from each other as neither takes on a passive role in their activities
(Karpov & Haywood, 1998). Guided participation was considered the best way for
“teachers” to assist novices in learning and achieving. This process involves the
12

“teacher” and the novice or leaner engaging in joint activities, offering instruction as well
as involvement in the learning process (Berger, 2002). For learning to occur the
“teacher” must engage the learner into their zone of proximal development, which was
described as the range of skills the learner can practice and master with assistance, but
cannot perform these skills independently (Berger, 2002). Through this process the
teacher assesses the learner’s skills and assists the learner in moving toward
independent achievement and mastery of skills (Berger, 2002). Vygotsky and other
sociocultural theorists have been criticized for overlooking genetic contributions to
guiding development, especially in regard to mental processes (Wertsch & Tulviste,
1992).
Characteristics of Children with Mild Developmental Delay
Children with developmental delays achieve major milestones in a similar order
and organization as children with normal development. Differences occur in the rate of
development in that children with delays develop slower and the appearance of
achievement occurs later. These results apply to development across the following
areas: socioaffective, selective attention, sensorimotor development, language and
symbol formation, pretend play, and attachment behaviors. Attention was a central
process implicated in differences between normal and delayed children (Krakow &
Kopp, 1983).
Temperament may directly or indirectly affect children’s social behavior and
emotionality (Spinrad et al., 2004). Children with even mild developmental delays
experience considerable difficulty in peer interactions when compared to their non-
13

delayed peers. Specific areas of difficulty are social competence, sustaining play with
peers both individually and in group play interactions, and the ability to problem solve
when social conflicts arise. Guralnick, Hammond, Conner, & Neville, (2006) found
children with peer interaction problems tend to experience these difficulties over time,
suggesting that the issue is chronic and stable in nature despite intervention. Parker,
Boak, Griffin, Ripple, & Peay (1999) found greater school readiness among
preschoolers was correlated with home learning environments where parents assisted
with homework, and not only had an array of play materials available, but also
understood the role of play in children’s lives. Consistent parental involvement has been
correlated with more positive school experiences, including academic readiness and
achievement (Parker et al., 1999).
Taylor, Clayton, & Rowley (2004) describe a process whereby parents’ school
related beliefs influence children’s school-related development termed academic
socialization. Parents influence child development based on “what they do” and “who
they are”. Parents’ actions affect children’s development of both pro-social and
antisocial behaviors and these behaviors impact children’s academic success or failure
(Kellaghan, Sloane, Alvarez & Bloom, 1993). Parents with authoritarian behaviors
toward their children coupled with high levels of demandingness and low levels of
warmth are correlated with maladaptive outcomes for children. The home environment
parents provide for their children can significantly affect the quality of language
development (Baumrind, 1991).
Age and cognitive growth are not always in alignment (Ilg & Ames, 1971). This is
evident when examining children’s readiness for reading instruction. Some children
14

begin much earlier than expected, just as other children reach this level past the
expected age. The best criterion for school readiness is developmental age instead of
the popular chronological age and intelligence test scores criteria (Ilg & Ames, 1971).
Similarly, Wood et al. (1984) examined the predictive validity of the Gesell
Developmental Observation. Eighty-four kindergarten age children were assessed with
the Gesell Developmental Observation by certified examiners and their results were
compared with their subsequent school success and any special class or school
program placements related to special needs. The researchers found that children who
are successful in school are both chronologically and developmentally older than
children with school failure. Interestingly, the differences in their developmental ages
were statistically significant while the difference in chronological age was not. The
researchers suggested assignment of developmental age based on results from the
Gesell Developmental Observation, was effective in predicting success or failure in
kindergarten. Results from this study suggest the Gesell Developmental Observation is
effective in predicting kindergarten failure or success (Wood et al., 1984).
There is much debate as to what extent children are identified with learning
disabilities rather than assessing their developmental readiness as an indicator of
perceived failure. Determining school readiness often includes the use of both informal
and normative instruments (Wood, Powell, & Knight, 1984).
Changes over the last decade have influenced expectations for five-year-olds
entering kindergarten. What once was considered part of the kindergarten curriculum
now appears to be a prerequisite prior to entering kindergarten (Litty & Hatch, 2006).
Children who are not developmentally ready to meet the demands in kindergarten often
15

become further behind and experience difficulties keeping up with their classmates.
Kindergarten teachers often worry about these children’s abilities to transition to first
grade, despite their interventions and home practice of skills (Litty & Hatch, 2006).
Kindergarten teachers also experience struggles distinguishing between typical delays
in development and long-term disabilities (Saluja et al., 2000). As of 2003, 13% of
children ages 3-21 qualify for special education services for disabilities (US Dept of
Education, 2003).
There is much controversy regarding whether young children (5 years old)
entering first grade are more likely to experience poorer performance compared with
their older classmates. Also, of concern are the resulting feelings of anxiety, lowered
self-esteem, and emotional and motivational difficulties that may lead to academic and
social failure through early schooling (Litty & Hatch, 2006).
Difficulties Assessing Young Children’s Development
Despite society’s emphasis on the importance of early childhood intervention for
children with disabilities and developmental delays, difficulties persist in assessing for
and identifying these difficulties. These difficulties are in part due to a lack of
psychometric sound assessment instruments for assessing young children (Voress &
Maddox, 1998). Designing valid and reliable instruments for assessing young children’s
development is difficult due to many factors. These factors include: 1) many tests only
assess cognitive development; 2) most tests require only a single administration, thus
limiting an accurate picture of children’s rapid development; 3) individual administration
is time consuming, yet group administration affects reliability; 4) many instruments are
16

not standardized with cultural norms; and 5) most instruments are not developmentally
appropriate for young children and do not account for their unique developmental needs
(Wortham, 1997).
Similarly, Voress & Maddox (1998) examined many instruments that are used
with young children and infants and found that the majority of the instruments had poor
reliability and validity, and technical problems. Other problems found with many of these
instruments were that they were overly simplistic and lacked sufficient numbers of test
items for each age level, and they did not evaluate children across all developmental
domains. Unfortunately, Voress and Maddox (1998) found through their examination of
child assessment instruments, that many appeared biased against children from low
socioeconomic families and took too long to administer. Many of the instruments were
also too expensive for frequent utilization.
Child assessment can be improved by encouraging parents to participate in their
child’s assessment. Advantages of including parents in the assessment process are
cost effectiveness (Bricker & Squires, 1989) and an increase in data collection. Parents
will have more information about their child than the examiner could possibly collect in
isolation (Bagnato, Neisworth, & Munson, 1997). Bricker and Squires (1989) found
parents’ and professional’s ratings during child assessment were consistent with each
other over time.
Casby (2003) studied the developmental status of children through their play.
Many times play behaviors and interactions are the only observable actions available for
assessing young children suspected of having developmental delays. Rossetti (2001)
described the assessment of infants’, toddlers’, and young children’s play as a valuable
17

means of gaining insight into children’s overall development and may lead to
appropriate intervention efforts,
Casby (2003) developed a criterion-referenced, developmentally based protocol
for the assessment of the play behavior of infants, toddlers, and young children. The
recommended assessment procedures include the assessment of play behavior with
the child interacting with the examiner or parent, and materials that can be used in play,
(e.g., balls, paper, blocks). Initially, selected toys are presented in front of the child. The
examiner or parent models or encourages the child to use the toys in a specified
manner. The use of modeling play action was found to be an effective way of eliciting
valid and reliable play behavior from typically developing children as well as those with
developmental delays (Casby, 2003).
In addition, Casby (2003) recommended observation of children, as they played
independent of examiner or parent to consider their level and quality of solitary play as
well as play with others. Because there is variance in play behavior in children with
developmental delays compared to typically developing children, Casby recommended
repeated observation may be considered as an important component for the
assessment of play-based early intervention (Casby, 2003).
Single-Case Experimental Design
Difficulties in assessing the quality and effectiveness of an intervention for
practical use, such as the previously mentioned developmental assessment is often
difficult with group experimental designs. Group experimental design does not meet the
needs of counselors who need scientifically acceptable and clinically feasible methods
18

of demonstrating the effectiveness and validity of counseling and the ability to
incorporate the scientific method into daily counseling practice (Lunderwold & Belwood,
2000).
Equating research methods with group experimental design and statistical
analysis tends to be an overly narrow approach and does not provide much relevance
to practical settings, and little impact on practitioner behavior who primarily work with
individual clients (Lundervold & Belwood, 2000). Researchers are urged to pursue more
practice relevant research methods. Lundervold & Belwood (2000) term single case
design the “best kept secret” in counseling research, for its relevance to practice
settings and its capability of evaluating counseling processes, interventions outcomes,
and demonstrating experimental control.
Single case designs demonstrate causal relations between different conditions
and their effects on performance over time. Essentially an n=1 design uses data from a
single participant as the research design (Sharpley, 2007). The components of the
single case design are as described as follows: 1) Phase- a period of time during which
a specific counselor action is taking place; 2) Baseline-phase (labeled “A”) established
before implementing a systematic counseling intervention is conducted; (3) Treatment-
Intervention or treatment phase (labeled “B”) is initiated. The researcher identifies the
“target” of change for determining the effects of counselor actions (Lundervold et al.,
2000). The baseline phase occurs prior to an intervention taking place, and provides
information about the participant’s performance before the intervention is introduced
(Kazdin, 2003).
19

Participants in single case designs serve as their own control group, and data is
analyzed by visual methods to compare data from the participant’s baseline and
intervention phases (Sharpley, 2007). Graphs provide visual representations of change
over time and are perceived as the most effective method for initial examinations of data
(Sharpley, 1981). Visual inspection is used when there is continuous data for one or
more participants available for observation (Kazdin, 2003). Time series statistical
analyses helps counselors employ a relatively easy and reliable method of measuring
change in typical counseling situations. It specifically allows counselors to explore the
questions of why utilize certain methods and how to determine their effectiveness, with
a greater level of confidence (Sharpley, 1981). The tendency for performance to
increase or decrease systematically or consistently over time is referred to as slope and
is evaluated statistically to determine which line best illustrates the data (Kazdin, 2003).
Rationale for Child Centered Play Therapy as Mental Health Intervention
Children have unique and varied developmental needs. Play therapy is used as a
developmentally appropriate form of therapy to treat children’s emotional and
developmental difficulties (Landreth, 2002). Play allows children to develop
understanding and awareness of their experiences and enables the process of gaining
insight, learning, problems solving, coping, and mastery (Ray, Bratton, Rhine, & Jones,
2001).
Play therapy is effective and utilized in a variety of child settings because play is
the child’s symbolic language of self-expression, and it allows children to heal
themselves by playing out their experiences in a safe, accepting, and caring
20

relationship. Children are able to direct themselves through play and because their
language development lags behind their cognitive development, children are able to
communicate their experiences through their play (Landreth, 2002). The use of carefully
selected toys is essential in enabling children to transfer their feelings onto objects
rather than people. This is less threatening for children and allows them to feel safe and
not become too overwhelmed by their actions, because their actions take pace in
fantasy. Through this symbolic “acting out” process, children move toward an inner
resolution and are better able to cope or adjust to problems (Landreth, 2002).
The play process also expands the child’s expression of self. Children are able to
explore the unfamiliar while in the safety of the play therapy (PT) relationship. Landreth
describes one of the major functions of PT as a process where children are able to
change what may be unmanageable in reality to more manageable situations through
symbolic play. This process allows children to learn to cope through self-directed
exploration (Landreth, 2002). The objectives of CCPT include: developing more positive
self-concept, assuming greater responsibility, becoming more self-directing and self
reliant, engaging in self-determined decision making, feeling a sense of control, coping,
developing an internal source of evaluation, and trusting themselves (Landreth, 2002).
Play therapy is used based on the developmental understanding of children.
Axline (1947) identified eight basic principles that guide the play therapist in serving
children:
1) The play therapist is genuinely interested in the child and develops a warm and caring relationship.
2) The play therapist experiences unconditional acceptance of the child and does not wish the child were different in some way.
21

3) The play therapist creates a feeling of safety and permissiveness in the relationship so the child feels free to explore and express themselves completely.
4) The play therapist is always sensitive to the child’s feelings and gently reflects those feelings in such a manner that the child develops understanding of self.
5) The play therapist believes deeply in the child’s capacity to act responsibly, and respects the child’s ability to solve personal problems.
6) The play therapist trusts the child’s ability to lead in all areas of their lives, trust their inner direction, and resists any urge to direct the child.
7) The play therapist appreciates the gradual nature of the therapeutic process and does not attempt to hurry the process.
8) The play therapist establishes only those therapeutic limits that help the child accept personal and appropriate responsibility.
Several research studies have demonstrated the effectiveness of PT with
children experiencing various emotional, academic, and behavioral issues. Packman &
Bratton (2003) investigated the efficacy of a school based group PT intervention with
preadolescents identified with learning disabilities and behavior problems. They were
particularly interested in determining the effects of a group PT model on both
internalizing and externalizing behavior problems. Participants for the study were thirty
students from a private school in a large urban city. The school specialized in serving
students with unique learning differences. The students were between the ages of 10-
12 and in the 4th-5th grades, and were referred by their parents and teachers for
exhibiting behavior problems. Twelve participants were randomly assigned to the
treatment group and twelve were assigned to the control group. The experimental group
participants were divided into groups of three and participated in the group play/activity
intervention one hour per week over the course of twelve weeks. Data was collected
from administration of the Child Behavior Checklist-Parent Report Form. This data was
collected prior to treatment (pre-test) and after treatment (posttest). Analysis of
22

covariance was performed on all data. An overall effect size in the large category was
found. In this unique, first of its kind study, the results support group play/activity
therapy as an effective intervention for preadolescents with internalizing and
externalizing behavior difficulties (Packman & Bratton, 2003).
Post (1999) examined the impact of child centered play therapy (CCPT) on the
self –esteem, locus of control, and anxiety level among at-risk children in grades 4th-6th.
The at-risk designation of the participants was due to poverty, performing below age-
grade level, special education referrals, and many of the children lived in homes with
family situations with neglect, violence, and frequent changes in who lived in the home.
Participants included one hundred sixty eight children who were referred by teachers or
administrators in the school, and who were not already receiving counseling from other
mental health providers at the school. Participants participated in CCPT and sessions
ranged from one to twenty-fiv4e with four being the mean of CCPT sessions received.
CCPT sessions were weekly. Seventy-seven students formed the experimental group
and received weekly CCPT. The control group included ninety-one students and they
received no treatment. Data was collected with the Coopersmith Self-Esteem Inventory,
Intellectual Achievement Responsibility Scale-Revised and the State-Trait Anxiety
Inventory two times during the school year. The students’ pretest and posttest scores on
these measures were analyzed using ANOVA and results indicated that although CCPT
did not enhance participants’ overall self-esteem, the control group demonstrated a
decrease in self-esteem over the course of the school year. Those students who did not
receive the CCPT intervention appeared to have ended the school year at greater risk
than when they began the school year. The researcher suggested these results indicate
23

that CCPT may have prevented at-risk students from a decline in their self-esteem and
assumption of responsibility for their academic work (Post, 1999).
Crow (1994) examined PT in a school setting to determine its effectiveness on
students’ reading achievement, self-concept, and locus of control. Results
demonstrated significantly higher self-concept scores on the Piers-Harris Children’s Self
Concept Scale. Although significant results were not found between the two groups in
reading achievement. Researchers suggested increases in self-concept could be
related to improved reading scores (Crow, 1994).
Fall, Balvanz, Johnson, & Nelson (1999) examined the effects of CCPT in a
school setting with children whose coping skills affected their academic progress. They
studied 62 children in grades K-3, who were referred by teachers for exhibiting coping
skills that were not conducive to learning. Thiry-one children received CCPT and 31
children served as controls. School counselors utilized CCPT in a six-session model. All
62 students were measured pre and post treatment with classroom observations, the
self-efficacy scale for children, and the Connors Teacher Rating Scale. Results from
these measurements were analyzed using a mixed ANOVA. Results indicated an
increase in self-efficacy for the experimental group. Results demonstrated CCPT was
effective in improving behavior associated with hindering learning. The authors
suggested results provide evidence for a relationship between increased self-efficacy,
and a successful PT intervention. The researchers concluded that children from this
study whose coping skills hindered learning could be assisted with 6 sessions of CCPT
(Fall et. al, 1999).
24

Shen (2002) recruited sixty-five children from a rural elementary school in
Midwestern Taiwan that had experienced an earthquake and its devastating effects. Of
those 65 children, 30 were identified as being at-risk fro maladjustment. These children
were ages 8-12 and were randomly assigned to either an experimental group or control
group. The 15 children assigned to the experimental group were assigned to 5 play
groups with 3 children in each play group. A school counselor provided PT, and each
group received 10, 40-minute group PT sessions during 2-3 tomes per week during a 4-
week span. Parents and children complete Children’s Mental Health Checklist, Filial
Problem Checklist, Revised Children’s Manifest Anxiety Scale, and the Multiscore
Depression Inventory for Children. Data was analyzed using ANCOVA and an
independent t-test. Results indicated a decrease in the overall anxiety level as well as
the suicide risk level in the experimental group (Shen, 2002).
The efficacy of intensive individual child centered play therapy (CCPT) with
chronically ill children was investigated with children with insulin-dependent diabetes
mellitus (IDDM) (Jones & Landreth, 2002). Researchers specifically were interested in
the effects of CCPT on the emotional and behavioral symptoms of children diagnosed
with IDDM. Thirty children with IDDM were selected from a summer camp for children
diagnosed with diabetes, to participate in the study. Nine children in the experimental
group participated in 12 CCPT sessions during the 3-week summer camp sessions. The
15 children in the control group did not receive CCPT. Parents of all children who
participated in the study completed pretest and posttest data including demographic
information forms, Filial Problem Checklist, and the Diabetes Adaptation Scale-Parent
Form. Three month follow-up data was also collected. Analysis of data and qualitative
25

observations indicated CCPT may be an effective intervention for decreasing emotional
and behavioral symptoms in children with IDDM (Jones & Landreth, 2002).
Garza & Bratton (2005) examined the impact and cultural considerations of
CCPT with Hispanic children. Thirty Hispanic, Spanish speaking children in kindergarten
through 5th grade who were referred to school counseling services for internalizing or
externalizing behavioral concerns were selected to participate in the study. Children
were divided into 2 groups of 15. The experimental group received 15 30-minute,
weekly CCPT sessions. The CCPT treatment protocol was followed in the experimental
group. The comparison group received 15 30-minute weekly curriculum based small
group counseling. The curriculum was a substance abuse prevention program defined
as culturally competent with English and Spanish versions, developmentally appropriate
for various grade levels, and appropriate for school based use targeting at-risk
behaviors, and demonstrated effectiveness in decreasing behavior problems and
improving social skills. Data was collected from Behavior Assessment Scale for
Children, completed by parents and teachers for all participants both pre and post
treatment. The effects of CCPT compared to curriculum based small group counseling
with Hispanic children were analyzed with a 2 factor repeated measured ANOVA.
Moderate to large treatment effects were demonstrated by the CCPT treatment group.
This study was a preliminary investigation that advocates for the need of a research
based culturally responsible treatment approach for Hispanic children. The authors
suggest CCPT is a viable option (Garza & Bratton, 2005).
Hannah (1986) suggested there is a lack of research that adequately addresses
the effects of PT using single case design techniques. He examines a PT intervention
26

independently for 9 children ages 4-6, selected from a participant pool for a PT
practicum at a university setting. Data was collected by trained observers 2-3 times per
week. The observers were practicing and received feedback on their behavior rating.
Baseline measurement began 3 weeks prior to the first PT session. The participants
received 8 weekly 50-minute PT sessions. Parents and teachers were interviewed for
qualitative data in addition to quantitative data. The author utilized a single-subject
interrupted time series design to evaluate the impact of PT on each child’s behavior.
Researchers placed one child whose parents withdrew him from the PT treatment prior
to its start, as a comparison participant receiving no treatment. Results indicated that of
the 9 children participants, 8 showed significant progress in behavior identified as
unique to each of their targeted problem areas, which was steadily increasing over time.
The child who did not receive treatment demonstrated significant increase in
maladaptive behavior. Results indicate PT was an efficacious intervention for reducing
inappropriate or maladaptive behavior in young children (Hannah, 1986).
Ray et al. (2001) found through meta-analysis of PT outcome research, that PT
was an effective treatment for children’s problems. Large effect sizes (.80) were found
in treatment (receiving PT) versus non-treatment groups. The authors conducted a
meta-analysis of 93 PT outcome studies. A large treatment effect for PT intervention
with children was found. Children receiving PT interventions performed 0.75% of a
standard deviation better on outcome measures compared with those children who did
not receive PT treatment. These results support the efficacy of PT as an intervention in
the treatment of children with emotional and behavioral difficulties. The analysis also
indicated that PT is effective across age, gender, clinical, and nonclinical populations
27

(Ray et al., 2001). The researchers also found that humanistic-nondirective PT
approaches yielded significantly larger treatment effects that other approaches (Bratton,
Ray, Rhine, & Jones, 2005).
Summary of Literature
Research has shown that children with mild developmental delays are at risk for
developing emotional and behavioral problems. School placements for these children
are stressful for parents and teachers due to the unique needs of the child (Ilg et al.,
1981). Counselors also struggle with serving these children and providing parents with
developmentally appropriate interventions. The study of child developmental level or
age is not easily assessed or understood by many helping professionals. To complicate
matters, there appears to be a scarcity in research regarding the nature of assessing
child development levels in order to provide developmentally appropriate
recommendations and child based interventions. The research on child assessment
suggests challenges due to cost of materials, poor reliability and validity, technical
issues, and practicality in counseling practice (Voress & Maddox, 1998). Alternative
methods of assessing children to gain insight into providing appropriate counseling
interventions have been reviewed in the literature. Because children have unique and
varied developmental needs, CCPT is used as a developmentally appropriate form of
therapy to treat children’s emotional and developmental difficulties (Landreth, 2002).
Group experimental designs often lack generalizability to practical counseling settings
whereas single case designs provide an alternative method of analyzing causal
relations between different conditions and their effects on performance over time which
28

seems to be a more natural fit with counseling intervention studies (Lundervold &
Belwood, 2000).
29

CHAPTER 2
METHODS AND PROCEDURES
This study used a single case design to explore the impact of individual child
centered play therapy (CCPT) on children with developmental delays by examining its
effectiveness in: 1) increasing measured developmental age; 2) reducing problematic
behaviors related to developmental delays; and 3) increasing developmentally
appropriate behaviors. This chapter outlines the methods and procedures that were
utilized in this study. Included are the research questions, definition of terms,
instrumentation, and selection of participants, data collection, treatment, and data
analysis.
Research Questions
1. What impact does CCPT demonstrate on a young child’s developmental age?
2. What impact does CCPT combined with parent consultation demonstrate on a young child’s developmental age?
3. What impact does CCPT demonstrate on a young child’s behavior and parental relationship?
4. What impact does CCPT combined with parent consultation demonstrate on a young child’s behavior and parental relationship?
Definition of Terms
Child centered play therapy (CCPT) – For purposes of this study, Landreth’s
(2002) definition was used:
Play therapy is defined as a dynamic interpersonal relationship between a child and a therapist trained in play therapy procedures who provides selected play materials and facilitates the development of a safe relationship for the child. To fully express and explore self (feelings, thoughts, experiences, and behaviors)
30

through play, the child’s natural medium of communication, for optimal growth and development. (p.16)
Parent-child relationship stress – This is defined by high scores on the Child and
Parent Domains of the Parenting Stress Index. Abidin (1995) defines High scores on the
PSI as scores at or above the 85th percentile.
Child’s developmental age – Gesell, Ilg, Ames, and Baker’s (1981)
developmental ages will be used in this study. Based on the works of Frances Ilg, the
developmental age refers to the age at which the child is functioning as a whole, total
organism. Within the total organism, the components of social, emotional, intellectual,
and physical are interdependent. The developmental age may or may not correspond
with the child’s chronological age. The developmental age is based on a cluster of
scores derived from the child’s performance on the Gesell Developmental Observation’s
sections and tasks. The developmental age is scored according to six month
increments.
Child and Adolescent Background Information Form – This is a demographic
information form completed by the child’s parents used by the clinic.
Externalizing behavior problems – These are defined as behaviors that are
outward manifestations of inner conflict. These behaviors can include: aggression,
hyperactivity, and conduct problems. For the purposes of this study, externalizing
behavior problems will be operationally defined as the score on the Externalizing
Behavior scale on the Child Behavior Checklist (CBCL; Achenbach & Rescorla, 2000).
Internalizing behavior problems – These are defined as behavioral characteristics
that are symptomatic of an attempt to cope with internal difficulties. Most often,
emotions are prevented from being expressed and are directed internally. For the
31
purpose of this study, internalizing behavior problems will be operationally defined as
the score on the Internalizing behavior scale on the Child Behavior Checklist (CBCL;
Achenbach & Rescorla, 2000).
Chronological age – This is defined as the actual age calculated from date of
birth in months and years.
Instrumentation
Gesell Developmental Observation
Dr. Gesell studied more than 10,000 children in his career and theorized that
behavior is a function of structure, and that people develop in a patterned and
predictable manner. Dr. Gesell described developmental age as having characteristic
patterns of mental and physical organization, social and emotional behavior, and play
interests and activities. He further described the concept of developmental age as the
age at which the child functions as a total organism. The various components of social,
emotional, intellectual, and physical are all interdependent. The Gesell Developmental
Observation (1981) tool allows examiners to observe, record, and match a child’s
behaviors with normative patterns to identify their developmental age. Although children
may exhibit a variety and range of behaviors in assessment, the developmental age
cluster provides an overall developmental age (Ilg, 1965). Children’s chronological age
and developmental age may or may not correspond with each other. Because the
concept of developmental age is qualitative rather than quantitative or numerically
derived, the tool differs dramatically from other assessment instruments and allows
evaluators to develop a complete picture of the observed child (Ilg, 1965).
32

Administrators must complete in an intensive three-day training institute to receive
certification for administering this instrument.
The instrument’s tasks emphasize the child’s response in terms of developmental
status, so there is no right or wrong response. All of the child’s behaviors,
verbalizations, method, and organizational processes are considered in determining the
developmental age. The benefits to children in determining their developmental age lies
in recognizing the age in which they are functioning so their needs are accommodated
appropriately to allow for further growth and opportunity (Ilg, 1965).
The Gesell Developmental Observation consists of tests that are predominantly
perceptual-motor. The individual administration of this test takes approximately 20
minutes. The included subtests are:
1. Initial Interview – Child is asked their age and birthday, names of any siblings, and the nature of parent’s occupations
2. Writing – Child is asked to write first and last names, and numbers 1-20
3. Copy Forms – Child is asked to copy a circle, cross, square, equilateral triangle, diamond, and divided rectangle
4. Incomplete Man – Child is asked to complete the facial and body parts of a partially drawn man
5. Animals – Child is asked to name as many animals as he in one minute.
Based on the child’s responses to test items or specific tasks, the child is
assigned to a predetermined developmental age category for each section of the test.
Once the child completes all sections of the tests and the developmental ages are
recorded on the scoring sheet, an overall developmental age is derived form an average
of the child’s performance on each individual section of the test.
33

Child Behavior Checklist (Achenbach and Rescorla, 2000)
The Child Behavior Checklist for Children Ages 1.5 to 5 Years (CBCL;
Achenbach and Rescorla, 2000) is designed for the parent of a child ranging in age
from 1 1/2 to 5 years old, to identify problematic behavior problems. The CBCL was
used for the purposes of this study due to the ages of the participants. The CBCL has
99 specific problem items that parent’s rate on a scale of 0-2 indicating; not true (0),
sometimes true (1), or very true (2). An open-ended item is also included to list other
problems observed by caregivers. The entire assessment takes approximately 20
minutes to complete. There are seven syndrome scales, five Diagnostic and Statistical
Manual of Mental Disorders (DSM) oriented scales. Composite scales on the CBCL
include the Internalizing Problems Scale, and the Externalizing Problems Scales as well
as the Total Problems Scale. Composite scores of the Interpersonal and Externalizing
Scales and Total Problems Scales were utilized in this study. A reduction in scores
indicates improvement in the targeted behavior (Achenbach & Rescorla, 2000).
The CBCL was normed on a sample of children living in the northeast section of
the United States and some children from the Netherlands. Researchers utilized
children referred for clinical services and well adjusted children attending preschool who
were participating in a long-term national study. The mean score of the test-retest
reliability for the CBCL is strong (r = .90). The test-retest reliability for each scale of the
CBCL are as follows: Emotionally Reactive (r = .72), Anxious/Depressed (r = .68),
Somatic Complaints (r = .91), Withdrawn (r = .77), Attention Problems (r = .84),
Aggressive Behavior (r = .89), Internalizing Problems, (r = .77), Externalizing Problems
(r = .89), and Total Problems (r = .88). The test-retest of the DSM-oriented scales is as
34
follows: Affective Problems ( r= .76), Anxiety Problems (r = .57), Pervasive
Developmental Problems (r = .83), Attention Deficit/Hyperactivity Problems (r = .79),
and Oppositional Defiant Problems (r = .87). The content validity of the problem scales
was strong, as was supported by the research which determined that almost all items
discriminated between referred and nonreferred children (Achenbach & Rescorla,
2000). For purposes of this study, this instrument will be used as a supporting measure
to provide additional data along with the other assessments.
Developmental Assessment of Young Children (Voress & Maddox, 1998)
The Developmental Assessment of Young Children (DAYC; Voress & Maddox,
1998) is used to identify developmental delays or deficits in children from birth through 5
years, 11 months who may benefit from early intervention. The DAYC is composed of
five subtests that measure assessment areas of cognition, communication, social-
emotional development, adaptive behavior, and physical development. The Cognitive
subtest consists of 78 items that measure skills and abilities including attention,
memory, planning, decision-making, and discrimination. The Communication subtest
consists of 78 items and measures both receptive and expressive language skills
involving verbal or nonverbal expression. The Social-Emotional subtest consists of 58
items and measures social awareness, social relationships, and social competence.
The Physical Development subtest consists of 87 items and measures motor
development involving the use of small and large muscles to perform basic movements.
Gross and fine motor skills were also assessed. The Adaptive behavior subtest consists
of 62 items and measures independent functioning including self-help skills, such as
toileting, feeding, dressing, and hygiene. The test can be tailored to the child’s needs by
35

assessing any combination of the five domains. Administration can be individual,
separate, or as a comprehensive battery. Evaluator can collect information about a
child’s abilities through observation, caregiver interview, and direct assessment. The
instrument was normed on a national sample of 1,269 children, and yields percentile
ranks and age equivalents. The DAYC was shown to exhibit both high test-retest
reliability (.99) and high criterion-predictive (.61) and construct-identification validity (.93)
(Voress & Maddox, 1998). For the purposes of this study, the Cognitive,
Communication, and Social-Emotional subtests were used due to the perceived
relationship between these areas and the intervention of PT
Parenting Stress Index
The Parenting Stress Index (PSI) is a 120-item instrument to “identify parent-
child systems that were under stress and at risk for the development of dysfunctional
parenting behaviors or behavior problems in the child involved” (Abidin, 1995, p. 6). The
PSI was standardized for use with parents of children between the ages of 1 month to
12 years. The instrument consists of Child Domain, Parent Domain, Life Stress, and
Total Stress Score. Scores at or above the 85th percentile are interpreted as falling in
the high range on this assessment. High scores on Child Domain indicate the need for
further intervention to focus on the behaviors of the child rather than parent concerns
that affect parent-child relationship. This domain consists of 47 items. Internal
consistency for the overall Child Domain is .90 and ranges from .70-.83 for the
subscales.
High scores on Parent Domain indicate that the sources of stress in the parent-
child relationship are related issues in the parent’s function (Abidin, 1995). This domain
36

consists of 54 items. The internal consistency is .93 for the overall Parent Domain and
ranges from .70-.84 for Parent Domain subscales:
The Life Stress scale includes 19 items and provides information on the amount
of stress the parent is experiencing outside of the parent-child relationship. High Life
Stress scores are indicative of parents who find themselves in stressful circumstances
frequently beyond their control. The total stress the parent reported may be intensified
by the Life Stress scores (Abidin, 1995).
The Total Stress Score reflects the underlying assumption of this instrument. It is
calculated by adding the Parent and Child Domains scores. Parents who demonstrate
high scores are recommended to pursue professional intervention.
A Defensive Responding score provides further information regarding
interpretation of the results of the PSI. A Defensive Responding score of 24 or less
indicates caution should be taken in interpreting the results due to possible defensive
responding. For purposes of this study, this instrument will be used to gain additional
data to support the developmental assessments.
Participant Selection
Participants included community child clients between the ages of 3 and 6 who
are on the waiting list at a community mental health clinic on a university campus.
Participants were screened for eligibility criterion to participate in the study. The
inclusion criterion was performance of at least six months below chronological age on
the Gesell Developmental Observation and no concurrent psychological treatment.
Three children were selected and treated, each by a different therapist at the
mental health clinic. As a sliding scale fee clinic, clients were typically in low income
37

bracket, with an average household income at or near the poverty level. Children were
referred by their parents, guardians, or preschool teachers for a variety of
developmental and behavioral concerns and/or problems in the parent-child
relationship.
I submitted this study to the university’s Internal Review Board and received
approval to use human participants. The participants met the following criteria:
1. Children were between the ages of 3 and 5 years of age
2. Children were not receiving any other mental health treatment
3. Children were not currently receiving PT services
4. Children were operating six months below their chronological age as measured by the Gesell Developmental Observation instrument
5. Children were not diagnosed with severe developmental disability or delay including Autism, mental retardation, pervasive developmental disorder, or Asperger’s disorder
6. At least one parent of participating child was able to complete the required assessments and demographic instruments for data collection
Children were brought to the clinic by their parents for their initial intake and
pretest of the Gesell Developmental Observation to obtain a baseline measurement.
Parents signed a form along with the clinic’s original consent form, explaining the nature
of the research study by the examiner. To ensure confidentiality of the information, I
assigned codes to each participant and was the only one with the master list with
participant’s names. All confidential client files were locked in the clinic during the
course of the study.
Because children were studied, special precautions were taken regarding
simplistic explanatory language in the informed consent for parents. All identification
was coded so that confidentiality was confirmed. Videotapes of PT sessions were
38

collected during the normal course of therapy. Therefore, the collection of videotapes
did not require further time from the participant. Videotapes of sessions with children
and professional reviews of those tapes ensured that proper protocol was followed
throughout the study.
Upon completion of instruments, I coded each instrument with the participant’s
matched code. All videotapes were coded with the matched code. Names were deleted
from any instrumentation. Names and codes were kept in one file only accessible by
myself and my research team.
Treatment
Participants who met specified criteria: clients between the ages of 3 and 5
years, who were assessed with at least a six month developmental age below their
chronological age by the Gesell Developmental Observation and not currently receiving
any concurrent psychological treatment, were included in this research. I and all play
therapists serving participants completed at least three courses in PT, including an
introduction to PT, an advanced PT course, and a clinical practicum. In addition, I hold a
master’s degree in school psychology specializing in assessment, and completion of 3
years of doctoral work in counselor education. Each counselor received individual or
triadic supervision on a weekly basis from an experienced play therapist and 1.5 hours
of group supervision from a counselor education faculty member. All children selected
for this study received treatment consisting of individual CCPT sessions following CCPT
protocol.
39
CCPT incorporates play as the child’s natural and developmentally appropriate
form of self-expression. CCPT is a dynamic interpersonal relationship between child
and therapist. CCPT therapists select specific toys and utilize specific interventions and
reflections (Landreth, 2002). CCPT is a developmentally appropriate form of counseling
for children due to its utilization of toys and play. Specifically, toys represent children’s
words and play is their language (Landreth, 2002). CCPT originally developed based on
the person-centered counseling philosophy of Carl Rogers. Virginia Axline (1947)
applied this counseling philosophy to children by expressing the core conditions of
empathy, unconditional positive regard, and genuineness in a playroom setting.
The CCPT therapists participating in the study incorporated both nonverbal and
verbal skills. The verbal responses included: (1) utilizing short, interactive and
personalized responses at an appropriate rate of responses matching the energy level
of the child; (2) tracking child’s play behavior; (3) reflecting content; (4) reflecting
feelings; (5) facilitating decision making and returning responsibility; and (6) using
encouragement and self-esteem building responses. The CCPT therapists’ nonverbal
responses include: (1) maintaining an open, relaxed, comfortable posture and leaning
forward; (2) appearing genuinely interested in the child; and (3) conveying a sense of
genuineness by matching words and affect (Ray, 2004). All sessions were conducted in
PT rooms at the clinic. The rooms are equipped with the following toys in accordance
with Landreth’s (2002) recommendations:
Sand Puppets Telephone
Scoops/shovel/bucket Puppet theater Plastic domestic
animals
40

Dramatic play clothes Vehicles/planes Plastic zoo animals
Masks and hats Riding car Medical kit
Plastic dinosaurs Baby dolls/clothes Adhesive bandages
Knife/sword Pacifiers Cash register
Dart gun Nursing bottles Play kitchen/food
Handcuffs Pillow/blanket Pots/pans/dishes
Rope Wood blocks Dollhouse/bendable family
Paints and easel Broom/dust pan/mop Toy soldiers
Craft table Musical instruments Bop bag
Crayons and paper Cameras/binoculars Egg cartons
Play dough Chalkboard and chalk Tape/glue/ blunt scissors
The occurrence of parent consultations was dependent on the protocol for each
participant schedule of services/treatment. The CCPT therapist met with the parent as
assigned and adhered to the parent consultation protocol (Appendix B). Parent
consultations were provided after the PT session with the child participant was
completed. The child/participant was not present during the consultation and remained
in the waiting area with staff babysitters. Parent consultations were designed to be
provided in a non-directive format, and no recommendations or parent education was
provided.
Data Collection
This study utilized the single case design format as suggested by Kazdin (2003).
Data collection procedures are individual to each case to demonstrate changes
41

occurring during CCPT and parent consultation interventions. The following information
describes the procedures for the individual participants in the single case analysis:
Participant 1: Rachel
During the baseline phase, participant was administered the Gesell
Developmental Observation once upon intake while subtests from the DAYC were
administered weekly to obtain developmental level data (See Table 1). Parent
completed pretest assessments including CBCL and PSI, and relevant background and
developmental history were obtained. The CBCL and PSI were used as supporting
measures, not as focal dependent measures for the single case design. The treatment
phase began after three weeks of Baseline data collection. The first week of treatment
(Week 4) included the play therapist meeting with participant for a 30-minute play
therapy (PT) session. After the PT session, I met with the child to administer DAYC
Cognitive, Social Emotional, and Communication subtests to collect developmental
assessment data. This participant did not receive any parent consultations until
debriefing once the study had been completed. During Weeks 3-11, participants
received a 30-minute PT session, and afterwards, I administered the three DAYC
subtests. The final week (11) of the treatment phase included the parent’s completion
of posttest measures of the CBCL and PSI, and a 30-minute PT session with the
participant followed by the administration of the three DAYC subtests, and posttest
administration of the Gesell Developmental Observation. During follow-up phase Weeks
12-14 I met with the participant to administer the DAYC subtests to gain additional data
after the removal of treatment and no additional data from parents.
42

Table 1
Rachel's Protocol across All Three Phases
Prior to
study
Week 1
Week 2
Week 3
Week 4
Week 5
Week 6
Week 7
Week 8
Week 9
Week 10
Week 11
Week 12
Week 13
Week 14
Gesell DAYC CBCL PSI
DAYC DAYC PT DAYC
PT DAYC
PT DAYC
PT DAYC
PT DAYC
PT DAYC
PT DAYC
PT Gesell DAYC CBCL PSI
DAYC DAYC DAYC
Participant 2: Brian
During the baseline phase, participant was administered the Gesell
Developmental Observation once upon intake while subtests from the DAYC were
administered weekly to obtain developmental level data (See Table 2). Parent
completed pretest assessments including CBCL, and PSI, and relevant background and
developmental history were obtained. The treatment phase began after three weeks of
baseline data collection. Week 4 included the therapist meeting with the participant for a
30-minute PT session, followed by meeting with the child’s parent for consultation
following established protocol. After the PT session, while the therapist met with the
participant’s parent, I met with the child to administer DAYC Cognitive, Social
Emotional, and Communication subtests to collect developmental assessment data.
Weeks 5-6, participant received a 30-minute PT session, and I again administered the
DAYC subtests immediately afterward. During Week 7, the therapist conducted a 30-
minute PT session with the participant. The parent met with therapist for parent
consultation, following established protocol and completed mid-point assessments of
CBCL and PSI. I met with the participant after the PT session to administer the DAYC
43

subtests. Weeks 8-10 included a 30-minute PT session, followed by my administering
the DAYC subtests. The final week of the treatment phase (Week 11) included a 30-
minute PT session followed by the administration of the DAYC, and posttest
administration of the Gesell Developmental Observation. His parent completed post
treatment assessments of CBCL and PSI. During Weeks 12-14 of the follow-up phase, I
met with the participant to administer the DAYC subtests to gain additional data without
child receiving treatment or parent consultation services.
Table 2
Brian’s Protocol across All Three Phases
Prior to
study
Week 1
Week 2
Week 3
Week 4
Week 5
Week 6
Week 7
Week 8
Week 9
Week 10
Week 11
Week 12
Week 13
Week 14
Gesell
DAYC CBCL PSI PC
DAYC DAYC PT DAYC
PT DAYC
PT DAYC
PT DAYC CBCL PSI PC
PT DAYC
PT DAYC
PT DAYC
PT Gesell DAYC CBCL PSI PC
DAYC DAYC DAYC
Participant 3: Nate
During the baseline phase, participant was administered the Gesell
Developmental Observation once upon intake while subtests from the DAYC were
administered weekly for three weeks to obtain developmental level data (See Table 3).
Parent completed pretest assessments including CBCL, and PSI, and relevant
background and developmental history was obtained. The treatment phase began after
three weeks of baseline data collection. During Week 4, the therapist met with the
parent for consultation following established protocol, after meeting with the participant
for a 30-minute PT session. After the PT session, I met with the child to administer the
44

DAYC Cognitive, Social Emotional, and Communication subtests to collect
developmental assessment data. During treatment Weeks 5-6, the participant received
a 30-minute PT session, and I administered the DAYC subtests. During Week 7, the
therapist conducted a parent consultation following the established protocol, as well as
a 30-minute PT session with the participant. The parent completed mid-point
assessments of CBCL and PSI. I met with the participant after the PT session to
administer the DAYC subtests. Weeks 8-10 included 30-minute PT session, followed by
my administering the DAYC subtests. The final week of the treatment phase (Week 11)
included a parent consultation, 30-minute PT session followed by the administration of
the DAYC. Parent completed posttest assessments of CBCL and PSI. During follow-up
Weeks 12-14, I met with the participant to administer the DAYC subtests to gain
additional data without participant receiving CCPT or parent consultation.
Table 3
Nate’s Protocol across All Three Phases.
Prior to
study
Week 1
Week 2
Week 3
Week 4
Week 5
Week 6
Week 7
Week 8
Week 9
Week 10
Week 11
Week 12
Week 13
Week 14
Gesell
DAYC CBCL PSI PC
DAYC
DAYC PT DAYC
PT DAYC
PT DAYC
PT DAYC CBCL PSI PC
PT DAYC
PT DAYC
PT DAYC
PT Gesell DAYC CBCL PSI PC
DAYC DAYC DAYC
45

CHAPTER 3
RESULTS AND DISCUSSION
This chapter presents the findings of the developmental observations, parent
assessments, and child developmental assessments for each individual participant in
the study. The primary source of data for visual analysis of this single case design is the
developmental assessment measures from the three Developmental Assessment of
Young Children (DAYC) subtests, Cognitive, Communication, and Social Emotional.
The Child Behavior Checklist for Children Ages 1.5 to 5 Years (CBCL) and Parenting
Stress Index (PSI) multiple repeated measures were reported to explore behavioral and
relational changes across time as supporting documents to the weekly DAYC data
collection.
Participant’s results were examined separately using visual analyses. The
participant’s weekly standard scores from the DAYC were graphed. Changes between
non-intervention baseline, intervention, and non-intervention follow-up phases were
examined. Specifically, the levels, trends, and variability of the data across the phases
were examined (Kennedy, 2005). Levels can be quantified by comparing mean scores
across each phase. The level of data within a phase demonstrates an estimation of the
central tendency of the data during the specified phase (Kennedy, 2005). The second
dimension used to examine data is trend, which was quantitatively estimated by
computing the least squares regression. This process fits a straight line to the slope of
the participants’ data by “minimizing the sum of squared deviations of the observed data
from the line” (Kennedy, 2005 p. 198). Further the trend coefficient was interpreted by
46

effect size of R2 according to the guidelines established by Cohen (1988) of R2 = .01
(small effect), R2 = .09 (medium effect), and R2 = .25 (large effect).
Variability, the third examination of data refers to the degree to which data points
deviate from the overall trend, or the best-fit straight line. The variability of data is
referred in terms of being high, medium, or low, and is relatively qualitative in nature
(Kennedy, 2005). Kazdin defined visual analysis of data as a process of examining
graphed data in order to reach judgments about the reliability and consistency of effects
of the intervention (Kazdin, 1982). Researchers look for a series of patterns in the
graphed data to draw conclusions about the intervention (Kennedy, 2005). Intervention
effects are observed when a large and immediate change and level of target is noted
after manipulation of the independent variable (Barlow & Hersen, 1984).
Visual analysis can be considered a subjective method for analysizing results,
that may increase type 1 error, and thus researchers utilizing single case design are
recommended to receive training in visual analysis (Kennedy, 2005). It is also
recommend that multiple analyses of results should be conducted by additional
individuals trained in visual analysis to determine if a functional relationship exists. For
this study, I received instruction and practice analyzing graphs with an experienced
associate professor and another doctoral student conducting single case analyses.
Visual analysis is an appropriate and preferred method for analyzing data in single case
design studies and all data from this study is described and presented according to the
recommendations of Kennedy (2005). Additionally, the parent’s data collected from
behavior and parenting checklists was examined, comparing pre, mid, and posttest
47

score means. This data was graphed and results were examined through visual
analysis.
Participant 1: Rachel
Rachel is a four year, three month old Caucasian female preschooler who lives
with her biological mother, father, and three half siblings. She qualified for participation
in this study due to an assessed Gesell Developmental Observation age of three and a
half years, six months below her chronological age. Rachel attends a local Head Start
preschool program. Rachel’s mother reported a normal pregnancy without
complications. Rachel has not experienced any significant developmental or medical
concerns. She has not received any previous type of mental health treatment including
counseling services. Her mother reported Rachel’s strengths as loving to play, being
very affectionate and loving, and she is eager to learn new things.
Rachel’s mother reported a maternal history of dyslexia and depressive
symptoms. She reported a history of domestic violence with her ex-husband prior to
Rachel’s birth with her current husband. She reported that Rachel is a very loving child,
but she has significant concerns for her child’s response to discipline and correction.
Rachel often pouts and has tantrums when she is corrected. Rachel’s mother also
reported adjustment concerns related to their blended family and sibling rivalry. Rachel
is very close to one sibling, but easily becomes jealous when attention is given to other
children in the family. Rachel reports that she hates going to school and believes her
peers and teachers “hate” her. Rachel’s Head Start teacher referred her for
participation in the study.
48

Visual analysis should include an examination of the level, trend, and variability
across the phases (Kennedy, 2005). This section will include Rachel’s averaged scores
from the scores across the three phases of baseline, intervention (PT), and follow-up for
DAYC Cognitive, Communication, and Social Emotional subtests.
Rachel participated in three weeks of baseline, eight weeks of once weekly PT,
and three weeks of a no-intervention follow-up phase. Figure 1 displays a graphical
representation of the standard scores for Rachel’s performance on the Cognitive
subtest for the DAYC.
R2 = 0.0249
0102030405060708090
100
1 2 3 4 5 6 7 8 9 10 11 12 13 14
baseline play therapy follow up
stan
dard
sco
res Baseline
InterventionFollow UpTrend line___ level
RR=.16
Figure 1. Rachel's DAYC combined phase Cognitive subtest results.
The graph clearly demonstrates the level (mean) of the intervention phase
increased from the baseline phase. Also, evident is the decrease in level during the
follow-up phase. The increase in level during the intervention (PT) phase indicated that
Rachel’s performance on the Cognitive subtest improved while receiving PT and her
scores decreased when the PT intervention was removed. The analyses of level
indicates improvement in Rachel’s performance, and upon Kennedy’s (2005)
49

recommendations additional calculations of trend were conducted. This process fits a
straight line to the slope of the participants’ data and the trend is quantitatively
estimated by computing the least squares regression. The trend line was calculated and
displayed in Figure 1. The least squares regression is interpreted as a small
relationship, R2 = .02, between the three phases and time.
The data across the three phases of Rachel’s performance on the Cognitive
subtest indicated a small amount of variability, which Kennedy (2005) described as the
extent to which the individual data points vary from the trend line.
DAYC Cognitive Subtest Individual Phase Analysis
After analyzing the data for the Cognitive subtest of the DAYC for Rachel across
all phases together, each separate phase were analyzed for level, trend and variability.
The three data points of the baseline phase indicated a level (mean) of 80.67 (range 78-
84), a large upward trend with a trend line of r = .65, and moderate variability (see
Figure 2).
R2 = 0.4286
0
10
20
30
40
50
60
70
80
90
1 2 3
Baseline weeks 1,2,3
stan
dard
sco
res
Baselinetrend linelevelLinear (Baseline)
R=.65___
Figure 2. Rachel’s DAYC Cognitive baseline results.
50
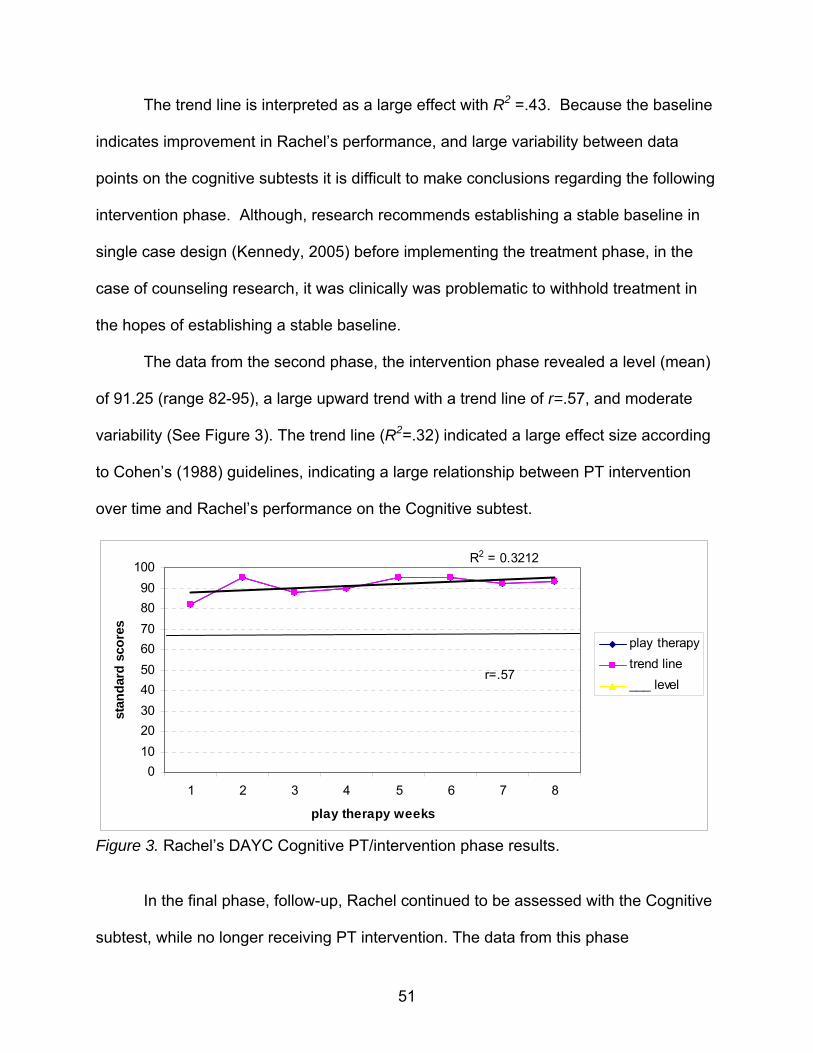
The trend line is interpreted as a large effect with R2 =.43. Because the baseline
indicates improvement in Rachel’s performance, and large variability between data
points on the cognitive subtests it is difficult to make conclusions regarding the following
intervention phase. Although, research recommends establishing a stable baseline in
single case design (Kennedy, 2005) before implementing the treatment phase, in the
case of counseling research, it was clinically was problematic to withhold treatment in
the hopes of establishing a stable baseline.
The data from the second phase, the intervention phase revealed a level (mean)
of 91.25 (range 82-95), a large upward trend with a trend line of r=.57, and moderate
variability (See Figure 3). The trend line (R2=.32) indicated a large effect size according
to Cohen’s (1988) guidelines, indicating a large relationship between PT intervention
over time and Rachel’s performance on the Cognitive subtest.
R2 = 0.3212
0102030405060708090
100
1 2 3 4 5 6 7 8
play therapy weeks
stan
dard
sco
res
play therapytrend line___ level
r=.57
Figure 3. Rachel’s DAYC Cognitive PT/intervention phase results.
In the final phase, follow-up, Rachel continued to be assessed with the Cognitive
subtest, while no longer receiving PT intervention. The data from this phase
51

demonstrates a level (mean) of 81.33 (range 80-84), with a high downward trend, and
low variability (see Figure 4). The trend line indicated a relationship of r = .87, with an
effect size of R2 = .75, interpreted as a large effect size. Results indicate a high
relationship between Rachel’s performance on the Cognitive subtest of DAYC with the
removal of the PT intervention.
R2 = 0.75
77
78
79
80
81
82
83
84
85
Three follow up weeks without play therapy
stan
dard
sco
res
Follow Up
trend line
___levelr=.87
Figure 4. Rachel’s DAYC Cognitive follow-up phase without intervention.
Visual Analysis of Rachel’s DAYC Communication Subtest Results across All Phases
This section includes Rachel’s averaged scores from the data across the three
phases of baseline, intervention (PT), and follow-up on the DAYC Communication
subtest.
Figure 5 displays a graphical representation of the standard scores for Rachel’s
performance on the Communication subtest for the DAYC. The graph demonstrates the
level (mean) of the intervention phase increased slightly from the baseline phase. Also,
evident is the decrease in level during the follow-up phase. In Phase 1, the mean level
is 60.33; in the second phase, the mean level is 60.75; the mean level in Phase 3 is
52
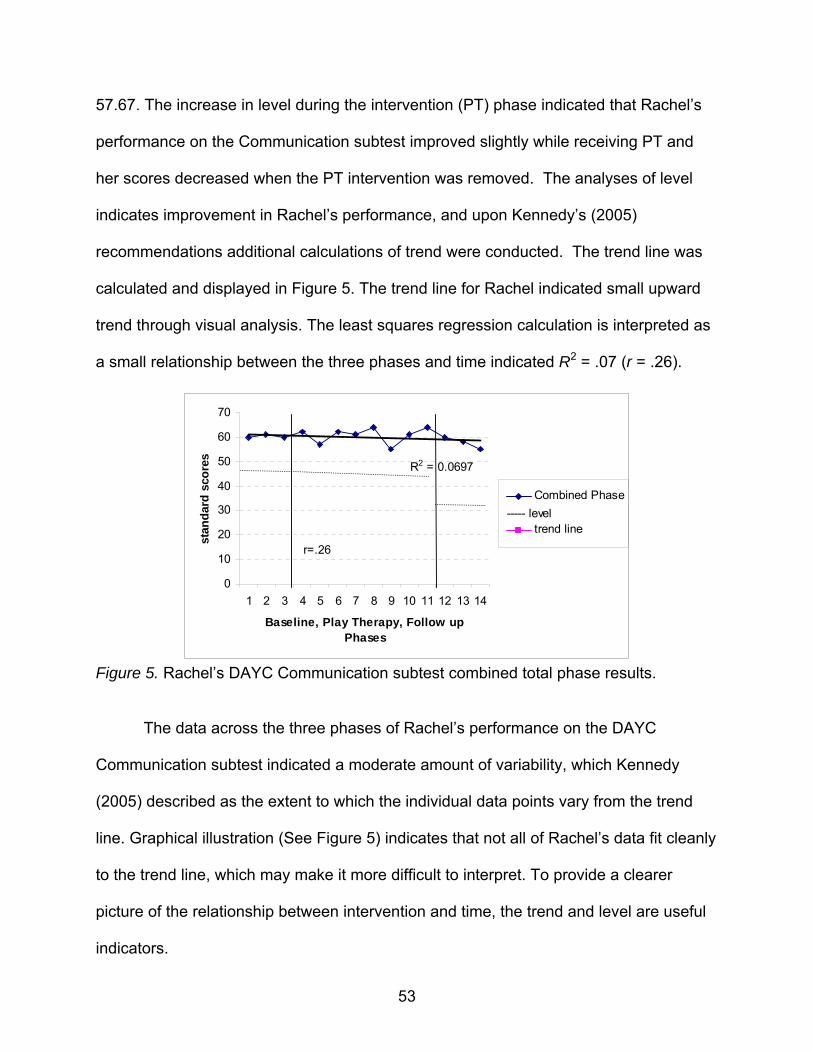
57.67. The increase in level during the intervention (PT) phase indicated that Rachel’s
performance on the Communication subtest improved slightly while receiving PT and
her scores decreased when the PT intervention was removed. The analyses of level
indicates improvement in Rachel’s performance, and upon Kennedy’s (2005)
recommendations additional calculations of trend were conducted. The trend line was
calculated and displayed in Figure 5. The trend line for Rachel indicated small upward
trend through visual analysis. The least squares regression calculation is interpreted as
a small relationship between the three phases and time indicated R2 = .07 (r = .26).
R2 = 0.0697
0
10
20
30
40
50
60
70
1 2 3 4 5 6 7 8 9 10 11 12 13 14
Baseline, Play Therapy, Follow up Phases
stan
dard
sco
res
Combined Phase
trend line
r=.26
----- level
Figure 5. Rachel’s DAYC Communication subtest combined total phase results.
The data across the three phases of Rachel’s performance on the DAYC
Communication subtest indicated a moderate amount of variability, which Kennedy
(2005) described as the extent to which the individual data points vary from the trend
line. Graphical illustration (See Figure 5) indicates that not all of Rachel’s data fit cleanly
to the trend line, which may make it more difficult to interpret. To provide a clearer
picture of the relationship between intervention and time, the trend and level are useful
indicators.
53

DAYC Communication Subtest Individual Phase Analysis
After analyzing the data for the Communication subtest of the DAYC for Rachel
across all phases together, each separate phase was analyzed for level, trend and
variability. The three data points of the baseline phase indicated a level (mean) of 60.33
(range 60-61), a flat trend and low variability with a trend line of r < .01,with an effect
size of R2 < .01 interpreted as a negligible effect. No effect size indicated that there was
no relationship between baseline time and results on the Communication subtest.
R2 < .01
59.4
59.6
59.8
60
60.2
60.4
60.6
60.8
61
61.2
1 2 3
Baseline phase
stan
dard
sco
re
trend line
baseliner=<.01
---- level
Figure 6. Rachel’s DAYC Communication subtest baseline results.
The data from the second phase, PT/intervention phase, revealed a level (mean)
of 60.75 (range 55-64), a low upward trend, moderate variability, with a trend line of r =
.15, with an effect size of R2 = .02, interpreted as a small effect size (see Figure 7). The
trend line indicated a small effect size according to Cohen’s (1988) guidelines,
indicating a small relationship between PT intervention over time and Rachel’s
performance on the Communication subtest.
54

R2 = 0.0213
505254
56586062
6466
1 2 3 4 5 6 7 8
play therapy
stan
dard
sco
res
play therapyr=.15
---level
Figure 7. Rachel’s DAYC Communication PT/intervention phase results.
In the final phase, follow-up, Rachel continued to be assessed with the
Communication subtest, while no longer receiving PT intervention. The data from this
phase demonstrates a mean level of 57.67 (range 55-60), with a high downward trend,
and low variability (see Figure 8). The trend line indicated a relationship of r = .99, with
an effect size of R2 = .99, interpreted as a large effect size. Results indicate a significant
relationship between Rachel’s performance on the Communication subtest of DAYC
with the removal of the PT intervention.
Chart Title
R2 = 0.9868
52535455565758596061
1 2 3
Follow Up Phase
stan
dard
sco
res
follow up
r=.99
---level
Figure 8. Rachel’s DAYC Communication follow- up with no intervention phase.
55

Visual Analysis of Rachel’s DAYC Social Emotional Subtest Results across All Phases
This section includes Rachel’s averaged scores from the data across the three
phases of baseline, intervention (PT), and follow-up on the DAYC Social Emotional
subtest.
Figure 9 displays a graphical representation of the standard scores for Rachel’s
performance on the Social Emotional subtest for the DAYC. The graph demonstrates
the mean level of the intervention phase increased from the baseline phase. Also,
evident is the slight decrease in level during the follow-up phase. In Phase 1, the mean
level is 97.33; in Phase 2, the level is 100.37; and the mean level in Phase 3 is 96.67.
The increase in level during the intervention (PT) phase indicated that Rachel’s
performance on the Social Emotional subtest improved while receiving PT and her
scores slightly decreased when the PT intervention was removed. The analyses of
level indicates improvement in Rachel’s performance, and upon Kennedy’s (2005)
recommendations, additional calculations of trend were conducted.
R2 = 0.0095
889092949698
100102104106
1 2 3 4 5 6 7 8 9 10 11 12 13 14
Baseline, play therapy, and follow up phases
stan
dard
sco
res
combined phase
r=.10
---level
Figure 9. Rachel’s DAYC Social Emotional subtest combined phase results.
The trend line was calculated and displayed in Figure 9. The trend line for Rachel
56

indicated small downward trend through visual analysis. The least squares regression
calculation of r = .10 indicated a small relationship between the three phase and time
with an effect size of R2 = .01.
The data across the three phases of Rachel’s performance on the Social
Emotional subtest indicated a moderate amount of variability, which Kennedy (2005)
described as the extent to which the individual data points vary from the trend line.
Graphical illustration indicates that not all of Rachel’s data fit cleanly to the trend line,
which may make it more difficult to interpret. To provide a clearer picture of the
relationship between intervention and time, the trend and level are useful indicators.
DAYC Social Emotional Subtest Individual Phase Analysis
After analyzing the data for the Social Emotional subtest of the DAYC for Rachel
across all phases together, each separate phase was analyzed for level, trend and
variability. The three data points of the baseline phase indicated a level (mean) of 97.33
(range 96-98), a flat trend with a trend line of r < .01, with an effect size of R2 < .01
interpreted as a negligible effect and low variability (see Figure 10). No effect size
indicated that there was no relationship between baseline time and results on the Social
Emotional subtest. Figure 10 graphically illustrates this analysis.
The data from the second phase, the intervention phase, revealed a mean level
of 100.37 (range 98-105), a relatively flat trend with a trend line of r <.01, with an effect
size of R2 <.01 interpreted as a negligible effect size, and moderate variability among
data points (See Figure 11). The trend line indicated a negligible effect size according to
57

Cohen’s (1988) guidelines, indicating a low relationship between PT intervention over
time and Rachel’s performance on the Social Emotional subtest.
R2 <.01
95
95.5
96
96.5
97
97.5
98
98.5
1 2 3
Baseline
scor
es
baseliner<.01
---level
Figure 10. Rachel’s DAYC Social Emotional subtest baseline phase results.
R2 = 0.0001
94
96
98
100
102
104
106
1 2 3 4 5 6 7 8
play therapy phase
stan
dard
sco
res
play therapy
r=.01
---level
Figure 11. Rachel’s DAYC Social Emotional subtest PT/intervention phase results.
In the final phase, follow-up, Rachel continued to be assessed with the Social
Emotional subtest, while no longer receiving PT intervention. The data from this phase
demonstrates a mean level of 96.67 (range 94-98), with a high downward trend, and low
58

variability (see Figure 12). The trend line indicated a relationship with an effect size of
R2 = .75, (r = .87). Results indicate a significant relationship between Rachel’s
performance on the Social Emotional subtest of DAYC with the removal of the PT
intervention.
R2 = 0.75
919293949596979899
100
1 2 3
follow up phase
stan
dard
sco
res
follow up
r=.87
---level
Figure 12. Rachel’s DAYC Social Emotional follow-up phase results.
Gesell Developmental Observation Results
The first administration of the instrument was given prior to the baseline phase
and a developmental quotient of three and a half years was measured with her
chronological age being four years and three months. The second administration
(posttest) was conducted after the 11th week of the study after the 8 week intervention
phase. This posttest administration yielded a developmental quotient of four and a half
years, with her chronological age being four years and seven months. Results indicate
improvement over time in Rachel’s developmental quotient as measured by the Gesell
Developmental Observation. Figure 13 graphically illustrates these results.
59

pre and post scores
00.5
11.5
22.5
33.5
44.5
5
1 2
pre-test post-test
deve
lopm
enta
l age
pre and post scores
Figure 13. Rachel’s Gesell Developmental Observation results.
Parent Data
Child Behavior Checklist
Rachel’s mother completed the CBCL assessments at two separate occurrences
during the study’s phases: pretest and posttest. Pretest data was collected during the
first week of the baseline phase and results indicate Rachel’s mother rated Rachel’s
Internalizing (T-score = 59), Externalizing (T-score = 52), and Total Problems (T-score =
56) behavior in the nonclinical range. The posttest results indicate nonclinical results
across all three scales of Internalizing (T-score = 49) Externalizing (T-score = 39), and
Total Problems (T-score = 42). Although the T-scores from both administrations were
assessed in the nonclinical range, the T-scores decreased on the posttest
administration indicating a decrease in measured behavior problems. Data are
graphically represented in Figure 14.
60

0
10
20
30
40
50
60
70
1 2 3Internalizing Problems Externalizing Problems Total
Problems
T-sc
ores
pre
post---borderline
__clinical
Figure 14. Rachel’s Child Behavior Checklist results.
Parenting Stress Index
Additionally, Rachel’s mother rated her relationship with Rachel using the PSI.
Two administrations of the PSI occurred at the same intervals as the CBCL, including:
pretest (during first week of baseline phase), and posttest (occurring after the 8 PT
session during the intervention phase (see Figure 15). Pretest results indicated Rachel’s
mother rated the Child Domain in the nonclinical range (T-score = 98), while rating the
Parent Domain (T-score = 168) and Total Stress Domains (T-score = 266) were rated in
the clinical range. The posttest administration yielded nonclinical results in the Child
Domain (T-score = 114), and clinical results in the Parent Domain (T-score = 180) and
Total Stress Domain (T-score = 294).
61

0
50
100
150
200
250
300
350
1 2 3
Child Domain Parent Domain Total Stress
T-sc
ores pre
post
Figure 15. Rachel’s Parenting Stress Index pre- and posttest results.
Participant 2: Brian
Brian is a five-year-old boy who qualified for participation in this study due to an
assessed Gesell Developmental Observation age of four years, one year below his
chronological age of five years and seven months. Brian lives with his biological mother
and two younger siblings. His parents are separated and he visits his biological father
every other weekend and two days during the week. Brian’s mother reported a history of
domestic violence between herself and Brian’s father, and paternal history of bipolar
disorder. Brian witnessed the abuse of his mother by his father throughout his early
childhood. His parents have been separated for the past four months with plans to
divorce.
Brian’s mother reported normal pregnancy and delivery without complications.
Developmental milestones were met within typical guidelines. Brian is under a
physician’s care for seizures that began approximately one year ago, and currently
takes an oxcarbazepine anti-seizure medication (130 mg) daily to prevent their
62

occurrence. Brian’s mother reported his strengths are being a loving and caring child
who is full of energy. Brian’s mother reported concerns for his difficulty adjusting to
changes in his routine, impulsivity, aggressive behavior, and “slow learning.” Brian often
hits and kicks his siblings and his peers when frustrated. He experiences difficulty
responding to direction and limit setting. He becomes noncompliant and angry when he
does not get his way. She reported Brian requires frequent prompting and redirection to
stay on task and often will not do his work unless he is “pushed.” Brian received
counseling services for two months during the past year, but during this study received
no outside mental health intervention or treatment.
Visual Analysis of Brian’s DAYC Cognitive Subtest Results across All Phases
This section includes the averaged scores from the data across the three phases
of baseline, intervention (PT), and follow-up on the DAYC Cognitive subtest.
Brian participated in three weeks of baseline, eight weeks of once weekly PT,
and three weeks of a no-intervention follow-up phase. Figure 16 displays a graphical
representation of the standard scores for Brian’s performance on the Cognitive subtest
for the DAYC. The graph demonstrates that the level (mean) of the intervention phase
increased from the baseline phase. Also, evident is the decrease in level during the
follow-up phase. In Phase 1, the mean level is 72; in Phase 2, the mean level is 80.75;
the mean level in Phase 3 is 79.33. The increase in level during the intervention (PT)
phase indicated that Brian’s performance on the Cognitive subtest improved while
receiving PT and his scores decreased when the PT intervention was removed. The
analyses of level indicates improvement in Brian’s performance, and upon Kennedy’s
63

(2005) recommendations additional calculations of trend were conducted. The trend
line was calculated and displayed in Figure 16. The trend line for Brian indicated high
upward trend through visual analysis. The least squares regression calculation is
interpreted as a large relationship between the three phases and time indicated by R2 =
.33 (r =.58).
The data across the three phases of Brian’s performance on the DAYC Cognitive
subtest indicated a low amount of variability, which Kennedy (2005) described as the
extent to which the individual data points vary from the trend line. Graphical illustration
indicates that most of Brian’s data fit cleanly to the trend line. To provide an even
clearer picture of the relationship between intervention and time, the trend and level are
useful indicators.
R2 = 0.333
0102030405060708090
100
1 2 3 4 5 6 7 8 9 10 11 12 13 14
Baseline (1-3) Play Therapy(4-11) Follow-Up (12-14)
Sta
ndar
d Sc
ores combined phase data
trend liner=.58
------level
Figure 16. Brian’s DAYC Cognitive subtest combined phase overall results.
DAYC Cognitive Subtest Individual Phase Analysis
After analyzing the data for the Cognitive subtest of the DAYC for Brian across all
64

phases together, each separate phase was analyzed for level, trend and variability. The
three data points of the baseline phase indicated a level (mean) of 72 (range 70-73), a
flat trend with a trend line of r ≤ .01, with an effect size of R2 < .01 interpreted as no
effect and moderate variability (see Figure 17). No effect size indicates that there was
no relationship between baseline time and results on the Cognitive subtest. Although,
research recommends establishing a stable baseline in single case design (Kennedy,
2005) before implementing the treatment phase, in the case of counseling research,
clinically it was problematic to withhold treatment in the hopes of establishing a stable
baseline.
R2 <. 01
68
69
70
71
72
73
74
1 2 3
Baseline Weeks 1-3
stan
dard
sco
res
baseliner<.01
---level
Figure 17. Brian’s DAYC Cognitive subtest baseline phase results.
The data from the second phase, PT/intervention, revealed a level (mean) of
80.75 (range 73-87), moderate variability, and high upward trend with a trend line of r =
.57, with an effect size of R2 = .32 interpreted as a large effect size (see Figure 18). The
trend line indicated a large effect size according to Cohen’s (1988) guidelines, indicating
a large relationship between PT intervention over time and Brian’s performance on the
Cognitive subtest.
65

R2 = 0.3202
65
70
75
80
85
90
1 2 3 4 5 6 7 8
play therapy phase weeks
stan
dard
sco
res
play therapy
r=.57----level
Figure 18. Brian’s DAYC Cognitive subtest PT/intervention phase results.
In the final phase, follow-up, Brian continued to be assessed with the Cognitive
subtest, while no longer receiving PT intervention. The data from this phase
demonstrates a level (mean) of 79.33 (range 72-84), with a high downward trend, and
low variability (see Figure 19). The trend line indicated a relationship of r = .93, with an
effect size of R2 = .87, interpreted as a large effect size. Results indicate a significant
relationship between Brian’s performance on the Cognitive subtest of DAYC with the
removal of the PT intervention.
R2 = 0.871
65
70
75
80
85
90
1 2 3
Follow Up Phase (Three Weeks)
Sta
ndar
d S
core
s
follow up results
r=.93
---level
Figure 19. Brian’s DAYC Cognitive subtest follow-up phase results.
66

Visual Analysis of Brian’s DAYC Communication Subtest Results across All Phases
This section includes Brian’s averaged scores from the data across the three
phases of baseline, intervention (PT), and follow-up on the DAYC Cognitive subtest.
Figure 20 displays a graphical representation of the standard scores for Brian’s
performance on the Communication subtest for the DAYC. The graph clearly
demonstrates the mean level of the intervention phase increased from the baseline
phase. Also, evident is the decrease in level during the follow-up phase. In Phase 1, the
mean level is 62; in Phase 2, the mean level is 79.36; the mean level in Phase 3 is
77.67. The increase in level during the intervention (PT) phase indicated that Brian’s
performance on the Communication subtest improved while receiving PT and his scores
decreased when the PT intervention was removed. The analyses of level indicates
improvement in Brian’s performance, and upon Kennedy’s (2005) recommendations
additional calculations of trend were conducted. The trend line was calculated and
displayed in Figure 20. The trend line for Brian indicated large upward trend through
visual analysis. The least squares regression calculation of r = .61 indicated a large
relationship between the three phases and time, with an effect size of R2 = .37.
The data across the three phases of Brian’s performance on the Communication
subtest indicated a moderate amount of variability, which Kennedy (2005) described as
the extent to which the individual data points vary from the trend line. Graphical
illustration indicates that not all of Brian’s data fit cleanly to the trend line, which may
make it more difficult to interpret. To provide a clearer picture of the relationship
between intervention and time, the trend and level are useful indicators.
67

R2 = 0.3749
0102030405060708090
100
1 2 3 4 5 6 7 8 9 10 11 12 13 14
baseline, play therapy, and follow up weeks
stan
dard
sco
res
communicationsubtest scoresr=.61
level=75.3
----level
Figure 20. Brian’s DAYC Communication subtest combined phase results.
DAYC Communication Subtest Individual Phase Analysis
After analyzing the data for the Communication subtest of the DAYC for Brian
across all phases together, each separate phase was analyzed for level, trend and
variability. The three data points of the baseline phase indicated a level (mean) of 62
(range 61-63), a moderate upward trend with moderate variability, and a trend line of r =
.5, with an effect size of R2 = .25 interpreted as a large effect size (see Figure 21).
R2 = 0.25
60
60.5
61
61.5
62
62.5
63
63.5
1 2 3
Baseline weeks 1-3
stan
dard
sco
res
baseliner=.5
----level
Figure 21. Brian’s DAYC Communication subtest baseline phase.
68
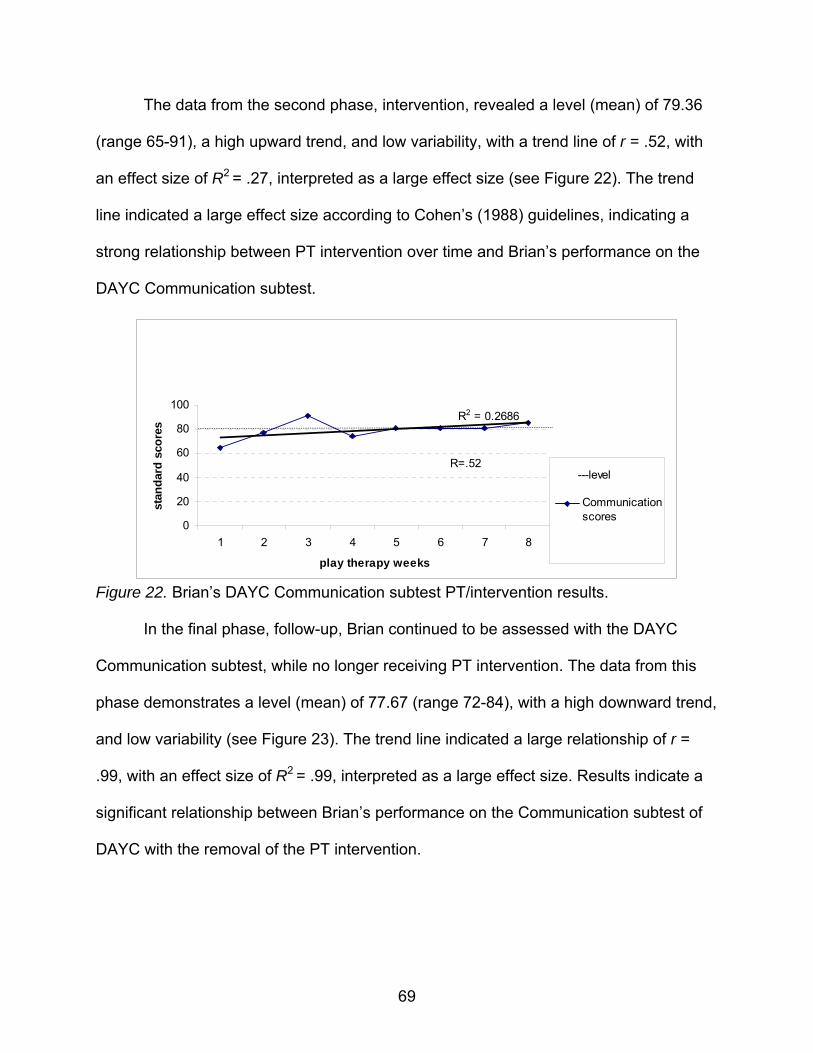
The data from the second phase, intervention, revealed a level (mean) of 79.36
(range 65-91), a high upward trend, and low variability, with a trend line of r = .52, with
an effect size of R2 = .27, interpreted as a large effect size (see Figure 22). The trend
line indicated a large effect size according to Cohen’s (1988) guidelines, indicating a
strong relationship between PT intervention over time and Brian’s performance on the
DAYC Communication subtest.
R2 = 0.2686
0
20
40
60
80
100
1 2 3 4 5 6 7 8
play therapy weeks
stan
dard
sco
res
Communicationscores
R=.52---level
Figure 22. Brian’s DAYC Communication subtest PT/intervention results.
In the final phase, follow-up, Brian continued to be assessed with the DAYC
Communication subtest, while no longer receiving PT intervention. The data from this
phase demonstrates a level (mean) of 77.67 (range 72-84), with a high downward trend,
and low variability (see Figure 23). The trend line indicated a large relationship of r =
.99, with an effect size of R2 = .99, interpreted as a large effect size. Results indicate a
significant relationship between Brian’s performance on the Communication subtest of
DAYC with the removal of the PT intervention.
69
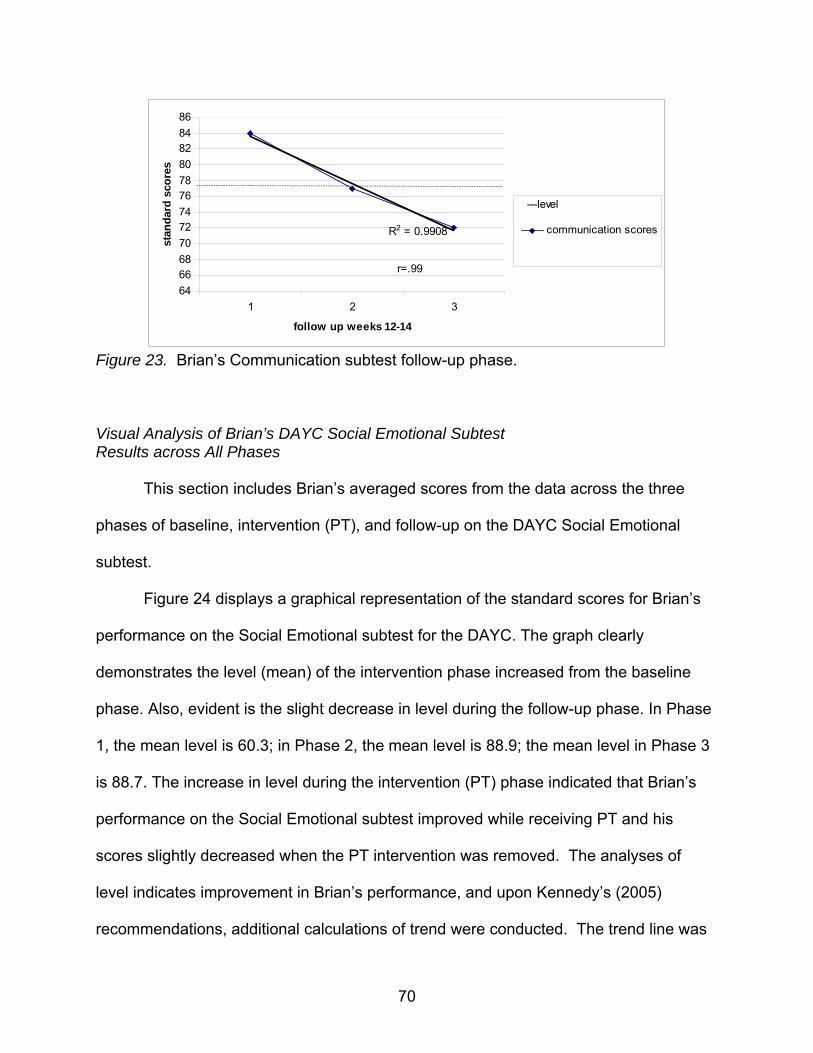
R2 = 0.9908
646668707274767880828486
1 2 3
follow up weeks 12-14
stan
dard
sco
res
communication scores
r=.99
---level
Figure 23. Brian’s Communication subtest follow-up phase.
Visual Analysis of Brian’s DAYC Social Emotional Subtest Results across All Phases
This section includes Brian’s averaged scores from the data across the three
phases of baseline, intervention (PT), and follow-up on the DAYC Social Emotional
subtest.
Figure 24 displays a graphical representation of the standard scores for Brian’s
performance on the Social Emotional subtest for the DAYC. The graph clearly
demonstrates the level (mean) of the intervention phase increased from the baseline
phase. Also, evident is the slight decrease in level during the follow-up phase. In Phase
1, the mean level is 60.3; in Phase 2, the mean level is 88.9; the mean level in Phase 3
is 88.7. The increase in level during the intervention (PT) phase indicated that Brian’s
performance on the Social Emotional subtest improved while receiving PT and his
scores slightly decreased when the PT intervention was removed. The analyses of
level indicates improvement in Brian’s performance, and upon Kennedy’s (2005)
recommendations, additional calculations of trend were conducted. The trend line was
70

calculated and displayed in Figure 24. The trend line for Brian indicated high upward
trend through visual analysis. The least squares regression calculation of r = .79
indicated a large relationship between the three phases and time with an effect size of
R2 = .62.
R2 = 0.6277
0
20
40
60
80
100
120
1 2 3 4 5 6 7 8 9 10 11 12 13 14
baseline, play therapy, follow up weeks
stan
dard
sco
res
Social Emotional scoresr=.79
---level
Figure 24. Brian’s DAYC Social Emotional subtest combined phase results.
The data across the three phases of Brian’s performance on the Social
Emotional subtest indicated a moderate amount of variability, which Kennedy (2005)
described as the extent to which the individual data points vary from the trend line.
Graphical illustration indicates that not all of Brian’s data fit cleanly to the trend line,
which may make it more difficult to interpret. To provide a clearer picture of the
relationship between intervention and time, the trend and level are useful indicators.
DAYC Social Emotional Subtest Individual Phase Analysis
After analyzing the data for the Social Emotional subtest of the DAYC for Brian
across all phases together, each separate phase was analyzed for level, trend and
variability. The three data points of the baseline phase indicated a level (mean) of 60.3
71

(range 59-62), a high downward trend, and moderate variability, with a trend line of r =
.65, with an effect size of R2 = .43 interpreted as a large effect size (see Figure 25).
R2 = 0.4286
57.558
58.559
59.560
60.561
61.562
62.5
1 2 3
baseline weeks 1,2,3
stan
dard
sco
res
social emotional scores
r=.65
----level
Figure 25. Brian’s DAYC Social Emotional baseline phase results.
The data from the second phase, the intervention phase, revealed a level (mean)
of 88.9 (range 74-105), a high upward trend, low variability, with a high trend line of r =
.84, with an effect size of R2 = .88 interpreted as a large effect size, and low moderate
variability among data points (see Figure 26). The trend line indicated a large effect size
according to Cohen’s (1988) guidelines, indicating a strong relationship between PT
intervention over time and Brian’s performance on the Social Emotional subtest.
R2 = 0.7015
0
20
40
60
80
100
120
1 2 3 4 5 6 7 8
play therapy weeks
stan
dard
sco
res
social emotioanl scores
r=.84----level
Figure 26. Brian’s DAYC Social Emotional subtest PT/intervention phase.
72

In the final phase, follow-up, Brian continued to be assessed with the Social
Emotional subtest, while no longer receiving PT intervention. The data from this phase
demonstrates a level (mean) of 88.7 (range 80-105), with a high downward trend, and
minimal variability. The trend line indicated a large relationship with an effect size of R2
= .99 (r = .99) (see Figure 27). Results indicate a significant relationship between
Brian’s performance on the Social Emotional subtest of DAYC with the removal of the
PT intervention.
R2 = 0.9952
0
20
40
60
80
100
120
1 2 3
follow up
stan
dard
sco
res
social emotionallscores
r=.99
---level
Figure 27. Brian’s DAYC Social Emotional subtest follow-up phase results.
Brian was administered the pretest Gesell Developmental Observation prior to
the baseline phase. Results yielded a developmental quotient of four year when his
chronological age of five years and seven months. The posttest administration occurred
after the eighth PT session of the intervention phase and results yielded a
developmental quotient of five years, with his chronological age being five years ten
months (see Figure 28).
73

0
1
2
3
4
5
6
1 2
pretest post test
deve
lopm
enta
l age
pre and post
Figure 28. Brian’s Gesell Developmental Observation pre- and posttest results.
Parent Data
Child Behavior Checklist
Brian’s mother completed the CBCL assessments at three separate occurrences
during the study: pretest, midpoint, and posttest. Pretest data was collected during the
first week of the baseline phase and results indicate Brian’s mother rated his
Internalizing behavior (T-score = 65), Externalizing behavior (T-score = 73), and Total
Problem (T-score = 72) scales in the clinical range. During the mid-point data
collection, given during Week 4 of the intervention phase, Brian’s mother rated his
Internalizing behavior (T-score = 55) scale in the nonclinical range, his Externalizing
behavior (T-score = 70) in the clinical range, and his Total Problem scale (T-score = 72)
was rated in the borderline range. Finally, the posttest administration which occurred
after the eighth week of the intervention phase yielded results indicating nonclinical
results in Internalizing problems (T-score = 43), Externalizing problems (T-score = 57)
74
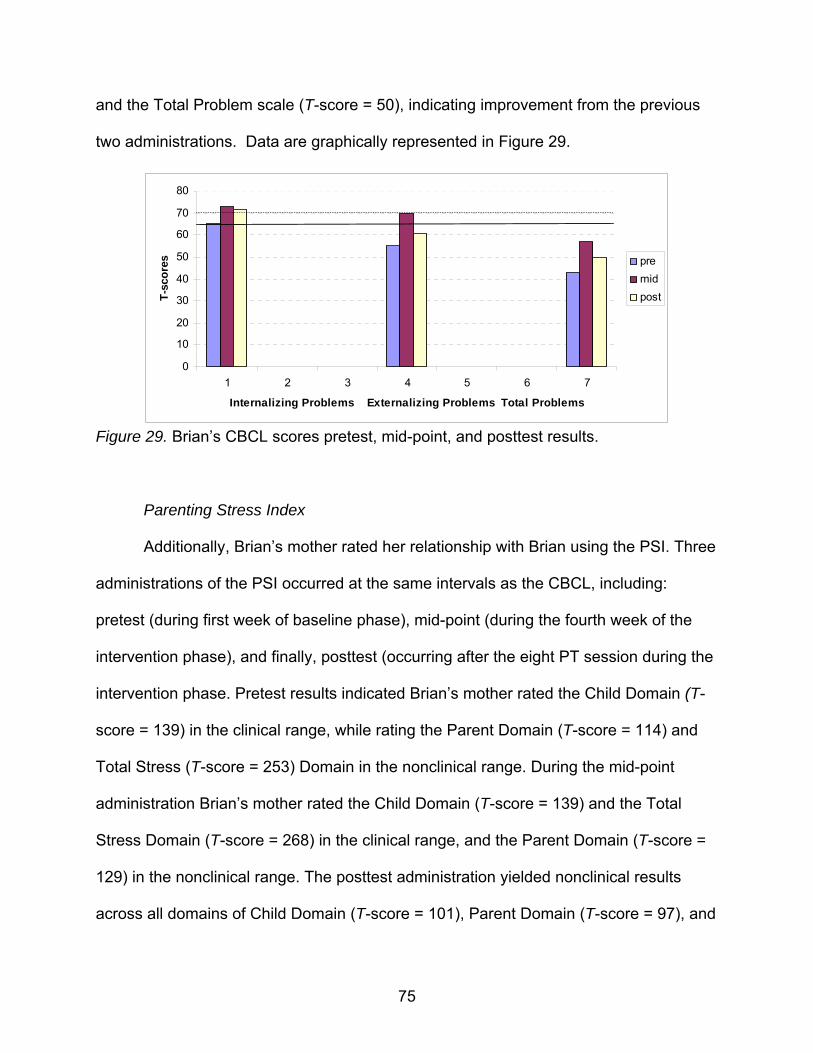
and the Total Problem scale (T-score = 50), indicating improvement from the previous
two administrations. Data are graphically represented in Figure 29.
0
10
20
30
40
50
60
70
80
1 2 3 4 5 6 7
Internalizing Problems Externalizing Problems Total Problems
T-sc
ores pre
midpost
Figure 29. Brian’s CBCL scores pretest, mid-point, and posttest results.
Parenting Stress Index
Additionally, Brian’s mother rated her relationship with Brian using the PSI. Three
administrations of the PSI occurred at the same intervals as the CBCL, including:
pretest (during first week of baseline phase), mid-point (during the fourth week of the
intervention phase), and finally, posttest (occurring after the eight PT session during the
intervention phase. Pretest results indicated Brian’s mother rated the Child Domain (T-
score = 139) in the clinical range, while rating the Parent Domain (T-score = 114) and
Total Stress (T-score = 253) Domain in the nonclinical range. During the mid-point
administration Brian’s mother rated the Child Domain (T-score = 139) and the Total
Stress Domain (T-score = 268) in the clinical range, and the Parent Domain (T-score =
129) in the nonclinical range. The posttest administration yielded nonclinical results
across all domains of Child Domain (T-score = 101), Parent Domain (T-score = 97), and
75

Total Stress Domain (T-score = 198). Improvement was noted in the posttest
administration in the reduction of parenting stress across all domains. Figure 30
graphically illustrates these results.
0
50
100
150
200
250
300
1 2 3 4 5 6 7 8 9 10 11 12
Child Domain Parent Domain Total Stress
T-sc
ores pre
midpost
Figure 30. Brian’s PSI pretest, midpoint, and posttest results.
Partiicipant 3: Nate
Nate is a three years, three month old child who qualified for participation in this
study due to an assessed Gesell Developmental Observation age of two and a half
years, six months below his chronological age. He lives with his adoptive mother and
father, his three adoptive siblings, and his biological younger brother. Nate and his
younger brother were removed from their biological mother due to physical abuse and
neglect and were adopted by their current parents. Early medical and developmental
history is limited due to the adoption process. His parents reported strengths in the
areas of being affectionate, playful, and a loving child. Nate has a history of physical
aggression, disruption in attachment, and excessive impulsivity. Nate often hits and
kicks his siblings. There are times when his behavior is erratic and unpredictable. He
76

has difficulty getting along with his siblings and peers, and often does not follow
directions. His parents report a high degree of energy, distractibility, and inattentiveness
in Nate’ behavior. He often refuses to comply with directions, and runs away from
parents, regardless of the safety of the situation. Developmentally, Nate is reported to
have delays in meeting developmental tasks such as toilet training, speech/language
development, and self-control. He has not been treated for any medical or behavioral
difficulties. Nate’s father reported plans for future testing with the school district’s
preschool program for symptoms consistent with attention deficit/hyperactivity disorder
(ADHD). His parents’ biggest concerns are in the areas of discipline, and aggression.
Visual Analysis of Nate’s DAYC Cognitive Subtest Results across All Phases
This section includes Nate’s averaged scores from the data across the three
phases of baseline, intervention (PT), and follow-up on the DAYC Cognitive subtest.
Figure 31 displays a graphical representation of the standard scores for Nate’s
performance on the Cognitive subtest for the DAYC. The graph clearly demonstrates
the level (mean) of the intervention phase increased from the baseline phase. Also,
evident is the decrease in level during the follow-up phase. In Phase 1, the mean level
is 76.66; in Phase 2, the mean level is 82.5; the mean level in Phase 3 is 72.66. The
increase in level during the intervention (PT) phase indicated that Nate’s performance
on the Cognitive subtest improved while receiving PT and his scores decreased when
the PT intervention was removed. The analyses of level indicates improvement in
Nate’s performance, and upon Kennedy’s (2005) recommendations, additional
calculations of trend were conducted. The trend line was calculated and displayed in
77

Figure 31. The trend line for Nate was analyzed visually as flat and low variability. The
least squares regression calculation is interpreted as a small relationship between the
three phases and time indicated by R2=.004 (r=.06).
R2 = 0.0041
0102030405060708090
100
1 2 3 4 5 6 7 8 9 10 11 12 13 14
baseline (1-3), play therapy (4-11), follow-up (12-14)
stan
dard
sco
res
cognitive scores
r=.06
---level
Figure 31. Nate’s DAYC Cognitive subtest combined phase results.
The data across the three phases of Nate’s performance on the DAYC Cognitive
subtest indicated a low amount of variability, which Kennedy (2005) described as the
extent to which the individual data points vary from the trend line. Graphical illustration
indicates that most of Nate’s data fit cleanly to the trend line. To provide an even clearer
picture of the relationship between intervention and time, the trend and level are useful
indicators.
DAYC Cognitive Subtest Individual Phase Analysis
After analyzing the data for the Cognitive subtest of the DAYC for Nate across all
phases together, each separate phase was analyzed for level, trend and variability. The
three data points of the baseline phase indicated a level (mean) of 76.66 (range 76-77),
78

a high upward trend low variability, with a trend line of r = .87, with an effect size of R2 =
.75 interpreted as a large effect size (see Figure 32).
R2 = 0.75
75
75.5
76
76.5
77
77.5
1 2 3
baseline weeks
scor
es cognitve scoresr=.87
---level
Figure 32. Nate’s DAYC Cognitive subtest baseline phase results.
The data from the second phase, PT/intervention, revealed a level (mean) of
82.5 (range 77-90), moderate variability, and high upward trend with a trend line of r =
.75, with an effect size of R2 = .56 interpreted as a large effect size (see Figure 33). The
trend line indicated a large effect size according to Cohen’s (1988) guidelines, indicating
a large relationship between PT intervention over time and Nate’s performance on the
Cognitive subtest.
R2 = 0.5573
70
75
80
85
90
95
1 2 3 4 5 6 7 8
play therapy weeks
scor
es
cognitive scores
r=.75
---level
Figure 33. Nate’ DAYC Cognitive PT/intervention phase results.
79

In the Final phase, follow-up, Nate continued to be assessed with the Cognitive
subtest, while no longer receiving PT intervention. The data from this phase
demonstrates a level (mean) of 72.66 (range 70-77), with a high downward trend, and
low variability (see Figure 34). The trend line indicated a large relationship of r = .92,
with an effect size of R2 = .85, interpreted as a large effect size. Results indicate a high
relationship between Nate’s performance on the Cognitive subtest of DAYC with the
removal of the PT intervention.
R2 = 0.8547
64
66
68
70
72
74
76
78
1 2 3
follow up phase
scor
es cognitive scores
r=.92
l l
----level
Figure 34. Nate’s DAYC Cognitive subtest follow-up/no intervention phase results.
Visual Analysis of Nate’s DAYC Communication Subtest Results across All Phases
This section includes Nate’s averaged scores from the data across the three
phases of baseline, intervention (PT), and follow-up on the DAYC Communication
subtest.
Figure 35 displays a graphical representation of the standard scores for Nate’s
performance on the Communication subtest for the DAYC. The graph clearly
80

demonstrates the level (mean) of the intervention phase increased from the baseline
phase. Also, evident is the decrease in level during the follow-up phase. In Phase 1, the
mean level is 70; in Phase 2, the mean level is 73.8; the mean level in Phase 3 is 59.33.
The increase in level during the intervention (PT) phase indicated that Nate’s
performance on the Communication subtest improved while receiving PT and his scores
decreased when the PT intervention was removed. The analyses of level indicates
improvement in Nate’s performance, and upon Kennedy’s (2005) recommendations,
additional calculations of trend were conducted.
R2 = 0.0336
0102030405060708090
1 2 3 4 5 6 7 8 9 10 11 12 13 14
baseline, playtherapy, follow-up
stan
dard
sco
res
communication scoresr=.18
----level
Figure 35. Nate’s DAYC Communication subtest combined phase results.
The trend line was calculated and displayed in Figure 35. The trend line for Nate
indicated small downward trend through visual analysis. The least squares regression
calculation of r = .18 indicated a small relationship between the three phases and time
with an effect size of R2 = .03.
The data across the three phases of Nate’s performance on the Communication
subtest indicated a low amount of variability, which Kennedy (2005) described as the
extent to which the individual data points vary from the trend line. To provide a clearer
81

picture of the relationship between intervention and time, the trend and level are useful
indicators.
DAYC Communication Subtest Individual Phase Analysis
After analyzing the data for the Communication subtest of the DAYC for Nate
across all phases together, each separate phase will be analyzed for level, trend and
variability. The three data points of the baseline phase indicated a level (mean) of 70
(range 63-75), a moderate upward trend with moderate variability (See Figure 36). The
trend line of r = .24, indicated a small effect size of R2 = .06 interpreted as a small effect
size. Figure 36 graphically illustrates this analysis.
R2 = 0.0577
5658606264666870727476
1 2 3
baseline
scor
es
communication scores
r=.24
----level
Figure 36. Nate’s DAYC Communication subtest baseline results.
The data from the second phase, intervention, revealed a level (mean) of 73.8
(range 59-85), a high upward trend, and low variability, with a trend line of r = .73, with
an effect size of R2 = .53, interpreted as a large effect size (see Figure 37). The trend
line indicated a large effect size according to Cohen’s (1988) guidelines, indicating a
strong relationship between PT intervention over time and Nate’s performance on the
82

Communication subtest.
R2 = 0.5258
0
10
20
30
40
50
60
70
80
90
1 2 3 4 5 6 7 8
play therapy phase
scor
es
communication scores
r=.73
-----level
Figure 37. Nate’s DAYC Communication subtest PT/intervention phase.
In the final phase, follow-up, Nate continued to be assessed with the
Communication subtest, while no longer receiving PT intervention. The data from this
phase demonstrates a level (mean) of 59.33 (range 55-60), with a high downward trend,
and low variability (see Figure 38). The trend line indicated a large relationship with an
effect size of R2 = .98 (r = .99). Results indicate a significant relationship between
Nate’s performance on the Communication subtest of DAYC with the removal of the PT
intervention.
R2 = 0.9868
52535455565758596061
1 2 3
Follow Up Phase
stan
dard
sco
res
communication scores
r=.99
-----level
Figure 38. Nate’s DAYC Communication follow-up phase results.
83
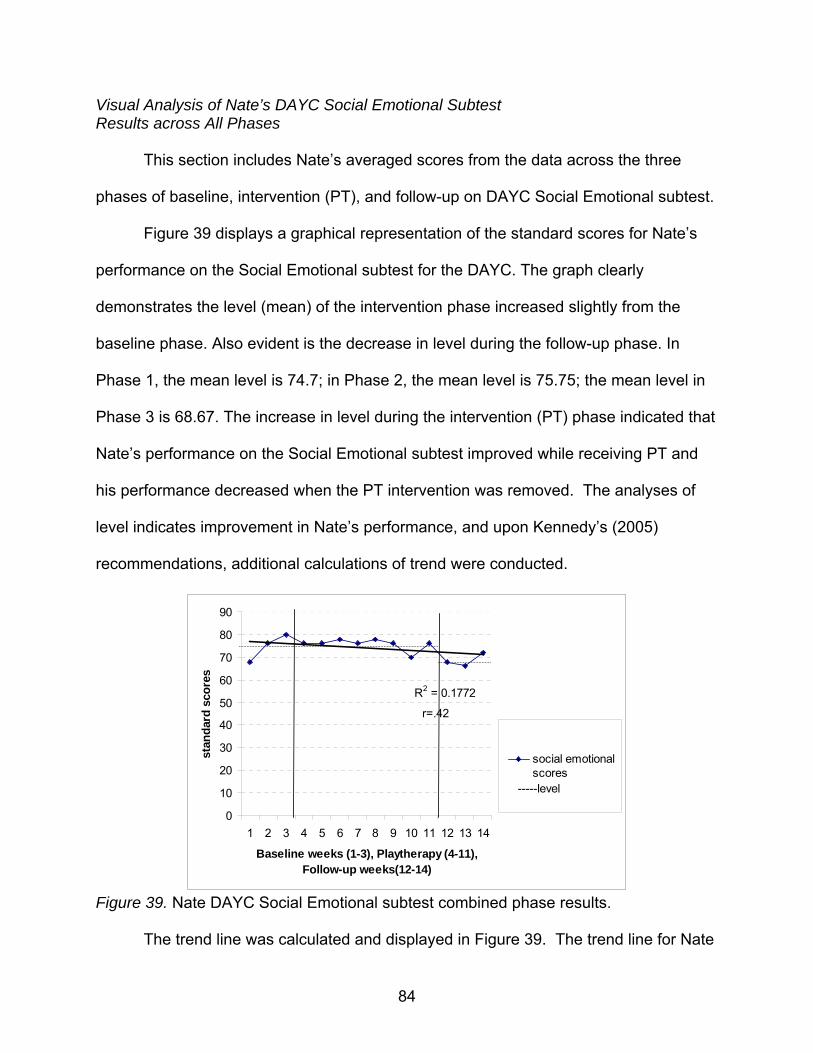
Visual Analysis of Nate’s DAYC Social Emotional Subtest Results across All Phases
This section includes Nate’s averaged scores from the data across the three
phases of baseline, intervention (PT), and follow-up on DAYC Social Emotional subtest.
Figure 39 displays a graphical representation of the standard scores for Nate’s
performance on the Social Emotional subtest for the DAYC. The graph clearly
demonstrates the level (mean) of the intervention phase increased slightly from the
baseline phase. Also evident is the decrease in level during the follow-up phase. In
Phase 1, the mean level is 74.7; in Phase 2, the mean level is 75.75; the mean level in
Phase 3 is 68.67. The increase in level during the intervention (PT) phase indicated that
Nate’s performance on the Social Emotional subtest improved while receiving PT and
his performance decreased when the PT intervention was removed. The analyses of
level indicates improvement in Nate’s performance, and upon Kennedy’s (2005)
recommendations, additional calculations of trend were conducted.
R2 = 0.1772
0
10
20
30
40
50
60
70
80
90
1 2 3 4 5 6 7 8 9 10 11 12 13 14
Baseline weeks (1-3), Playtherapy (4-11), Follow-up weeks(12-14)
stan
dard
sco
res
social emotionalscores
r=.42
-----level
Figure 39. Nate DAYC Social Emotional subtest combined phase results.
The trend line was calculated and displayed in Figure 39. The trend line for Nate
84

indicated moderate downward trend through visual analysis. The least squares
regression calculation of r = .42 indicated a moderate relationship between the three
phases and time with an effect size of R2 = .18.
The data across the three phases of Nate’s performance on the Social Emotional
subtest indicated a low amount of variability, which Kennedy (2005) described as the
extent to which the individual data points vary from the trend line. Graphical illustration
indicates that most of Nate’s data fit cleanly to the trend line, but to provide a clearer
picture of the relationship between intervention and time, the trend and level are useful
indicators.
DAYC Social Emotional Subtest Individual Phase Analysis
After analyzing the data for the Social Emotional subtest of the DAYC for Nate
across all phases together, each separate phase will be analyzed for level, trend and
variability. The three data points of the baseline phase indicated a level (mean) of 74.7
(range 68-80), a high upward trend, and low variability, with a trend line of r = .98, with
an effect size of R2 = .96 interpreted as a large effect size (see Figure 40).
R2 = 0.9643
606264666870727476788082
1 2 3
baseline
scor
es
social emotionalr=.98
-----level
Figure 40. Nate’s DAYC Social Emotional subtest baseline phase.
85

The data from the second phase, intervention, revealed a level (mean) of 75.75
(range 70-78), a moderate downward trend, moderate variability, with a trend line of r =
.40, with an effect size of R2 = .16 interpreted as a small effect size. The trend line
indicated a small effect size according to Cohen’s (1988) guidelines, indicating a low
relationship between PT intervention over time and Nate’s performance on the Social
Emotional subtest. Figure 41 illustrates this phase.
R2 = 0.1582
66
68
70
72
74
76
78
80
1 2 3 4 5 6 7 8
Play Therapy Phase
scor
es
social emotionalscores
r=.40
-----level
Figure 41. Nate’s DAYC Social Emotional subtest PT/intervention phase results.
In the final phase, follow-up, Nate continued to be assessed with the Social
Emotional subtest, while no longer receiving PT intervention. The data from this phase
demonstrates a level (mean) of 68.67 (range 66-72), with a high downward trend, and
moderate variability. The trend line of r = .42, with an effect size of R2 = .18, is
interpreted as a medium effect size. Results indicate a significant relationship between
Nate’s performance on the Social Emotional subtest of DAYC with the removal of the
PT intervention.
Nate was administered the Gesell Developmental Observation once (pretest)
prior to the baseline phase, and once (posttest) following the eleventh week of the
study. The pretest yielded a developmental quotient of two and a half years, which is
86

one year below his chronological age of three years and three months. Nate’s posttest
results yielded a developmental quotient of three years, with chronological age being
three years and six months. Results indicate a six month improvement in Nate’s
developmental quotient after receiving eight weeks of the PT intervention phase. Figure
43 graphically illustrates these results.
R2 = 0.4286
6364656667686970717273
1 2 3
Follow Up Phase
scor
es
social emotional
r=.65-----level
Figure 42. Nate’s DAYC Social Emotional subtest follow-up phase results.
2.2
2.3
2.4
2.5
2.6
2.7
2.8
2.9
3
3.1
1 2
pretest posttest
deve
lopm
enta
l age
pre and post
Figure 43. Nate’s Gesell Developmental Observation results.
87

Parent Data
Child Behavior Checklist
Nate’s father completed three CBCL assessments at three separate occurrences
during the three phases: pretest, midpoint, and posttest. Pretest data was collected
during the first week of the baseline phase and results indicate Nate’s father rated
Nate’s Internalizing behavior (T-score = 55) in the average range, his Externalizing
behavior (T-score = 71) in the clinical range, and the Total problems scale (T-score =
63) was rated in the borderline range. During the mid-point data collection, given during
week four of the intervention phase Nate’s father rated his Internalizing behavior (T-
score = 56) in the average range, his Externalizing behavior (T-score = 67) in the
clinical range, and his Total problem scale (T-score = 61) was rated in the borderline
range. Finally, the posttest administration which occurred after the eighth week of the
intervention phase yielded results indicating average (T-score = 53) Internalizing
behavior, Externalizing problems (T-score = 66) in the clinical range, and the Total
problem scale (T-score = 59) was rated in the average range. Improvement was noted
in the posttest Total Problem scale from the previous two administrations. Although, the
externalizing scale remained in the clinical range, the T-scores of each administration of
this scale decreased each time data was collected. Data are graphically represented in
Figure 44.
88

0
10
20
30
40
50
60
70
80
1 2 3
Internalizing Problems Externalizing Problems Total Problems
T-sc
ores pre
midpost
Figure 44. Nate’s CBCL pretest, midpoint, and posttest results.
Parenting Stress Index
Additionally, Nate’s father rated his relationship with Nate using the PSI. Three
administrations of the PSI occurred at the same intervals as the CBCL, including:
pretest (during first week of baseline phase), mid-point (during the fourth week of the
intervention phase), and finally, posttest (occurring after the eight PT session during the
intervention phase. Pretest results indicated Nate’s father rated the Child Domain (T-
score = 137) and Total Stress (T-score = 260) in the Clinical Range, and the Parent
Domain (T-score = 123) was rated in the nonclinical range. During the mid-point
administration Nate’s father rated the Child Domain (T-score = 145) and the Total
Stress Domain (T-score = 261) in the clinical range, and the Parent Domain (T-score =
116) in the nonclinical range. The posttest administration yielded clinical results in the
Child Domain (T-score = 130), and Total Stress (T-score = 256), and nonclinical results
for the Parent Domain (T-score = 126). The posttest administration demonstrated
clinical results in the Child Domain (T-score = 130), and nonclinical results for the
Parent Domain (T-score = 126), and Total Stress (T-score = 256). Improvement was
89

noted in the posttest administration in the Total Stress domain, in which results were
rated in the nonclinical range versus the previous two administration’s ratings in the
clinical range. Figure 45 graphically illustrates these results.
0
50
100
150
200
250
300
1 2 3 4 5
Child Domain Parent Domain Total Stress
T-sc
ores pre
midpost
Figure 45. Nate’s PSI pretest, midpoint, and posttest results.
Discussion
The results from this study, along with both my and the therapist’s clinical
observations provide information regarding the impact of CCPT on the development of
young children. A single case design was used to demonstrate causal relations between
different conditions and their effects on performance over time. A summary of each of
the three participants’ results along with relevant clinical observations will be provided in
this section. Additionally, limitations to this type of design and study will be provided as
well as implications for future research with this population and design.
90

Participant 1 Rachel
Rachel entered the study with a chronological age of four years and three
months, and a pretest developmental quotient from the Gesell Developmental
Observation of three and a half years. After participating in eight weeks of PT
intervention, she was reassessed and her developmental quotient was measured at four
and a half years, which was consistent with her then current chronological age of four
years and six months. Rachel was assessed weekly throughout the entire three phases
of the study of baseline, intervention, and follow-up, with the Developmental
Assessment of Young Children (DAYC) subtests of Cognitive, Communication, and
Social Emotional. Rachel’s mean level for the three phases include: Cognitive baseline,
80.67; Cognitive intervention, 91.25; Cognitive follow-up, 81.33; Communication
baseline, 60.33, Communication intervention, 60.75; Communication follow-up, 57.67;
and Social Emotional baseline, 97.33; Social Emotional intervention, 100.37, and Social
Emotional follow-up, 96.67. Results from these assessments demonstrated
improvement in her performance on all three subtests in terms of her mean level
performance. Across all three subtests, Rachel demonstrated a decrease in
performance once the PT intervention was removed. Rachel’s parent data including the
Child Behavior Checklist (CBCL) and Parenting Stress Index (PSI) demonstrated
nonclinical results across the behavioral scales on the CBCL, and clinical levels of
stress measured in the Parent Domain and Total Stress Domain on the PSI at both
pretest and posttest.
Rachel initially was quite timid when entering my room for the weekly
assessment with the DAYC. She warmed up to me after two weeks and began
91

asserting herself more by making decisions and challenging my directions. Rachel often
used baby talk, but this decreased throughout the intervention phase as she gained
trust in her abilities. She did not need extensive limit setting, but when limits were set,
she quickly became pouty and sullen, which often led to task refusal, and attempts to
leave the room. Toward the end of the intervention phase, Rachel was eager to enter
the room and was more easily focused on the presented tasks. During the follow-up
phase, Rachel appeared sullen that she was not going to the playroom for her session,
and she refused some tasks initially, but with encouragement she completed the tasks.
Rachel’s therapist noted developmental and emotional changes throughout the
intervention phase. Rachel initially was quiet and withdrawn, although focused in her
play. She gradually warmed to the therapist and engaged her in her play. Rachel
sustained focused play, typically involving activities requiring mastery. She was hesitant
to go to the examiner’s room after her play sessions toward the latter part of the
intervention phase, and at times refused to leave the playroom. Rachel responded to
encouragement and facilitative response such as reflection of feelings and over time,
task refusal decreased.
Participant 2: Brian
Brian entered the study with a chronological age of five years and seven months,
and a pretest developmental quotient from the Gesell Developmental Observation of
four years. After completing eight weeks of intervention phase, his posttest
developmental quotient was measured as five years, while his chronological age was
five years and ten months. He was assessed weekly throughout the entire three phases
92

of the study of baseline, intervention, and follow-up, with the DAYC subtests of
Cognitive, Communication, and Social Emotional. His mean level scores for all three
phases are as follows: Cognitive baseline, 72; Cognitive intervention, 80.75; Cognitive
follow-up, 79.33; Communication baseline, 62; Communication intervention, 79.36, and
Communication follow-up, 77.67; and Social Emotional baseline, 60.3, Social Emotional
intervention, 88.9, and Social Emotional follow-up, 88.7. Results indicate overall
improvement in his performance on all three subtests during the PT intervention phase,
with decreases in his performance once the PT intervention was removed. Brian’s
parent data including the CBCL and PSI demonstrated improvement over time in all
three behavioral scales of the CBCL. Brian’s mother rated his behavior as nonclinical
across the three scales during posttest administration which demonstrated notable
decreases from previous administrations. Brian’s mother also rated improvement in all
three domains of the PSI including, Child Domain, Parent Domain, and Total Stress at
time of posttest administration. She rated all three domains in the nonclinical range,
noting a considerable decrease in scores from the previous two administrations.
Brian initially had limited verbal interactions with examiner. I observed Brian as
cautious and withdrawn and often did not want to go with me for the scheduled
assessment. He displayed some task refusal when asked to complete presented tasks.
During the intervention phase, he became more verbal and appeared more animated
and playful during his scheduled assessments. His speech became more coherent and
audible. He became increasingly more assertive throughout the intervention. He was
eager to go with me and often ran to the room for assessments. Brian often hugged me
upon greeting and leaving the building. There were times during the assessments that
93

he often displayed behavior requiring limit setting such as throwing test items at me,
and coloring on the walls. His response to limit setting varied from accepting limits with
no incident; to pouting and stating he wanted to leave with his mother. Upon leaving the
assessment room, he often ran out of the building despite his mother’s attempts to hold
his hand. On one occasion, I observed Brian run out of the building, across the street
with no regard for traffic, and climbed from the hood to the top of his mother’s van, all
before his mother had a chance to catch up with him. He typically did not respond to her
limit setting or redirection. I observed decreases in this behavior along with increases in
his self-control, and his mother’s reports supported this as well.
Brian’s play therapist reported similar observations during his play sessions. He
was often very eager to go to the playroom, but was hesitant to leave and go to the
room for assessment after his session. He frequently tested limits in the form of
aggressive play, and responded after several limits had been given. Brian’s therapist
also noted improvement in his speech articulation and broader vocabulary.
Brian’s mother received three parent consultations during this study. She
reported improvement in Brian’s behavior throughout her consultations. She reported
improvement in his ability to follow directions, and his impulsivity. She acknowledged
that Brian had become more talkative and active in his play with she and his siblings.
Brian’s mother reported Brian was more responsive to limit setting, more affectionate
towards her, and she noticed they were closer in their relationship. Brian’s mother
reported an increase in her stress due to conflict with spouse regarding separation and
divorce issues, but on final consultation she reported decreases in her overall stress.
94

Participant 3: Nate
Nate entered the study with a chronological age of three years and three months,
and a pretest developmental quotient from the Gesell Developmental Observation of
two and a half years. After completing eight weeks of intervention phase, his posttest
developmental quotient was measured as three years, while his chronological age was
three years and six months. He was assessed weekly throughout the entire three
phases of the study of baseline, intervention, and follow-up, with the DAYC subtests of
Cognitive, Communication, and Social Emotional. Results of his mean level scores on
all during all three phases are as follow: Cognitive baseline, 76.66; Cognitive
intervention, 82.5; Cognitive follow-up, 72.66; Communication baseline, 70;
Communication intervention, 73.8, Communication follow-up, 59.33; Social Emotional
baseline, 74.7; Social Emotional intervention, 75.75; and Social Emotional follow-up,
68.67. Results indicate overall improvement in his performance on all three subtests
during the PT intervention phase, with decreases in his performance once the PT
intervention was removed during the follow-up phase. Nate’s parent data including the
CBCL and PSI demonstrated high concern in the behavioral scales of Externalizing and
Total Problems of the CBCL. Nate’s father rated his Externalizing behavior as clinical
across the pretest and midpoint administrations of the CBCL. He rated improvement in
the Total Problems scale during the posttest administration as the scores moved from
the Borderline range to the nonclinical range. Nate’s father rated improvement in the
Total Stress Domain on the PSI during the posttest administration when compared to
the ratings from the previous two administrations.
95

Nate was reluctant to go with me to the evaluation room throughout the entire
study. He often ran and hid and had to be redirected by his father, which was somewhat
appropriate given his young age. On other occasions, Nate grabbed his father’s leg and
would not let go, for several minutes while examiner offered encouragement for him to
come to the assessment room. When Nate finally entered the assessment room, his
behavior was erratic. Some days he was more compliant than others. When presented
with tasks, he did not want to complete, he often spit at me or threw items from the table
across the room and onto the floor. He often licked the toys and other materials along
with the two-way observation mirror in the assessment room. Nate’s speech was often
difficult to understand, but toward the end of the intervention phase his speech was
much more articulate and coherent. He often drooled and soiled his diaper during the
assessment or preceding PT session. Improvement was noted in Nate’s compliance
with directions and ability to change tasks and activities. I observed Nate playing more
cooperatively in the waiting room with his siblings instead of the initial aggressive
behavior noted at the beginning of the study. He appeared to exhibit more control of his
body or self control and less aggressive behavior toward me, siblings, and
toys/materials.
Nate’s therapist reported observations similar to mine: though Nate was typically
very eager to go to the playroom. Nate tested limits with the therapists and often threw
sand and objects at her during his play. She reported a noticeable difference in his
ability to communicate with words and articulate his needs during his play session. Nate
typically appeared happy and excited, even when playing aggressively and testing
limits.
96
Nate’s father reported ongoing stress related to his concerns for parenting Nate,
as well as his other four children. He reported noticing improvement in Nate’s speech
and communication skills. He reported noticing this, especially when Nate was with his
extended family. Nate’s father reported a decrease in separation issues and Nate
showed improvement in his ability for self-control, and following directions, and
accepting limits.
Summary of All Three Participants Findings
Each of the three participants serve as their own control group in this single case
analysis and their results cannot be compared to each other; however, the following
summarization describes the findings of the results along with similarities and
differences among the participant’s results. All three of the participants demonstrated
improvement on the Gesell Developmental Observation after receiving the PT
intervention. Additionally, marked improvement was noted across the three areas
measured by the DAYC by all three participants; however, some results are difficult to
interpret due to large effect sizes and high variability during the baseline phase. The
DAYC results lend support to the results from Gesell Developmental Observation.
These results suggest the need for an extension of the baseline phase to establish a
stable pattern. However, as described previously, it is problematic to withhold treatment
to those in need in the hopes of establishing a stable baseline. It is important to note the
particularly strong relationship between the intervention and the participants’
performance on the DAYC. Once the treatment was removed, the three participants’
performance on the three subtests of the DAYC decreased considerably. These results
97
demonstrate the robust causal relationship between the intervention and effect and
strengthens the internal validity and generalizabilty of the single case analysis
(Sharpley, 2007); however, the inconsistent baseline results may limit this
generalizabiltiy.
The CBCL and PSI results for all three participants demonstrated mixed results,
thus indicating the benefits of this short term treatment on development, but not
necessarily as beneficial for behavioral concerns. Because there was such a decrease
in DAYC subtest scores across all three participants during the follow-up phase, and
only mixed results on the CBCL and PSI , results may indicate the need for longer
treatment with this population to determine specific effects on behavior. This study
seems to support research that reports although PT is effective in the short term,
benefits increase up to 40 sessions (Bratton et al., 2005). Possibly these results
suggest that younger children may benefit from greater than eight CCPT sessions to
reach optimal benefits of the treatment on behavioral outcome measures. The three
participants involved in this study, were recommended to continue with CCPT, and
based on therapist’s evaluation they were not ready to terminate services after eight
weeks of the intervention phase. This could explain the decrease in performance on the
developmental measures during the follow-up phase, in addition to their resentment and
emotional reactions during the evaluation from not being allowed to go to the playroom
during the follow-up phase.
The developmental measures of the Gesell Developmental Observation and
DAYC yielded increases in performance and developmental age quotients, whereas the
behavioral measures of the CBCL and the PSI demonstrated mixed results of
98

improvement, suggesting perhaps it is difficult to compare or measure these two
constructs within one study. Considering that Baker et al. (2005) found that children who
do not move successfully through the stages or who exhibit delays as young as three
years exhibit more behavior problems than their same age peers, it is possible that
developmental changes precede behavioral changes. It could be also suggested that
developmental changes are easier to observe after some of the participants emotional
issues subsided to allow them to be more fully functioning or functioning closer to their
chronological age.
Overall, results indicated improvement across all participants’ performance on
the DAYC while receiving PT sessions (intervention phase). Although, from a single
case design perspective, CCPT appeared to be an effective intervention due to the
decrease in performance standard scores during the follow-up phase; from a
therapeutic perspective, these results suggest the need for continued CCPT Results
from the developmental and behavioral measures are consistent with the objectives of
CCPT in that the intervention was helpful to the children in the following ways:
Developing more positive self-concept, assuming greater responsibility, becoming more
self-directing and self reliant, engaging in self-determined decision making, feeling a
sense of control, coping, developing an internal source of evaluation, and trusting
themselves (Landreth, 2002).
Implications for Future Research
The purpose of using a single case design for this study was to provide a more in
depth look at the population and their progress when assessed with several
99

instruments, to develop a practical understanding in order to make recommendations for
counseling intervention. It is important that the study be replicated in order to increase
reliability and validity of the results. It became apparent through this study that eight
weeks of once weekly PT intervention was not enough time to make a large impact on
behavioral progress. The participants were angry and disappointed when they came to
the clinic during the follow-up phase to be assessed and were not allowed to go into the
playrooms. Future replication of this study may benefit from assessing children on
different days or different locations from where they receive CCPT. It is possible that
some of the emotional reactions that interfered with the developmental assessment
were caused by their longing to go to the playroom, and their anger towards examiner
for keeping them in the assessment room. This would be particularly apparent with
children exhibiting willful behavior. It may be beneficial to increase the treatment phase
to two times weekly when using an eight week format, or extend treatment phase to
sixteen weeks to measure developmental and behavioral changes in young children.
However, results seem to support the use of a CCPT intervention as a promising
intervention for young children with developmental delays, even though the participants
were not ready to terminate CCPT services.
Other factors to consider include the appropriateness of using single case
design. The design was beneficial in focusing on single participants’ progress over time.
This process allowed for the collection of multiple assessments lending a thorough and
comprehensive approach of analysizing participant’s progress in terms of practical use
for counseling interventions. Replication is recommended to promote reliability and
validity measures. However, the literature is limited on the consistent use of this type of
100
design. Specifically, this research was impacted by the need for an extended baseline
which is an ethical consideration for PT researchers who might continue to delay
needed treatment for a child for the benefit of research design. In addition, the
qualitative nature of single case design may increase the difficulty for other researchers
to use the visual analysis over other design’s reliance on quantitative analysis, often
perceived as more reliable.
Researchers are encouraged to report their findings from single case designs in
professional counseling journals to increase replication as well as increasing the
potential for validation and generalizabilty for interventions (Sharpley, 2007).
Counselors are also urged of the importance of using and reporting their results from
single case designs in order to “increase the scientist-practitioner reputation of
counseling and the relative status of it as a therapeutic endeavor within the overall
evidence-based mental health field (Sharpley, 2007 p. 351).
Limitations
Participants in this study were chosen from a convenience sample of children
listed on the waiting list of a mental health clinic. In addition, because single case
design is a mixed method design that involves qualitative and quantitative procedures,
generalizability may be affected. Another limitation is that treatment took place over a
short period of time and the potential effects of PT may not have been realized,
although the literature review includes studies of effective treatment with eight PT
sessions or less. However, research also suggests there may be benefits to longer term
PT treatment intervention (Bratton et al., 2005).
101

Additional limitations are in instrumentation. The Gesell Developmental
Observation is not sensitive to small, incremental changes in development, but rather
provides six-month categories of developmental ages. Limitations may exist in
disregarding smaller changes in the participant’s development as part of an exploratory
analysis of change. In this study, this was not evident, as all three participants exhibited
at least a six month developmental gain after treatment. It is possible that
developmental changes may have occurred naturally over time, but results from the
follow-up phases across all three participants suggest otherwise.
Conclusion
This study used a single case design to explore the relationship between
individual child centered play therapy on children with developmental delays by
examining its effectiveness in: 1) increasing measured developmental age; 2) reducing
problematic behaviors related to developmental delays; and 3) increasing
developmentally appropriate behaviors.
Young children are experiencing more stressful and often challenging
environments that hinder the development of necessary competencies for early
academic and social success (Coolahan, Iantuzzo, Mendez, & McDermott, 2000).
Children with developmental delays, specifically intellectual disabilities, appear to be at
an increased risk for developing emotional and behavioral problems (Ilg, Ames, &
Baker, 1981). Increasing awareness in these areas often involves the assessment and
observation of children.
102
A single case design was used to allow for a more in depth and qualitative
experience of assessing and gathering relevant data to make better treatment decisions
for children. Single case designs demonstrate causal relations between different
conditions and their effects on performance over time. Data was analyzed by visual
methods to compare data from the participant’s baseline and intervention phases
(Sharpley, 2007). Visual inspection is used when there is continuous data for one or
more participants available for observation (Kazdin, 2003).
Children have unique and varied developmental needs. Play therapy is used as a
developmentally appropriate form of therapy to treat children’s emotional and behavioral
difficulties (Landreth, 2002). Several research studies have demonstrated the
effectiveness of PT with children experiencing various emotional, academic, and
behavioral issues (Ray et al., 2001).
Humanistic-nondirective PT approaches yielded significantly larger treatment
effects than other approaches (Bratton, Ray, Rhine, & Jones, 2005). Participants were
three children between the ages of three and five that were assessed as performing at
least six months below chronological age on the Gesell Developmental Observation.
Participants were assessed weekly with both developmental and behavioral measures
during the three phases of the study: baseline, intervention, and follow-up. Additionally,
parents of the participants completed behavioral measures at pretest, midpoint, and
posttest administrations.
The participant’s weekly standard scores were graphed and results were
examined separately using visual analyses. Changes between phases: non-intervention
103

baseline, intervention, and non-intervention follow-up were examined; specifically, the
level, trend, and variability of the data across the phases were examined.
Each of the three participants served as their own control group in this single
case analysis and their results, and all three of the participants demonstrated
improvement on the developmental measures after receiving the PT intervention. It is
important to note the particularly strong relationship between the intervention and the
participants’ performance on these developmental measures. Once the treatment was
removed, the three participants’ performance on the developmental measures
decreased considerably. Results from the behavioral and parent data results for all
three participants demonstrated mixed results.
Results from this single case analysis suggest the need for further replication,
use and reporting of single case interventions and designs, to promote the efficacy of
counseling interventions and to potentially enhance the literature and research base for
evidence based interventions.
104

APPENDIX A
PLAY THERAPY SKILLS CHECKLIST
105
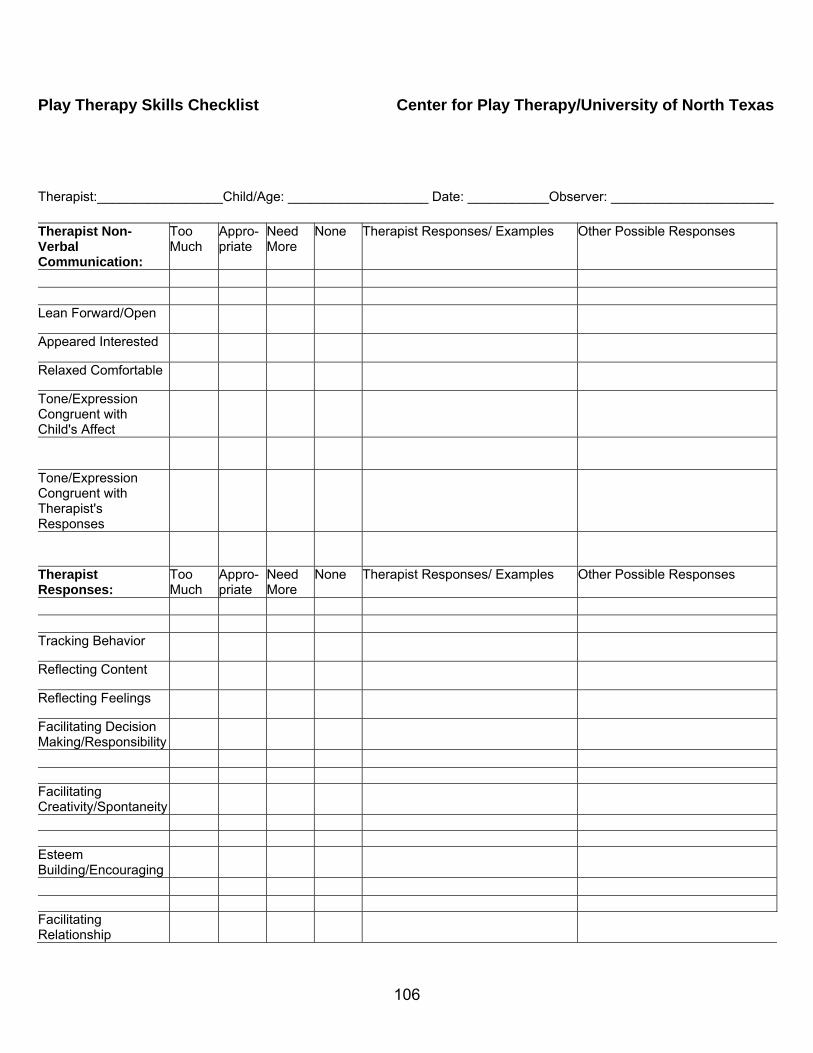
Play Therapy Skills Checklist Center for Play Therapy/University of North Texas Therapist:_________________Child/Age: ___________________ Date: ___________Observer: ______________________ Therapist Non-Verbal Communication:
Too Much
Appro-priate
Need More
None Therapist Responses/ Examples Other Possible Responses
Lean Forward/Open
Appeared Interested
Relaxed Comfortable
Tone/Expression Congruent with Child's Affect
Tone/Expression Congruent with Therapist's Responses
Therapist Responses:
Too Much
Appro-priate
Need More
None Therapist Responses/ Examples Other Possible Responses
Tracking Behavior
Reflecting Content
Reflecting Feelings
Facilitating Decision Making/Responsibility
Facilitating Creativity/Spontaneity
Esteem Building/Encouraging
Facilitating Relationship
106

Enlarging the Meaning/Facilitating Understanding
Succinct/Interactive
Rate of Responses
Limit Setting: Child Made Contact/Connectedness:
Identified Themes: Therapist's Strengths: Areas for Growth:
107

APPENDIX B
PARENT CONSULTATION PROTOCOL
108

Parent Consultation Protocol
1. Meet with parent at assigned time during the study. 2. Discuss current parental concerns regarding development and behavior.
3. Discuss concerns and progress noted in Play therapy session.
4. Make plans for future consultation.
5. Avoid giving recommendations or advice for parental concerns until after the study is
complete and directed to do so by principal researcher. .
109

REFERENCES
Abidin, R. (1995). Parenting Stress Index, 3rd edition: Professional manual. Odessa, Fl : Psychological Assessment Resources.
Axline, V. (1947). Play therapy. New York: Ballantine Books
Achenbach & Rescorla, (2000). Manual for the ASEBA preschool forms and profiles. Burlington, VT: University of Vermont Department of Psychiatry.
Bagnato, S., Neisworth, J.T., & Munson, S. (1997). LINKing assessment and early intervention. Baltimore: Brookes.
Baker, B., Blacher, J., Olsson, M (2005). Preschool children with and without developmental delay: Behavior problems parents’ optimism and well-being. Journal of Intellectual Disability Research, 49(8), 575-590.
Barlow, D., & Hersen, M. (1984). Single-case experimental designs. In Strategies for studying behavior change. Elmsford, NY: Pergamon.
Baumrind, D.(1991). Effective parenting during the early adolescent transition. In P.A. Cowan & E.M. Hetherington (Eds.), Family transition (p.111-164). Hillsdale, NJ: Eribaum.
Berger, K.S. (2002). The developing person through childhood (3rd ed). New York: Worth Publishers
Bills, R. (1950) Nondirective play therapy with retarded readers. Journal of Consulting Psychology, 14, 140-149.
Bratton, S., Ray, D., Rhine, T., & Jones, L. (2005). The efficacy of play therapy with children: A meta-analytic review of treatment outcomes. Professional Psychology: Research and Practice, 36(4), 376-390.
Bricker, D., & Squires, J. (1989). The effectiveness of parental screening of at-risk infants: The Infant Monitoring Questionnaire. Topics in Early Childhood Special Education, 9(3), 67-85.
Casby, M. (2003). Developmental assessment of play: A model for early intervention. Communication Disorders Quarterly, 24(4), 175-183.
Coolahan, K., Iantuzzo, J., Mendez, J., & McDermot, P. (2000). Preschool peer interaction and readiness to learn: Relationships between classroom peer play and learning behaviors and conduct. Journal of Educational Psychology, 92(3), 458-465.
Crow, J. (1994). Play therapy with low achievers in reading. Information Analysis,70, 1-21.
110

Cuddy-Casey, M. (1997). A case study using child centered play therapy approach to treat enuresis and encopresis. Elementary School Guidance and Counseling, 31(3), 220-225.
Elkind, D. (1981). The hurried child. Growing up too fast, too soon. Boston, MA: Addison-Wesley
Fall, M., Balvanz, J., Johnson, L., Nelson, L. (1999). A play therapy intervention and its relationship to self efficacy and learning behaviors. Professional School Counseling,2(3), 194-204.
Garza, Y. & Bratton, S. (2005). School-based child centered play therapy with Hispanic children: Outcomes and cultural considerations. International Journal of Play Therapy, 14(1), 51-80.
Guralnick, M., Hammond, M., Connor, R., & Neville, B. (2006). Stability, change, and correlates of the peer relationships of young children with mild developmental delays. Child Development, 77(2), 312-324.
Hannah, G. (1986). An investigation of play therapy: Process and outcome using interrupted time-series analysis. University of Northern Colorado, dissertation, 1-147.
Holmes, J. (2004). The relation of children’s everyday nonsocial peer play behavior to their emotionality, regulation, and social functioning. Developmental Psychology, 40(1), 67-80.
Ilg, F. (1965). Gesell Developmental Observation. New Haven: CT. Gesell Institute of Human Development, Inc.
Ilg, F., Ames, L., & Baker, S. (1981). Child behavior: The classic child care manual from the Gesell Institute of Human Development. New York: Harper Collins Publishers, Inc.
Ilg, F. & Ames, L. (1971). School readiness. New York: Harper and Row
Jones, E. & Landreth, G. (2002). The efficacy of intensive individual play therapy for chronically ill children. International Journal of Play Therapy, 11, 117-140.
Karpov, Y. & Haywood, H.C. (1998). Two ways to elaborate Vygotsky’s concept of mediation: Implications for instruction. American Psychologist, 53, 27-36.
Kazdin, A. (2003). Methodological issues and strategies in clinical research (3rd ed). Washington D.C.: American Psychological Association.
Kaufman, A., Kaufman, N. (1972). Tests built from Piaget’s and Gesell’s tasks as predictors of first-grade achievement. Child Development, 43, 521-535.
111

Kellaghan, T., Sloane, K., Alvarez, B., & Bloom, B. (1993). The home environment and school learning. San Francisco: Jossey-Bass.
Kozlen, P. (1990). Patterning language usage and themes of problem formation/resolution. Canadian Journal of Counseling, 26(4), 230-239.
Krakow, J. & Kopp, C. (1983). The effect of developmental delay on sustained attention in young children. Child Development, 54, 1143-1155.
Landreth, G. (1993). Child centered play therapy. Elementary School Guidance and Counseling, 29(1), 17-29.
Landreth, G. (2002) Play therapy: The art of the relationship (2nd ed.). New York: Brunner-Routledge.
Litty, C. & Hatch, J. (2006). Hurry up and wait: Rethinking special education identification in kindergarten. Early Childhood Education Journal, 33(4), 203-208.
Lundervold, D. & Belwood, M. (2000). The best kept secret in counseling: Single-case (n=1) experimental designs. Journal of Counseling & Development, 78, 92-102.
Morrison, F., Griffith, E., Alberts, D. (1997). Nature-nurture in the classroom: Entrance age, school readiness, and learning in children. Developmental Psychology, 33(2), 254-262.
Ottenbacher, K. (1986). Evaluating clinical change: Strategies for occupational and physical therapists. Baltimore: Williams & Wilkins.
Packman, J. & Bratton, S. (2003). A school-based group play/activity therapy intervention with learning-disabled preadolescents exhibiting behavior problems. International Journal of Play Therapy, 12(2), 7-29.
Parker, F., Boak, A., Griffin, R., Ripple, C., & Peay, L. (1999). Parent-child relationship, home learning environment, and school readiness. School Psychology Review, 28, 413-425.
Post, P. (1999). Impact of child centered play therapy on the self-esteem, locus of control, and anxiety of at-risk 4th, 5th and 6th grade students. International Journal of Play Therapy, 8, 1-18.
Ray, D. (2004). Supervision of basic and advanced skills in play therapy. Journal of Professional Counseling: Practice, Theory, & Research, 32(2), 28-41.
Ray, D., Bratton, S., Rhine, T., & Jones, L. (2001). The effectiveness of play therapy: Responding to the critics. International Journal of Play Therapy, 10, 85-108.
Santrock, J. (1999). Lifespan development (7th ed.). Boston: McGraw-Hill College.
112

Saluja, G., Scott-Littie, C., & Clifford, R. (2000). Readiness for school: A survey of state policies and definitions. Early Childhood Research and Practice, 2, 1-16.
Sharpley, C. (2007). So why aren’t counselors reporting n=1 research designs? Journal of Counseling and Development, 85, 349-355.
Sharpley, C. (1981). Time-series analysis of counseling research. Measurement and Evaluation in Guidance, 14(3), 149-157.
Shen, Y. (2002). Short-term group play therapy with Chinese earthquake victims: Effects on anxiety, depression, and adjustment. International Journal of Play Therapy, 11, 43-63.
Spinrad, T., Eisenberg, N., Harris, E., Hanish, L., Fabes, R., Kysanoff, K., Ringwald, S., & Taylor, L., Clayton, J., & Rowley, S. (2004). Academic socialization: Understanding parental influence on children’s school-related development in the early yeas. Review of General Psychology, 8(37), 163-178.
Thelen, E. (1992). Arnold L. Gesell: The paradox of nature and nurture. Developmental Psychology, 28(3), 368-380.
United States Department of Education. (2003). Annual report to Congress on the implementation of Individuals with Disabilities Act. Washington, DC: Office of Special Education and Rehabilitative Services and the National Center for Educational Statistics.
Voress, J.K., & Maddox, T. (1988). Developmental Assessment of Young Children: examiner’s manual. Austin, TX: PRO-ED.
Wertsch, J., & Tulviste, P. (1992). L.S. Vygotsky and contemporary developmental psychology. Developmental Psychology, 28, 548-557.
Wood, C. (1997). Yardsticks: Children in the classroom ages 4-14: A resource for parents and teachers. Turner Falls, MA: Northeast Foundation, Inc.
Wood, C., Powell, S., & Knight, R. (1984). Predicting school readiness: The validity of developmental age. Journal of Learning Disabilities, 17(1), 8-11.
Wortham, S. (1999). Assessing and reporting young children’s progress: A review of the issues. In J.P. Isenberg & Jalongo (Eds.), Major trends and issues in early childhood education (pp. 104-122). New York: Teachers College Press.
113