Embed Size (px)
Citation preview

This content was archived on July 30, 2013.
Archived Content
Information identified as archived on the Web is for reference, research or recordkeeping
purposes. It has not been altered or updated after the date of archiving. Web pages that are
archived on the Web are not subject to the Government of Canada Web Standards. As per
the Communications Policy of the
Government of Canada, you can request alternate formats on the "Contact Us" page.

Health Canada
SantéCanada
Investigating the relationship between drinking water and gastroenteritis in Edmonton:
1993-1998
November 29th, 2002
Prepared by: Division of Enteric, Foodborne and Waterborne Diseases
Health Canada
Investigating the relationship between drinking water and gastroenteritis: Edmonton, 1993-1998 November 29th, 2002
Page 1 of 61
Authors and Acknowledgements ............................................................................. 3 Executive Summary...................................................................................................... 4 List of Figures and Tables .......................................................................................... 7 SECTION 1: INTRODUCTION
1.1 Background ..................................................................................................... 8 1.2 Edmonton’s Water Supply.............................................................................. 8
1.2 a) Water treatment plants ................................................................... 9 1.2 b) Watershed characteristics.............................................................. 10 1.2 c) Water purification procedures ........................................................ 11
1.3 Study Objectives ............................................................................................. 12 SECTION 2: DATA SOURCES
2.1 Water Quality Parameters ............................................................................... 13 2.2 Environmental Parameters ............................................................................. 14 2.3 Socio-Economic Data ..................................................................................... 14 2.4 Health Outcome Data ..................................................................................... 14
2.4 a) Canadian Institute for Health Information ...................................... 14 2.4 b) Alberta Health Care Insurance Payment Plan............................... 17
2.5 Assigning a Primary Water Source ................................................................ 17 SECTION 3: INVESTIGATIVE METHODS
3.1 Descriptive Analyses ...................................................................................... 19 3.2 Multivariate Logistic Regression..................................................................... 19
3.2 a) Methodology overview .................................................................... 19 3.2 b) Variables analysed ......................................................................... 21 3.2 c) Criteria for model-selection............................................................. 23
3.3 Time Series Analysis ............................................................................................ 23 3.3 a) Methodology overview .................................................................... 23 3.3 b) Variables analysed ......................................................................... 25 3.3 c) Criteria for model-selection............................................................. 27
SECTION 4: RESULTS
4.1 Descriptive Results ......................................................................................... 28 4.1 a) Water quality parameters ............................................................... 28 4.1 b) Environmental parameters ............................................................. 34 4.1 c) Socio-economic data...................................................................... 36 4.1 d) Health outcome data ...................................................................... 36
4.2 Statistical Analyses ......................................................................................... 41 4.2 a) Multivariate logistic regression....................................................... 41 4.2 b) Time series analysis....................................................................... 47

Investigating the relationship between drinking water and gastroenteritis: Edmonton, 1993-1998 November 29th, 2002
Page 2 of 61
SECTION 5: DISCUSSION AND CONCLUSIONS
5.1 Introduction ..................................................................................................... 53 5.2 Methodological Overview................................................................................ 54
5.2 a) Multivariate logistic regression....................................................... 54 5.2 b) Time series analysis....................................................................... 55 5.3 Discussion of Results ..................................................................................... 56 5.3 a) Descriptive analyses....................................................................... 56 5.3 b) Multivariate logistic regression....................................................... 57 5.3 c) Time series analysis....................................................................... 58 5.4 Conclusions..................................................................................................... 59 REFERENCES ................................................................................................................ 60

Investigating the relationship between drinking water and gastroenteritis: Edmonton, 1993-1998 November 29th, 2002
Page 3 of 61
Authors:
1, 2Gillian Lim, B.Sc., M.Sc. 1Jeff Aramini, M.Sc., D.V.M., Ph.D 1Manon Fleury, B.Sc. 1Rita Ibarra, B.Sc. 1Rob Meyers, B.Sc.
1Division of Enteric, Foodborne and Waterborne Diseases, Centre for Infectious Disease Prevention and Control, Population and Public Health Branch, Health Canada
2Corresponding Author: Gillian Lim
Division of Enteric, Foodborne and Waterborne Diseases CIDPC, PPHB, Health Canada
1 Stone Road West, 4 th Floor, Guelph, Ontario, Canada, N1G 4Y2 Tel: (519) 826-2262
Media Inquiries: Paige Raymond Kovach Health Canada Media Relations (613) 957-1803
Acknowledgements: The authors of this report would first like to acknowledge the contributions of Dr. Les Gammie and Simon Thomas of EPCOR Water Services Inc. Their determination to provide us with a comprehensive database consisting of numerous water quality parameters made it possible to conduct an in-depth and detailed analysis. Furthermore, their expertise and advice on water quality and source water issues were invaluable. The authors also thank the Ministry of Health and Wellness, Alberta, for permitting us to access their healthcare administrative databases.
The authors also wish to recognise the contributions of Dr. Brian Allen, Dr. John Holt, and Mr. William Sears at the University of Guelph, for developing the time series methodology that was described in this report.
We would also like to acknowledge Dr. Paul Sockett (Population and Public Health Branch, Health Canada), and Mr. Will Robertson (Healthy Environments and Consumer Safety Branch, Health Canada) for providing input.
Finally, the authors would like to thank the members of the Enteric National Disease Surveillance (ENDS) Committeea for recognizing the need for this type of research, and for continuing to support waterborne disease-related research in Canada.
a ENDS is a multi-disciplinary working-group with a mandate to develop, prioritize, and promote enteric disease related surveillance activities. Included on the ENDS Committee are representatives from several Provincial Ministries of Health, Health Canada, Medical Officers of Health and Public Health Inspectors, representatives from Federal and Provincial Ministries’ of Agriculture and Environment, and individuals representing both the food and water industries in Canada.
Investigating the relationship between drinking water and gastroenteritis: Edmonton, 1993-1998 November 29th, 2002
Page 4 of 61
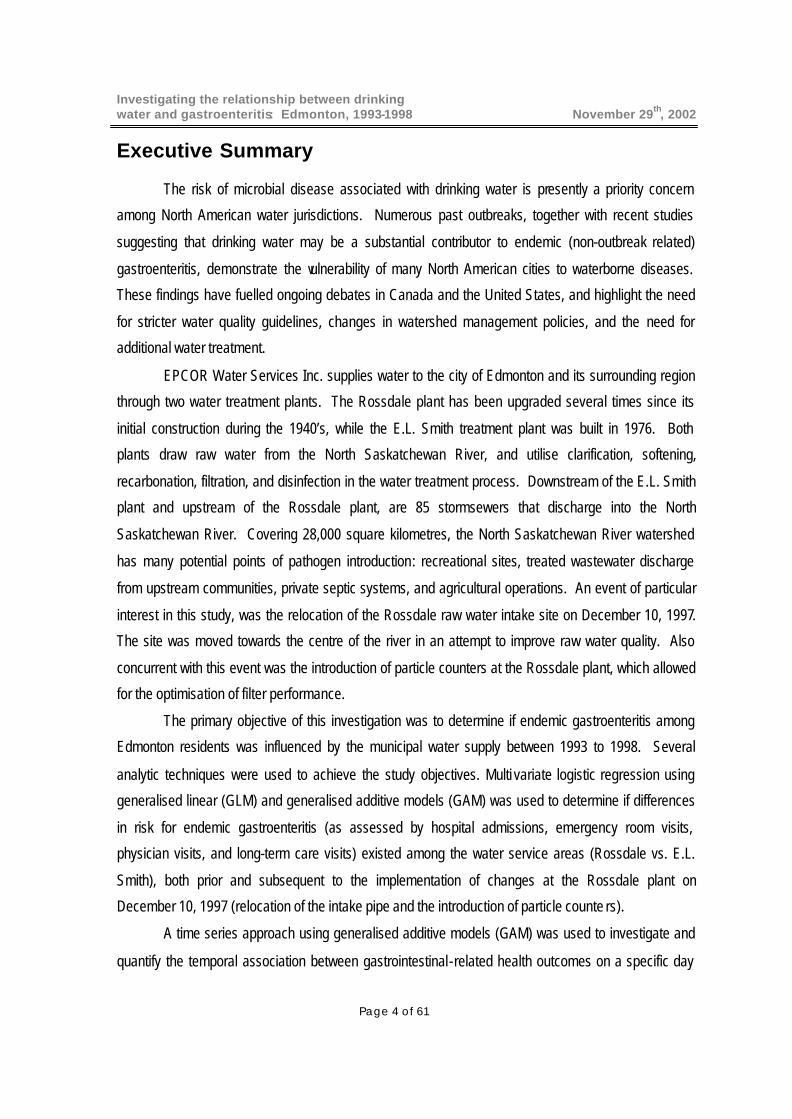
Executive Summary
The risk of microbial disease associated with drinking water is presently a priority concern
among North American water jurisdictions. Numerous past outbreaks, together with recent studies
suggesting that drinking water may be a substantial contributor to endemic (non-outbreak related)
gastroenteritis, demonstrate the vulnerability of many North American cities to waterborne diseases.
These findings have fuelled ongoing debates in Canada and the United States, and highlight the need
for stricter water quality guidelines, changes in watershed management policies, and the need for
additional water treatment.
EPCOR Water Services Inc. supplies water to the city of Edmonton and its surrounding region
through two water treatment plants. The Rossdale plant has been upgraded several times since its
initial construction during the 1940’s, while the E.L. Smith treatment plant was built in 1976. Both
plants draw raw water from the North Saskatchewan River, and utilise clarification, softening,
recarbonation, filtration, and disinfection in the water treatment process. Downstream of the E.L. Smith
plant and upstream of the Rossdale plant, are 85 stormsewers that discharge into the North
Saskatchewan River. Covering 28,000 square kilometres, the North Saskatchewan River watershed
has many potential points of pathogen introduction: recreational sites, treated wastewater discharge
from upstream communities, private septic systems, and agricultural operations. An event of particular
interest in this study, was the relocation of the Rossdale raw water intake site on December 10, 1997.
The site was moved towards the centre of the river in an attempt to improve raw water quality. Also
concurrent with this event was the introduction of particle counters at the Rossdale plant, which allowed
for the optimisation of filter performance.
The primary objective of this investigation was to determine if endemic gastroenteritis among
Edmonton residents was influenced by the municipal water supply between 1993 to 1998. Several
analytic techniques were used to achieve the study objectives. Multi variate logistic regression using
generalised linear (GLM) and generalised additive models (GAM) was used to determine if differences
in risk for endemic gastroenteritis (as assessed by hospital admissions, emergency room visits,
physician visits, and long-term care visits) existed among the water service areas (Rossdale vs. E.L.
Smith), both prior and subsequent to the implementation of changes at the Rossdale plant on
December 10, 1997 (relocation of the intake pipe and the introduction of particle counte rs).
A time series approach using generalised additive models (GAM) was used to investigate and
quantify the temporal association between gastrointestinal-related health outcomes on a specific day

Investigating the relationship between drinking water and gastroenteritis: Edmonton, 1993-1998 November 29th, 2002
Page 5 of 61
(as assessed by hospital admissions, emergency room visits, physician visits, and long-term care
visits) and environmental and water quality parameters (primarily finished water turbidity). Observed
values for these parameters from 0 to 40 days prior to a health outcome event were assessed for their
impact on the measured health outcomes. In addition to daily readings of finished water turbidity, the
utility of particle counts data were assessed, together with raw water indicators including turbidity and
coliform counts. Environmental parameters, including daily precipitation and maximum and minimum
temperatures, were also investigated.
As anticipated, descriptive analyses and summary statistics of the raw water parameters
indicated better quality of water entering the E.L. Smith plant in comparison to the Rossdale plant, both
before and after December 10, 1997. These differences are most pronounced in daily total and faecal
coliforms. Following December 10, 1997, the differences in raw water parameters between the plants
are less prominent. Of primary interest for the time series analysis was the daily finished water
turbidity. Prior to December 10, 1997, finished water turbidity values (mean and median) were slightly
lower for the E.L. Smith plant. Following December 10, 1997, finished water turbidity values were
equivalent between the two plants. Mean and median particle counts from the E.L. Smith plant were
marginally lower compared to those of the Rossdale plant. However, particle count data were only
available for 1998. Throughout the period of investigation (1993-1998), finished water turbidity levels
for both plants were well within federal (Health Canada, 1996) and provincial (Alberta Environment
Protection, 1997) drinking water turbidity guidelines.
Results of the multivariate logistic model which fit a categorical variable for water source
(GLM), suggest a slight decrease in the risk of gastroenteritis among residents supplied with Rossdale
water following the changes that were implemented on December 10, 1997. The interpretation of the
logistic regression results should, however, be made with caution as the magnitude of the effects were
relatively small (odds ratios near one). Although it is plausible that this effect was due to the
improvements at the Rossdale plant, other combinations of events could have resulted in a similar
relationship. An obvious spatial pattern in gastroenteritis risk with respect to water plant service area
was not identified using spatial regression models (GAM). This latter observation further underlies the
tenuous nature of this causal hypothesis.
Given the descriptive findings, and the results of the multivariate logistic modelling, time series
analysis was restricted to households supplied by the Rossdale water treatment plant prior to
December 10, 1997. It was anticipated that if a temporal relationship between daily water quality and

Investigating the relationship between drinking water and gastroenteritis: Edmonton, 1993-1998 November 29th, 2002
Page 6 of 61
gastroenteritis existed, it would be most likely identified in this subset. Nevertheless, no significant lags
were identified between daily finished water turbidity and gastroenteritis among Rossdale serviced
residents (prior to December 10, 1997) using time series analysis. Lagged water quality parameters
from 0 to 40 days prior to health outcome events were assessed for statistical significance and
biological relevance using a time series approach. Finished water turbidity provided the best fit to the
data. None of the raw water nor environmental parameters were adequate predictors of health in the
final model. Similar to the spatial analysis, seasonal and temporal effects were adjusted for use in the
final model. Despite limiting the analysis to the water supply posing the greatest potential risk, the time
series analysis failed to identify temporal relationships between the finished water turbidity from the
Rossdale plant prior to December 10, 1997 and endemic gastroenteritis.
In comparison to the results of the Vancouver time series study1, evidence in the present study
suggests very little impact, if any, of drinking water on the level of endemic gastroenteritis among
Edmonton residents. Despite markedly poorer raw water quality in Edmonton compared to Vancouver
during the respective study periods, no significant temporal relationships were identified between water
quality parameters and the risk of gastroenteritis. The lack of a temporal relationship supports the
opinion that the high quality of Edmonton’s drinking water adequately minimises the risk of waterborne
endemic gastroenteritis. Furthermore, the lack of a significant relationship between raw water turbidity
and faecal coliform counts and endemic gastroenteritis supports the effectiveness of the treatment
processes utilised.
Under the multivariate logistic regression model, the suggestion of an overall decrease in risk
of endemic gastroenteritis among Rossdale serviced residents following improvements implemented at
the plant on December 10, 1997 is consistent with the observed improvements in raw and finished
water quality parameters. The lack of an obvious spatial relationship between endemic gastroenteritis
and water service area (using spatial regression) together with the lack of a significant temporal
relationship between endemic gastroenteritis and finished water turbidity (using time series analysis),
suggest that this apparent decrease in risk is minor, and the relationship tenuous. Nevertheless, the
lack of an obvious decrease in the risk of endemic gastroenteritis following the improvements at the
Rossdale plant despite marked improvements in raw water quality, together with the lack of an obvious
spatial relationship among the service areas, further supports the effectiveness of the operation and
treatment processes utilised in Edmonton.
1 Aramini, J., et al. 2000. Drinking water quality and health care utilisation for gastrointestinal illness in Greater Vancouver. Health Canada.

Investigating the relationship between drinking water and gastroenteritis: Edmonton, 1993-1998 November 29th, 2002
Page 7 of 61
LIST OF FIGURES Figure 1: Regional water supply in Edmonton ............................................................................................ 9
Figure 2: Water service areas for the Rossdale and E.L. Smith plants, Edmonton ........................ 10
Figure 3: Finished water quality descriptive results .................................................................................. 30 – 31
Figure 4: Raw water quality descriptive results.......................................................................................... 32 – 33
Figure 5: Maximum and minimum daily temperatures ............................................................................. 34
Figure 6: Daily precipitation .............................................................................................................................. 34
Figure 7: Comparing daily maximum temperature and daily mean raw water turbidity................. 35
Figure 8: Comparing daily precipitation and daily mean raw water turbidity..................................... 35
Figure 9: Distribution of average annual household incomes per postal code in Edmonton, 1995 ............................................................................................................................ 36
Figure 10: Data profiles...................................................................................................................................... 37 – 40
Figure 11: Spatial distribution of postal codes within Edmonton and corresponding water service areas........................................................................................................................ 42
Figure 12: Spatial distribution of disease risk within the city of Edmonton between 1993-1998 ......................................................................................................................................... 43 – 46
Figure 13: 3-D time series surface plots of disease risk within the Rossdale water service area between Feb. 10 ’93 to Dec. 31 ’98 ................................................................. 49 - 52
LIST OF TABLES Table 1: Indicators of water quality received from EPCOR Water Services, Inc. ............................ 13
Table 2: Criteria for selecting hospital admission gastroenteritis cases in the CIHI data source .................................................................................................................................. 15
Table 3: Criteria for selecting hospital admission respiratory controls in the CIHI data source .................................................................................................................................. 16
Table 4: Components of the analytic approaches utilised in the multivariate logistic regression analyses.............................................................................................................. 20
Table 5: Independent variables analysed in the multivariate logistic regression analyses .................................................................................................................................................. 22
Table 6: Components of the analytic approaches utilised in the time series analysis ................... 25
Table 7: Independent variables analysed in the time series analysis.................................................. 26
Table 8: Summary statistics for indicators of raw and finished water quality.................................... 29
Table 9: Summary statistics for environmental parameters.................................................................... 34
Table 10: Multivariate logistic regression results: Comparisons among water service areas....................................................................................................................................... 41

Investigating the relationship between drinking water and gastroenteritis: Edmonton, 1993-1998 November 29th, 2002
Page 8 of 61
SECTION 1: INTRODUCTION 1.1 Background
Contaminated municipal water supplies have been linked to numerous gastrointestinal
outbreaks. Recent events in North America have highlighted the far-reaching impact of waterborne
outbreaks on the community (Stirling et al, 2001; Grey Bruce Health Unit, 2000; MacKenzie et al,
1994). While outbreak investigations strive to estimate the health impact within a defined time interval,
less is known about the effect of water quality on the endemic rate of illness within a community.
Advances in analytical methodologies have enabled researchers to derive quantitative estimates of
these impacts. By applying these techniques, several recent studies have identified links between
water quality and endemic gastroenteritis (Aramini et al, 2000; Schwartz et al, 2000; Morris et al, 1998;
Schwartz et al, 1997).
The current investigation is part of a series of national multi -centric studies being led by Health
Canada to investigate risk factors and the burden of illness associated with drinking water. Since this
investigation is an extension of the original study that was conducted in Vancouver (Aramini et al,
2000)2, a detailed account of the historic background and rationale for this study is not repeated in this
report. A comprehensive review of common waterborne pathogens and their associated risk to public
health is also provided in the Vancouver report.
The Vancouver study identified strong relationships between drinking water quality (measured
by the level of turbidity in the water received at home) and gastroenteritis. At the time of the
investigation (1993-1998), filtration procedures were not part of the water purification process in
Vancouver. The primary objective of this study was to apply similar methodologies to determine if
Edmonton’s municipal water supply influenced endemic gastroenteritis in Edmonton, between 1993 to
1998.
1.2 Edmonton’s Water Supply
EPCOR Water Services Inc., which is a subsidiary of EPCOR Utilities Inc., supplies water to
the city of Edmonton and its surrounding region. An extensive pipe distribution system spanning
approximately 3100 kilometres enables access to more than 40 communities. Twelve reservoirs
2 All subsequent references to Vancouver refer to this report

Investigating the relationship between drinking water and gastroenteritis: Edmonton, 1993-1998 November 29th, 2002
Page 9 of 61
interspersed throughout the city have a total holding capacity of 808 million litres, which is equivalent to
a three-day reserve supply. The majority of consumers within the city of Edmonton receive water
within two days of leaving the water treatment facilities (per. comm., EPCOR). This distribution system
is depicted in Figure 1.
Figure 1: Regional water supply in Edmonton
During the year 2000, EPCOR distributed water to 658,000 Edmonton residents, and 187,000
persons in surrounding communities . With a diverse portfolio, only half of the water consumption
comes from residential and multi-family dwellings. Other consumer types include commercial,
industrial, wholesale and regional users.
1.2 a) Water treatment plants
Edmonton and many of the surrounding communities in the region are serviced by two water
treatment plants located within the city: the Rossdale plant and the E.L. Smith plant. Using
Geographic Information Systems application software, (Arc View 3.2, Environment Systems Research
Legal
Morinville
AlexanderFirst Nation
RiviereQui Barre
Thorhild Water Services Commission
Redwater
Gibbons Bruderheim
Lamont
Chipman
Mundare
Vegreville
Namao
JosephburgWater Co-Op
Ardrossan
Sherwood Park
Tofield
Ryley
St. Albert
StonyPlain
SpruceGrove
LeducCalmar
Beaumont
Fort Saskatchewan
Capital Regional NortheastWater Services Commission
Capital Region Vegreville CorridorWater Services Commission
Highway 14 WaterServices Commission
Capital Region ParklandWater ServicesCommission
Capital Region SouthwestWater Services Commission
Pipelines
Rossdale Supply Area
E. L. Smith Supply Area
Treatment Plant
Reservoir
City ofEdmonton
Andrew
May 2000

Investigating the relationship between drinking water and gastroenteritis: Edmonton, 1993-1998 November 29th, 2002
Page 10 of 61
Institute, Inc.), water service areas for each plant were digitally mapped, and are shown in Figure 2.
Regions where the water source could not be uniquely identified are shaded in grey.
The Rossdale plant consists of two treatment facilities – the first was built in 1947, and the
second in 1956. Combined, they have the capacity to treat 275 million litres of water per day. The E.L.
Smith plant was subsequently built in 1976 to meet the demands of an expanding population. With a
treatment capacity of 240 million litres per day, this latter plant was built away from the downtown core,
upstream of the Rossdale facilities. Both plants draw in water from the North Saskatchewan River,
which is within the North Saskatchewan River Basin.
Figure 2: Water service areas for the Rossdale and E.L. Smith plants, Edmonton
1.2 b) Watershed characteristics The North Saskatchewan River originates from the foot of the Columbia Icefields in the Rocky
Mountains south-west of Edmonton, and flows directly through Edmonton. En route, the river is fed by
numerous rivers and creeks.

Investigating the relationship between drinking water and gastroenteritis: Edmonton, 1993-1998 November 29th, 2002
Page 11 of 61
In contrast to the watersheds that serve as Vancouver’s water source, the North
Saskatchewan River Basin is not protected from human and agricultural influences. Covering 28,000
square kilometres, this watershed contains mountains, forests, several communities and farm lands.
The upper half of the watershed is mountainous and forested, with little human activity. In
contrast, the lower watershed is flatter, more inhabited, and supports agricultural activities. The
watershed contains a thriving livestock industry, with approximately 290,000 cattle. It also supports an
extensive wildlife population that includes deer, elk, beaver, and moose. Approximately 76,000 people
reside in the upstream basin in a number of small towns and hamlets. Four continuous discharge
sewage treatment plants and 16 sewage treatment lagoons discharge waste to the North
Saskatchewan River upstream of the city of Edmonton. The continuous discharge sewage treatment
plants utilise secondary treatment to process waste materials. There is limited industry in the upstream
basin apart from forestry, and oil and gas extraction. This latter activity includes many pipelines that
collect at refineries in Edmonton (per. comm., EPCOR).
The soils in the watershed are primarily glacial clays, and result in very high turbidities during
high river flow situations. The mean yearly flow in the North Saskatchewan River is just over 200 m3
per second, but peak flows can exceed 800 m3 per second. The river has stable flows during the
winter season under ice cover, but is susceptible to rapidly changing flows during the spring season
when snowmelt and spring run-off situations occur. Heavy rainfalls during the summer also increase
the river flow rate (per. comm., EPCOR).
1.2 c) Water purification procedures
The Rossdale and E.L. Smith plants utilise a multi -step approach to treat water drawn-in from
the North Saskatchewan River. The process begins with intake pipes that draw-in water from the
deepest part of the river. Screens at the end of these pipes prevent debris and fish from being drawn
into the system. Coagulant chemicals are mixed with the raw water to achieve flocculation. During
sedimentation, the aggregate particles settle to the bottom, and the clear water above is passed on to
the next stage. Lime is then added, and the precipitated hardness is removed in a further sedmintation
process. Carbon dioxide is added to reduce the pH after softening. Chlorine is added to the clarified
water for disinfection, then ammonia is added to convert the remaining free chlorine to chloramine.
Then the water is filtered through an almost 1-metre deep bed of fine anthracite coal and sand (E.L.
Smith) or monomedia sand (Rossdale). Activated carbon is added during runoff periods to reduce the
presence of organic material and to improve the taste and odour of the water. At the end of this

Investigating the relationship between drinking water and gastroenteritis: Edmonton, 1993-1998 November 29th, 2002
Page 12 of 61
process, the water is pumped out into the city to the customer, either directly, or through additional
storage reservoirs located across the city.
1.3 Study Objectives
The primary objective of this investigation was to determine if endemic gastroenteritis within
the city of Edmonton was influenced by the municipal water supply between January 1993 to
December 1998. Using the level of turbidity in finished water as the primary measure of drinking water
quality, a significant association was identified with endemic gastroenteritis in Vancouver. At the time
of that investigation, filtration was not part of the water purification process in Vancouver. Other
investigators have also found similar relationships using similar methodologies (Morris et al, 1998;
Schwartz et al, 1997).
Geographic differences between the two Edmonton water treatment plants with respect to their
point of access on the North Saskatchewan River warrant comparison in the levels of illness among
their respectively serviced populations. The E.L. Smith plant is located upstream from the Rossdale
plant, which in contrast, is situated in the downtown core (Figure 2). While the E.L. Smith plant is
unaffected by city storm sewer runoff, the Rossdale plants are susceptible to runoff from 80
stormsewers upstream. In December of 1997, the Rossdale intake pipe was moved away from the
shoreline towards the centre of the river in an attempt to minimise the impacts of stormsewer run-off on
the quality of raw water. Concurrent with this event was the introduction of the use of particle counters
at the plant, which allowed much better optimisation of the filters to minimise the effect of filter-to-waste
periods, filter spikes, and particle increases at the end of filter runs.
Another objective of this investigation was to compare and contrast the utility of various water
quality indicators for identifying potential relationships with gastroenteritis. In addition to finished water
turbidity, particle counts in finished water were examined. Raw water indicators, such as turbidity and
coliform counts, were also considered.
Finally, the effect of environmental parameters including temperature and precipitation were
assessed. Heavy rainfall has been implicated as an inciting factor in several waterborne gastroenteritis
outbreaks (Curriero et al, 2001; Grey Bruce Health Unit, 2000). In Edmonton, run -off potentially carries
animal waste and irrigation chemicals into the North Saskatchewan River, which may then compromise
the water purification process.
Achieving the objectives listed for this investigation allowed for an assessment of the nature of
the relationship, if any, between Edmonton’s municipal water supply and endemic gastroenteritis.

Investigating the relationship between drinking water and gastroenteritis: Edmonton, 1993-1998 November 29th, 2002
Page 13 of 61
SECTION 2: DATA SOURCES
To assess the relationship between water quality and gastroenteritis, a comprehensive database was created from data that were provided by various agencies. Extensive retrospective water quality and environmental data were collected to assess their impact on community health. Data stemming from hospitalisation use and physician-billing claims were used to create appropriate health outcome groups. A description of these data are provided in the subsequent sections. 2.1 Water Quality Parameters
Water quality data from January 1, 1993 to June 30, 1999 were provided by EPCOR Water Services, Inc. A complete list of the types of data provided are listed in Table 1. With the exception of
the particle count data, dates of availability for all the measured indicators are identical for both plants. However, data that were available for analysis differed for some parameters, depending on when automated data retrieval systems were implemented. Finished water turbidity was provided in the form of 5-minute readings for all on-line filters (nine in Rossdale, twelve in E.L. Smith). To facilitate analysis
using these extensive data (288 readings per filter per day), these data were summarised into daily mean, median, and maximum values. Subsequent statistical tests were used to determine the optimal parameterisation for these data. Compared to the Vancouver study, additional variables available for analysis in this
investigation included finished water particle count data. The use of particle counts is a new approach to measuring water quality. Only recently implemented, particle counts are perceived to be a more accurate proxy measure of finished water quality than turbidity. Many of the raw water parameters listed in Table 1 were also unique to this investigation, and were not examined in the Vancouver study.
Table 1: Indicators of water quality received from EPCOR Water Services, Inc.
Water Quality Parameters Provision Dates
Finished water* Turbidity January 1 1993 to June 30 1999* Particle Counts
Rossdale plant January 1, 1998 to June 30, 1999E.L. Smith plant March 13, 1998 to June 30, 1999
Raw water* Turbidity January 1, 1993 to June 30, 1999* Temperature January 1, 1993 to June 30, 1999* pH January 1, 1993 to June 30, 1999* Colour January 1, 1993 to June 30, 1999* Faecal coliform counts January 1, 1994 to June 30, 1999* Total coliform counts January 1, 1994 to June 30, 1999

Investigating the relationship between drinking water and gastroenteritis: Edmonton, 1993-1998 November 29th, 2002
Page 14 of 61
2.2 Environmental Parameters
Environmental parameters from January 1, 1993 to December 31, 1998 were provided by
Environment Canada. Daily maximum and minimum temperatures in degrees Celsius, and daily
precipitation measured in millimetres were used.
2.3 Socio-Economic Data
Average household income in 1995 was derived from the 1996 Census Data (Statistics
Canada).
2.4 Health Outcome Data
Emergency visit data and hospitalisation admission data have been used previously to assess
endemic gastroenteritis (Morris et al, 1998; Schawrtz et al, 1997). Many similarities exist between the
health outcome data utilised in the Vancouver study and the current study. In the Vancouver study, a
total of three different sources were used: hospitalisation admission data from the Canadian Institute
for Health Information (CIHI); physician visit data from the Medical Services Plan in B.C.; and emergency room visit data from the British Columbia Childrens’ Hospital. A comparison was then
made among these datasets to determine consistency of results.
In the present study, two primary data sources were used: hospital admission data from CIHI;
and physician-billing data from the Alberta Health Care Insurance Payment Plan. However, in contrast
to the Vancouver study, it was possible to further differentiate the latter data source into three distinct categories: namely, billing that resulted from emergency room visits, physician-office visits, and long-
long-term care facilities. Recognising that the various data-capture-sources would be more
representative of certain populations, interpretations of the results were based on the findings from
each of the four different data sources. The selection criteria for gastrointestinal cases and respiratory controls were based on the literature (Morris et al, 1998; Schwartz et al, 1987) and on the advice of
general practitioners and a gastroenterologist. 2.4 a) Canadian Institute for Health Information
The Canadian Institute for Health Information receives data from approximately 85% of
hospitals across Canada. Each record within this comprehensive database contains the specifics of each case admission, including the patient’s date-of-birth, gender, postal code of residence, scrambled
personal identifier, admission date, reason for admission, surgery type, diagnosis fields, and institute
type. Only valid and complete records from January 1, 1993 to December 31, 1998 were further
considered for the case and control selection process. These criteria selected patients that had a valid date-of-birth, admission date, and gender information. A postal code was also required to verify
residence within Edmonton. Elective surgeries and elective admissions to acute care facilities were
excluded from further investigation.

Investigating the relationship between drinking water and gastroenteritis: Edmonton, 1993-1998 November 29th, 2002
Page 15 of 61
Gastrointestinal cases and respiratory controls were selected using a similar approach to that
described in the Vancouver study. The 9th revision of the International Classification of Diseases (ICD-
9), published by the World Health Organisation, is designed for the classification of morbidity and
mortality information for statistical purposes, and for the indexing of hospital records by disease and
operations, for data storage and retrieval. Appropriate 3-digit and 4-digit ICD-9 codes were selected to
designate admitted patients as gastroenteritis cases or respiratory controls.
Criteria for selecting gastroenteritis cases are outlined in Table 2. A gastroenteritis case was
defined as any individual with a primary diagnosis3 of one of the ICD-9 codes marked in column A, or
with a primary diagnosis of one of the ICD-9 codes marked in column B and a secondary diagnosis of
one of the ICD-9 codes marked in column A. Table 2: Criteria for selecting hospital admission gastroenteritis cases in the CIHI data source
Case
Definition 1 Case Definition 2
ICD-9 Description Column A:
1o diagnosis Column B:
1o diagnosis with Column A:
2o diagnosis
001 Cholera X X 002 Typhoid and paratyphoid fevers X X 003 Other salmonella infections X X 004 Shigellosis X X 005 Other food poisoning (bacterial) X X 006 Amoebiasis X X 007 Other protozoal intestinal diseases X X
008 Intestinal infections due to other organisms X X 009 Ill-defined intestinal infections X X 558* Other noninfectious gastroenteritis and colitis X X 5350 Acute gastritis X X 5354 Other gastritis X X 5355 Unspecified gastritis and gastroduodenitis X X 5356 Duodenitis X X
5589 Other and unspecified noninfectious gastroenteritis and colitis X X 7870 Nausea and vomiting X X 276 Disorders of fluid, electrolyte, and acid -base balance X
787 Symptoms involving digestive system X
5781 Melaena X
6910 Diaper or napkin rash X
7806 Pyrexia of unknown origin X
7830 Anorexia X
7832 Abnormal loss of weight X
7890 Abdominal pain X * Although labelled as “noninfectious”, may in fact be an undiagnosed episode of infectious gastroenteritis
3 Defined as the most significant contributor to the hospital stay
Investigating the relationship between drinking water and gastroenteritis: Edmonton, 1993-1998 November 29th, 2002
Page 16 of 61
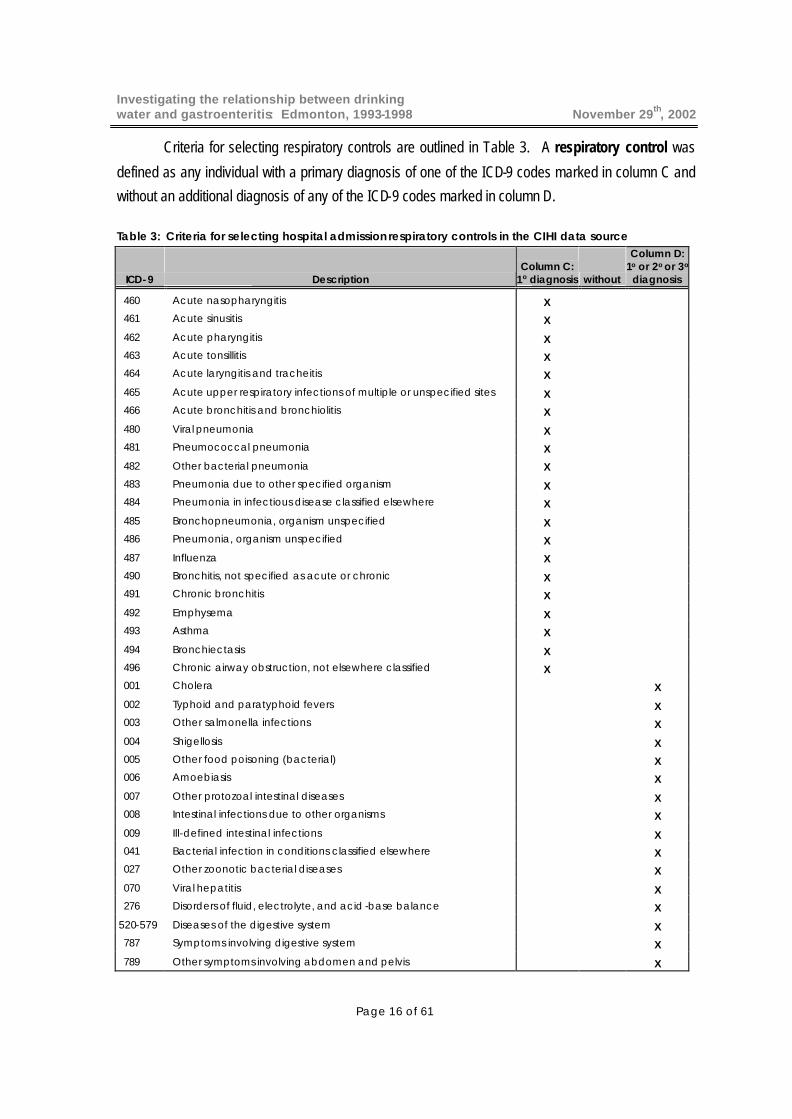
Criteria for selecting respiratory controls are outlined in Table 3. A respiratory control was
defined as any individual with a primary diagnosis of one of the ICD-9 codes marked in column C and
without an additional diagnosis of any of the ICD-9 codes marked in column D.
Table 3: Criteria for selecting hospital admission respiratory controls in the CIHI data source
ICD-9 Description Column C:
1o diagnosis without
Column D: 1o or 2o or 3o
diagnosis
460 Acute nasopharyngitis X
461 Acute sinusitis X
462 Acute pharyngitis X
463 Acute tonsillitis X
464 Acute laryngitis and tracheitis X
465 Acute upper respiratory infections of multiple or unspecified sites X
466 Acute bronchitis and bronchiolitis X
480 Viral pneumonia X
481 Pneumococcal pneumonia X
482 Other bacterial pneumonia X
483 Pneumonia due to other specified organism X
484 Pneumonia in infectious disease classified elsewhere X
485 Bronchopneumonia, organism unspecified X
486 Pneumonia, organism unspecified X
487 Influenza X
490 Bronchitis, not specified as acute or chronic X
491 Chronic bronchitis X
492 Emphysema X
493 Asthma X
494 Bronchiectasis X
496 Chronic airway obstruction, not elsewhere classified X
001 Cholera X
002 Typhoid and paratyphoid fevers X 003 Other salmonella infections X
004 Shigellosis X 005 Other food poisoning (bacterial) X 006 Amoebiasis X
007 Other protozoal intestinal diseases X 008 Intestinal infections due to other organisms X
009 Ill-defined intestinal infections X 041 Bacterial infection in conditions classified elsewhere X 027 Other zoonotic bacterial diseases X
070 Viral hepatitis X 276 Disorders of fluid, electrolyte, and acid -base balance X
520-579 Diseases of the digestive system X 787 Symptoms involving digestive system X
789 Other symptoms involving abdomen and pelvis X

Investigating the relationship between drinking water and gastroenteritis: Edmonton, 1993-1998 November 29th, 2002
Page 17 of 61
To prevent over-estimating the rate of illness and thus distorting the true relationship between
gastroenteritis and water quality for both cases and controls, admissions with a similar diagnosis which
occurred within 60 days of an initial visit were considered part of the same disease episode, and thus
were not included in the analysis.
2.4 b) Alberta Health Care Insurance Payment Plan
The Alberta Health Care Insurance Payment Plan (AHCIPP) maintains a comprehensive
database on all billing claims that originate from a variety of health care provider types. As with the
CIHI database, each record within the AHCIPP database contains patient -specific information,
including the age at time of treatment, gender, postal code of residence, scrambled personal identifier,
diagnosis fields, and coded aggregate function centre type. This last field was used to differentiate
between claims originating from various sources. Billing resulting from emergency room visits (EMRG),
physician-office visits (PHYS), and long-term care centres 4 (LTC) were analysed separately
Within each of these three data sources, records from January 1, 1993 to December 31, 1998
with a valid age, gender, and postal code within Edmonton were selected. Since only 3-digit ICD-9
codes were available in the AHCIPP database, the criteria used to select cases and controls varied
slightly from the CIHI database. For these data, a gastroenteritis case was defined as an individual
who was diagnosed with an intestinal infectious disease (ICD-9 codes: 001 -009, refer to Tables 2 and
3) or other “noninfectious” gastroenteritis and colitis (558). A respiratory control was defined as an
individual who was given a primary diagnosis of an acute respiratory infection (460-466), pneumonia
(480-483, 485-486), or asthma (493), who did not also suffer from an intestinal infectious disease (001
to 009), disease of the digestive system (520 to 579), nor any of the other gastrointestinal-related
illness described in Table 3 (027, 041, 070, 276, 487, 787, 789). All repeat visits within a 60-day
interval were excluded.
2.5 Assigning a Primary Water Source
As in the Vancouver study, water received at home was chosen as the primary exposure
variable of interest. Therefore, to identify potential associations between water quality and
4 Long-term care centres provide regular treatment services and continuing care to seniors, as well as those with persistent mental illness and physical disabilities.

Investigating the relationship between drinking water and gastroenteritis: Edmonton, 1993-1998 November 29th, 2002
Page 18 of 61
gastroenteritis, the same method of assigning cases and controls to their primary water source was
used. The 6-digit postal codes provided in the health outcome data were linked to a digitised postal
code file (Enhanced Postal Code File, Desktop Mapping Technologies, Inc.). This procedure
designates a centroid point, along with geographical co-ordinates, for each postal code region.
Applying GIS overlay techniques on the digitally-mapped water service areas shown in Figure 2,
Edmonton residents were linked to a primary water source based on their location of residence.

Investigating the relationship between drinking water and gastroenteritis: Edmonton, 1993-1998 November 29th, 2002
Page 19 of 61
SECTION 3: INVESTIGATIVE METHODS 3.1 Descriptive Analyses
Descriptive analyses were carried out initially to identify general trends and associations in
both the health outcome and exposure data. Temporal trends in the health outcome data were
investigated and a profile of each data source was created to determine the proportion of cases within
each age group and for each water service area. The distributions of primary ICD-9 codes captured in
the case definition were also determined. Preliminary statistics were determined for the water quality
and environmental parameters. Comparisons were made between the two water treatment plants to
determine if general differences in water quality existed.
3.2 Multivariate Logistic Regression
3.2 a) Methodology overview
The primary objective of this portion of the analysis was to compare the risk of gastroenteritis
for residents within each of the water service areas in Edmonton. Results from the descriptive
analyses demonstrated that some differences in water quality existed between the two water treatment
plants. All individuals with a valid Edmonton postal code who could be linked to the Rossdale or E.L.
Smith water service areas, as well as individuals residing in the mixed zone, were included in this
portion of the analysis. Infants (< 2 years) were excluded from this investigation since it was
hypothesised that their intake of tap water in the home was likely minimised due to neonatal feeding
practices, and thus not compatible with the remaining study population with respect to exposure
patterns.
A case-control study design was used for this analysis. The modeled binomial response was
case status: gastroenteritis case or respiratory control. Respiratory controls were used to help control
for the potential influences of environmental factors on health outcome. The effect of modeled
variables on health outcome was given by odds ratios. Each health outcome data set for the
multivariate logistic regression portion of the analysis contained binary health outcomes, and each data
set was modeled independently. The components of these analyses are summarised in Table 4.

Investigating the relationship between drinking water and gastroenteritis: Edmonton, 1993-1998 November 29th, 2002
Page 20 of 61
Table 4: Components of the analytic approaches utilised in the multivariate logistic regression analyses
Generalised Linear Models (GLM)
A generalised linear model (GLM) with a binomial distribution and logit link, was the underlying
statistical model used to analyse these data (McCullagh and Nelder, 1983). The resulting multivariate
logistic modeling process was carried out using the GENMOD procedure in SAS, version 8.0.
Separate models were evaluated for each of the four health outcome data sources.
Due to the enormity of the data originating from the physician-office billing data source, a
random subset of the data was taken to facilitate analysis. A 1:3 ratio of cases to controls was formed
by randomly selecting 20% of original cases. This randomised selection process was carried out using
a random number function (RANUNI) in SAS, version 8.0.
Spatial Generalised Additive Models (GAM)
Spatial regression models were subsequently carried out to provide a visual representation of
the geographic differences in risk of gastroenteritis within the city of Edmonton. A binomial generalised
additive model (GAM) was utilised to analyse the same health outcome data (Hastie and Tibshirani,
1990). GAM models are an extension of GLM models, in that a flexible additive non-linear relationship
may be modeled between the independent predictor (risk factor) and the response. The response is
modeled as a sum of smooth functions in the predictors, where these functions are estimated using
smoothers (a curve is fit to the data points locally, so that at any point, the curve depends only on the
observations at that point, and some specified neighbouring points – this estimate of the response is
Defined cases and controls within Edmonton, in the Rossdale, E.L. Smith, or Mixed zone water service areas
Defined cases and controls within Edmonton, in the Rossdale, E.L. Smith, or Mixed zone water service areas
PHYS (physician office visits) (1 case:3 controls)
LTC (long-term care visits)
Binomial: gastroenteritis case or respiratory control
Binomial: gastroenteritis case or respiratory control
Multivariate Logistic Regression
Generalised Linear Model (GLM)
Health outcome data sets separated by
Data source
CIHI (hospital admissions)
EMRG (emergency-room visits)
CIHI (hospital admissions)
Spatial Generalised Additive Model (GAM)
EMRG (emergency-room visits)
PHYS (physician office visits) (1 case:1 control)
LTC (long-term care visits)
Study populationModeled outcome
Modeling Approach
Analysis

Investigating the relationship between drinking water and gastroenteritis: Edmonton, 1993-1998 November 29th, 2002
Page 21 of 61
referred to as a smooth, and procedures for producing such fits are called smoothers). Model fit is
improved through the flexible parameterisation of variables in GAM models, and parameter estimates
may be derived with greater accuracy.
GAM models were used for this spatial component of the analysis to accommodate for the
inclusion of geographical co-ordinates in the modeling process. The location of cases and controls was
determined by using their corresponding 6-digit residential postal code. Longitude and latitude co-
ordinates assigned to the centroid point within each postal code area were incorporated into the loess
smoothing function within the GAM model (Cleveland and Devlin, 1988). This method of fitting the
location effect directly into the statistical model as a non-linear parameter has also been applied in
other studies where the objective has been to detect spatial clusters (Preisler et al, 1997; Brillinger,
1994; Chambers and Hastie, 1992; Cook and Pocock, 1983). The gam function in S-PLUS 2000,
release 2 (MathSoft, Inc.) was used to carry out this spatial component of the multivariate logistic
regression analysis, as smoothing functions are easily accommodated in this analytical software
package.
Similar to the GLM analysis, a random subset consisting of 20% of the original cases captured
in the physician-office data source was created. Due to the computational intensity associated with
fitting a loess smoother to the geographical co-ordinates, controls were selected to satisfy a 1:1 ratio of
cases to control s using the same procedure described in the previous section.
3.2 b) Variables analysed
A list of variables investigated in both of the multivariate logistic regression processes is
provided in Table 5.
Generalised Linear Models (GLM)
To estimate the risk of gastroenteritis for residents within each of the water service areas, a
categorical variable was created to reflect the primary water source in the generalised linear modeling.
Levels of this variable, SOURCE were:
• Mixed zone, before December 10, 1997
• Mixed zone, after December 10, 1997
• Rossdale water service area, before December 10, 1997
• Rossdale water service area, after December 10, 1997
• E.L. Smith water service area, before December 10, 1997
• E.L. Smith water service area, after December 10, 1997

Investigating the relationship between drinking water and gastroenteritis: Edmonton, 1993-1998 November 29th, 2002
Page 22 of 61
Table 5: Independent variables analysed for the multivariate logistic regression analyses
The risks associated with each of the water service areas were distinguished between when
the Rossdale intake pipe was moved, which coincided with the introduction of particle counters in this
plant (December 10, 1997). This distinction was made since raw water quality from the Rossdale plant
changed following these events. Statistical comparisons in risk among SOURCE levels were carried
out using contrasts. Since residential location is a reflection of the quality of water received at home,
none of the water quality nor environmental parameters associated with the time series analysis were
included in these analyses.
Since SAS does not easily accommodate loess smoothing functions in regression models, a
separate spline was created for each 2-month period, so that different slopes (risk estimates) could be
determined for each time interval, and thus control for seasonal trends in viral gastroenteritis. This
technique is used when it can be expected that the effects vary across different levels of a variable.
Comparisons between models using splines in SAS and the loess smoothing function in S-PLUS to
adjust for seasonal trends, produced similar results (data not provided).
Household income was used as an indicator of socio-economic status, which was
hypothesised to influence the risk of illness. The average household income reported in 1995 for each
enumeration area (Statistics Canada, 1996) was linked to each postal code, and subsequently to each
case and control. This variable was included in all models.
AnalysisModelling Approach
Variable Name Description
SOURCE Categorical term to denote primary water source
SPLINES1…37Seaonal parameter using splines to represent each 2-month interval
INCOMEAverage household income in 1995 per postal code
AGEGROUPCategorical variable: 2 to 18 yrs, > 18 to 65 yrs,> 65 yrs
LONGITUDE, LATITUDESpatial term using longitude and latitude , smoothed term
DEC1097Categorical term to denote before and after December 10, 1997
SEASONSeasonal parameter using 220-day cycle, smoothed term
INCOMEAverage household income in 1995 per postal code
AGEGROUPCategorical variable: 2 to 18 yrs, 18 to 65 yrs,> 65 yrs
Multivariate Logistic Regression
Generalised Linear Model (GLM)
Spatial Generalised Additive Model (GAM)

Investigating the relationship between drinking water and gastroenteritis: Edmonton, 1993-1998 November 29th, 2002
Page 23 of 61
Age was fit as a categorical variable in these models to adjust for potential differences in risk
between age groups. Thus, an averaged estimate of risk for residents of different water service areas
was obtained. Categories for age were identical to the levels of stratification used in the time series
analysis: 2 to 18 years, greater than 18 to 65 years, and greater than 65 years.
Spatial Generalised Additive Models (GAM)
A loess smoother was fit to the longitude and latitude co-ordinates of the centroid points for
each postal code. This independent (risk factor) variable was used to derive estimates of the risk of
gastroenteritis for various locations within Edmonton. A categorical term, DEC1097 was also modeled
to represent the risk prior to and after the relocation of the Rossdale intake pipe. The inclusion of these
variables in the spatial model replaced the categorical term SOURCE used in the GLM modeling
process.
Since S-PLUS easily accommodates smoothing functions, seasonal fluctuations in
gastroenteritis were also modeled using the loess smoothing function. Average household income and
age were also included in these spatial models.
3.2 c) Criteria for model-selection
For the GLM models, step-wise model selection based on the variables listed in Table 5 was
conducted for each health outcome data set. The effect of each variable was evaluated by using the
likelihood ratio test (Fahrmeir and Tutz, 1994). Criteria for inclusion in the final model was set at the
5% level of statistical significance. Model-fit was examined using Akaike’s Information Criterion
(Sakamoto et al, 1986). Variables in the spatial model (GAM) were chosen to reflect the variables
identified in the final multivariate logistic regression model.
3.3 Time Series Analysis
3.3 a) Methodology overview
Similar to the Vancouver study, generalised additive models (GAM) were used to investigate
temporal relationships between water quality and gastroenteritis. This approach has also been applied
in other time series studies (Morris et al, 1998; Schwartz et al, 1997). The application of this
methodology for time series investigations has been described in detail in the Vancouver study
(Aramini et al, 2000). S-PLUS 2000, release 2 (MathSoft, Inc.) was used to carry out this portion of the
analysis.

Investigating the relationship between drinking water and gastroenteritis: Edmonton, 1993-1998 November 29th, 2002
Page 24 of 61
A loess smoothing function (Cleveland and Devlin, 1988) was used to describe the potentially
non-linear relationship between the risk of gastroenteritis and turbidity, along with other water quality
and environmental parameters described in sections 2.1 and 2.2. In addition, the smoothing function
was also applied to fit a seasonal (long-term) parameter in an attempt to control for seasonal trends in
gastroenteritis. A 220-day cycle, which was employed and described in the Vancouver study, was
used to represent this seasonal trend.
To determine the influence of water quality from each plant on the corresponding serviced
population, individuals from each of the four data sources were analysed separately, based on the
primary water source. Individuals whose primary water source could not be uniquely identified (mixed
zone - shaded grey area in Figure 2) were excluded from this analysis. By matching the date of
health event to the date of the recorded water quality parameter, daily water quality values observed for
each plant were then linked to the appropriate individuals.
As explained in the Vancouver study, both binomial (case-control) and poisson GAM models
(Hastie and Tibshirani, 1990) were fit to the data. In the binomial models, the modeled outcome was
case status: gastroenteritis case or respiratory control. The outcome for the poisson models was daily
count of gastroenteritis cases. The effect of modeled variables on gastroenteritis was given by odds
ratio and relative risks for the binomial and poisson models, respectively.
Since susceptibility to illness varies across different age groups, separate analyses were
conducted for each of the following age groups: 2 to 18 years, greater than 18 to 65 years, and greater
than 65 years. These age groups are identical to those used in the Vancouver study, with the
exception that infants (< 2 years) were excluded from this investigation. Therefore, each health
outcome data set used in this analysis was specific to each age group, water service area, and data
source (refer to Table 6).
In the binomial analysis, a randomised subset of cases and controls were selected from the
physician-office data, using a 1:3 ratio of cases to controls. This was the same subset described in the
GLM modeling approach. Physician -office data were not reduced for the poisson analysis since
gastrointestinal outcomes were collapsed into daily counts, and the resulting smaller data set was
therefore easily processed by the software application.

Investigating the relationship between drinking water and gastroenteritis: Edmonton, 1993-1998 November 29th, 2002
Page 25 of 61
Table 6: Components of the analytic approaches utilised in the time series analysis
3.3 b) Variables analysed
A list of the independent (risk factor) variables assessed in the time series analysis is provided
in Table 7. Time series variables that were lagged are denoted with subscript i. A description of some
of the key variables is provided below.
Separate analyses were conducted for each time series health outcome data set. For the
water quality and environmental parameters, values from 0 to 40 days prior to the day of the health
outcome event were modeled. This range of lagged values was selected to reflect multiples of the
incubation periods commonly reported for prevalent waterborne pathogens. Therefore, for each time
series health outcome data set and combination of variables analysed, 41 models were evaluated (one
for each lag day).
Finished water turbidity (TBi) was the primary variable of interest for this analysis. However,
the effects of other water quality parameters were also evaluated. Five-minute readings that were
provided for some of the water quality parameters were summarised as daily observed values,
including the mean, median, and maximum reading for that day. Statistical comparisons among
models with the various parameterisations of these data, indicated that the daily mean provided the
best fit to the data. Therefore, all 5-minute readings were summarised as daily means. Rare
occurrences of missing values, which were occasionally the result of off-line filters, were replaced with
the mean of adjacent observed values.
Data source
Age group
Plant
cihi 2 to 18
emrg > 18 to 65
phys (1:3) > 65
ltc
cihi 2 to 18
emrg > 18 to 65
phys > 65
ltc
Rossdale
E.L. Smith
Health outcome data sets separated by
Defined cases and controls within Edmonton, in the Rossdale or E.L. Smith water service areas only
Defined cases within Edmonton, in the Rossdale or E.L. Smith water service areas only
Rossdale
Generalized Additive Model (GAM)
Time Series Analysis
Binomial: gastroenteritis case or respiratory control
Poisson: daily counts of gastroenteritis cases
E.L. Smith
AnalysisModeling Approach
Modeled outcome
Study population

Investigating the relationship between drinking water and gastroenteritis: Edmonton, 1993-1998 November 29th, 2002
Page 26 of 61
Table 7: Independent variables analysed for the time series analysis
Environmental parameters were also examined. In addition to the effect of weather on raw
water turbidity, precipitation was also hypothesised to influence the level of exposure at home. It was
hypothesised that people are more likely to stay indoors as a result of inclement weather, facilitating
person-to-person spread of infectious gastroenteritis. Therefore, precipitation and temperature lagged
up to 40 days prior to the day of the health outcome event were similarly investigated.
Temporal confounders were included in the models to adjust for temporal variations, including
the seasonal parameter. Day-of-week effects were significant in the Vancouver study and were
similarly included in this study. Statutory holidays were also considered to determine if changes in the
accessibility of medical services, as well as holiday behaviours, had an impact on gastroenteritis. To
that end, separate categories were created for the following holidays and holiday weekends:
Christmas and New Year’s, Easter, Victoria Day, Canada Day, August Long Weekend, Labour Day,
AnalysisModeling Approach
Variable Name Description
TBiFinished water daily mean turbidity, smoothed term
PCiFinished water daily mean particle counts, smoothed term
RAWFCiRaw water daily fecal coliform counts, smoothed term
RAWTCiRaw water daily total coliform counts, smoothed term
RAWTBi Raw water daily mean turbidity, smoothed term
RAWTEMPi Raw water daily temperature, smoothed term
RAWPHi Raw water daily ph, smoothed term
RAWCOLiRaw water daily mean colour index, smoothed term
TMAXiMaximum daily mean atmospheric temperature, smoothed term
TMINiMinimum daily mean atmospheric temperature, smoothed term
PRECIPi Daily mean precipitation, smoothed term
SEASONSeasonal parameter using 220-day cycle, smoothed term
DOW Day of week (1-7)
HOLIDAY Statutory holiday and adjacent days
Time Series Analysis
Generalised Additive Model (GAM)

Investigating the relationship between drinking water and gastroenteritis: Edmonton, 1993-1998 November 29th, 2002
Page 27 of 61
Thanksgiving, and Remembrance Day. In addition, the week following each holiday event was also
assessed (with the exception of Remembrance Day).
Finally, an autoregressive term was included in all of the models to adjust for the correlation
arising from daily observations made of each health outcome event. As discussed in the Vancouver
study, even in the absence of a relationship with water quality, the number of hospital admissions,
physician visits, emergency room visits, and treatments provided in a long-term care facility on any
given day can be expected to be related to the number the day before. Several possible reasons for
this include persons sharing a common food or water source, and variable pathogen incubation times.
The autoregressive term was expressed as a ratio of the number of cases to the number of controls,
and was fit as a linear term in the model.
3.3 c) Criteria for model-selection
Based on the descriptive analyses and on the multivariate logistic regression results,
quantitative time series analysis was conducted for the water service area that represented the highest
potential risk of endemic waterborne gastroenteritis (Rossdale, prior to December 10, 1997). Similar to
the multivariate logistic regression, the effect of each variable listed in Table 7 was determined by
conducting deviance comparisons using the likelihood-ratio test, and comparing AIC values and
parameter estimates. Significant lags were identified by comparing the change in deviance in models
with and without the lagged variable, thereby evaluating the overall effect of that lagged variable.
However, multiple statistical comparisons increase the probability of erroneously detecting a
statistically significant association, commonly referred to as Type I error (Steel et al, 1997). Therefore,
when evaluating the effect of parameters up to 40 days prior to the health outcome event, only lags that
were significant over two to three consecutive days were further assessed for consistency among the
different age groups and health outcome data sources.
Investigating the relationship between drinking water and gastroenteritis: Edmonton, 1993-1998 November 29th, 2002
Page 28 of 61
SECTION 4: RESULTS 4.1 Descriptive results 4.1 a) Water quality parameters
Summary statistics for the finished and raw water quality parameters of primary interest are
provided in Table 8. Because of the changes that were implemented at the Rossdale plant on
December 10, 1997 (movement of the intake pipe and the introduction of particle counters), results for
this plant are further differentiated as prior to and following this event.
In general, raw water parameters indicate better quality of water entering the E.L. Smith plant
in comparison to the Rossdale plant, both before and after December 10, 1997 (Table 8). The
differences are most pronounced in total and faecal coliforms. Following December 10, 1997, the
differences in raw water parameters between the plants are less prominent.
Of primary interest in the time series analysis was the daily finished water turbidity (TBi). Prior
to December 10, 1997, finished water turbidity values (mean and median) were slightly lower in the
E.L. Smith plant (Table 8). Following December 10, 1997, summary statistics appeared to be
equivalent. Limited data on particle counts in finished water were provided. Mean and median particle
counts from the E.L. Smith plant are marginally lower. However, these data must be interpreted with
caution, since they were only available in 1998.
Temporal trends for finished water parameters are further described in Figures 3a and 3b.
These data have been presented using the loess smoother and a span appropriate to the data to
reduce the ‘noise’ resulting from daily fluctuations in the data. These figures demonstrate that finished
water turbidity values for the Rossdale experienced greater fluctuations (within 0.2 NTU) than those
originating from the E.L. Smith plant. There is some suggestion, however, that following December 10,
1997, values became more stabilised.
For both plants, seasonal peaks in raw water turbidity during the summer months were
apparent, and were likely due to an increase in run-off from rainfall. Faecal coliforms also appeared to
favour these temperate months, as their numbers increased during this time.

Investigating the relationship between drinking water and gastroenteritis: Edmonton, 1993-1998 November 29th, 2002
Page 29 of 61
Table 8: Summary statistics for indicators of raw and finished water quality: Jan. 1, 1993 to Dec. 31, 1998 1 Rossdale intake pipe relocated on December 10, 1997, at which time, particle counters were also introduced. Therefore, presented results are based on data up to and including December 10, 1997 2 Presented results are based on data from December 11, 1997 and beyond
3 Data available March 13 – December 31, 1998 4 Data available January 1 - December 31, 1998 5 Data available January 1, 1994 – December 31, 1998
Water Quality Data Std. Dev. Median Mean95% Confidence Interval (Mean)
Finished water parameters* Daily mean turbidity (NTU)
E.L. Smith 0.02 to 0.17 0.01 0.03 0.04 (0.039 , 0.040)Rossdale 0.00 to 0.38 0.03 0.05 0.06 (0.059 , 0.061)
Before December 10, 19971 0.00 to 0.38 0.03 0.05 0.06 (0.059 , 0.062)After December 10, 19972 0.02 to 0.07 0.01 0.04 0.04 (0.039 , 0.041)
* Daily mean particle counts, 1998 (counts per mL, (>2µm))E.L. Smith3
1.2 to 62.2 7.1 7.9 9.3 (8.5 , 10.1)Rossdale4
2.5 to 55.3 7.3 12.5 13.3 (12.5 , 14.1)
Raw water parameters* Daily mean turbidity (NTU)
E.L. Smith 0 to 1,967 98 6.0 31 (26.9 , 35.1)Rossdale 1.1 to 1,754 101 8.0 34 (29.7 , 38.3)
Before December 10, 19971 1.6 to 1,481 94 9.0 35 (30.7 , 39.3)After December 10, 19972 1.1 to 1,754 126 5.2 34 (21.5 , 46.5)
* Daily faecal coliform counts5(counts per 100mL)E.L. Smith 0 to 510 58 5 30 (28.0 , 32.0)Rossdale 0 to 15,000 951 160 399 (353.9 , 444.1)
Before December 10, 19971 0 to 15,000 1,052 200 480 (425.1 , 534.9)After December 10, 19972 0 to 2,800 188 51 96 (76.4 , 115.6)
* Daily total coliform counts5(counts per 100mL)E.L. Smith 0 to 3,800 404 40 133 (115.4 , 150.6)Rossdale 0 to 346,000 15,886 2,100 6,221 (5,491.9 , 6,950.1)
Before December 10, 199710 to 346,000 17,571 3,200 7,717 (6,809.5 , 8,624.5)
After December 10, 199722 to 21,000 1,674 265 640 (473.4 , 806.6)
Range