Embed Size (px)
Citation preview
Journd of Ncurochrmisiry. 1977. Vol. 29. pp. 13.-?6. Pergamon Press. Printed in Great Britain
SHORT REVIEW
RELATION BETWEEN PHYSIOLOGICAL FUNCTION AND ENERGY METABOLISM IN THE
CENTRAL NERVOUS SYSTEM
Lours SOKOLOFF LabOrdtOI'y of Cerebral Metabolism, U.S. Department or Health, Education. and Welfare,
Public Health Service. Bethesda. MD 20014, U.S.A.
THE H R A I N is a complex organ composed of many structural and functional components with markedly different and independently regulated levels of func- tional and metabolic activity. In more homogeneous organs that do readily recognizable physical and chemical work. such as the heart, skeletal muscle. and kidney, a close relationship between functional ac- tivity and energy metabolism is well established. The existence of a similar relationship in the tissues of the CNS has been more difficult to prove, partly because of uncertainty about the nature of the work associated with nervous functional activity, but mainly because of the difficulty in assessing the lcvels of functional and metabolic activities in the Same functional component of the brain at the same time. Pathological and pharmacological conditions with gross and diffuse effects on cerebral functional ac- tivity, particularly those that alter the level of con- sciousness, have been shown to be associated with changes in overall cerebral metabolic rate (KEIY, 1950, 1957; LASSES, 1959; SOKOLOFF. 1976), but such associations could reflect separate independent conse- quences of cellular dysfunction rather than a direct relationship between cerebral functional activity and energy metabolism. Changes in the metabolic rate of the brain as a whole have generally not been found during physiological alterations of cerebral functional activity (LASSEN, 1959; SOKOLOFF, 1969, 1976). What has clearly been needed is a method that measures the rates of energy metabolism in specific discrete regions of the brain in normal and altered states of functional activity. The recently developed [14C]deoxyglucose technique (SOKOLOFF et al., 1977) appears to fulfill this need. It can be used to measure quantitatively the local rates of glucose utilization simultaneously in all the macroscopically visible structures of the brain. It can be applied to normal conscious animals as well as those under experimen- tally altered states of cerebral activity. Furthermore.
Abbretiarions used: DG, 2-deoxy-~-glucose; DG-6-P. 2-deoxy-~-glucose-6-phosphate.
the ['4C]deoxyglucose method employs an auto- radiographic technique which provides pictorial representations of the relative rates of glucose utiliza- tion throughout the various components of the brain; even without quantification these autoradiographs provide clearly visible markers that map cerebral regions with increased or decreased rates of energy metabolsim in altered physiological, pharmacological, and pathological states. This method has provided unequivocal evidence of a close relationship between functional activity and energy metabolism in discrete structural and/or'functional units of the nervous sys- tem.
METHODOLOGY
A full, detailed, and comprehensive description of the theoretical basis of the ['4C]deoxyglucose method has recently been published (SOKOLOFF et ul., 1977). A brief summary of its essential principles is necessary, however. to clarify the salient features of its design, its rigid procedural requirements. and the limitations on its applications.
The method was designed to take advantage of the extraordinary spatial resolution afforded by a quanti- tative autoradiographic technique that was originally developed for the measurement of local ccrebral blood Row (LANDAU et a/., 1955; REIVICH et a/., 1969). The dependence on autoradiography prescribed the use of radioactive substrates for energy metabolism, the labeled products of which could be assayed in the tissues by the autoradiographic technique. Although oxygen consumption is the most direct measure of energy metabolism, the volatility of oxygen and the short physical half-life of its radioac- tive isotopes precluded measurement of oxidative metabolism by the autoradiographic technique. In most circumstances glucose is almost thc sole suk strate for cerebral oxidative metabolism, and its utili- zation is stoichiometrically related to oxygen con- sumption (KETY. 1957; SOKOLOFF, 1976). Radidactive glucose is, however, not fully satisfactory because its labeled products have too short a biological half-life and are lost too rapidly from the cerebral tissues. The
13
14 Lous SOK~LOFF
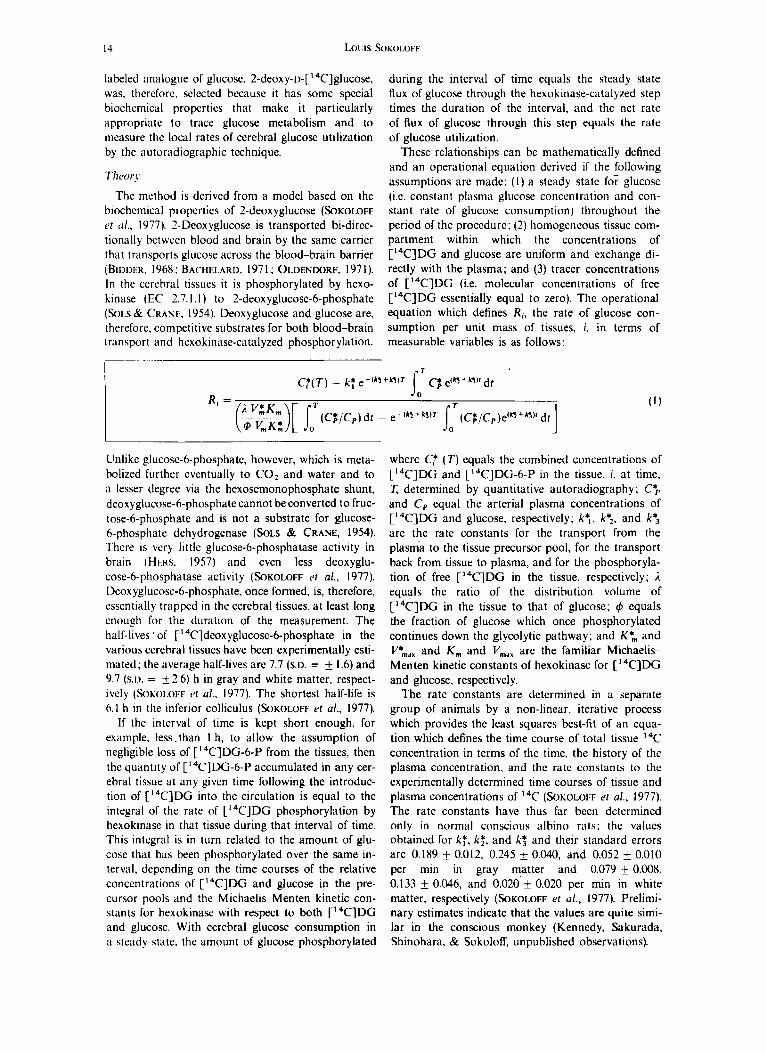
labeled analogue of glucose, 2-deoxy-u-[ I 4C]glucose, was. thcrcforc. sclccted because it has some special biochemical properties that make i t particularly appropriate to trace glucose metabolism and to measure thc local rates of cerebral glucose utilization by the autoradiographic technique.
'I 'h~,orj
The method is derivcd from a model based on the biochcmical properties of 2-deoxyglucose (SOKOIDFF ct d., 1977). 2-Deoxyglucose is transported bi-dircc- tionally bctwecn blood and brain by the same carrier that transports glucose across the blood-brain barrier ( BIIXIER. 1968 : BACHELARD. I97 1 ; OLDENDORF. 197 I ). In the cerebral tissues it is phosphorylated by hexo- kinase (EC 2.7. I . I ) to 2-deoxyglucosc-6-phosphate (So1.s & CKASF. 1954). Deoxyglucose and glucose are, therefore. competitive substrates for both blood-brain transport and hexokinase-catalyzed phosphorylation.
during the interval of time equals the steady state flux of glucose through the hexokinase-catalyzed step times the duration of the interval, and the net rate of flux of glucose through this step equals the rate of glucose utilization.
These rclationships can be mathematically defined and an operational equation derived if the following assumptions arc madc: ( I ) a steady statc fo; glucose ( i t . constant plasma glucose concentration and con- stant rate of glucose consumption) throughout the period of the procedure; (2) homogcncous tissue com- partment within which the concentrations of [I4C]DG and glucose are uniform and exchange di- rectly with the plasma; and (3) tracer concentrations of [I4C]DG (i.e. molecular concentrations of free [I4C]DG essentially equal to zero). The operational equation which defines Ri, the rate of glucose con- sumption per unit mass of tissues, i. in tcrms of measurable variables is as follows:
Unlikc glucosc-6-phosphatc, howcver. which is meta- bolized furthcr cventually to C 0 2 and water and to ;i lesser degree via the hexosemonophosphate shunt. deoxyglucose-6-phosphate cannot be converted to fruc- tose-6-phosphate and is not a substrate for glucose- 6-phosphate dehydrogenase (SOLS & CRANE, 1954). There is very little glucose-6-phosphatase activity in brain (HI:Ks. 1957) and cvcn less deoxyglu- cosc-6-phosphatase activity (SOKOLOFF ot al., 1977). I)eoxyglucose-6-phosphate, once formed, is, therefore, essentially trappcd in thc cerebral tissues. a t least long enough for the duration of the measurement. The half-lives 'of ['4C]deoxyglucose-6-phosphate in the various cerebral tissues have been experimentally esti- mated; the average half-lives are 7.7 (s.D. = f 1.6) and 9.7 (s.D. = k2.6) h in gray and white matter, respect- ively (SOKOLOFF ct ul.. 1977). The shortest half-life is 6.1 h in the inferior colliculus (SOKOLOFF et a/ . , 1977).
If the intcrval of time is kept short enough. for example. less.than 1 h, to allow the assumption of negligible loss of [ 4C]DG-6-P from the tissues, then the quantity o f [I4C]DG-6-P accumulated in any cer- ebral tissue at any given time following the introduc- tion of ['*C]DG into the circulation is equal to the integral of the rate of L'4C]DG phosphorylation by hexokinase in that tissue during that interval of time. This intcgral is in turn related to the amount of glu- cose that has k e n phosphorylated over the same in- terval, depending on the time courses of the relative Concentrations of ['"CIDG and glucose in the pre- cursor pools and the Michaelis Menten kinetic con- stants for hexokinase with respect to both [I4C]DG and glucose. With cerebral glucose consumption in :I steady state. the amount of glucose phosphorylated
where C: ( T ) equals the combined concentrations of [I4C]DG and [14C]DG-6-P in the tissue, i, at time. ?; determined by quantitative autoradiography ; C*, and C p equal the arterial plasma concentrations of [I4C]DG and glucose. respectively; k : . k**. and k*, are the rate constants for the transport from the plasma to the tissue precursor pool. for the transport back from tissue to plasma, and for the phosphoryla- tion of free [I4C]DG in the tissue, respectively; I equals the ratio of the distribution volume of ['4C]DG in the tissue to that of glucose; 4 equals the fraction of glucose which once phosphorylated continues down the glycolytic pathway; and K*, and V*,,, and K,,, and V,,, are the familiar Michaelis- Menten kinetic constants of hexokinase for ['4C]DG and glucose, respectively.
The rate constants are determined in a separate group of animals by a non-linear, iterative process which provides thc least squares best-fit of an equa- tion which defines the time course of total tissue I4C concentration in terms of the time, the history of the plasma Concentration. and the rate constants to the experimentally determined time courses of tissue and plasma concentrations of 14C (SOKOLOFF ri a/., 1977). The rate constants have thus far been determined only in normal conscious albino rats; the valucs obtaincd for k: , k : , and k j and their standard errors are 0.189 0.012, 0.245 f 0.040, and 0.052 0.010 per min in gray matter and 0.079 + 0.008. 0.133 k 0.046, and 0.020 + 0.020 per min in white matter. respectively (SOKOLOFF er ul., 1977). Prelimi- nary estimates indicate that the values are quite simi- lar in the conscious monkey (Kennedy, Sakurada, Shinohara. & Sokoloff, unpublished observations).
Function and energy metabolism in CNS 15
The 2, 4, and the enzyme kinetic constants are grouped together to constitute a single. lumped con- stant (see equation). I t can be shown mathematically that this lumped constant is equal to the asymptotic value of the product of the ratio of the cerebral extraction ratios of [‘4C]DG and glucose and the ratio of the arterial blood to plasma specific activities when the arterial plasma [I4C]DG concentrations is maintained constant. The lumped constant is also determined in a separate group of animals from arter- ial and cerebral venous blood samples drawn during a programmed intravenous infusion which produces and maintains a constant arterial plasma [I4C]DG concentration (SOKOLOFF et al., 1977). Thus far it has been determined only in the albino rat and the mon- key. Values are 0.483 (s.E.M. = k0.022) in the rat (SOKOLOFF el a/., 1977) and 0.344 (s.E.M. = k0.036) in the monkey (Kennedy, Sakurada, Shinohara & Sokoloff. unpublished observations). The lumped con- stant appears to be characteristic of the species and does not appear to change significantly in a wide range of conditions (SOKOLOFF er al.. 1977).
Despite its complex appearance, equation ( 1 ) is really nothing more than a general statement of the standard relationship by which rates of enzyme-cata- lyzed reactions are determined from measurements made with radioactive tracers. The numerator of the equation represents the amount of radioactive product formed in a given interval of time; i t is equal to C:, the combined concentrations of [I4C]DG and [“%2]DG-6-P in the tissue at time, 7; measured by the quantitative autoradiographic technique, less a term that represents the free unmetabolized [14C]DG still remaining in the tissue. The denominator r e p resents the integrated specific activity of the precursor pool times a factor, the lumped constant, which is equivalent to a correction factor for an isotope effect. The term with the exponential factor in the denomi- nator takes into account the lag in the equilibration of the tissue precursor pool with the plasma.
Procedure
Because local rates of cerebral glucose utilization are calculated by means of equation ( I ) , this equation dictates the variables to be measured. The specific procedure employed is designed to evaluate these variables and to minimize potential errors that might occur in the actual application of the method. If the rate constants, k : , k*2. and k:, are precisely known, then equation ( 1 ) is gcnerally applicable with any mode of administration of [“ClDG and for a wide range of time intervals. At the present time the rate constants have been determined only in the conscious rat. These rate constants can be expected to vary with the condition of the animal, however, and for most accurate results should be re-determined for each con- dition studied. The structure of equation ( I ) suggests a more practicable alternative. All the terms in the equation that contain the rate constants approach zero with increasing time if the [I4C]DG is so admin-
istered that the plasma [I4C]DG concentration also approaches zero. From the values of the rate con- stants determined in normal animals and the usual time course of the clearance of [14C]DG from the arterial plasma following a single intravenous pulse a t zero time. an interval of 3 W 5 min is adequate for these terms to become sufficiently small that con- siderable latitude in inaccuracies of the rate constants is permissible without appreciably increased error in the estimates of local glucose consumption (SOKOLOFF et a/., 1977). An additional advantage derived from the use of a single pulse of [14C]DG followed by a relatively long interval before killing the animal for measurement of local tissue I4C Concentration is that by then most of the free [‘4C]DG in the tissues has been either converted to [I4C]DG-6-P or transported back to the plasma; the optical densities in the auto- radiographs then represent mainly thc concentrations of [ ”CIDG-6-P and, therefore. reflect directly the relative ratcs of glucose utilization in the various cere- bral tissues.
The experimental procedure is to inject a pulse of [I4C]DG intravenously at zero time and to decapi- tate the animal at a measured time, 7; 3&45 min later; in the interval timed arterial samples are taken for the measurement of plasma [’ 4C]DG and glucose concentrations. Tissue I4C concentrations, Cy. are measurcd at time, 7: by the quantitative autoradio- graphic technique. Local cerebral glucose utilization is calculated by equation ( I ) (SOKOLOFE et al., 1977).
RATES OF LOCAL CEREBRAL GLUCOSE UTILIZATION IN THE NORMAL
CONSCIOUS RAT
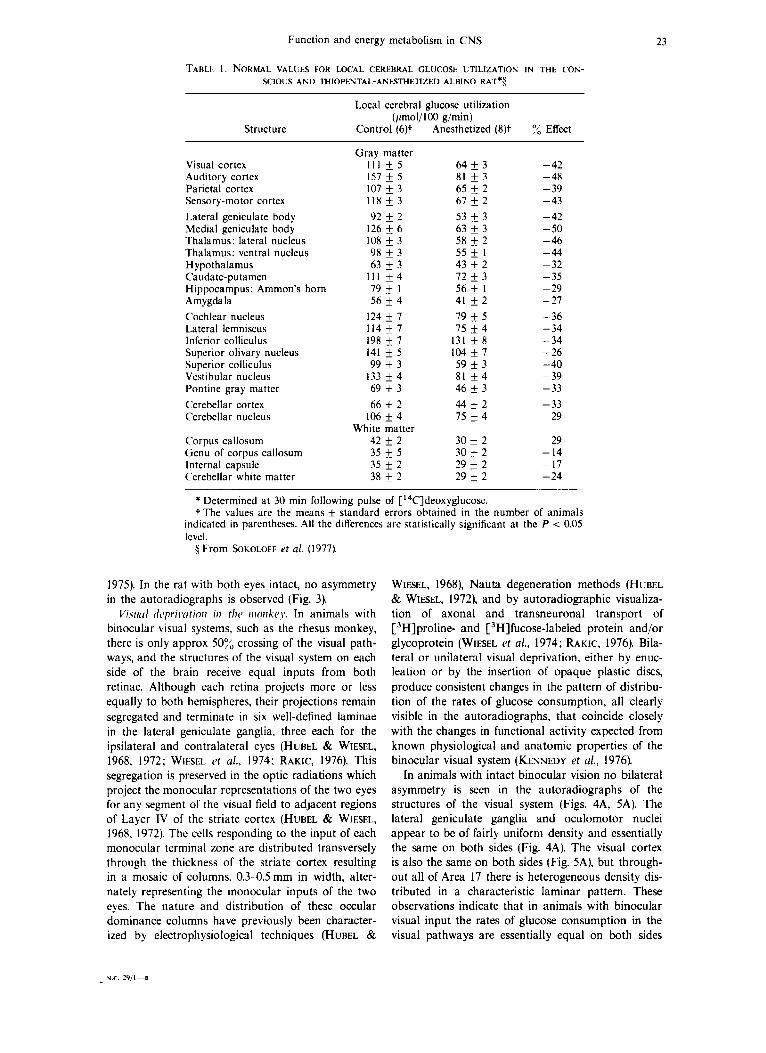
Thus far quantitative measurements of local cere- bral glucose utilization have been completed only in the albino rat. These values are presented in Table 1 . The ratcs of local cerebral glucose utilization in the normal conscious rat vary widely throughout the brain. The values in whiie structures tend to group together and are always considerably below those of gray structures. The average value in gray matter is approx 3 times that of white matter, but the indivi- dual values vary from approx 50 to 200 pmol of glu- cose/l00 g/min. The highest values are in the struc- turcs involved in auditory functions with the inferior colliculus clearly the most metabolically active struc- ture in the brain.
Quantitative determinations of local cerebral glu- cose utilization in the normal conscious monkey are currently being carried out in this laboratory, and the values should be available soon. The results thus far indicate similar heterogeneity in the monkey brain. but the values are considerably lower. approxi- mately one-third to one-half those in the rat, probably because of the lower cellular packing density and greater amounts of white matter (Kennedy, Sakurada, Shinohara & SokoloK, unpublished observations).
16 LOUIS SOK~LOFF
EI;wcrs OF G E N E R A L ANESTHESIA
In the albino rat thiopental anesthesia reduces the rates of glucose utilization in all structures of the brain (Table I) . The erects are not uniform; the per- cent effects in white matter are relatively small com- pared to those in most gray structures. Anesthesia also markedly reduces the .heterogeneity normally present within gray matter. an erect clearly visible in the autoradiographs (SOKOLOFF er ul., 1977). These results are in agreement with those of previous studies in which anesthesia has k e n found to decrease the cerebral metabolic rate of the brain as a whole ( K i x Y .
Preliminnry studies indicate that thiopental anes- thesia has eflects in the rhesus monkey like those in the rat (S t iAPi t to er (11.. 1975). The erects of halothane anesthesia in the monkey are similar, except that it appears to leave the basal ganglia unarected (SHAPIRO rt d., 1975). In contrast, phencyclidine, which is often used as an anesthetic agent but is probably a convul- sant. causes lO-SOn(, incrrases in glucose consumption in all gray structures. except the inferior colliculus, pontine nuclei. and cercbellar cortex where significant decreases are observed (SHAPIRO rr ol., 1975).
1950; LASSliS. 1959; f h K O L O F F , 1976).
RELATIOS BETWEEN LOCAL FUNCTIONAL ACTIVITY A N D ENERGY METABOLISM
The results of a variety of applications of the method demonstrate a clear relationship bctween local cerebral functional activity and glucose con- sumption. The most striking demonstrations of the close coupling between function and energy metabo- lism are seen with experimentally induced local alter- ations in functional activity that are restricted to a few specific areas in the brain. The effects on local glucose consumption are then so pronounced that they are not only observed in the quantitative results but can be visualized directly on the autoradiographs which are really pictorial representations of the rela- tive rates of glucose utilization in the various struc- tural components of the brain.
Eflrcts oJ iwrcwsed firrrriorlal uctioity Ejfects of’ sciufic wrce srinrularion. Electrical stimu-
lation of one sciatic nerve in the rat under barbiturate anesthesia causes pronounced increases in glucose consumption (1.e. increased optical density in the autoradiographs) in the ipsilateral dorsal horn of the lumbar spinal cord ( K t c N s E r w c’f o/., 1975).
Ejji>crs oj’o/jLwtory .srinru/ufiou. The [ I 4C]deoxyglu- COX method has been used to map the olfactory sys- tem of the rat (SHARP cf d, 1975). Olfactory stimu- lation with amyl acetate has been found to produce increased labeling in localized regions of the olfactory bulb. Preliminary results obtained with other odors, such as camphor and cheese, suggest different spatial patterns of increased metabolic activity with different odors.
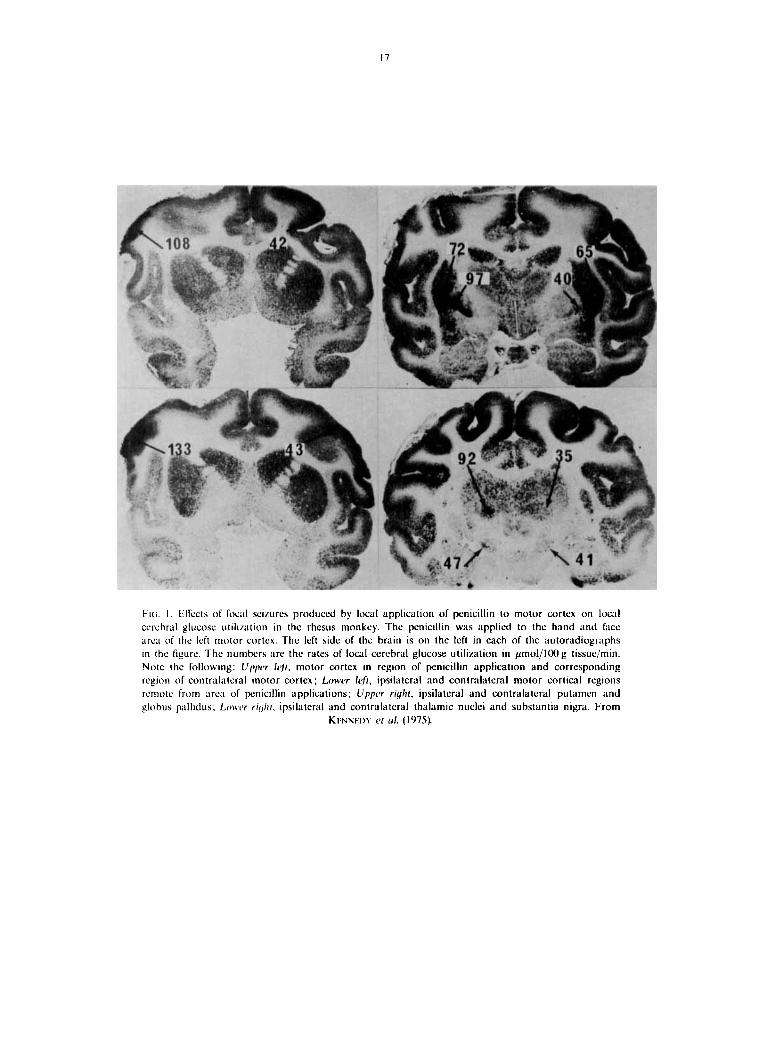
EfJects of’ e.xperinrrrifu1 focal seizures. The local in- jection of penicillin into the hand-face a r a of the motor cortex of the rhesus monkey has been shown to induce electrical discharges in the adjacent cortex and to result in recurrent focal seizures involving the face, arm. and hand on the contralateral side (CAVE- NESS, 1969). Such scizure activity causes selective in- creases in glucose consumption in areas of motor cor- tex adjacent to the penicillin locus and in small dis- crete regions of the putamen, globus pallidus, caudate nucleus, thalamus, and substantia nigra of the same side (Fig. 1 ) (KENSEDY rt a/., 1975). Similar studies in the rat have led to comparable results and pro- vided evidence on the basis of an evoked metabolic response of a ‘mirror’ focus in the motor cortex con- tralateral to the penicillin-induced epileptogenic focus (COLLISS rt ul., 1976).
Efiect.9 of decreased juricriorral actioitg
Decrements in functional activity result in reduced rates of glucose utilization. These effects are particu- larly striking in the auditory and visual systems of the rat and the visual system of the monkey.
Cfects qf’ uuditory drprication. In the albino rat some of the highest rates of local cerebral glucose utilization are found in components of the auditory system, i.e. auditory cortex, medial geniculate gang- lion, inferior colliculus, lateral Iemniscus. superior olive. and cochlear nucleus (Table I ) . The high meta- bolic activities of some of these structures are clearly visible in the autoradiographs (Fig. 2) . Bilateral audi- tory deprivation by occlusion of both external audi- tory canals with wax markedly depresses the meta- bolic activity in all of these areas (Fig. 2) (Des Rosiers. Kennedy & Sokoloff, unpublished observations). The reductions are symmetrical bilaterally and range from 35 to 607:. Unilateral auditory deprivation also dcpresscs the glucose consumption of these structures but to a lesser degree, and some of the structures are asymmetrically affected. For example, the mcta- bolic activity of the ipsilateral cochlear nucleus equals 75% of the activity of the contralateral nucleus. The lateral lemniscus, superior olive, and medial genicu- late ganglion arc slightly lower on the contralateral side while the contralateral inferior colliculus is mark- edly lower in metabolic activity than the ipsilateral structure (Fig. 2). These results demonstrate that there is some degree of lateralization and crossing of audi- tory pathways in the rat.
V i s u l deprivatiorr iri the rot. In the rat, the visual system is 80 -SSO,/, crossed at the optic chiasma (LASHMY, 1934; MONTERO 8~ Gw.r,mY. 1968). and unilateral enucleation removes most of the visual in- put to the central visual structures of the contralateral side. In the conscious rat studied 24 h after unilateral enucleation, there arc marked decrements in glucose utilization in the contralateral superior colliculus, lateral geniculate ganglion, and visual cortex as com- pared to the ipsilateral side (Fig. 3) (KENNEDY et al..
17
Fit;. I . Elkcts o f fixnl seirures produced by local application o f penicillin to motor cortex on loci1 cerchriil glucosc utilimtion in the rhesus monkey. The penicillin was applied to the hand and face iirc:~ of thc left motor cortex. The left side of the brain is on the left in each of the autoradiogr;iphs in thc figure. The numbers iire the rates of local cerebral glucose utilization in pmol/loOg tissue/min. Note the following: U p p w k f t . motor cortex in region of penicillin application and corresponding region o f contraliitcral motor cortex; Lowrr kji, ipsilateral and contralateral motor cortical regions rcmotc from i i x i of penicillin applications; U p p w right. ipsilateral and contralateral putamen and globus pallidus; L o w r rIqht. ipsilateral and contralateral thalamic nuclei and substantia nigra. From
KI:KNI(I>Y 1’1 ul. (1975).
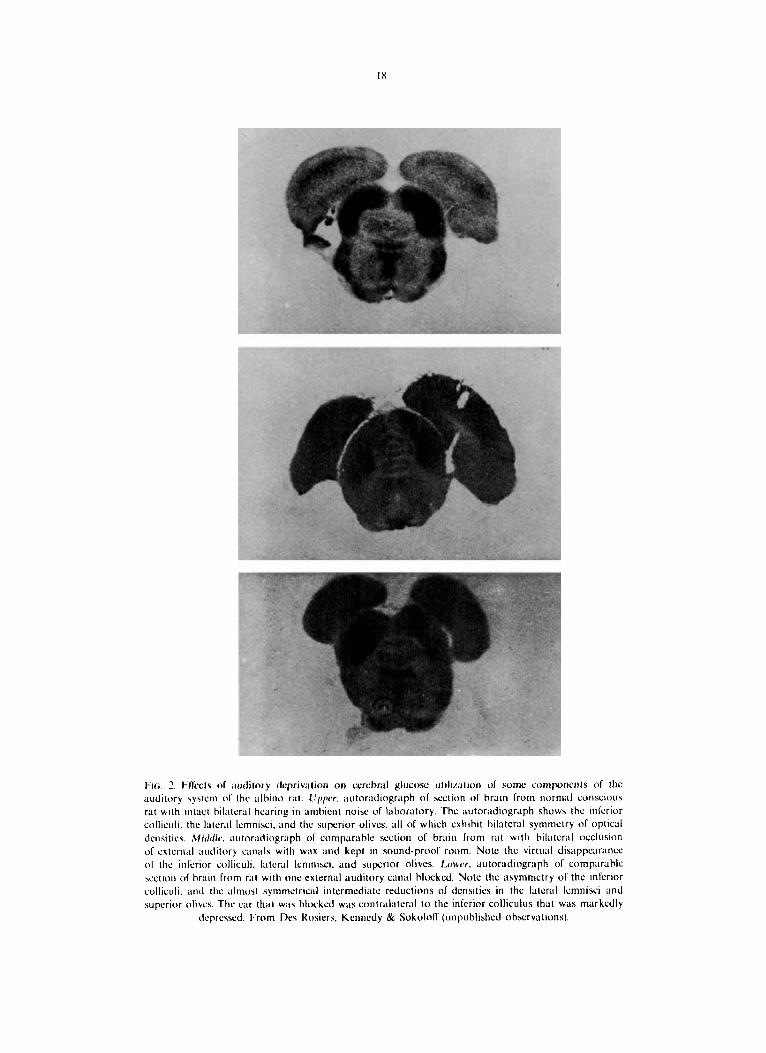
t - ~ ; 2. Flkcts of ;iirditory clepriv;ilion on cerebral gluccrsc u t i l r ~ ~ ~ t r o ~ ~ of some compnciits of 1lic auditory aysfcni o f thc :ilhino r;it. U p / w r , ;tutoradlograph o f section o f hra in froin nornl;il ~ ~ I ~ S C : L ’ I O L I S
rat wi th intact bilatcral hearing i n ambient noise o f laboratory. The autoradiograph shows the inferior colliciil i. the latenil lemnisci. and the superior olives. a11 o f which exhihit bilatcral symmetry o f optical densities. Middle. autoriidiograph of comparable section 01‘ hr;un from iritt with hiliitcriil occlusion u l cxtcriii i l auditory c;iii;ils with wax :tiid kept in sound-proof room. Note the virtual disnppear;incc 0 1 tlit inferior collicuh. lateral Icmliiscl. and supcrior olivcs. Lower. autoradiograph o f COmpilr~lhlC scctioii of hrai i i from riit with oiie exlerniil auditory c;inal hltxkcd. Nolc the asymmetry o f the inferior colliculi. ;uid the alinosl symmetrical intermcdiatc reductions of dcnsitics in the lateral lcmnisci and superior olives. The car that w a s blocked was coritr:tlatcr;~l t o the inferior colliculus that was markedly
clsprcsscd. P’rom Des Kosiers, Kennedy & Sokolon‘ (unpublished observations).
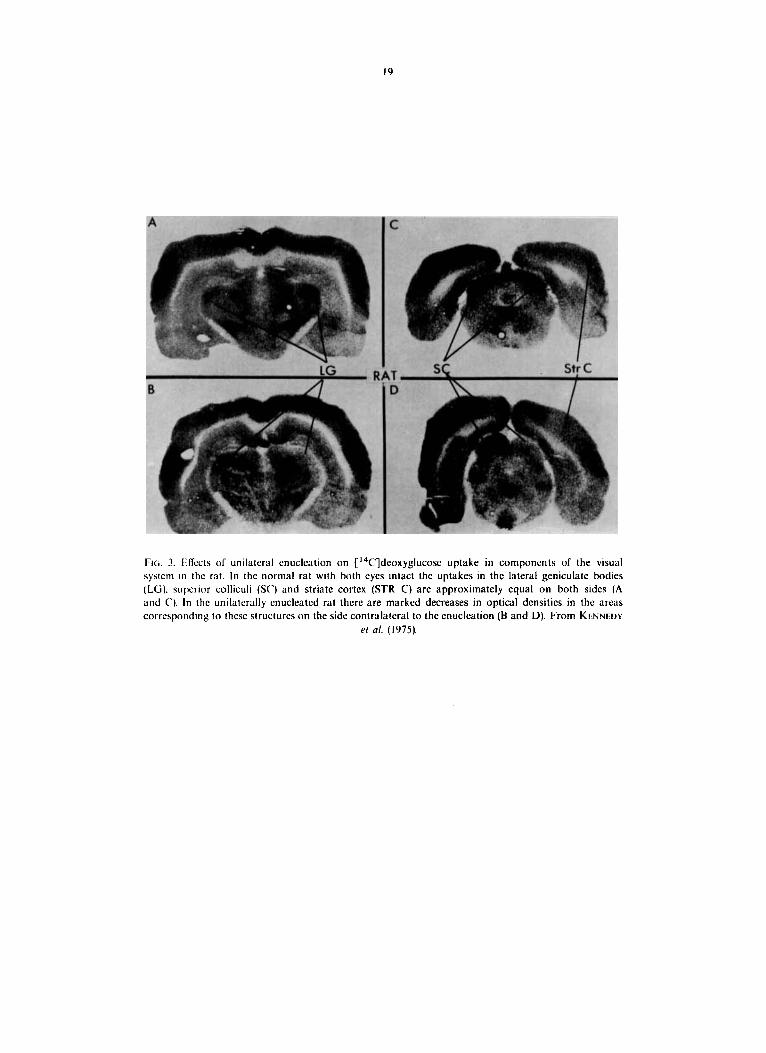
FIG. 3. Etliects of unilateral enuclcation on ['4C]deoxyglucosc uptake in componcnts of the visual system in the rat. In the normal rat with both eyes intact the uptakes in the lateral geniculate bodies (LG). superior colliculi (SC) and striate cortex (STR C) are approximately equal on both sidcs (A and C). In the unilaterally enucleated rat there are marked decreases in optical densities in the areas corresponding to these structures on the side contralateral to the cnucloltion (R and D). From KI:NNIW
ef a/. (1Y75).
20
- 5.0mm
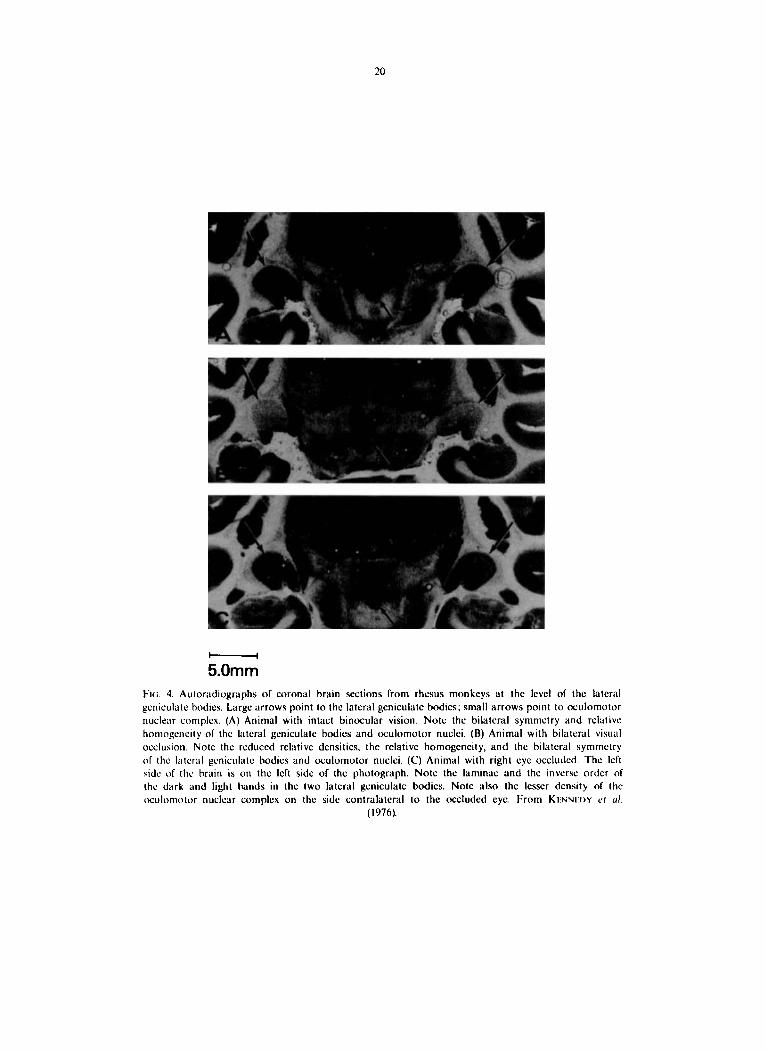
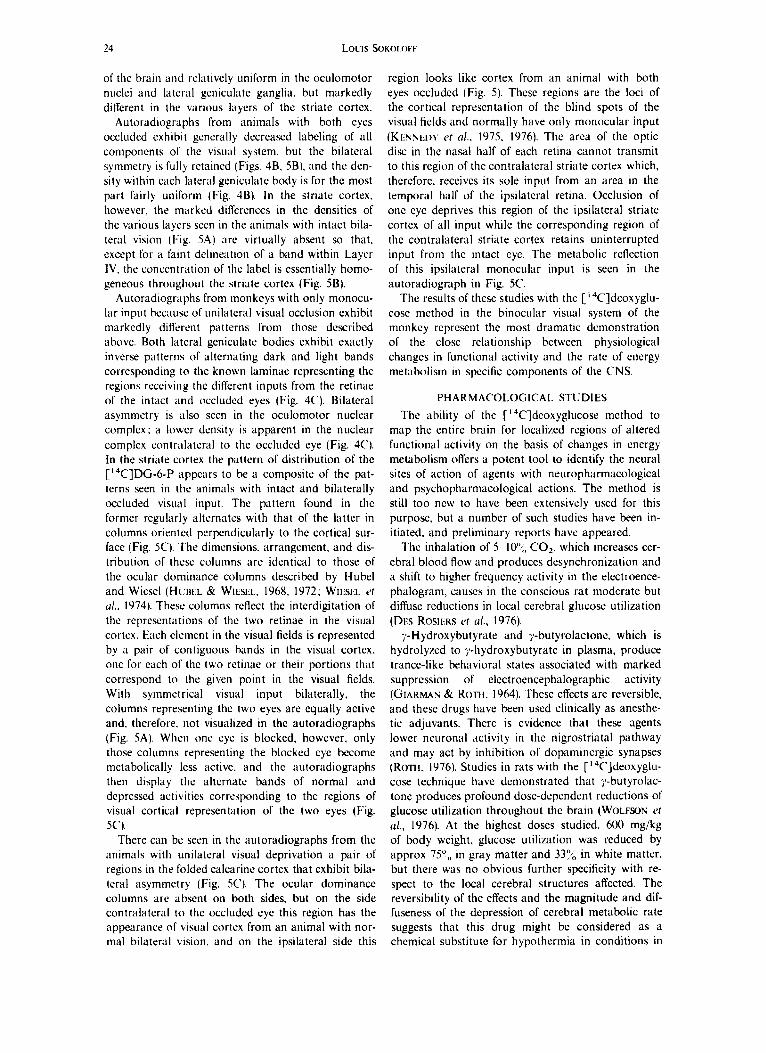
FIG. 4. Autoradiographs of coronal brain sections from rhesus monkeys at the level of the lateral gcniculale bodies. Large arrows point to the laterdl geniculate bodies; small arrows point to oculomotor nuclear complcx. ( A ) Animal with intact binocular vision. Note thc bilateral symmetry and relative homogeneity of thc lateral geniculate bodies and oculomotor nuclei. (R) Animal with bilateral visual occlusion. Note the reduced relative densities, the relative homogeneity, and the bilatcral symmetry of thc I;ltcral gcniculatc bodies and oculomotor nuclei. ( C ) Animal with right eye occludcd. The left side of thc hrain is on the left side of thc photograph. Note thc laminac and the inverse order of the dark and light hands in the two lateral gcniculatc bodies. Note also the lesser density of the oculomotor nuclear complex on the side contralateral to the occluded eye. From KI:NNI:I>Y C’I t i / .
( I 970).
21
t-----l
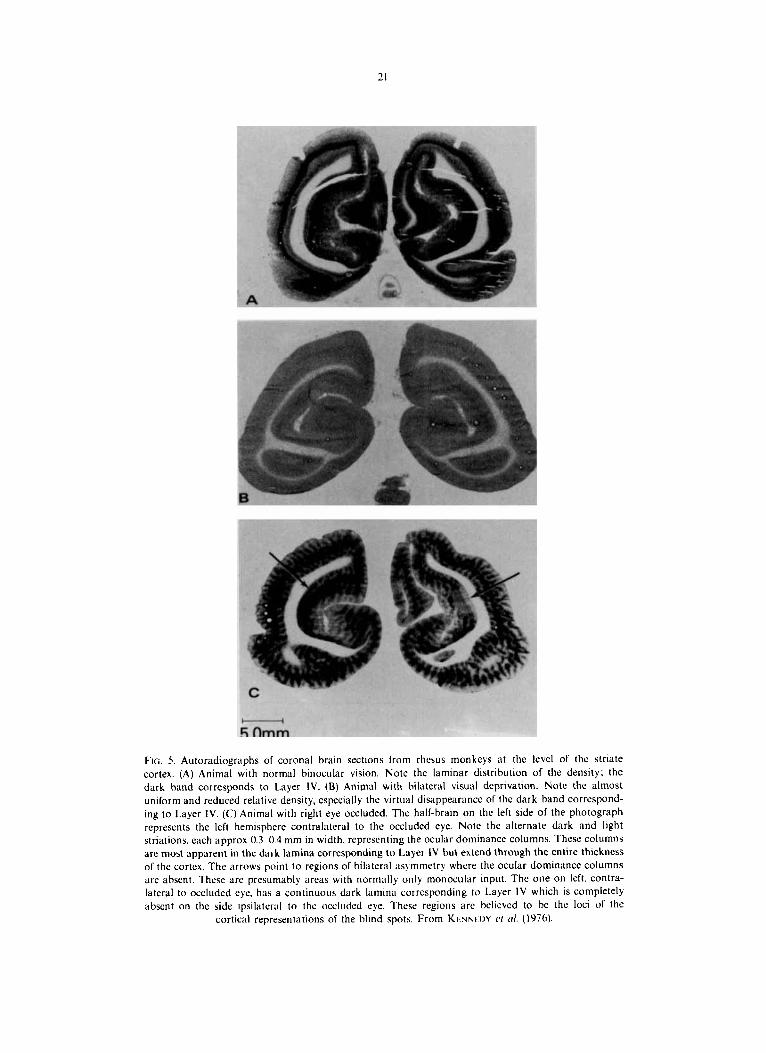
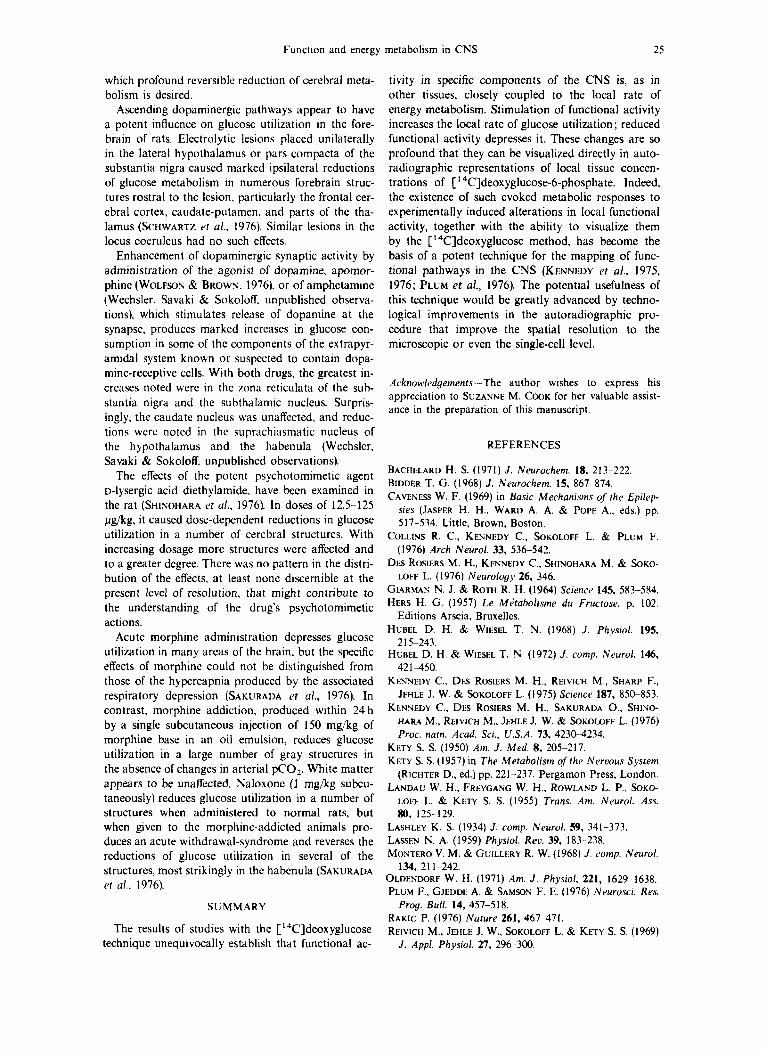
5.0mm FIG. 5. Autoradiographs of coronal brain sections from rhesus monkeys at the level of the striate cortex. (A) Animal with normal binocular vision. Note thc laminar distribution of the density; the dark hand corresponds to Layer IV. (B) Animal with bilateral visual deprivation. Note the almost uniform and reduced relative density, especially the virtual disappearance of the dark hand correspond- ing to I.ayer IV. (C) Animal with right eye occluded. The half-brain on the left side of the photograph represents the left hemisphere contralateral to the occluded eye. Note the alternate dark and light striations. each approx 0.3 0.4 mm in width. representing the ocular dominance columns. These columns are most apparent in the dark lamina corresponding t o Layer IV but extend through the entire thickness of the cortex. The ilrrows point to regions of bilateral asymmetry where the ocular dominance columns are absent. These arc prcsumahly areas with normally only monocular input. The one on left. contra- lateral to occluded eye. has a continuous dark lamina corresponding to Layer IV which is completely absent on the side ipsilateral t o the occliided rye. These regions are believed to be the loci of the
cortical representations of the blind spots. From KENKI.I)Y C’I nI. (1976).
Function and energy metabolism in CNS 23
TABLI: I . NORMAL VALUES FOR LOCAL CEREBRAL GLUCOSE UTILIZATION I N THE CON- SCIOUS A N 0 IHIOPENTAL-ANtSTHETIZEl) ALBINO RAT*$
Local cerebral glucose utilization (pno1/100 g/min)
Structure Control (6)t Anesthetized (8)t Effect
Visual cortex Auditory cortex Parietal cortex Sensory-motor cortex Lateral geniculate body Medial geniculate body Thalamus: lateral nucleus Thalamus: ventral nucleus Hypothalamus Caudate-pu tamen Hippocampus: Ammon’s horn Amygdala Cochlear nucleus Lateral lemniscus Inferior colliculus Superior olivary nucleus Superior colliculus Vestibular nucleus Pontine gray matter Cerebellar cortex Cerebellar nucleus
Corpus callosum Genu o l corpus callosum Internal capsule Cerebellar white matter
Gray matter I l l f 5 157 * 5 107 f 3 118 f 3 92 f 2
126 If: 6 108 f 3 98 f 3 63 f 3
111 * 4 79 * 1 56 f 4
124 f 7 114 f 7 198 f 7 141 f 5 99 f 3
133 f 4 69 f 3 66 f 2
106 f 4 White matter
42 f 2 35 * 5 35 * 2 38 f 2
64 f 3 81 f 3 65 If: 2 67 f 2 53 f 3 63 f 3 58 2 2 55 f 1 43 f 2 72 f 3 5 6 * 1 41 f 2 79 * 5 75 f 4
131 f 8 104 f 7 59 f 3 81 f 4 46 f 3 4 4 f 2 75 * 4
30 f 2 30 2 29 f 2 29 f 2
- 42 - 48 - 39 - 43 - 42 - 50 - 46 -44 - 32 -35 - 29 - 27 -36 - 34 - 34 - 26 - 40 - 39 - 33 - 33 - 29
- 29 - 14 -17 - 24
* Determined at 30 min following pulse of [‘4C]deoxyglucose. tThe values are the means f standard errors obtained in the number of animals
indicated in parentheses. All the diferences are statistically significant at the P < 0.05 level.
$ From SOKOLOFF rt al. (1977).
1975). In the rat with both eyes intact, no asymmetry in the autoradiographs is observed (Fig. 3).
I ~ ’ i s i i t r / d(,priinrioii i i i tho iiioiikoii. In animals with binocular visual systems, such as the rhesus monkey, there is only approx 500/, crossing of the visual path- ways, and the structures of the visual system on each side of the brain receive equal inputs from both retinae. Although each retina projects more or less equally to both hemispheres, their projections remain segregated and terminate in six well-defined laminae in the lateral geniculate ganglia. three each for the ipsilateral and contralateral eyes (HUHEL & WIESEL, 1968, 1972; WIESEL et al., 1974: RAKIC, 1976). This segregation is preserved in the optic radiations which project the monocular representations of the two eyes for any segment of the visual field to adjacent regions of Layer IV of the striate cortex (HUBEL & WIESEL, 1968. 1972). The cclls responding to the input of each monocular terminal zone are distributed transversely through the thickness of the striate cortex resulting in a mosaic of columns. 0.3- 0.5 mm in width, alter- nately representing the monocular inputs of the two eyes. The nature and distribution of these occular dominance columns have previously been chardcter- ized by electrophysiological techniques (HUREL &
WIFSEL, 1968), Nauta degeneration methods (HUBEL & WIESEL, 1972), and by autoradiographic visualiza- tion of axonal and transneuronal transport of C3H]proline- and [3H]fucose-labeled protein and/or glycoprotein (WIESEL et a/., 1974; RAKIC. 1976). Bila- teral or unilateral visual deprivation. either by enuc- leation or by the insertion of opaque plastic discs, produce consistent changes in the pattern of distribu- tion of the rates of glucose consumption, all clearly visible in the autoradiographs, that coincide closely with the changes in functional activity expected from known physiological and anatomic properties of the binocular visual system (Kt?;NmY er a[., 1976).
In animals with intact binocular vision no bilateral asymmetry is Seen in the autoradiographs of the structures of the visual system (Figs. 4A, 5A). The lateral geniculate ganglia and oculomotor nuclei appear to be of fairly uniform density and essentially the same on both sides (Fig. 4A). The visual cortex is also the Same on both sides (Fig. 5A). but through- out all of Area 17 there is heterogeneous density dis- tributed in a characteristic laminar pattern. These observations indicate that in animals with binocular visual input the rates of glucose consumption in the visual pathways are essentially equal on both sides
u.c. 2Yil--s
24 LOUIS SOKOI.OIF
of the brain and relatively uniform in the oculomotor nuclei and lateral geniculate ganglia. but markedly different in the various hyers of the striate cortcx.
Autoradiographs from nnimals with both eyes occluded exhibit generally dccreascd labeling of all components 0 1 the visual system, but the bilateral symmetry is fully retained (Figs. 4B. SB), and the den- sity within each lateral geniculatc body is for the most part fairly uniform (Fig. 4B). In the striate cortex. however, the miirked differences in the densities of the various layers seen in the animals with intact bila- teral vision (Fig. 5A) are virtually absent so that. except for a faint delineation of ;I band within Layer 1V. the concentration of thc label is essentially homo- geneous throughout the striate cortex (Fig. 5B).
Autoradiographs from monkeys with only monocu- lar input hccuusc of unilateral visual occlusion exhibit markedly ditTerent patterns from those described above. Both lateral geniculate bodies exhibit exactly inverse patterns of alternating dark and light bands corresponding to the known laminae representing the regions receiving thc different inputs from the retinae of the intact and occluded eyes (Fig. 4C). Bilateral asymmetry is also seen in the oculomotor nuclear complex; a lower density is apparent in the nuclear complex contralateral to the occluded eye (Fig. 4C). In the striate cortex the pattern of distribution of the CL4C]DG-6-P appcars to be a composite of the pat- terns seen i n the animals with intact and bilaterally occluded visual input. The pattern found in the former regularly alternates with that of the latter in columns oriented perpendicularly to the cortical sur- face (Fig. 5C). The dimensions. arrangement. and dis- tribution of thcsc columns arc identical to those of the ocular dominance columns described by Hubel and Wiescl (HL‘HEL & WIESLL. 1968, 1972; Wiiniii. er d.. 1974). These columns reflect the interdigitation of the representations of the two retinae in the visual cortex. Each element in the visual fields is represented by a pair of contiguous bands in the visual cortex. one for cach of the two retinae or their portions that correspond to the given point in the visual fields. With symmetrical visual input bilaterally, the columns representing the two eyes are equally active and. therefore, not visualized in the autoradiographs (Fig. 5A). When one cyc is blocked. however, only those columns representing the blocked eye become metabolically less active. and the autoradiographs then display the alternatc bands of normal and depressed activities corresponding to the regions of visual cortical representation or the two eyes (Fig. 5 C ) .
There can be seen in the autoradiographs from thc animals with unilateral visual deprivation a pair of regions in the folded calcarine cortex that exhibit bila- teral asymmetry (Fig. SC). The ocular dominance columns are absent on both sides, but on the side contralateral t o the occluded eye this region has the appearance of visual cortex from an animal with nor- mal bilateral vision. and on the ipsilateral side this
region looks like cortex from an animal with both eyes occluded (Fig. 5) . These regions are the loci of the cortical representation of the blind spots of the visual fields and normally have only monocular input (KLNSIJLIY t’r a/. . 1975, 1976). The area of the optic disc in the nasal half of each retina cannot transmit to this region of the contralateral striate cortex which, therefore, receives its sole input from an area in the temporal half of the ipsilateral retina. Occlusion of one eye deprives this region of the ipsilateral striate cortex of all input while the corresponding region of the contralateral striate cortex retains uninterrupted input from the intact eye. The metabolic rellection of this ipsilnteral monocular input is seen in the autoradiograph in Fig. 5C.
The results of these studies with the [“C]deoxyglu- cose method in the binocular visual system of the monkey represent the most dramatic demonstration of the close relationship between physiological changes in functional activity and the rate of energy metabolism in specific components of the CNS.
PHARMACOLOGICAL STlJDIES
The ability of the [‘4C]deoxyglucose method to map the entire brain for localized regions of altered functional activity on the basis of changes in energy metabolism olfers a potent tool to identify the neural sites of action of agents with neuropharmacological and psychopharmacological actions. The method is still too new to have been extensively used for this purpose. but a number of such studies have been in- itiated. and preliminary reports have appeared.
The inhalation of 5- lo’,,, COz. which increascs cer- ebral blood flow and produces desynchronization and a shift to higher frequcncy activity in the electroence- phalogram, causes in the conscious rat moderate but diffuse reductions in local cerebral glucose utilization (DIS RoSli<:KS c’f u/ . , 1976).
y-Hydroxybutyrate and y-butyrolactone, which is hydrolyzed to y-hydroxybutyrate in plasma. produce trance-like behavioral states associated with marked suppression of electroencephalographic activity (GIAHMAN & Ko-n i . 1964). These effects are reversible. and these drugs have been used clinically as anesthe- tic adjuvants. There is evidence that these agents lower neuronal activity in the nigrostrintal pathway and may act by inhibition of dopaminergic synapses (Roni, 1976). Studies in rats with the [14CJdeoxyglu- cose technique have dcmonstrated that ;>-butyrolac- tone produces profound dose-dopendent reductions of glucose utilization throughout the brain (WOLFSON et ul., 1976). A t the highest doses studied. 600 mg/kg of body weight. glucose utilimtion was reduced by approx 754;) in gray matter and 33:f0 in white matter. but there was no obvious further specificity with re- spect to the local cerebral structures affected. The reversibility of the effects and the magnitude and dif- fuseness of the depression of cerebral metabolic rate suggests that this drug might be considered as a chemical substitute for hypothermia in conditions in
Function and energy metabolism in CNS 25
which profound reversible reduction of cerebral meta- bolism is desired.
Ascending dopaminergic pathways appear to have a potent influence on glucose utilization in the fore- brain of rats. Electrolytic lesions placed unilaterally in the lateral hypothalamus or pars compacta of the substantia nigra caused marked ipsilateral reductions of glucose metabolism in numerous forebrain struc- tures rostra1 to the lesion, particularly the frontal cer- ebral cortex, caudate-putamen, and parts of the tha- lamus (SCHWARTL c'r al., 1976). Similar lesions in the locus coeruleus had no such effects.
Enhancement of dopaminergic synaptic activity by administration of the agonist of dopamine, apomor- phine (WOLFSOS & BROWS, 1976). or of amphetamine (Wechsler. Savaki & Sokoloff. unpublished observa- tions), which stimulates release of dopamine at the synapse, produces marked increases in glucose con- sumption in some of the components of the extrapyr- amidal system known or suspected to contain dopa- mine-receptive cells. With both drugs, the greatest in- creases noted were in the zona rcticulata of the sub- stantia nigra and the subthalamic nucleus. Surpris- ingly. the caudate nucleus was unaffected, and reduc- tions were noted in thc suprachiasmatic nucleus of the hypothalamus and the habenula (Wechsler, Savaki & SokolotT. unpublished observations).
The effects of the potent psychotomimetic agent D-lysergic acid diethylamide, have bccn examined in the rat (SHISOHARA er d., 1976). In doses of 12.5-125 pg/kg. it caused dose-dependent reductions in glucose utilization in a number of cerebral structures. With increasing dosage more structures were affected and to a greater degree. There was no pattern in the distri- bution of the effects. at least none discernible a t the present level of resolution. that might contribute to the understanding of the drug's psychotomimetic actions.
Acute morphine administration depresses glucose utilization in many areas of the brain, but the specific effects of morphine could not be distinguished from those of the hypercapnia produced by the associated respiratory depression (SAKURADA et a/., 1976). In contrast, morphine addiction, produced within 24 h by a single subcutaneous injection of 150 mg/kg of morphine base in an oil emulsion, reduces glucose utilization in a large number of gray structures in the absence of changes in arterial pCOz. White matter appears to be unaffected. Naloxonc (1 mg/kg subcu- taneously) reduces glucose utilization in a number of structures when administered to normal rats, but when given to the morphine-addicted animals pro- duces an acute withdrawal-syndrome and reverses the reductions of glucose utilization in several of the structures, most strikingly in the habenula (SAKURADA cr a/.. 1976).
SUMMARY
The results of studies with the ['*C]deoxyglucose technique unequivocally establish that functional ac-
tivity in specific components of the CNS is, as in other tissues, closely coupled to the local rate of energy metabolism. Stimulation of functional activity increases the local rate of glucose utilization; reduced functional activity depresses it. These changes are so profound that they can be visualized directly in auto- radiographic representations of local tissue concen- trations of [' 4C]de~xyglucose-6-phosphate. Indeed, the existence of such evoked metabolic responses to experimentally induced alterations in local functional activity, together with the ability to visualize them by the [14C]deoxyglucose method, has become the basis of a potent technique for the mapping of func- tional pathways in the CNS (KENNEDY et al., 1975, 1976; PLUM et al., 1976). The potential usefulness of this technique would be greatly advanced by techno- logical improvements in the autoradiographic pro- cedure that improve the spatial resolution to the microscopic or even the single-cell level.
Acknon.ledge,nenfs---The author wishes to express his appreciation to SUZANNE M. COOK for her valuable assist- ance in the preparation of this manuscript.
REFERENCES
BACHELARD H. S. (1971) J . Neurochem. 18. 213-222. BIDDER T. G. (1968) J . Neurochem. 15. 867-874. CAVENESS W. F. (1969) in Basic Mechanisms of the Epilep-
sies (JASPER H. H.. WARD A. A. & POPE A,. eds.) pp. 517-534. Little, Brown, Boston.
COLLINS R. C., KENNEDY C., SOKOLOFF L. & PLUM F. (1976) Arch Neurol. 33, 536-542.
DES ROSIERS M. H., KENNEDY C., SHINOHARA M. & %KO-
LOFF L. (1976) Neurology 26, 346. GIARMAN N. J . & ROTH R. H. (1964) Scienco 145, 583-584. HERS H. G . (1957) Le Mltaholisme du Fructose.. p. 102.
HUBEL D. H. & WIESEL T. N. (1968) J . Physiol. 1%.
HUBEL D. H. & WIESEL T. N. (1972) J . comp. Neurol. 146, 42 1 4 5 0 .
KENNEDY C., DES ROSIERS M. H., REIVICH M., SHARP F., JEHLE J. W. & SOKOLOFF L. (1975) Scietice 187, 85G853.
KENNEDY C., DES ROSIERS M. H., SAKURADA O., SHINO- HARA M., REIVJCH M., JEHLE J. W. & SKOLOFF L. ( I 976) Proc. natn. Acad. Sci., U.S .A. 73. 42304234.
Editions Arxia, Bruxelles.
2 15-243.
K ~ T Y S. S. (1950) Am. J . Med. 8. 205-217. KETY S. S. (1957) in The Mptabolism o f t h ~ Nervous System
(RICHTER D., ed.) pp. 221-237. Pergamon Press, London. LANDAU W. H., FREYGANG W. H.. ROWLAND L. P.. .%KO-
LOFP L. & KETY S. S. (1955) Truns. Am. Neurol. Ass. 80. 125-.129.
LASHLEY K. S. (1934) J . comp. Neurol. 59. 341-373. LASSEN N. A. (1959) Physiol. Rev. 39, 183--238. MONTERO V. M. & GUILLERY R. W. (1968) J . comp. Neurol.
OLDENWRF W. H. (1971) Am. J . Physiol. 221. 1629-1638. PLUM F., GJEDDE A. & SAMSON F. E. (1976) Neurosci. Res.
RAKIC P. (1976) Nature 261, 467-471. REIVICII M., JEHLE J. W., SOKOLOFF L. & KETY S. S. (1969)
134. 21 1-242.
Prog. Bull. 14, 457-5 18.
J . Appl. Physiol. 27. 296-300.
26 LOLIIS SOKOLOFI
R O I I I R. 11. (1976) Plittrttrict,. T h r . 2. 71 XX. S A K ~ ' R A D A 0.. SHINOHARA M.. Kr.riti w. A,, KEKNEIIY
C. & SOKOLOFF L. (1976) Ntwosc i . Absrr. 2 (Part I ) . 613.
F.. V. (1976) Nrrrirrc- 261. 125--127. StiAPino H. M.. G R ~ ~ N R ~ K G J. H.. RHVICH M., SHII'KO I:.,
VAN I l O R S K. & s0~01,oIt L. (1975) in Blood Flow ,itid
Mc~rctholistti it1 /lie Brtritl ( H A R P E R A. M.. JENSETT W. B.. MILLER J. D. & ROWAN J. 0.. eds.) pp. 9.42 9.43. Churchill Livingstone. Edinburgh.
SCHWAHI'% W. J . . SHARP F. R.. GLNU R . H. & EVARTS
SIIAKI' 1'. R. . Ki\t I K J. S. & StlEPHERI) G . M. (1975) Brtriri R ~ s . !%. 596-6(K).
SIiIhOIIARA M.. S A K t KAI )A 0.. JtCt11.I J . & SOKOLOFF L. (1976) X t ~ r t r r i s t ~ i . . 4 b s / r 2 (Part 11. 615.
S o ~ o ~ o I t 1.. ( 1969) in Ps~c~/ioc/i t~niieti / Krsrtrrrh i t i Muti (MANIXI.L A. J . & MAN1)t:LL M. P.. cds.) pp. 2.37 252. Academic Press. New York.
s 0 ~ o 1 . o ~ ~ L. (1976) in Busic h'ritrochrtnisrry (SIECI-L Ci . J . . Ai.nms R . W.. KATZWN R. & AGRANOFF 8. W.. eds.) 2nd cd. pp. 3 X X 413. Little. Brown. Boston.
! k K o i . o w L.. Ri..tvic-ii M.. KISSEI)Y C.. DES ROSIERS M. H.. PATl .AK c. s., Pt:TlIGKEW K. D.. SAKL:RAl)A 0. & SHlhOtlARA M. (1977) J . %'ritroc/7cwi. 28. 897 916.
SOLS A. & CRAUI: R. K. (1954) J . hiol. Cherri. 210. 581. 595. WIESEL T. N. . HlJHtL D. I { . & LAM D. M. K . (1974) Brttirr
WOI.FWN L. I . & BROWS L. (1976) .Vrurosc,i. Ahstr. 2 (Part Res. 19. 273 279.
1). 510.
Atil, SOC. N c l r r o C h e t ~ l . 7. 165. WOl.fX)S L. 1.. S A K L : R A l M 0. & S ) K O L . O F F 1.. (1976) TVfltlS.