Embed Size (px)
Citation preview
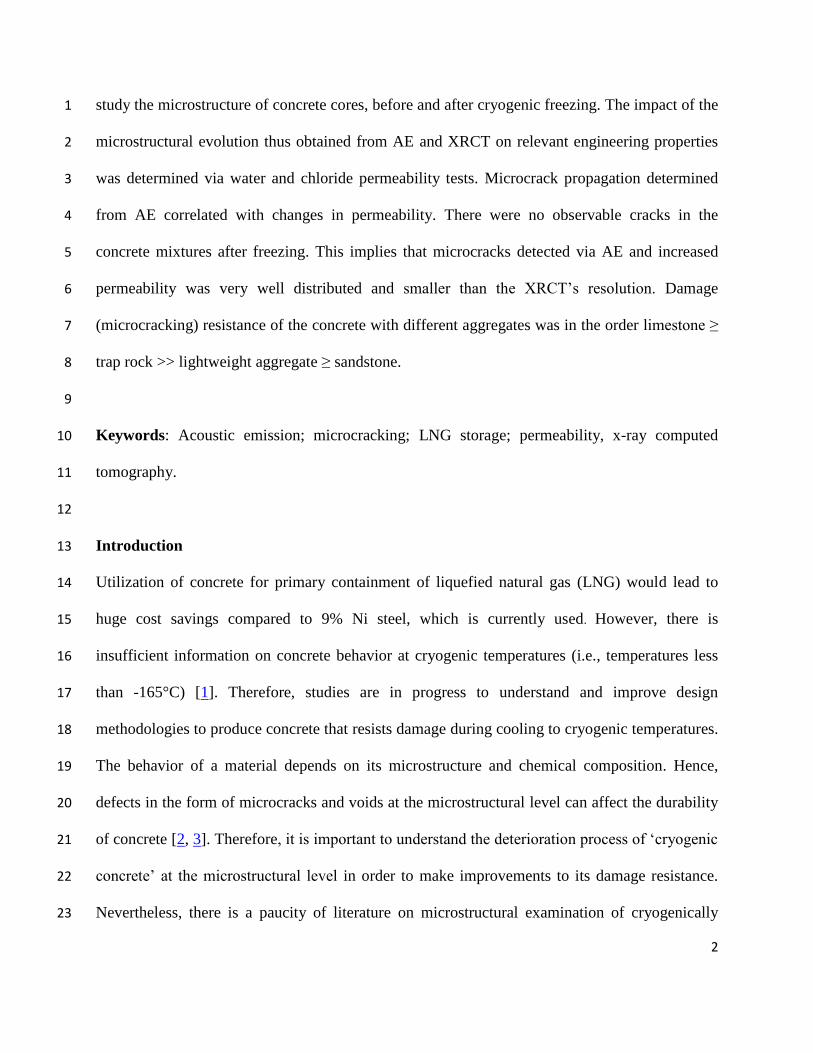
Relating damage evolution of concrete cooled to cryogenic temperatures to permeability
Reginald B. Kogbara1, Srinath R. Iyengar1, Zachary C. Grasley2,3, Syeda Rahman2,
Eyad A. Masad1,2, Dan G. Zollinger2
1Mechanical Engineering Program, Texas A&M University at Qatar,
P.O. Box 23874, Education City, Doha, Qatar.
2Zachry Department of Civil Engineering, Texas A&M University,
College Station, TX 77843, USA.
3The Charles E. Via, Jr. Department of Civil and Environmental Engineering, Virginia
Polytechnic Institute and State University, Blacksburg, VA 24061, USA.
Abstract
Typically, 9% Ni steel is used for primary containment of liquefied natural gas (LNG).
Utilization of concrete in place of 9% Ni steel for primary containment would lead to significant
cost savings. Hence, this study investigates changes in the microstructure of concrete due to
cryogenic freezing that would affect its relevant engineering properties for containment. The
study also evaluates the effect of aggregate type on the damage potential of concrete subjected
to cryogenic freezing. The aim is to investigate design methodologies to produce damage-
resistant cryogenic concrete. The study employed four concrete mixture designs involving river
sand as fine aggregate, and coarse aggregates with different coefficient of thermal expansion
(CTE) values. Specifically, the coarse aggregates were limestone, sandstone, trap rock and
lightweight aggregate. Concrete cubes were cured under water for at least 28 days and thereafter
frozen from ambient (20°C) to cryogenic temperature (-165°C). Acoustic emission (AE) sensors
were placed on the concrete cubes during freezing. X-ray computed tomography (XRCT) was
employed to study the microstructure of concrete cores, before and after cryogenic freezing.
The impact of the microstructural evolution thus obtained from AE and XRCT on relevant
engineering properties was determined via water and chloride permeability tests. Microcrack
propagation determined from AE correlated with changes in permeability. There were no
observable cracks in the concrete mixtures after freezing. This implies that microcracks detected
via AE and increased permeability was very well distributed and smaller than the XRCT’s
resolution. Damage (microcracking) resistance of the concrete with different aggregates was in
the order limestone ≥ trap rock >> lightweight aggregate ≥ sandstone.
This is an author-created version: [email protected] (RB Kogbara). A definitive
version was subsequently published at http://dx.doi.org/10.1016/j.cryogenics.2014.09.001 in
Cryogenics, Volume 64, Pages 21 – 28 (2014). The final publication is available at
www.sciencedirect.com.

1
Relating damage evolution of concrete cooled to cryogenic temperatures to permeability 1
2
Reginald B. Kogbara1, Srinath R. Iyengar1, Zachary C. Grasley2,3, Syeda Rahman2, 3
Eyad A. Masad1,2, Dan G. Zollinger2 4
1Mechanical Engineering Program, Texas A&M University at Qatar, 5
P.O. Box 23874, Education City, Doha, Qatar. 6
2Zachry Department of Civil Engineering, Texas A&M University, 7
College Station, TX 77843, USA. 8
3The Charles E. Via, Jr. Department of Civil and Environmental Engineering, Virginia 9
Polytechnic Institute and State University, Blacksburg, VA 24061, USA. 10
11
Abstract 12
Typically, 9% Ni steel is used for primary containment of liquefied natural gas (LNG). 13
Utilization of concrete in place of 9% Ni steel for primary containment would lead to significant 14
cost savings. Hence, this study investigates changes in the microstructure of concrete due to 15
cryogenic freezing that would affect its relevant engineering properties for containment. The 16
study also evaluates the effect of aggregate type on the damage potential of concrete subjected to 17
cryogenic freezing. The aim is to investigate design methodologies to produce damage-resistant 18
cryogenic concrete. The study employed four concrete mixture designs involving river sand as 19
fine aggregate, and coarse aggregates with different coefficient of thermal expansion (CTE) 20
values. Specifically, the coarse aggregates were limestone, sandstone, trap rock and lightweight 21
aggregate. Concrete cubes were cured under water for at least 28 days and thereafter frozen from 22
ambient (20°C) to cryogenic temperature (-165°C). Acoustic emission (AE) sensors were placed 23
on the concrete cubes during freezing. X-ray computed tomography (XRCT) was employed to 24
Corresponding author email: [email protected]. Tel: +974 4423 0289.
2
study the microstructure of concrete cores, before and after cryogenic freezing. The impact of the 1
microstructural evolution thus obtained from AE and XRCT on relevant engineering properties 2
was determined via water and chloride permeability tests. Microcrack propagation determined 3
from AE correlated with changes in permeability. There were no observable cracks in the 4
concrete mixtures after freezing. This implies that microcracks detected via AE and increased 5
permeability was very well distributed and smaller than the XRCT’s resolution. Damage 6
(microcracking) resistance of the concrete with different aggregates was in the order limestone ≥ 7
trap rock >> lightweight aggregate ≥ sandstone. 8
9
Keywords: Acoustic emission; microcracking; LNG storage; permeability, x-ray computed 10
tomography. 11
12
Introduction 13
Utilization of concrete for primary containment of liquefied natural gas (LNG) would lead to 14
huge cost savings compared to 9% Ni steel, which is currently used. However, there is 15
insufficient information on concrete behavior at cryogenic temperatures (i.e., temperatures less 16
than -165°C) [1]. Therefore, studies are in progress to understand and improve design 17
methodologies to produce concrete that resists damage during cooling to cryogenic temperatures. 18
The behavior of a material depends on its microstructure and chemical composition. Hence, 19
defects in the form of microcracks and voids at the microstructural level can affect the durability 20
of concrete [2, 3]. Therefore, it is important to understand the deterioration process of ‘cryogenic 21
concrete’ at the microstructural level in order to make improvements to its damage resistance. 22
Nevertheless, there is a paucity of literature on microstructural examination of cryogenically 23

3
frozen concrete due to the challenges involved, especially with regard to handling and equipment 1
operation. 2
3
The basic form of concrete deterioration and damage when cooled from ambient to cryogenic 4
temperatures, as can occur during filling of a concrete tank with LNG, is internal cracking. As 5
the concrete is cooled, water in the free state within the larger pores changes into ice, 6
accompanied by volumetric increase, thus expanding the recess in which freezing occurs [4] by 7
pressurizing the unfrozen pore fluid (within the smaller pores). When the tensile stress generated 8
in the solid skeleton surrounding the expanding pore network exceeds the tensile strength of 9
concrete, the material cracks [1, 5, 6]. Furthermore, volume changes associated with 10
transformation of water to ice may cause deterioration either of the hardened paste or of the 11
aggregate, or both. Cracks may occur at the aggregate-paste interface, through aggregates, and 12
through the paste [7, 8]. 13
14
The cooling rate greatly influences the extent of cracking in concrete; this is why LNG tanks are 15
cooled very slowly, typically at the rate of 1°C per hour [9]. Moreover, freeze-thaw cycling 16
increases the amount and interconnection of internal microcracks and cracks, which further 17
accelerates concrete deterioration1. This manifests in increase in the permeability of water, gas 18
and chloride ions as well as reduction in the overall strength and stiffness of concrete [7]. With 19
respect to the durability of concrete, permeability seems to be an adequate measure of (or proxy 20
1Freeze-thaw cycling is typically not much of a problem for all-concrete LNG tanks since the primary
containment tank never undergoes full freezing-and-thawing cryogenic cycles. LNG storage tank systems
are in continuous operation such that the tank never goes empty once filled with LNG. The only exception
is the case of continuous filling and emptying of a tank at a receiving terminal [1, 5].

4
for) its microstructural properties such as the size, distribution, and interconnection of pores and 1
microcracks [2]. 2
3
Several studies have investigated the effects of elevated temperatures on the microstructure of 4
concrete and its influence on concrete behavior [10-12]. However, there are very few similar 5
studies for cement or concrete exposed to freezing temperatures, and such studies for cryogenic 6
temperatures are rare in the literature. Most of such studies for freezing temperatures used 7
scanning electron microscopy (SEM) for microstructural examination. Skripkiunas et al [13] 8
reported that 56 cycles of freezing-thawing (between 20°C and -20°C) of concrete exposed to 9
deicing salt caused an increase in the micro-cracks and cavities in the surface layer of hardened 10
cement paste. Similarly, freeze-thaw tests between the afore-stated temperature ranges showed 11
that there are two main groups of microstructural damage caused by freeze-thaw action [6]; these 12
are de-bonding at the interfacial transition zone between coarse aggregate/paste and 13
microcracking. After 56 cycles, microcracks appeared more frequently in the paste than along 14
the aggregate/paste interface and less frequently across the coarse aggregate. Cracks spread 15
perpendicularly outward from the aggregate surface, across the aggregate/paste interface, and 16
into the paste [6]. The study showed that the choice of aggregate significantly affects the freeze-17
thaw resistance of concrete. Furthermore, examination of the internal microstructure of non-air-18
entrained mortars subjected to 35 freeze-thaw cycles between -25°C and 25°C using x-ray 19
computing tomography (XRCT) also showed that most of the cracks meander around the 20
aggregates. This suggests that the cracks attempt to follow the weaker interfacial transition zone 21
between the sand and the cement paste in the frost-induced damage mortars [14]. 22
23

5
The creation of cracks in concrete results in a release of mechanical energy, which can propagate 1
throughout the material and be recorded by appropriate acoustic emission (AE) sensors [15]. AE 2
is a well-established, non-destructive technique for the detection of damage in concrete 3
structures [16]. The method entails generation of transient elastic waves by rapid release of 4
energy from localized sources within a material [17]. Temperature gradients during cryogenic 5
freezing of concrete generate stresses in the material due to differential thermal expansion [1]. 6
Upon cracking, the strain energy of the stressed material is mostly converted to surface energy 7
and some to wave energy that flows through the material, eventually reaching a surface where 8
some is reflected but much is released into the surroundings (i.e., the air) making a “sound”. The 9
sound made is the source of AE in this context. The majority of AE studies have focused on 10
damage detection in concrete due to high loading before rupture. However, very few studies [18-11
20] have investigated microcracks with AE. This is probably because microcracks are generated 12
during lower level loading, which does not lead to much AE activity [15]. Moreover, there is a 13
dearth of literature on AE studies of cryogenic concrete. 14
15
In light of the above, this study sought to improve our understanding of microcracking in 16
concrete induced by thermal stresses during cryogenic freezing. It integrates information from 17
our recent conference paper [21] on AE and water permeability studies on cryogenic concrete. 18
Consequently, this study aims to relate, for the first time, changes in the internal microstructure 19
of concrete to freezing-induced microcracking as determined from AE. The study correlates 20
observed changes in microstructure and microcracking detected in AE tests with water and 21
chloride permeability tests. The objective was to investigate the effect of type of aggregate on the 22
ability of concrete to resist damage during cryogenic freezing. 23
6
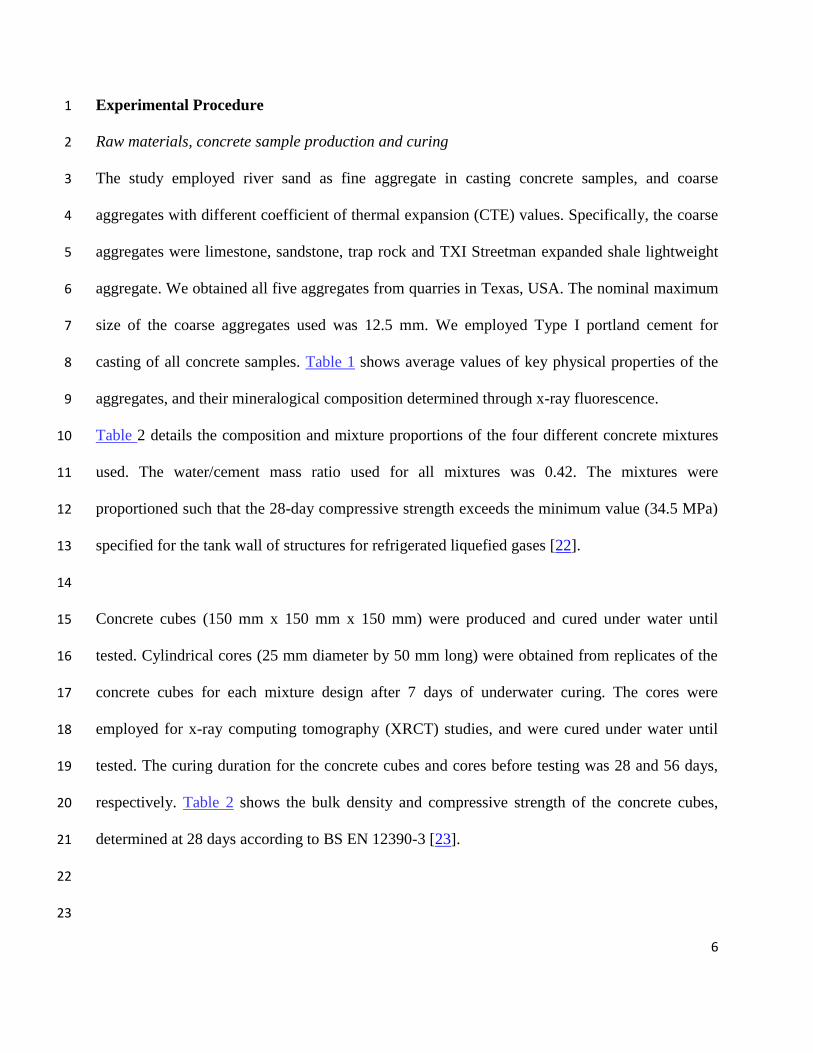
Experimental Procedure 1
Raw materials, concrete sample production and curing 2
The study employed river sand as fine aggregate in casting concrete samples, and coarse 3
aggregates with different coefficient of thermal expansion (CTE) values. Specifically, the coarse 4
aggregates were limestone, sandstone, trap rock and TXI Streetman expanded shale lightweight 5
aggregate. We obtained all five aggregates from quarries in Texas, USA. The nominal maximum 6
size of the coarse aggregates used was 12.5 mm. We employed Type I portland cement for 7
casting of all concrete samples. Table 1 shows average values of key physical properties of the 8
aggregates, and their mineralogical composition determined through x-ray fluorescence. 9
Table 2 details the composition and mixture proportions of the four different concrete mixtures 10
used. The water/cement mass ratio used for all mixtures was 0.42. The mixtures were 11
proportioned such that the 28-day compressive strength exceeds the minimum value (34.5 MPa) 12
specified for the tank wall of structures for refrigerated liquefied gases [22]. 13
14
Concrete cubes (150 mm x 150 mm x 150 mm) were produced and cured under water until 15
tested. Cylindrical cores (25 mm diameter by 50 mm long) were obtained from replicates of the 16
concrete cubes for each mixture design after 7 days of underwater curing. The cores were 17
employed for x-ray computing tomography (XRCT) studies, and were cured under water until 18
tested. The curing duration for the concrete cubes and cores before testing was 28 and 56 days, 19
respectively. Table 2 shows the bulk density and compressive strength of the concrete cubes, 20
determined at 28 days according to BS EN 12390-3 [23]. 21
22
23
7
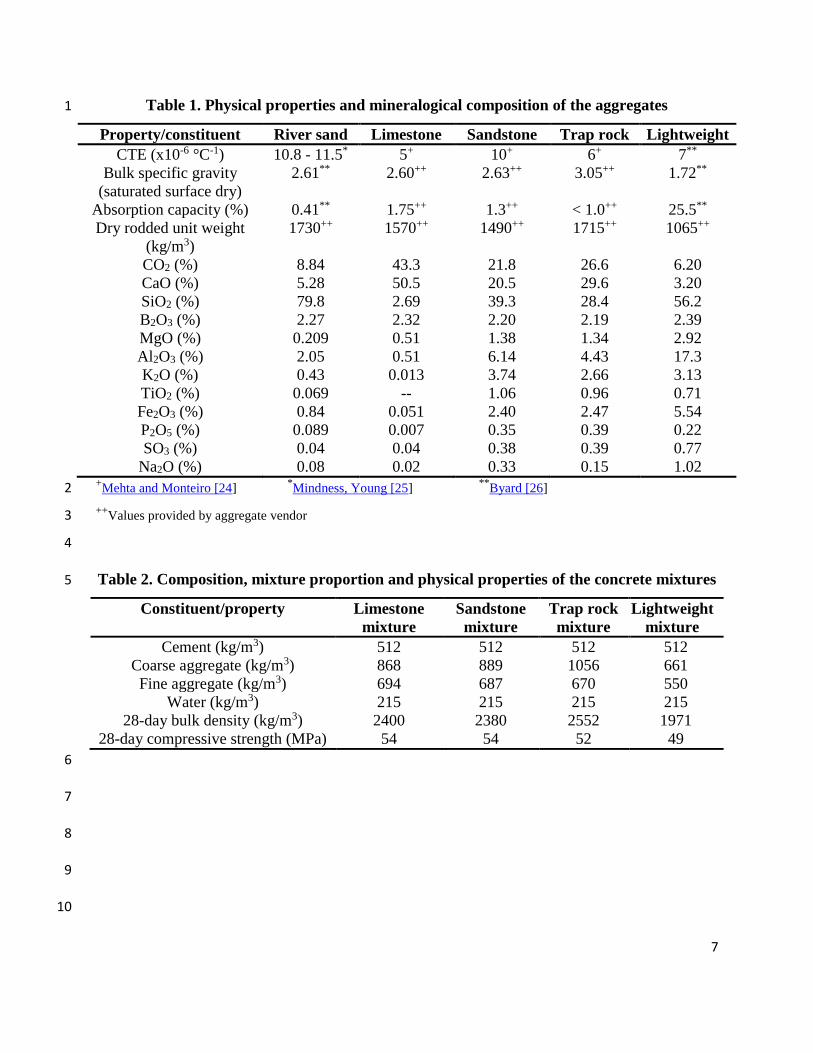
Table 1. Physical properties and mineralogical composition of the aggregates 1
Property/constituent River sand Limestone Sandstone Trap rock Lightweight
CTE (x10-6 °C-1) 10.8 - 11.5* 5+ 10+ 6+ 7**
Bulk specific gravity
(saturated surface dry)
2.61** 2.60++ 2.63++ 3.05++ 1.72**
Absorption capacity (%) 0.41** 1.75++ 1.3++ < 1.0++ 25.5**
Dry rodded unit weight
(kg/m3)
1730++ 1570++ 1490++ 1715++ 1065++
CO2 (%) 8.84 43.3 21.8 26.6 6.20
CaO (%) 5.28 50.5 20.5 29.6 3.20
SiO2 (%) 79.8 2.69 39.3 28.4 56.2
B2O3 (%) 2.27 2.32 2.20 2.19 2.39
MgO (%) 0.209 0.51 1.38 1.34 2.92
Al2O3 (%) 2.05 0.51 6.14 4.43 17.3
K2O (%) 0.43 0.013 3.74 2.66 3.13
TiO2 (%) 0.069 -- 1.06 0.96 0.71
Fe2O3 (%) 0.84 0.051 2.40 2.47 5.54
P2O5 (%) 0.089 0.007 0.35 0.39 0.22
SO3 (%) 0.04 0.04 0.38 0.39 0.77
Na2O (%) 0.08 0.02 0.33 0.15 1.02 +Mehta and Monteiro [24]
*Mindness, Young [25]
**Byard [26] 2
++Values provided by aggregate vendor 3
4
Table 2. Composition, mixture proportion and physical properties of the concrete mixtures 5
Constituent/property Limestone
mixture
Sandstone
mixture
Trap rock
mixture
Lightweight
mixture
Cement (kg/m3) 512 512 512 512
Coarse aggregate (kg/m3) 868 889 1056 661
Fine aggregate (kg/m3) 694 687 670 550
Water (kg/m3) 215 215 215 215
28-day bulk density (kg/m3) 2400 2380 2552 1971
28-day compressive strength (MPa) 54 54 52 49
6
7
8
9
10

8
Cooling and storage of concrete samples 1
The concrete samples were placed in a Cincinnati Sub Zero temperature chamber, cooled by 2
liquid nitrogen, for cryogenic freezing. The temperature chamber has an inbuilt fan for air 3
circulation through the chamber. Cooling of the temperature chamber commenced from 20±1°C 4
to -165±1°C, using a cooling rate of 3°C per minute with guaranteed soak of 3 minutes at -5
165°C. In contrast, the typical cooling rate for an LNG tank mentioned earlier is 0.017°C per 6
minute. The highest possible cooling rate the temperature chamber could easily accommodate 7
was employed to encourage microcracking since the cooling rate influences the extent of 8
cracking [1, 9]. Since this work intends to screen different aggregates for use in production of 9
damage-resistant concrete, the cooling rate employed was envisaged to help better differentiate 10
the performance of the concrete mixes. Furthermore, it was anticipated that the results might 11
indicate that typical cooling rate for LNG tanks is far too conservative (and thus overly 12
expensive) if concrete is used for primary containment. The chamber was programmed to turn 13
off as soon as it attained the target temperature. Thereafter, the chamber was opened and the 14
cryogenically frozen concrete samples carefully taken out with the aid of cryogenic personal 15
protective equipment. The frozen samples were immediately stored in Corafoam® thermal 16
insulation material (i.e., rigid polyisocyanurate foams, Duna Corradini, Modena, Italy) until 17
subjected to further analysis. 18
19
AE measurement and data analysis 20
The damage accumulation events (‘hits’) during freezing of concrete cubes were recorded using 21
a Vallen AMSY-6 multichannel AE measurement system (Vallen System GMBH, Germany). 22
The AE acquisition device is equipped with two AEP4 preamplifiers with a gain of 34 dB and a 23

9
frequency range of 25 kHz to 850 kHz. Due to the 34 dB gain used, the saturation amplitude was 1
99.9 dB. Thus, any event greater than 99.9 dB was recorded as 99.9 dB, albeit the full energy 2
emitted during the event was recorded. Two concrete cubes from each mixture design were 3
tested in a given freezing run from ambient to cryogenic temperature. Pancom P15 sensors (with 4
150 kHz resonant frequency) coupled to the concrete cubes in the temperature chamber provided 5
AE ‘hits’ to the preamplifiers. A high vacuum sealing compound, HIVAC-G (Shin Etsu, Japan), 6
was used for coupling of the sensors to the concrete cubes. The sensitivity of the sensors was 7
checked using the standard pencil lead break (Hsu-Neilsen source) on the surface of the concrete 8
cubes [27]. The settings used for the AE ‘hits’ included a discrimination time of 200 µs and a 9
rearm time of 0.4 ms. A threshold of 34 dB was used to filter out the ambient noise. The 10
sampling rate was 10 MHz. 11
12
The post-processing of acquired data was carried out using Mathematica (Wolfram Research, 13
USA). Mathematica codes filtered out noise associated with the cooling function of the 14
temperature chamber by discarding data detected by both sensors (attached to two distinct 15
concrete samples) at the same instant. This filtering algorithm essentially assumes that the 16
probability that both specimens will crack at the same instant is extremely low, while ambient 17
noise from the chamber would result in simultaneous AE ‘hits’ in both samples. 18
19
XRCT procedure 20
An x-ray computed tomography (XRCT), MicroXCT-400 (Carl Zeiss Microscopy, GmbH, Jena, 21
Germany) was employed to observe the internal microstructure of the concrete mixtures before 22
and after cryogenic freezing. Two replicate cores of a given mixture were used for the XRCT 23

10
scanning; one core was unfrozen and the other frozen. The samples were air-dried prior to XRCT 1
imaging. The maximum electron acceleration energy was 150 kV and the system acquired 2500 2
projection images. The scan duration was approximately 3 hours for each sample. The method 3
described by Promentilla and Sugiyama [14] was employed for further image processing using 4
ImageJ, a public domain software. Image processing entailed rescaling the raw 16-bit XRCT 5
data to an 8-bit gray scale image. The brightness and contrast of the converted image was 6
adjusted to give a better contrast between surrounding air voids, aggregates and the cementitious 7
matrix. 8
9
Water and chloride permeability testing 10
Water permeability testing was based on the depth of water penetration in the concrete cubes, 11
determined according to BS EN 12390-8 [28]. The insulation material employed maintained the 12
temperature of the frozen concrete cubes used for water permeability tests until tested. This 13
insulation thus ensured the test commenced with samples in the frozen state to give some idea of 14
the permeability at low temperatures. Nevertheless, there was no means designed to prevent 15
temperature changes during the test. Hence, permeability tests eventually involved thawed 16
samples. The water pressure applied to the concrete cube was 0.5 MPa, and the test lasted for 72 17
hours. Thereafter, the weight of the concrete cube and the depth of water penetrated were 18
determined. The water permeability was then calculated using Valenta’s equation and 19
subsequently expressed in terms of the intrinsic permeability of the material. The details of the 20
relations used are described in a related publication [21]. 21
22
11
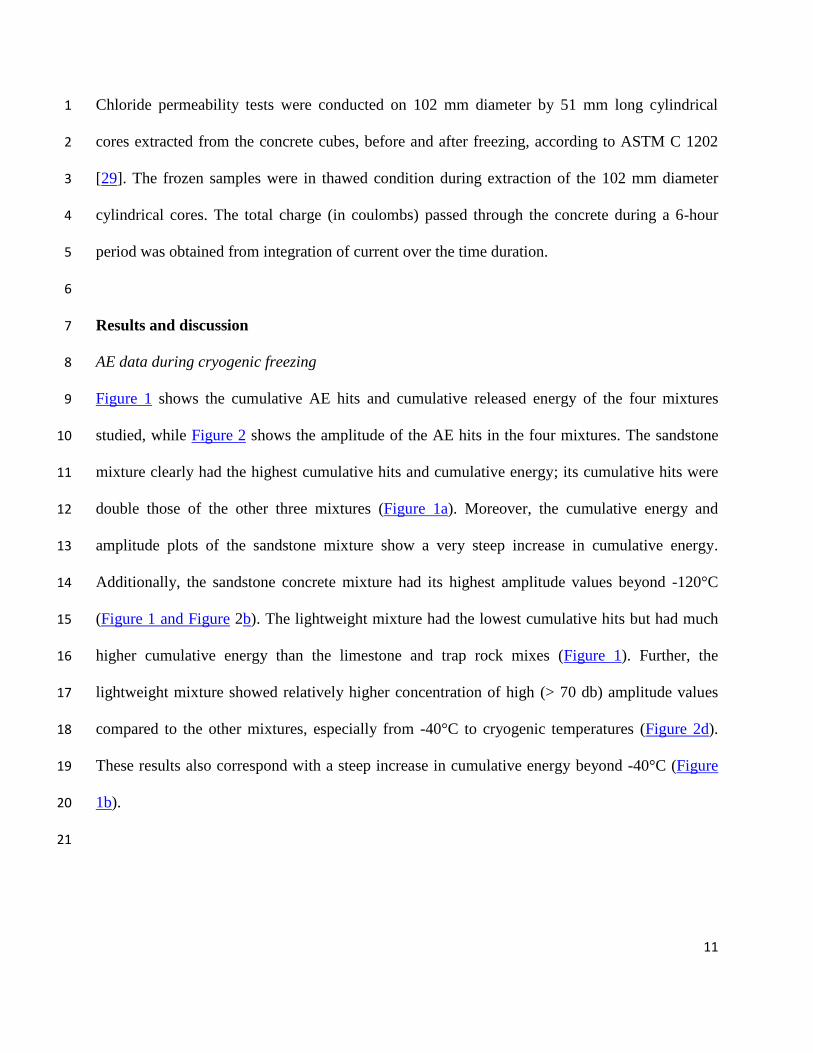
Chloride permeability tests were conducted on 102 mm diameter by 51 mm long cylindrical 1
cores extracted from the concrete cubes, before and after freezing, according to ASTM C 1202 2
[29]. The frozen samples were in thawed condition during extraction of the 102 mm diameter 3
cylindrical cores. The total charge (in coulombs) passed through the concrete during a 6-hour 4
period was obtained from integration of current over the time duration. 5
6
Results and discussion 7
AE data during cryogenic freezing 8
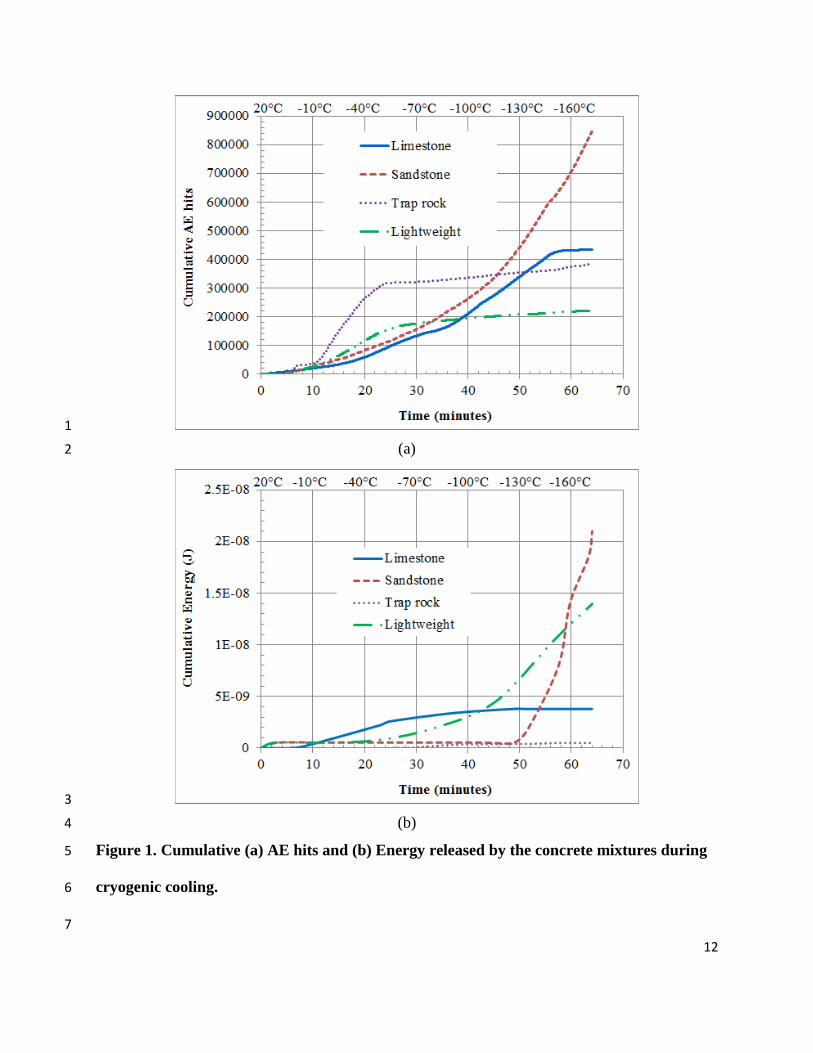
Figure 1 shows the cumulative AE hits and cumulative released energy of the four mixtures 9
studied, while Figure 2 shows the amplitude of the AE hits in the four mixtures. The sandstone 10
mixture clearly had the highest cumulative hits and cumulative energy; its cumulative hits were 11
double those of the other three mixtures (Figure 1a). Moreover, the cumulative energy and 12
amplitude plots of the sandstone mixture show a very steep increase in cumulative energy. 13
Additionally, the sandstone concrete mixture had its highest amplitude values beyond -120°C 14
(Figure 1 and Figure 2b). The lightweight mixture had the lowest cumulative hits but had much 15
higher cumulative energy than the limestone and trap rock mixes (Figure 1). Further, the 16
lightweight mixture showed relatively higher concentration of high (> 70 db) amplitude values 17
compared to the other mixtures, especially from -40°C to cryogenic temperatures (Figure 2d). 18
These results also correspond with a steep increase in cumulative energy beyond -40°C (Figure 19
1b). 20
21
12
1
(a) 2
3
(b) 4
Figure 1. Cumulative (a) AE hits and (b) Energy released by the concrete mixtures during 5
cryogenic cooling. 6
7
13
1
(a) (b) 2
3
(c) (d) 4
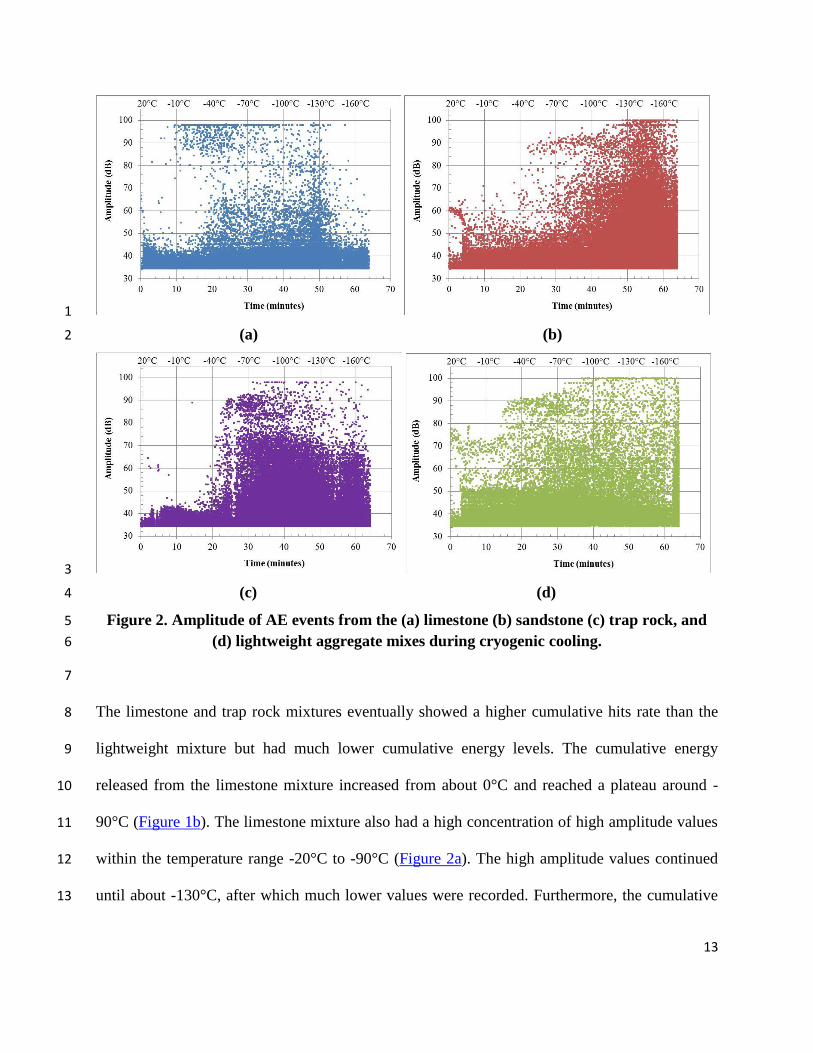
Figure 2. Amplitude of AE events from the (a) limestone (b) sandstone (c) trap rock, and 5
(d) lightweight aggregate mixes during cryogenic cooling. 6
7
The limestone and trap rock mixtures eventually showed a higher cumulative hits rate than the 8
lightweight mixture but had much lower cumulative energy levels. The cumulative energy 9
released from the limestone mixture increased from about 0°C and reached a plateau around -10
90°C (Figure 1b). The limestone mixture also had a high concentration of high amplitude values 11
within the temperature range -20°C to -90°C (Figure 2a). The high amplitude values continued 12
until about -130°C, after which much lower values were recorded. Furthermore, the cumulative 13

14
energy released from the trap rock mixture increased from -40°C and reached a plateau around -1
90°C (Figure 1b). The traprock mixture also released a high concentration of high amplitude 2
values in the -40°C to -90°C temperature range (Figure 2c). In contrast, the sandstone and 3
lightweight mixtures showed steep increase in cumulative energy; both mixtures also had the 4
highest amplitude values at temperatures below -90°C. The AE event amplitudes in all mixtures 5
studied generally increased from low to high levels as the temperature decreased, in agreement 6
with Amitrano et al [30]. It is evident from the foregoing that the relationship between the 7
cumulative hits and cumulative energy depends on the amplitudes of the AE events. For instance, 8
in the -20°C to -60°C temperature range, the trap rock mixture showed higher cumulative hits 9
than the other mixtures (Figure 1a). However, it had much lower cumulative energy probably 10
because relatively lower amplitude events (~ 45 dB for the first half of the temperature range) 11
occurred for the mixture (Figure 2). 12
13
The significant increase in amplitude and cumulative energy in the mixtures in the -20°C to -14
60°C temperature range may be attributed to increase in matrix stresses and microcracking due to 15
ice growth [5]. Water transforms into ice in pores of small diameter in the afore-mentioned 16
temperature range [31]. While water in the very small pores freezes between -60°C and -90°C. 17
Specifically, structural water located in gel pores with radius between 3 nm and 10 nm freezes 18
between -30°C and -80°C. This is in contrast to adsorbed water located in gel pores with radius 19
less than 3 nm, which do not freeze within the range of 0°C to -160°C [5, 32]. Thus, ice-induced 20
microcracking ceases around -90°C [5]. This may be responsible for the plateau attained by the 21
cumulative energy plots of the limestone and trap rock mixes around -90°C. Further, wet 22
concrete is known to contract in the temperature range 20°C to -20°C, expand in the range -20°C 23
15
to -70°C, and resume contraction again beyond -70°C [33], assuming there are no entrained air 1
bubbles present [8]. Increase in matrix stresses resulting from the expansion phase following the 2
initial contraction in the -20°C to -70°C is likely to cause microcracking. This likelihood of 3
microcracking also accounts for the significant increase in the amplitude and energy of AE 4
events in the aforementioned temperature range. 5
6
The steep increase in cumulative energy released by the sandstone and lightweight concrete 7
mixtures below -90°C, which corresponded with the highest amplitude values, likely indicate 8
significant microcrack formation. The amount of energy released depends on the severity of the 9
cracking [34]. This severe microcracking is probably because both sandstone and lightweight 10
aggregates exhibit significant internal moisture movement, which leads to high internal stresses 11
and in turn causes disruptive volume changes [24]. Thus, the sandstone and lightweight mixtures 12
are more likely to show greater volumetric changes when wet concrete resumes contraction 13
beyond -70°C. The results corroborate previous studies on strain measurements of cryogenic 14
concrete [33]. 15
16
XRCT images before and after cryogenic freezing 17
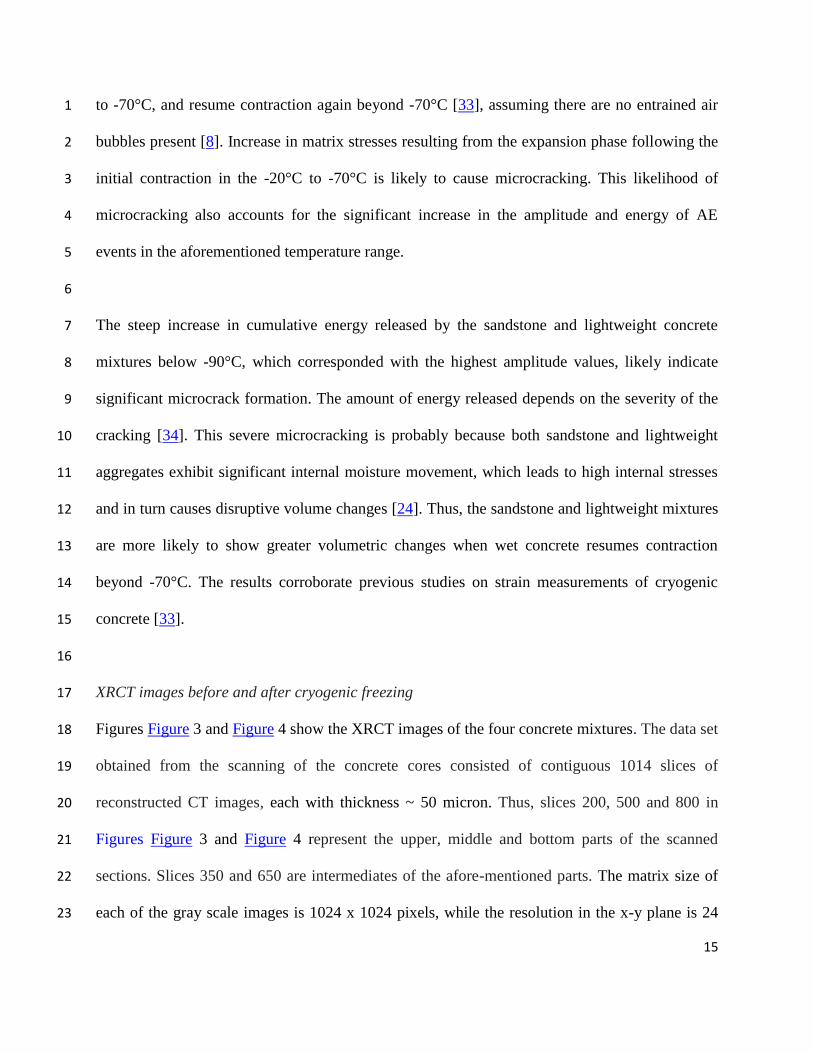
Figures Figure 3 and Figure 4 show the XRCT images of the four concrete mixtures. The data set 18
obtained from the scanning of the concrete cores consisted of contiguous 1014 slices of 19
reconstructed CT images, each with thickness ~ 50 micron. Thus, slices 200, 500 and 800 in 20
Figures Figure 3 and Figure 4 represent the upper, middle and bottom parts of the scanned 21
sections. Slices 350 and 650 are intermediates of the afore-mentioned parts. The matrix size of 22
each of the gray scale images is 1024 x 1024 pixels, while the resolution in the x-y plane is 24 23

16
micron per pixel. Thus, the anisotropic dimensions of each volumetric pixel (voxel) in the raw 1
CT data are 24 x 24 x 50 µm. In the slices, with the exception of the lightweight mixture, the 2
aggregates appear as patches with different gray shades, and much brighter than the dark gray 3
shades of the surrounding cementitious matrix. The patches of lightweight aggregates are darker 4
than the surrounding cementitious matrix. Air voids and cracks should appear as black or very 5
dark in the images. 6
7
Slice 200 Slice 350 Slice 500 Slice 650 Slice 800
Un
froze
n
Lim
esto
ne
mix
Fro
zen
Lim
esto
ne
mix
Un
froze
n
San
dst
on
e m
ix
Fro
zen
San
dst
on
e m
ix
8
Figure 3. Sample cross-sections of the limestone and sandstone mixtures. 9
1st and 3rd row: unfrozen samples, 2nd and 4th row: frozen samples. 10

17
1
Slice 200 Slice 350 Slice 500 Slice 650 Slice 800
Un
froze
n
Tra
p r
ock
mix
Fro
zen
Tra
p r
ock
mix
Un
froze
n
Lig
htw
eigh
t m
ix
Fro
zen
L
igh
twei
gh
t m
ix
2
Figure 4. Sample cross-sections of the trap rock and lightweight mixtures. 3
1st and 3rd row: unfrozen samples, 2nd and 4th row: frozen samples. Red oval in slices 650 4
and 800 of the frozen lightweight mix indicate cracks. 5
6
There are differences between unfrozen and frozen samples, especially with respect to air void 7
(spherical shapes) porosity. This is because the CT scans employed different replicate samples 8
for both groups. Generally, the images do not show any clear difference between the 9
microstructure of the samples before and after cryogenic freezing. However, the following 10
18
observations can be made from the images. There appear to be microcracks in a few limestone 1
aggregate particles in the unfrozen limestone mixture, which did not necessarily get worse with 2
cryogenic cooling. The microcracks in the frozen sample were originally in the limestone 3
aggregate particles and are not due to cooling (Figure 3). The sandstone mixture, whose AE 4
behavior showed the worst performance, apparently had slight increase in air void content after 5
freezing (Figure 3). There is no evidence of cracking or increase in air void content in the trap 6
rock mixture. Compared to the other mixtures, the lightweight mixture apparently manifested 7
more microcracks and air voids in the frozen sample than the unfrozen sample. Most of the 8
microcracks appeared across the coarse aggregate (see slices 650 and 800) and very few occurred 9
along the aggregate/paste interface (Figure 4). This may be due to the inherent porosity of 10
lightweight aggregates, especially as the images show a number of individual (dark) empty pores 11
within the lightweight aggregate particle structure. 12
13
It is noteworthy that SEM imaging was carried out on the concrete mixtures but there was no 14
observable damage due to cryogenic cooling in any of the mixtures. Hence, the SEM images are 15
not shown here. The lack of observable cracks in majority of the CT images implies that the 16
damage (microcracks) formed due to cryogenic cooling is very well distributed, with 17
characteristic crack sizes below the resolution of the CT. In other words, large cracks do not tend 18
to form in the concrete cores, but rather well-dispersed microcracks. This is important from a 19
durability perspective since studies have shown that the rate of permeation through a crack is 20
proportional to the cube of the crack width [35]. Thus, one large crack will be much more 21
permeable than two cracks of half the width of the larger crack. 22
23
19
1
Water and chloride permeability 2
Figure 5a shows the intrinsic permeability of the concrete mixtures determined from water 3
permeability tests. Figure 5b shows changes in chloride permeability of the mixtures resulting 4
from cryogenic freezing. The trend of the permeability results is quite similar to the AE results. 5
The limestone mixture showed reduced intrinsic permeability after freezing of about half an 6
order of magnitude, as opposed to permeability increases in the other mixtures. The trap rock 7
mixture showed a slight increase in permeability compared to the lightweight and sandstone 8
mixes with large (~ one order of magnitude) permeability increases. Previous work has indicated 9
that microcracking can change the permeability of cement-based materials by about one order of 10
magnitude [36]. For consistency, the water permeability tests employed the same samples used 11
for the AE tests for a given mixture. A second replicate was also tested for a given mixture to 12
estimate the precision of the results. The two replicates tested for the mixtures yielded 13
permeability values of the same order of magnitude. Further, the replicates also confirmed the 14
water permeability reduction observed in the limestone mixture after freezing. It seems that there 15
are two competing mechanisms responsible, for the decrease in permeability of the limestone 16
mixture, and the increase in permeability in the other mixtures. Formation of ice in concrete 17
pores reduces permeability as it impedes liquid travel through the pore system [1], while 18
microcrack formation increases permeability. In the limestone mixture, it appears that the former 19
mechanism is dominant while in the other mixtures, the latter. 20
21
22
23

20
1
2
(a) 3
4
(b) 5
Figure 5. (a) Water permeability and (b) Chloride permeability of the concrete mixtures 6
before and after cryogenic freezing. 7

21
1
There are slight variations in trends between the water permeability and AE results. For instance, 2
some mixtures show better performance in one test and lag behind in the other test. This may be 3
due to conducting the AE tests during freezing and the permeability tests during thawing. The 4
increase in water permeability of the lightweight mixture after freezing in relation to the normal 5
weight mixtures differs from the findings of Bamforth [9]. In that work, air-entrained lightweight 6
concrete made from sintered fly ash showed lower permeability values compared to normal 7
weight concrete after freezing. However, the type of lightweight aggregate used differed from 8
the one used here. Moreover, air-entrainment helps in preventing freeze-thaw damage. The 9
behavior of the limestone and trap rock mixtures agree with Hearn [37] on the relationship 10
between microcracking and water permeability. An abundance of microcracks does not 11
necessarily increase concrete permeability. Significant change in liquid flow rate through 12
concrete occurs only when cracks begin to interconnect [37]. 13
14
The chloride permeability results also showed a similar trend to the AE and water permeability 15
results. Although all mixtures showed an increase in chloride permeability, the limestone mixture 16
had the least (3.8%) increase2, followed by the trap rock mixture (9.4%). The lightweight and 17
sandstone mixtures had very high chloride permeability increases (Figure 5b). The high increase 18
in chloride permeability of the lightweight mixture after a single freeze-thaw cycle corroborates 19
2 The increase in chloride permeability and the decrease in measured water permeability for the limestone
mixture may be explained by the fact that the chloride permeability test was performed on a thawed
sample (i.e., no ice within the pore network) while the water permeability test was performed (at least a
portion of the test duration) on frozen samples such that pore blocking by ice crystals would tend to
reduce the permeability and counteract increases caused by microcracking.

22
the findings of Saito et al [38]; the lightweight aggregate used here is similar to that (fully 1
saturated expanded shale aggregates) used in their work. 2
3
It is noteworthy that the high increases in water and chloride permeability of the lightweight 4
mixture in relation to the other mixtures corroborate previous observations on compressive 5
strength of concrete made with different aggregates at cryogenic temperatures. Concrete made 6
with expanded shale lightweight aggregate showed a markedly lower compressive strength 7
increase when cooled to cryogenic temperatures compared to concrete from normal weight 8
aggregates {limestone, basalt (trap rock), granite, silica and porphyry} [5, 39]. Whereas, there 9
was no significant difference in compressive strength increase between the normal weight 10
concretes. It is well known that the compressive strength of concrete increases with cooling and 11
the increase is directly proportional to the moisture content, and independent of the mixture 12
proportions, curing method or concrete age [5, 40]. Hence, the comparative compressive 13
strengths between the different concrete mixtures during cryogenic cooling were not considered 14
in this work. Similarly, the extent of improvement or variation of most concrete properties during 15
cryogenic cooling is highly dependent on the moisture content [1, 5]. Thus, this work employed 16
concrete that was kept continually moist for a reasonable period in line with findings from 17
previous studies [1]. 18
19
Conclusions 20
Microstructural observations of the concrete mixtures using XRCT showed no visible (micro) 21
cracking in the limestone, sandstone and traprock mixtures due to one-time cryogenic cooling. 22
However, the lightweight mixture manifested more microcracks and air voids after cryogenic 23

23
cooling. The microcracks mostly appeared across the coarse aggregate with very few occurring 1
along the aggregate/paste interface. The absence of observable microcracks due to cryogenic 2
cooling in majority of the mixtures implies that damage detected via AE and increased 3
permeability was very well distributed. Such damage consisted of microcracks smaller than the 4
resolution of the CT, rather than larger macrocrack formation. Thus, damage due to cooling to 5
cryogenic temperatures does not tend to create macrocracks but rather a distribution of 6
microcracks. AE proved to be a useful tool for understanding the microcracking in the mixtures, 7
which manifested in permeability increases in most mixtures. There was very little effect of one-8
time cryogenic freezing on the limestone and trap rock mixes. Both mixtures showed relatively 9
lower cumulative energy released in AE tests during cooling from ambient to cryogenic 10
temperatures. The limestone mixture showed a slight reduction in water permeability (ostensibly 11
due to ice blocking in the pore network), while the trap rock mixture had a slight permeability 12
increase after freezing. Both mixtures showed slight increases in chloride permeability. 13
14
On the other hand, the lightweight and sandstone mixtures showed evidence of significant 15
microcrack formation in AE tests. There was significant increase in the cumulative energy 16
emitted from both mixtures, especially beyond -90°C. This microcracking was also exhibited in 17
the form of large increases in water and chloride permeability of both mixtures. Moreover, this 18
corroborated the observation made in the CT imaging of the lightweight mixture. Putting the 19
results together, the damage resistance (due to cooling to cryogenic temperatures) of the concrete 20
comprised of the different aggregates was in the order limestone ≥ trap rock >> lightweight 21
aggregate ≥ sandstone. Further experiments are in progress considering additional mixture design 22
options, including air-entrainment. Ultimately, these results will provide an improved 23
24
understanding of the mechanism(s) of concrete damage resistance during cryogenic cooling and 1
provide guidance for concrete mixture design for direct containment of LNG. 2
3
Acknowledgements 4
This publication was made possible by an NPRP award (NPRP No. 4-410-2-156: Thermal 5
Dilation and Internal Damage of Cryogenic Concrete used for Direct LNG Containment) from 6
the Qatar National Research Fund (QNRF – a member of The Qatar Foundation). The statements 7
made herein are solely the responsibility of the authors. The authors thank Boback Parsaei, of 8
Zachry Department of Civil Engineering, Texas A&M University, College Station, USA for 9
assistance with the aggregates, and Makram Sarieddine of Petroleum Engineering Program, 10
Texas A&M University at Qatar for the XRCT imaging. 11
12
References 13
[1] Kogbara RB, Iyengar SR, Grasley ZC, Masad EA, Zollinger DG. A review of concrete 14
properties at cryogenic temperatures: Towards direct LNG containment. Constr Build Mater. 15
2013;47:760-70. 16
[2] He XD, Shi XM. Chloride Permeability and Microstructure of Portland Cement Mortars 17
Incorporating Nanomaterials. Transp Res Record. 2008:13-21. 18
[3] Poulikakos LD, Partl MN. Investigation of porous asphalt microstructure using optical and 19
electron microscopy. J Microsc-Oxford. 2010;240:145-54. 20
[4] Dahmani L, Khenane A, Kaci S. Behavior of the reinforced concrete at cryogenic 21
temperatures. Cryogenics. 2007;47:517-25. 22
[5] Krstulovic-Opara N. Liquefied natural gas storage: Material behavior of concrete at 23
cryogenic temperatures. ACI Mater J. 2007;104:297 – 306. 24
[6] Medina C, de Rojas MIS, Frias M. Freeze-thaw durability of recycled concrete containing 25
ceramic aggregate. J Clean Prod. 2013;40:151-60. 26

25
[7] Yang Z, Weiss WJ, Olek J. Interaction between micro-cracking, cracking, and reduced 1
durability of concrete: Developing methods for considering cumulative damage in life-cycle 2
modeling. West Lafayette, Indiana, doi: 10.5703/1288284313255: Publication FHWA/IN/JTRP-3
2004/10. Joint Transportation Research Program, Indiana Department of Transportation and 4
Purdue University; 2004. 5
[8] Rahman S, Grasley Z. A poromechanical model of freezing concrete to elucidate damage 6
mechanisms associated with substandard aggregate. Cem Concr Res. 2014;55. 7
[9] Bamforth PB. The structural permeability of concrete at cryogenic temperatures [PhD 8
Thesis]. UK: Aston University, Available: http://eprints.aston.ac.uk/14275/, [Accessed July 9
2012]; 1987. 10
[10] Lothenbach B, Winnefeld F, Alder C, Wieland E, Lunk P. Effect of temperature on the pore 11
solution, microstructure and hydration products of Portland cement pastes. Cem Concr Res. 12
2007;37:483-91. 13
[11] Koksal F, Gencel O, Brostow W, Hagg Lobland HE. Effect of high temperature on 14
mechanical and physical properties of lightweight cement based refractory including expanded 15
vermiculite. Mater Res Innov. 2012;16:7 - 13. 16
[12] Galluci E, Zhang X, Scrivener KL. Effect of temperature on the microstructure of calcium 17
silicate hydrate (C-S-H). Cem Concr Res. 2013;53:185 - 95. 18
[13] Skripkiunas G, Nagrockiene D, Keriene J, Janavicius E, Girskas G, Spokauskas A. 19
Microstructure Changes in Hardened Cement Paste after Freezing - Thawing Cycles. Mater Sci-20
Medzg. 2013;19:108-14. 21
[14] Promentilla MAB, Sugiyama T. X-Ray microtomography of mortars exposed to freezing-22
thawing action. J Adv Concr Technol. 2010;8:97 - 111. 23
[15] Kencanawati NN, Shigeishi M, Namihira T, Ohtsu M. Acoustic emission visualization of 24
micro-cracks induced by pulsed discharge in concrete. In: Oh BH, Others, editors. Fracture 25
Mechanics of Concrete and Concrete Structures - Assessment, Durability, Monitoring and 26
Retrofitting of Concrete Structures: Fracture Mechanics of Concrete and Concrete Structures - 27
Assessment, Durability, Monitoring and Retrofitting of Concrete Structures, Korea Concrete 28
Institute, Seoul, ISBN 978-89-5708-181-5; 2010. 29
26
[16] Sagar RV, Prasad BKR. A review of recent developments in parametric based acoustic 1
emission techniques applied to concrete structures. Nondestruct Test Eva. 2012;27:47 - 68. 2
[17] ASTM. E1316 - 13d. Standard terminology for nondestructive examinations. West 3
Conshohocken, PA, doi: 10.1520/E1316, www.astm.org: ASTM International; 2013. 4
[18] Yang Z, Weiss WJ, Olek J. Water transport in concrete damaged by tensile loading and 5
freeze-thaw cycling. J Mater Civ Eng. 2006;18:424 - 34. 6
[19] Yoon D-J, Weiss WJ, Shah SP. Detecting the extent of corrosion with acoustic emission. 7
Transp Res Record. 2000:54 - 60. 8
[20] Yoon D-J, Weiss WJ, Shah SP. Assessing damage in corroded reinforced concrete using 9
acoustic emission. J Eng Mech - ASCE. 2000;126: 273 - 83. 10
[21] Kogbara RB, Parsaei B, Iyengar SR, Grasley ZC, Masad EA, Zollinger DG. Evaluating 11
damage potential of cryogenic concrete using acoustic emission sensors and permeability testing. 12
In: Lynch JP, Wang, K-W., Sohn, H, editor. Proc of SPIE, Vol 9061: Sensors and Smart 13
Structures Technologies for Civil, Mechanical, and Aerospace Systems, 90613B; doi: 14
101117/122045708. Bellingham, WA: SPIE; 2014. 15
[22] ACI. 376-11. Code requirements for design and construction of concrete structures for the 16
containment of refrigerated liquefied gases and commentary. An ACI Standard. Farmington 17
Hills, MI: American Concrete Institute; 2011. 18
[23] BSI. BS EN 12390-3. Testing hardened concrete. Compressive strength of test specimens. 19
London: British Standards Institution; 2009. 20
[24] Mehta PK, Monteiro PJM. Concrete: Microstructure, properties, and materials. New York: 21
McGraw-Hill; 2006. 22
[25] Mindness S, Young JF, Darwin D. Concrete. New Jersey: Prentice Hall; 2003. 23
[26] Byard BE. Early-age behavior of lightweight aggregate concrete [Ph.D Thesis]: Ph.D 24
Thesis, Auburn University, USA. Available: http://etd.auburn.edu/etd/handle/10415/2876 25
[Accessed February 2013]; 2011. 26
[27] ASTM. E796-10. Standard guide for determining the reproducibility of acoustic emission 27
sensor response. West Conshohocken, PA, doi: 10.1520/E0976-10: ASTM International; 2010. 28
[28] BSI. BS EN 12390-8. Testing hardened concrete. Depth of penetration of water under 29
pressure. London: British Standards Institution; 2009. 30
27
[29] ASTM. C 1202. Standard test method for electrical indication of chloride’s ability to resist 1
chloride. West Conshohocken, PA, doi: 10.1520/C1202-05: ASTM International; 2006. 2
[30] Amitrano D, Gruber S, Girard L. Evidence of frost-cracking inferred from acoustic 3
emissions in a high-alpine rock-wall. Earth Planet Sci Lett. 2012;341:86 - 93. 4
[31] Planas J, Corres H, Elices M. Thermal deformation of loaded concrete during thermal cycles 5
from -20ºC to -165ºC. Cem Concr Res. 1984;14:639 – 44. 6
[32] Van der Veen C. Properties of concrete at very low temperatures: A survey of the literature. 7
The Netherlands: Delft University of Technology, Report 25-87-2. Available: 8
http://repository.tudelft.nl/view/ir/uuid%3Af4175338-4cc3-434e-9046-50769311025d/; 1987. 9
[33] Marshall AL. Cryogenic concrete. Cryogenics. 1982;22:555 – 65. 10
[34] Elfergani HA, Pullin R, Holford KM. Damage assessment of corrosion in prestressed 11
concrete by acoustic emission. Constr Build Mater. 2013;40:925 - 33. 12
[35] Aldea C-M, Gandehari M, Shah SP, Karr AF. Estimation of water flow through cracked 13
concrete under load. ACI Mater J. 2000;97:567 - 75. 14
[36] Grasley ZC, Scherer GW, Lange DA, Valenza JJ. Dynamic pressurization method for 15
measuring permeability and modulus: II. cementitious materials. Mater Struct. 2007;40:711 - 21. 16
[37] Hearn N. Effect of shrinkage and load-induced cracking on water permeability of concrete. 17
ACI Mater J. 1999;96:234 – 41. 18
[38] Saito M, Ohta M, Ishimori H. Chloride permeability of concrete subjected to freeze-thaw 19
damage. Cement & Concrete Composites. 1994;16:233 - 9. 20
[39] Tognon G. Behaviour of mortars and concretes in the temperature range from +20°C to –21
196°C. Proceedings of the 5th International Symposium on the Chemistry of Cement, 22
Tokyo;1968. p. 229 - 49. 23
[40] Goto Y, Miura T. Mechanical properties of concrete at very low temperatures. The 21st 24
Japan Congress on Materials Research - Non-Metallic Materials, March, Kyoto, Japan;1978. p. 25
157 - 9. 26
27
28