Embed Size (px)
Citation preview

Rekindling Hope in Latin America:What Role for the IDB?
Ricardo Hausmann
Kennedy School of Government
Harvard University

The “lost decade” of the 80sCumulative growth rate in GDP per working age person,
relative to US1980-1990
-45.0 -40.0 -35.0 -30.0 -25.0 -20.0 -15.0 -10.0 -5.0 0.0
United States
Chile
Colombia
Uruguay
Brazil
Ecuador
Panama
Mexico
Venezuela
Argentina
Peru
80-90
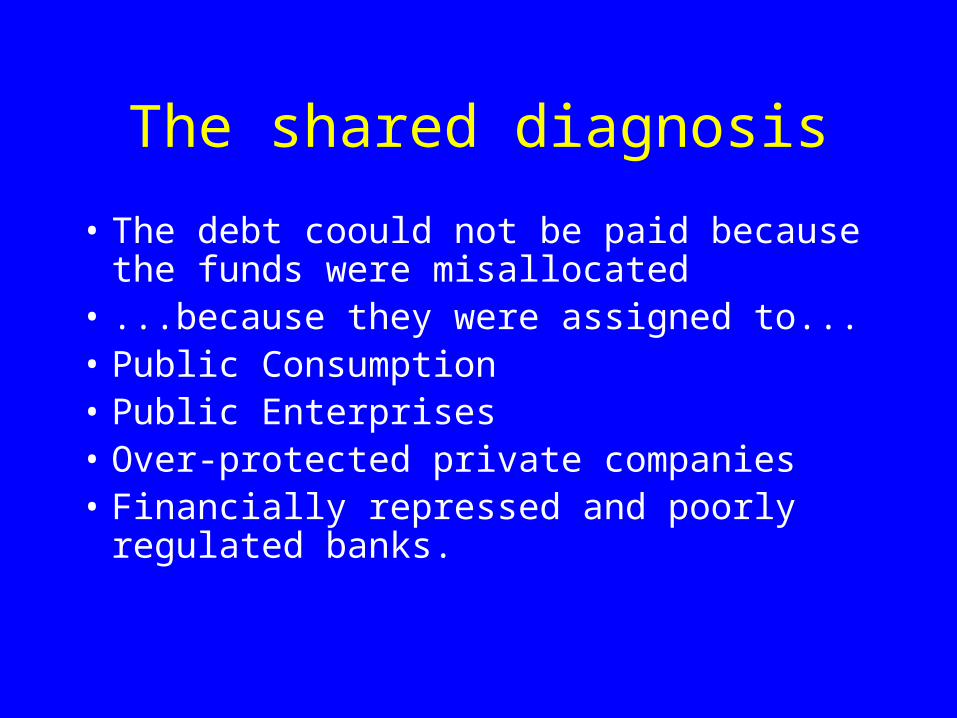
The shared diagnosis
• The debt coould not be paid because the funds were misallocated
• ...because they were assigned to...• Public Consumption • Public Enterprises• Over-protected private companies• Financially repressed and poorly regulated
banks.

The agreed solution
• Public Consumption Fiscal Discipline
• Public Enterprises Privatization• Over-Protected Private Companies Trade
liberalization Financially repressed and poorly
regulated banks. Liberalization and Regulation

The initial pay-off to reform 1990-97
-20.0 -10.0 0.0 10.0 20.0 30.0 40.0 50.0
Chile
Peru
Uruguay
Panama
Argentina
Colombia
United States
Mexico
Ecuador
Venezuela
Brazil
Cumulative growth rate in GDP per working age person, relative to the US

Fuente: Lora y Barrera, 1997
-5%
0%
5%
10%
15%C
amb
ios
en T
asas
de
Cre
cim
ien
to
0% 5% 10% 15% 20% 25% 30% 35% 40%
Cambios en Indices de Política
Jamaica
MexicoHonduras
Chile Paraguay República DominicanaVenezuelaUruguayCosta Rica
GuatemalaBoliviaColombia Ecuador
BrazilTrinidad and Tobago
El Salvador Argentina
Nicaragua
Perú
Change in GDP growth vs. change in policy index (1993-95 vs. 1987-89)
Reformers did better

Growth collapsed 1998-2002
-40.0 -35.0 -30.0 -25.0 -20.0 -15.0 -10.0 -5.0 0.0
United States
Chile
Mexico
Brazil
Panama
Peru
Ecuador
Colombia
Venezuela
Uruguay
Argentina
Cumulative growth rate in GDP per working age person, relative to the US

-50.0 -40.0 -30.0 -20.0 -10.0 0.0 10.0 20.0 30.0 40.0 50.0
Chile
Peru
Panama
United States
Mexico
Colombia
Uruguay
Brazil
Ecuador
Venezuela
Argentina
The whole reform period 1990-02
Cumulative growth rate in GDP per working age person, relative to the US

The two lost decades 1980-02
-60.0 -50.0 -40.0 -30.0 -20.0 -10.0 0.0 10.0 20.0 30.0 40.0
Chile
United States
Colombia
Panama
Uruguay
Mexico
Brazil
Ecuador
Peru
Venezuela
Argentina
Cumulative growth rate in GDP per working age person, relative to the US

What happened?
• Two stories
• Sudden stops and original sin
• Wrong growth theory

As in the early 1980s, capital flows suffered a “sudden stop”
Total debt flows
-40
-30
-20
-10
0
10
20
30
40
50
1971 1975 1979 1983 1987 1991 1995 1999
-200
-150
-100
-50
0
50
100
150Latin America Others

Where did the “sudden stop” come from?
From the Original Sin

The Original Sin:the impossibility to borrow abroad in
domestic currency
An alternative explanation of the causes of financial problems in
emerging countries

The global portfolio
0
0.1
0.2
0.3
0.4
0.5
0.6
0.7
0.8
0.9
1
United States EUROLAND Japan U.K Switzerland Canada Australia
Debt by Country
Debt byCurrency
(0.9857)
(0.8859)

The Original Sin:an alternative hyphotesis
• Most countries cannot borrow abroad in their own currency.
• If they accumulate a net foreign debt, then there will be an unhedgeable aggregate currency mismatch
• This makes movements in the exchange rate affect the income and the balance sheet of the nation
• …making depreciations contractionary
• …limiting the effectiveness of monetary policy and the capacity of the Central Bank to act as a lender of last resort
• …and creates the possibility of self-fulfilling crises

For countries that suffer from OS what matters is the capacity to
pay measured in US $

…by this measure they are 8 times more volatile
Industrial Developing LAC Real GDP volatility 2.0% 4.7% 4.5%US$ GDP volatility 11.8% 16.3% 14.8%
This is the relevant measure if you borrow in US$

Movements of exchange rates are large and persistent
Industrial Developing LAC Real GDP volatility 2.0% 4.7% 4.5%US$ GDP volatility 11.8% 16.3% 14.8%Gap in RER 5-y MA 19.7% 84.5% 91.8%
This is the maximum gap between 5-yearMoving average of the real exchange rate

An international solution
• We propose an index based on an inflation-adjusted basket of EM currencies– Historically it shows trend appreciation, low
volatility and negative correlation with industrial country consumption
• We propose that the WB, the IDB and other IFIs and other G-7 governments issue debt in this index

Step 1. Develop a new Index
• Develop the new Index EM(Unit of Account)– Based on a basket of emerging market currencies – Indexed to each country’s inflation– Weights based on GDP - PPC
• This Index exhibits – Trend appreciation– Low volatility (Less than the DM/$ or Yen/$)– Negative correlation with G-10 consumption
• Excellent for rich country’s portfolio diversification

0.3
0.5
0.7
0.9
1.1
1.3
1.5
1.7
198
0Q1
198
1Q1
198
2Q1
198
3Q1
198
4Q1
198
5Q1
198
6Q1
198
7Q1
198
8Q1
198
9Q1
199
0Q1
199
1Q1
199
2Q1
199
3Q1
199
4Q1
199
5Q1
199
6Q1
199
7Q1
199
8Q1
199
9Q1
200
0Q1
200
1Q1
20 in the 80's
22 from 93-02
DM Index
Yen Index
EM is stable

Appreciation, stability, risk diversification
Table 20: EM Indexes: Average return, standard deviation and correlation with realprivate consumption.
EM Index 80 (1980-2001) EM Index 93 (1993-2001)Avg. Return St Dev Consumption
Correlation 1Avg. Return St Dev Consumption
Correlation 1
Canada 1.56 10.9 -14.5 1.49 10.5 -33.4France 2.58 13.6 -25.9 2.92 10.2 -36.4Germany 0.73 14.3 12.5 3.14 10.5 -14.5Italy 4.22 14.0 -27.5 3.36 11.1 15.8Spain 4.50 12.9 -62.0 4.30 10.5 -65.4Japan -3.12 13.9 4.3 0.13 11.8 34.3United Kingdom 2.45 12.2 -35.3 -0.24 11.8 -21.4United States 0.27 11.3 -23.4 -0.71 11.6 -25.51Note: Correlations with Real Consumption: for France, Germany, Italy and Spain it covers 1980-1998.
For Canada, UK, US and Japan it covers 1980-01. A negative number indicates that the returns tend to be high when realprivate consumption is low.

Step 2. Have the World Bank and other IFIs issue debt in EMs
• IFIs are AAA, so they have access to a broad asset class• They can hedge their currency exposure by converting
loans to EM-index members into indexed local currency loans– They become a solution, not a cause of OS
• Regional IFIs can swap with the WB or the governments themselves for non-regional index members
• WB would calculate index lowering manipulation risk

Step 3. Have G-7 countries issue debt denominated in index
• Also high-grade non-residents with an interest in lowering global risks
• Swap currency exposure with EM-member countries– This gets read of the mismatch
• Need not cost them anything– Make sure by providing put-option on the price of the
swap
• The swap is much safer than sovereign risk and can be made safer

Additional roles for the IDB
• Develop a long-term fixed rate market for IDB loans in Latin American currencies in NY
• This will eliminate sovereign risk from limiting the development of long-term peso markets
• Bonds would be denominated in pesos but would be payable in US$ under NY law
• They could be either nominal or inflation-• This will allow the IDB to lend long term in the
same terms

Revisiting Growth Theories and Policies

A synthetic view of growth strategies
Y = (1-τ) A kα
Private income = appropiability x productivity x accumulated factors

Strategy 1: Accelerate factor accumulation
• Increase domestic savings• Public savings• Improved financial systems• Social security reform
• Facilitate access to foreign savings• Official international lending• Open capital account
• Promote education• Increase allocations and improve effectiveness
Strategy 2. Improve expected appropriability
• Adopt low and predictable taxes• Reduce the probability of expropriation through macro
crises– Fiscal sustainability– Financial soundness– External balance
• Improve contractability– Capital, labor, foreign trade and investment
• Improve property rights protection and justice• Reduce corruption, crime• Assure political stability and governance

Strategy 3. Increase productivity
• Do’s– Through education, although watch out for
excessive university spending– Through openness to foreign trade and
investment, although watch out for subsidies, protection
– Through complementary public investment, although watch out for “picking winners”
– Through intellectual property rights protection

How to construct an overall strategy?
• The ‘best practice’ checklist approach– Go through the list and compare current situation to
some benchmark– Focus improvements on the most glaring lags
• Problems with the approach– No guarantee that identified sectors constitute an
important binding constraint– No account of the interaction between areas of policy– Easy to confuse cause and effect
• E.g. Lack of growth may complicate fiscal balance or political support for policies

An alternative view
• Factor accumulation is more the consequence than the cause of growth opportunities– Growth accelerations preceed savings accelerations– Growth generates demands for factors. If they are not
adequately supplied, returns go up, encouraging more factor accumulation
– Increases in factor endowments without increased demand for them lowers their returns
• In education, 1 more year of education lowers returns by about 1.5 percent
– Capital - both physical and human - can move to other countries

An alternative view
• Appropriability has been improved through Washington Consensus policies
• More things remain to be done, but in the high reform countries, the additional pay-off does not appear too large– Many reforms reduce the expected cost of future
expropriations, – but current returns should be high and are not
• Without growth, political and fiscal stability are harder to sustain, while the likelihood that rules will be changed is increased

The self-discovery hypothesis
• Most developing countries do not invent new products
• They find out which of a potentially very large set of products they can profitable make in their countries
• However, finding out can be very costly– you have to use a trial and error approach
• However, once shown to be feasible, the idea can be more easily copied– E.g. you can profitably grow peaches in Chile, but not
apples
The self-discovery hypothesis (cont’d)
• In the non-tradable sector the innovator, by definition, becomes a monopolist– Monopoly rents may provide incentives for innovation
• In the tradable sector, the national innovator enters an already competitive market and hence does not expect the monopoly rents that accrue to global innovators or domestic innovators in the non-tradable sector
• This means that there is a systematic innovation bias against tradables (exports). – This helps explain the large PPP adjustment between rich
and poor countries

The self-discovery hypothesis (cont’d)
• Exports tend to be very highly concentrated in few activities
• Over the long run, growth depends in finding out new sectors
• Once a sector is “discovered”, it will have specific technological and human capital requirement as well as specific complementary investments. Costs may decline further over time
• This creates potential increasing returns and scale effects, which create other forms of market failure

The self-discovery hypothesis (cont’d)
• This approach helps explain why the growth impact of reform may have been larger in the initial period than in the long run– Reforms facilitate the diffusion of existing new ideas, but not the
discovery of new ones
• It also helps explain why the Chilean experience has been so hard to copy– self-discovery in fruit, wine, fishing, mining and forestry– Copying the same macro institutions and policies need not generate
similar growth– Many of these self-discoveries predate the growth boom
• It helps explain why El Salvador has not fully recovered pre-civil war income levels– It lost sugar, cotton and coffee but lacks equivalent substitute ideas

Self-discovery: policy implications
• The market outcome is inefficient. There are low private returns to innovation. Governments can improve things
• …but governments do not know where to invest. They can promote self-discovery,
• …but they need to let bad ideas die• While in principle they can do so across the board,
they will inevitably be forced to pick sectors– Milton Friedman vs. Isaiah Berlin– Complementary investments are sector specific

Self-discovery: policy implications
• There is a trade-off between market failure and government failure– Rent-seeking
– Inefficient subsidies: promote things that would have happened anyway
– Self-discovery vs. artificial life support
• The challenge is to make this trade-off less binding – push the feasible frontier out

What should governments be willing to do?
• Focus on new ideas– Innovators, i.e. demonstration projects, not copycats– Trade protection and multi-sector loans do not
discriminate between them
• Identify ways to be helpful• …but this involves discretion
– Limit its abuse through delegation and accountability
• In general, lending in market terms is not enough– Interventions that are potentially more costly are
required

What should governments be willing to do?
• Subsidize technological adaptation– Fundacion Chile and Salmon– Competitive grants
• Subsidize on-the-job training by paying for a certain proportion of the first year’s wage bill– Compatible with WTO rules
• Participate as share-holder or subordinated lender• Provide complementary investments and adjust
inefficient rules or regulations– Constructive role for the “Cámaras de Comercio”– Impose positive NPV fiscal impact rule

Self-discovery and FDI
• What is special about FDI?– Foreign companies know how to do something, but do
not know if they can do it in your country– They face a similar problem
• Same principles apply– Demonstration projects, training subsidies, equity,
subordinated lending, complementary investments, regulatory adjustments
• Active promotion seems to be required– Identify and lobby potential investors

Role for the IDB
• Support these kinds of programs• Develop a best-practice approach on the kind of
institution that can adequately manage discretion in this area– Independent board with potential foreign participation– Evaluation, transparency and accountability
• Should these institutions be nationally or regionally based?– Innovations could be applicable to more than one
country