Embed Size (px)
Citation preview
REITworld: 2018 Annual Conference
San Francisco, CA
November 7, 2018
Prologis Park Ports Jersey City, Jersey City, New Jersey
This presentation includes certain terms and non-GAAP financial measures that are not specifically defined herein. These terms and
financial measures are defined and, in the case of the non-GAAP financial measures, reconciled to the most directly comparable GAAP
measure, in our third quarter Earnings Release and Supplemental Information that is available on our investor relations website at
www.ir.prologis.com and on the SEC’s website at www.sec.gov.
The statements in this document that are not historical facts are forward-looking statements within the meaning of Section 27A of the
Securities Act of 1933, as amended, and Section 21E of the Securities Exchange Act of 1934, as amended. These forward-looking
statements are based on current expectations, estimates and projections about the industry and markets in which we operate as well as
management’s beliefs and assumptions. Such statements involve uncertainties that could significantly impact our financial results.
Words such as “expects,” “anticipates,” “intends,” “plans,” “believes,” “seeks,” “estimates” and variations of such words and similar
expressions are intended to identify such forward-looking statements, which generally are not historical in nature. All statements that
address operating performance, events or developments that we expect or anticipate will occur in the future — including statements
relating to rent and occupancy growth, development activity and changes in sales or contribution volume of properties, disposition
activity, general conditions in the geographic areas where we operate, our debt, capital structure and financial position, our ability to
form new co-investment ventures and the availability of capital in existing or new co-investment ventures — are forward-looking
statements. These statements are not guarantees of future performance and involve certain risks, uncertainties and assumptions that
are difficult to predict. Although we believe the expectations reflected in any forward-looking statements are based on reasonable
assumptions, we can give no assurance that our expectations will be attained and therefore, actual outcomes and results may differ
materially from what is expressed or forecasted in such forward-looking statements. Some of the factors that may affect outcomes and
results include, but are not limited to: (i) national, international, regional and local economic climates, (ii) changes in financial markets,
interest rates and foreign currency exchange rates, (iii) increased or unanticipated competition for our properties, (iv) risks associated
with acquisitions, dispositions and development of properties, (v) maintenance of real estate investment trust status, tax structuring and
income tax rates (vi) availability of financing and capital, the levels of debt that we maintain and our credit ratings, (vii) risks related to
our investments in our co-investment ventures, including our ability to establish new co-investment ventures and funds, (viii) risks of
doing business internationally, including currency risks, (ix) environmental uncertainties, including risks of natural disasters, and (x)
those additional factors discussed in reports filed with the Securities and Exchange Commission by us under the heading “Risk Factors.”
We undertake no duty to update any forward-looking statements appearing in this document.
Forward-looking statements
2
Prologis Park Willebroek, Willebroek-Zuid, Brussels
3
Contents
01 Points of Focus 4
02 Why Logistics Real Estate 11
03 Why Prologis 23
04 Prologis ESG: Ahead of What’s Next 39
Points of Focus
01
Prologis Dartford Littlebrook, Dartford, UK
Amazon Intl Park of Commerce in Tracy, CA
4
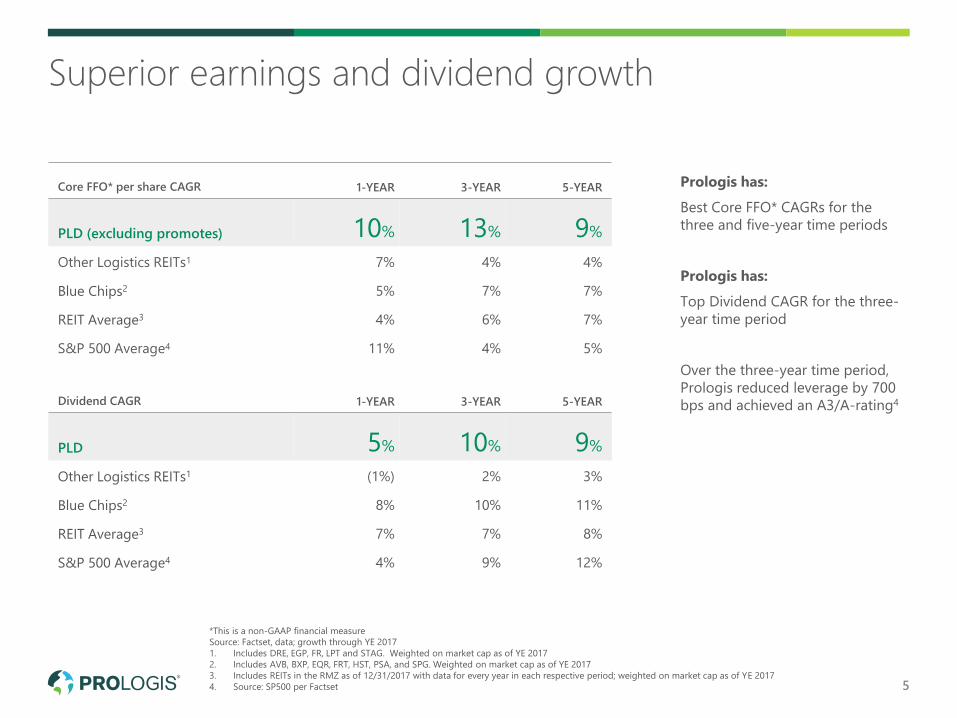
Prologis has:
Best Core FFO* CAGRs for the
three and five-year time periods
Prologis has:
Top Dividend CAGR for the three-
year time period
Over the three-year time period,
Prologis reduced leverage by 700
bps and achieved an A3/A-rating4
5
Superior earnings and dividend growth
*This is a non-GAAP financial measure
Source: Factset, data; growth through YE 2017
1. Includes DRE, EGP, FR, LPT and STAG. Weighted on market cap as of YE 2017
2. Includes AVB, BXP, EQR, FRT, HST, PSA, and SPG. Weighted on market cap as of YE 2017
3. Includes REITs in the RMZ as of 12/31/2017 with data for every year in each respective period; weighted on market cap as of YE 2017
4. Source: SP500 per Factset
Core FFO* per share CAGR 1-YEAR 3-YEAR 5-YEAR
PLD (excluding promotes) 10% 13% 9%
Other Logistics REITs1 7% 4% 4%
Blue Chips2 5% 7% 7%
REIT Average3 4% 6% 7%
S&P 500 Average4 11% 4% 5%
Dividend CAGR 1-YEAR 3-YEAR 5-YEAR
PLD 5% 10% 9%
Other Logistics REITs1 (1%) 2% 3%
Blue Chips2 8% 10% 11%
REIT Average3 7% 7% 8%
S&P 500 Average4 4% 9% 12%
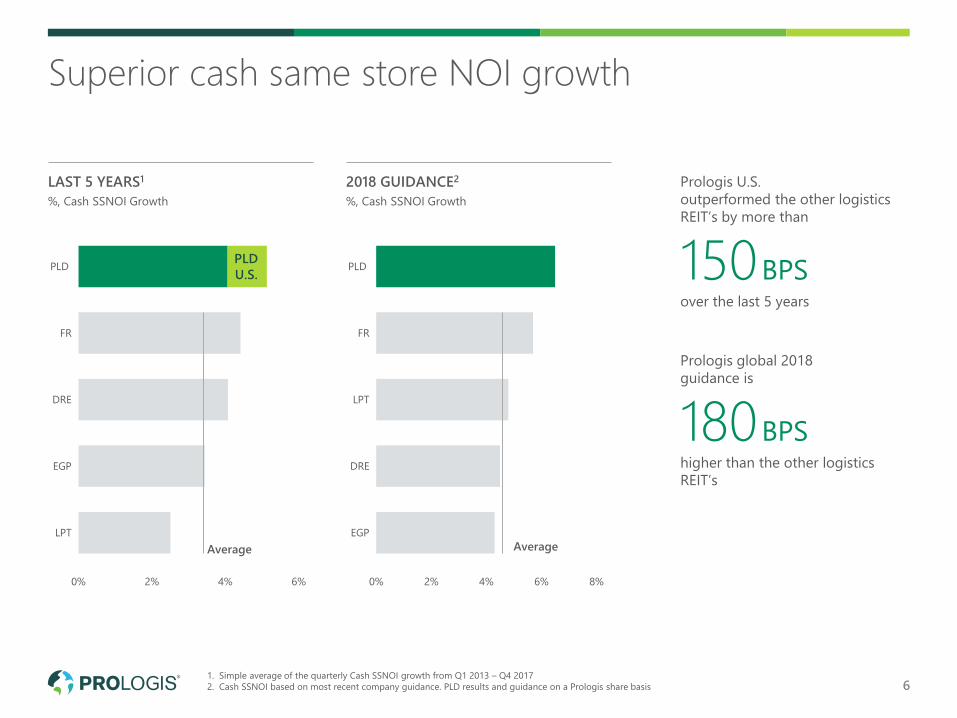
Prologis U.S.
outperformed the other logistics
REIT’s by more than
150BPSover the last 5 years
Prologis global 2018
guidance is
180BPShigher than the other logistics
REIT’s
Superior cash same store NOI growth
LAST 5 YEARS1
%, Cash SSNOI Growth
2018 GUIDANCE2
%, Cash SSNOI Growth
0% 2% 4% 6%
LPT
EGP
DRE
FR
PLD
0% 2% 4% 6% 8%
EGP
DRE
LPT
FR
PLDPLD
U.S.
Average Average
61. Simple average of the quarterly Cash SSNOI growth from Q1 2013 – Q4 2017
2. Cash SSNOI based on most recent company guidance. PLD results and guidance on a Prologis share basis
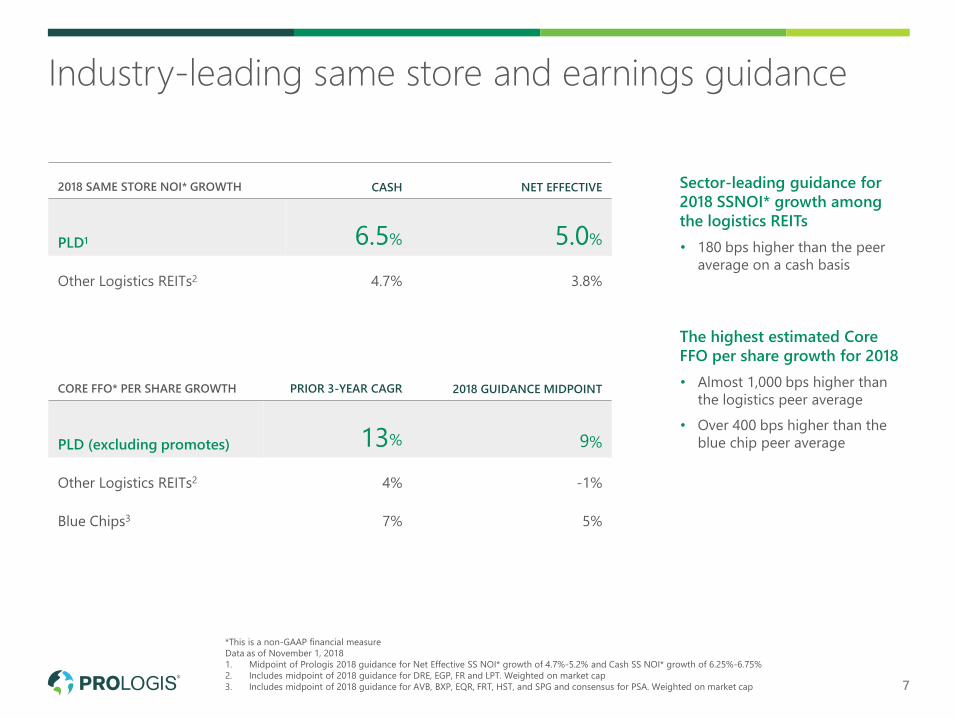
Sector-leading guidance for
2018 SSNOI* growth among
the logistics REITs
• 180 bps higher than the peer
average on a cash basis
The highest estimated Core
FFO per share growth for 2018
• Almost 1,000 bps higher than
the logistics peer average
• Over 400 bps higher than the
blue chip peer average
2018 SAME STORE NOI* GROWTH CASH NET EFFECTIVE
PLD1 6.5% 5.0%
Other Logistics REITs2 4.7% 3.8%
CORE FFO* PER SHARE GROWTH PRIOR 3-YEAR CAGR 2018 GUIDANCE MIDPOINT
PLD (excluding promotes) 13% 9%
Other Logistics REITs2 4% -1%
Blue Chips3 7% 5%
Industry-leading same store and earnings guidance
7
*This is a non-GAAP financial measure
Data as of November 1, 2018
1. Midpoint of Prologis 2018 guidance for Net Effective SS NOI* growth of 4.7%-5.2% and Cash SS NOI* growth of 6.25%-6.75%
2. Includes midpoint of 2018 guidance for DRE, EGP, FR and LPT. Weighted on market cap
3. Includes midpoint of 2018 guidance for AVB, BXP, EQR, FRT, HST, and SPG and consensus for PSA. Weighted on market cap
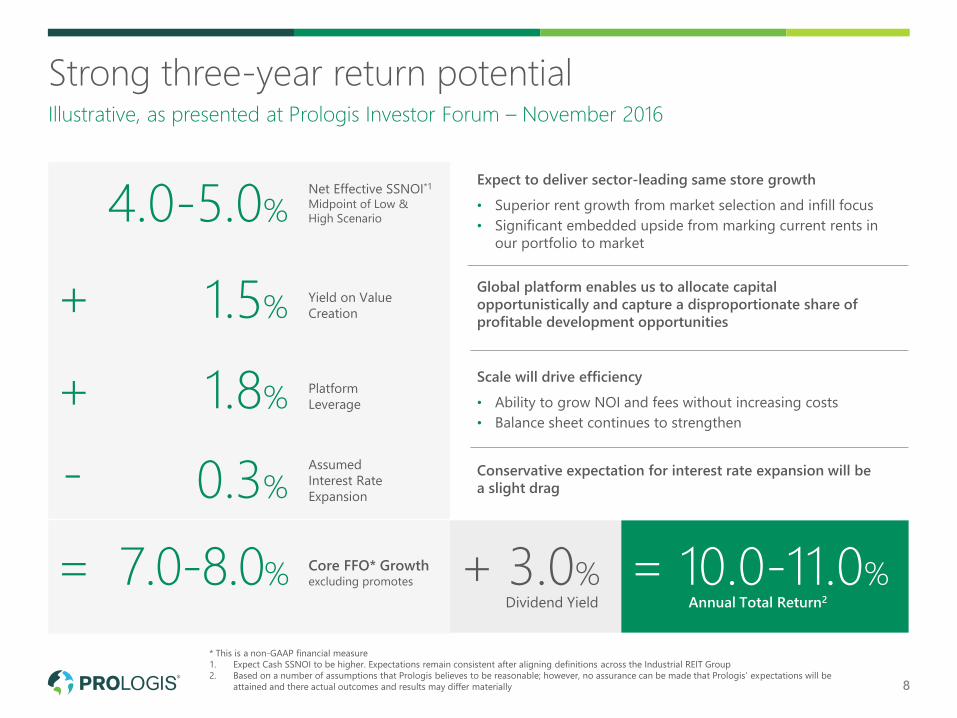
Strong three-year return potential
8
Illustrative, as presented at Prologis Investor Forum – November 2016
* This is a non-GAAP financial measure
1. Expect Cash SSNOI to be higher. Expectations remain consistent after aligning definitions across the Industrial REIT Group
2. Based on a number of assumptions that Prologis believes to be reasonable; however, no assurance can be made that Prologis’ expectations will be
attained and there actual outcomes and results may differ materially
Global platform enables us to allocate capital
opportunistically and capture a disproportionate share of
profitable development opportunities
Conservative expectation for interest rate expansion will be
a slight drag
Scale will drive efficiency
• Ability to grow NOI and fees without increasing costs
• Balance sheet continues to strengthen
Expect to deliver sector-leading same store growth
• Superior rent growth from market selection and infill focus
• Significant embedded upside from marking current rents in
our portfolio to market
4.0-5.0%
+
+
-
= 3.0%Annual Total Return2
10.0-11.0%
1.5%
1.8%
0.3%
7.0-8.0% + =
Net Effective SSNOI*1
Midpoint of Low &
High Scenario
Yield on Value
Creation
Platform
Leverage
Assumed
Interest Rate
Expansion
Core FFO* Growth excluding promotes
Dividend Yield
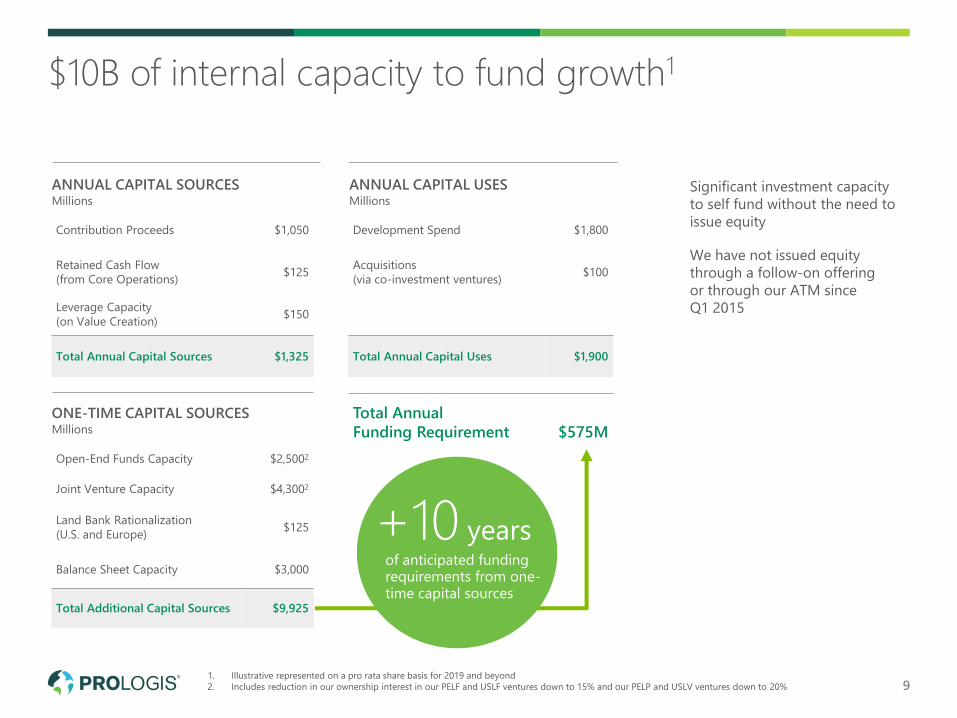
$10B of internal capacity to fund growth1
1. Illustrative represented on a pro rata share basis for 2019 and beyond
2. Includes reduction in our ownership interest in our PELF and USLF ventures down to 15% and our PELP and USLV ventures down to 20% 9
Significant investment capacity
to self fund without the need to
issue equity
We have not issued equity
through a follow-on offering
or through our ATM since
Q1 2015
Development Spend $1,800
Acquisitions
(via co-investment ventures)$100
Total Annual Capital Uses $1,900
Total Annual
Funding Requirement $575M
Contribution Proceeds $1,050
Retained Cash Flow
(from Core Operations)$125
Leverage Capacity
(on Value Creation)$150
Total Annual Capital Sources $1,325
Open-End Funds Capacity $2,5002
Joint Venture Capacity $4,3002
Land Bank Rationalization
(U.S. and Europe)$125
Balance Sheet Capacity $3,000
Total Additional Capital Sources $9,925
Millions
ANNUAL CAPITAL SOURCESMillions
ANNUAL CAPITAL USES
Millions
ONE-TIME CAPITAL SOURCES
+10 yearsof anticipated funding requirements from one-time capital sources
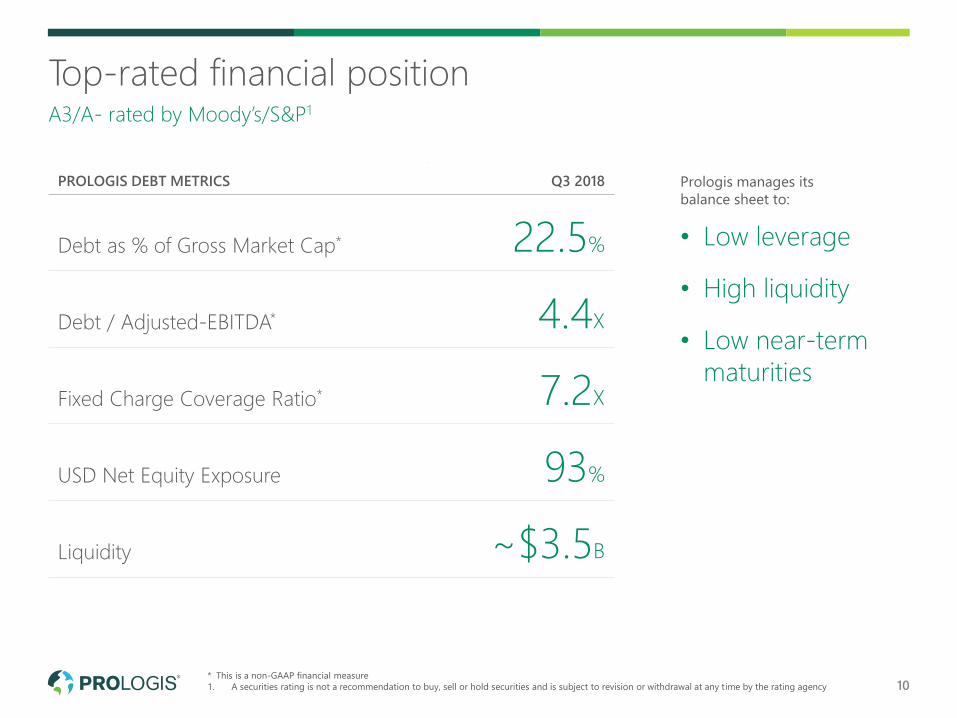
Prologis manages its
balance sheet to:
• Low leverage
• High liquidity
• Low near-term
maturities
* This is a non-GAAP financial measure
1. A securities rating is not a recommendation to buy, sell or hold securities and is subject to revision or withdrawal at any time by the rating agency 10
Top-rated financial positionA3/A- rated by Moody’s/S&P1
PROLOGIS DEBT METRICS Q3 2018
Debt as % of Gross Market Cap* 22.5%
Debt / Adjusted-EBITDA* 4.4X
Fixed Charge Coverage Ratio* 7.2X
USD Net Equity Exposure 93%
Liquidity ~$3.5B
Why Logistics Real Estate
02
Shanghai, China
Amazon Intl Park of Commerce in Tracy, CA
11
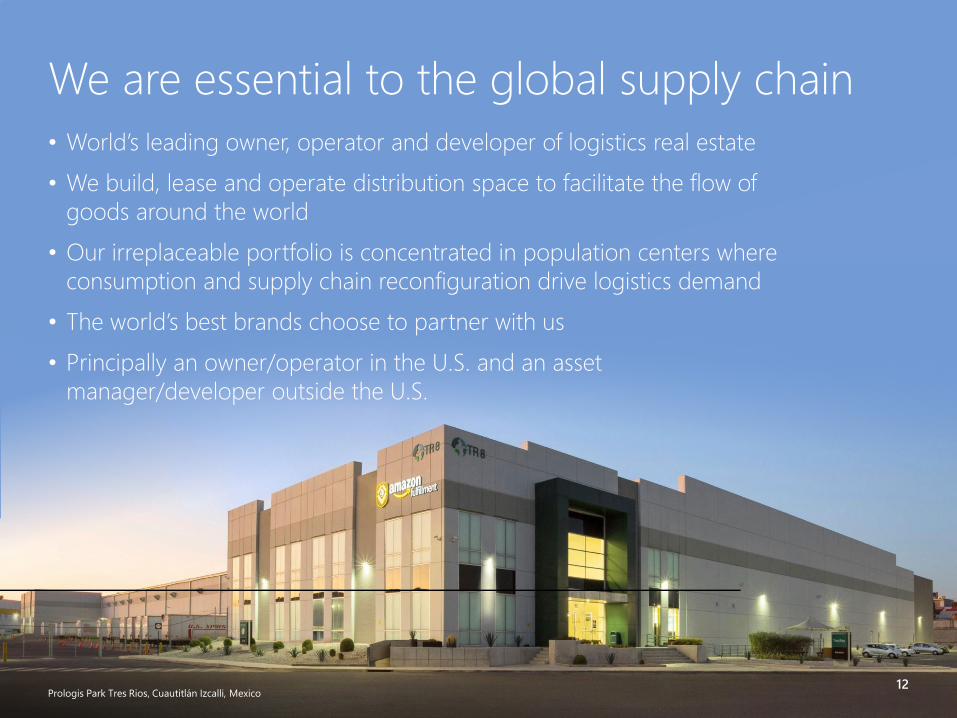
We are essential to the global supply chain
Prologis Park Tres Rios, Cuautitlán Izcalli, Mexico
• World’s leading owner, operator and developer of logistics real estate
• We build, lease and operate distribution space to facilitate the flow of
goods around the world
• Our irreplaceable portfolio is concentrated in population centers where
consumption and supply chain reconfiguration drive logistics demand
• The world’s best brands choose to partner with us
• Principally an owner/operator in the U.S. and an asset
manager/developer outside the U.S.
12
10.010.7
9.4 9.2
6
7
8
9
10
11
12
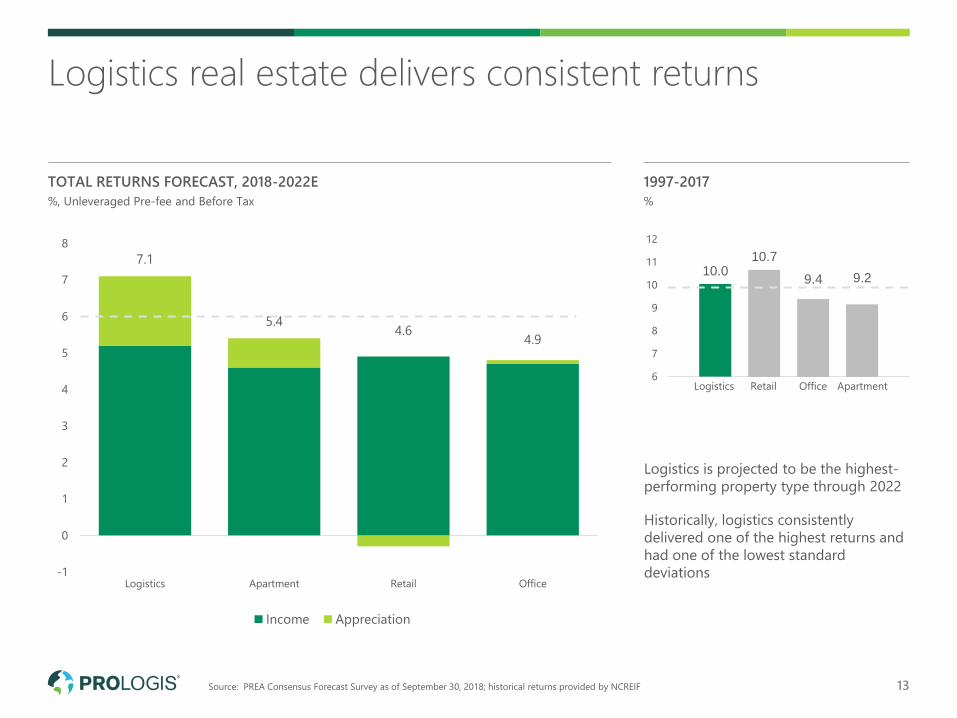
TOTAL RETURNS FORECAST, 2018-2022E
%, Unleveraged Pre-fee and Before Tax
Logistics real estate delivers consistent returns
1997-2017
%
Logistics is projected to be the highest-
performing property type through 2022
Historically, logistics consistently
delivered one of the highest returns and
had one of the lowest standard
deviations
7.1
5.44.6
4.9
-1
0
1
2
3
4
5
6
7
8
Logistics Apartment Retail Office
Income Appreciation
Logistics Retail Office Apartment
Source: PREA Consensus Forecast Survey as of September 30, 2018; historical returns provided by NCREIF 13
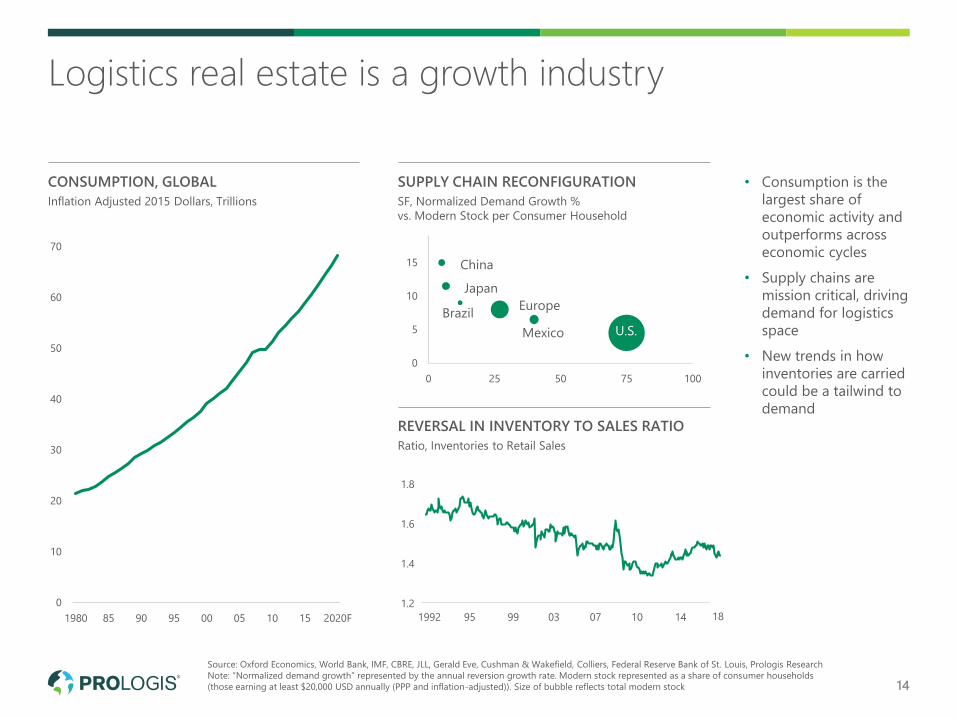
CONSUMPTION, GLOBAL
Inflation Adjusted 2015 Dollars, Trillions
Logistics real estate is a growth industry
SUPPLY CHAIN RECONFIGURATION
SF, Normalized Demand Growth %
vs. Modern Stock per Consumer Household
REVERSAL IN INVENTORY TO SALES RATIO
Ratio, Inventories to Retail Sales
• Consumption is the
largest share of
economic activity and
outperforms across
economic cycles
• Supply chains are
mission critical, driving
demand for logistics
space
• New trends in how
inventories are carried
could be a tailwind to
demand
0
10
20
30
40
50
60
70
1980 85 90 95 00 05 10 15 2020F
0
5
10
15
0 25 50 75 100
U.S.
Europe
Japan
Mexico
Brazil
China
1.2
1.4
1.6
1.8
1992 141007039995
Source: Oxford Economics, World Bank, IMF, CBRE, JLL, Gerald Eve, Cushman & Wakefield, Colliers, Federal Reserve Bank of St. Louis, Prologis Research
Note: “Normalized demand growth” represented by the annual reversion growth rate. Modern stock represented as a share of consumer households
(those earning at least $20,000 USD annually (PPP and inflation-adjusted)). Size of bubble reflects total modern stock 14
18
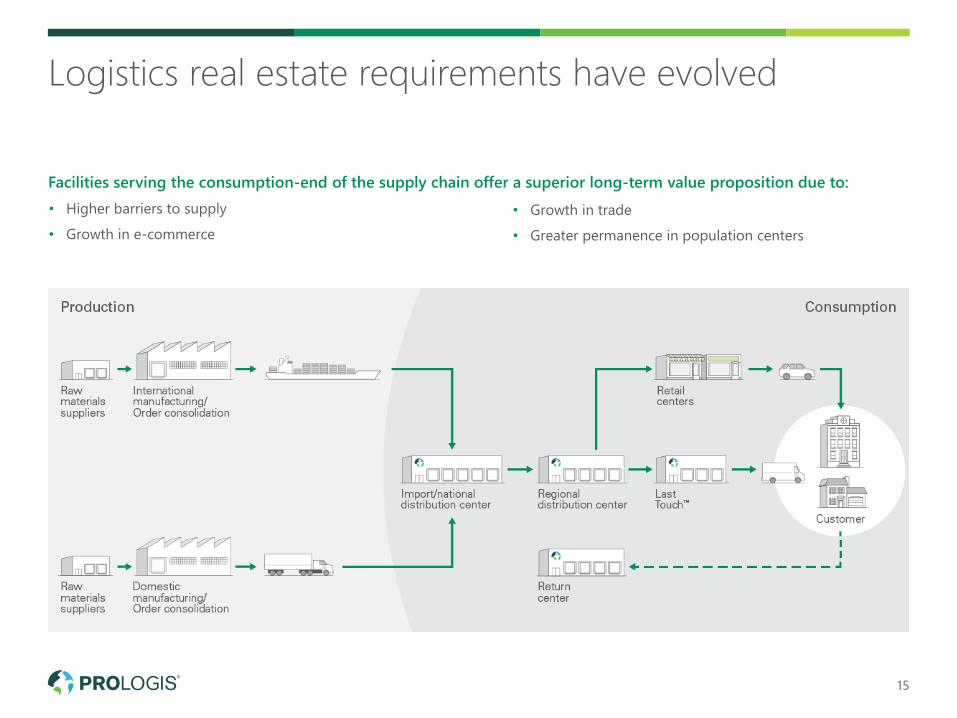
15
Facilities serving the consumption-end of the supply chain offer a superior long-term value proposition due to:
• Higher barriers to supply
• Growth in e-commerce
• Growth in trade
• Greater permanence in population centers
Logistics real estate requirements have evolved
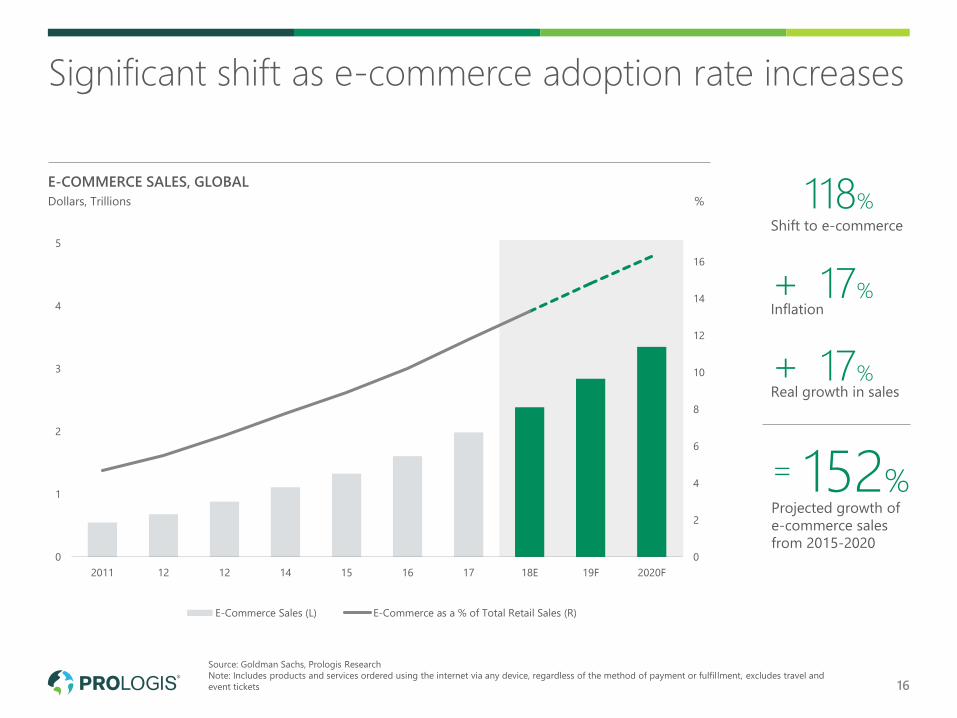
Significant shift as e-commerce adoption rate increases
0
2
4
6
8
10
12
14
16
0
1
2
3
4
5
2011 12 12 14 15 16 17 18E 19F 2020F
E-Commerce Sales (L) E-Commerce as a % of Total Retail Sales (R)
Source: Goldman Sachs, Prologis Research
Note: Includes products and services ordered using the internet via any device, regardless of the method of payment or fulfillment, excludes travel and
event tickets 16
E-COMMERCE SALES, GLOBAL
Dollars, Trillions %
Projected growth of
e-commerce sales
from 2015-2020
118%
17%
17%
+
+
=
Shift to e-commerce
Inflation
Real growth in sales
152%
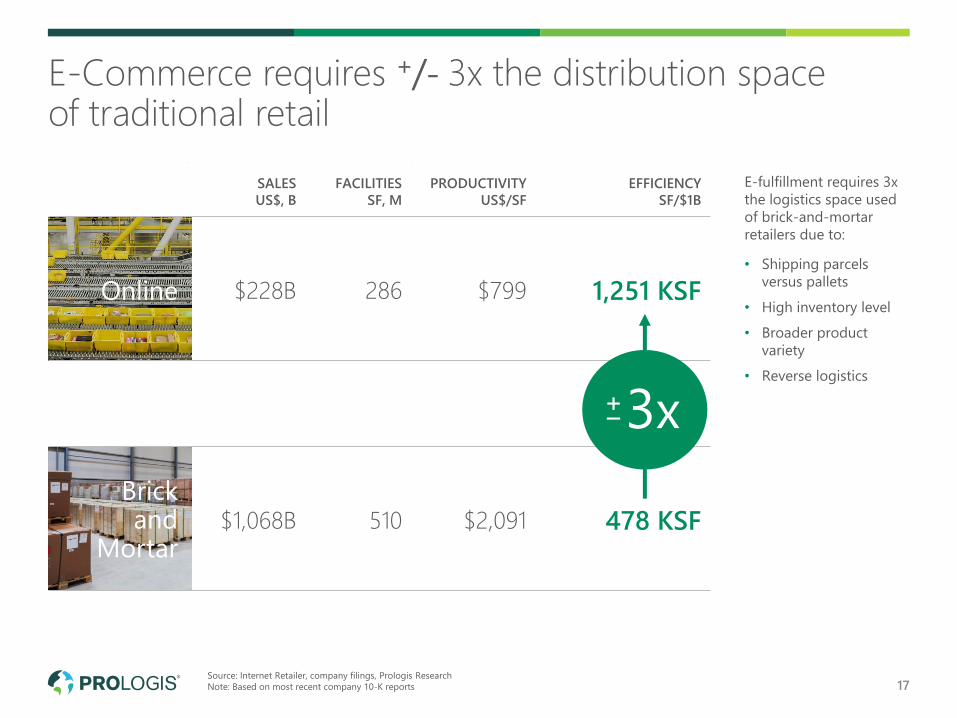
SALES
US$, B
FACILITIES
SF, M
PRODUCTIVITY
US$/SF
EFFICIENCY
SF/$1B
Online $228B 286 $799 1,251 KSF
Brick and
Mortar$1,068B 510 $2,091 478 KSF
17
E-Commerce requires +/- 3x the distribution space of traditional retail
E-fulfillment requires 3x
the logistics space used
of brick-and-mortar
retailers due to:
• Shipping parcels
versus pallets
• High inventory level
• Broader product
variety
• Reverse logistics
3x+–
Source: Internet Retailer, company filings, Prologis Research
Note: Based on most recent company 10-K reports
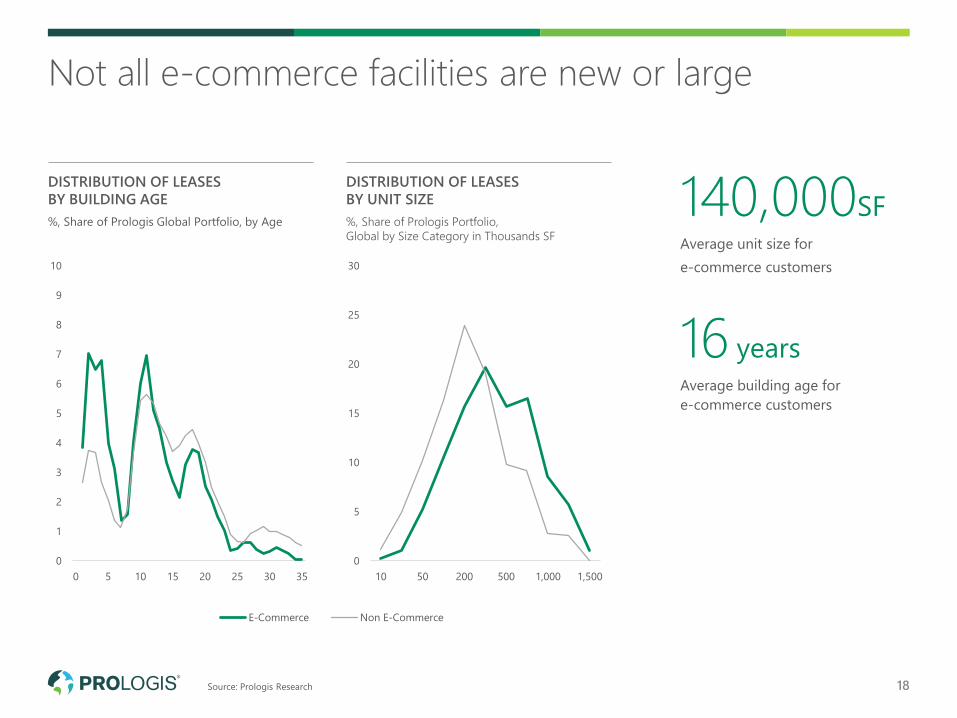
Source: Prologis Research
Not all e-commerce facilities are new or large
DISTRIBUTION OF LEASES
BY BUILDING AGE
%, Share of Prologis Global Portfolio, by Age
DISTRIBUTION OF LEASES
BY UNIT SIZE
%, Share of Prologis Portfolio,
Global by Size Category in Thousands SF
140,000SF
Average unit size for
e-commerce customers
16 years
Average building age for
e-commerce customers
0
1
2
3
4
5
6
7
8
9
10
0 5 10 15 20 25 30 35
E-Commerce Non E-Commerce
0
5
10
15
20
25
30
10 50 200 500 1,000 1,500
18
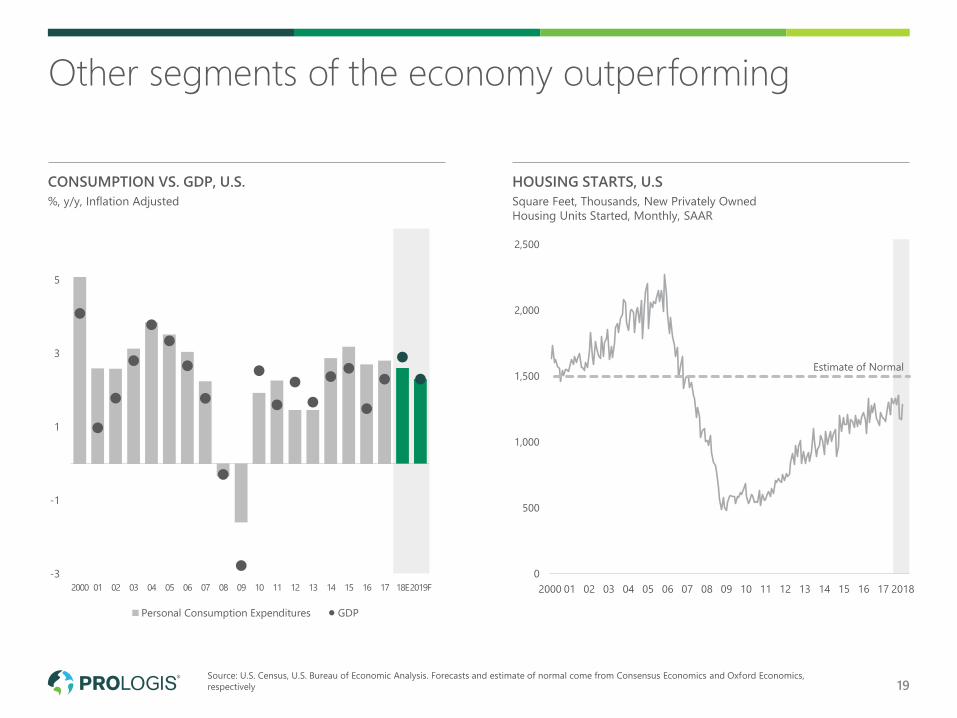
Source: U.S. Census, U.S. Bureau of Economic Analysis. Forecasts and estimate of normal come from Consensus Economics and Oxford Economics,
respectively
-3
-1
1
3
5
2000 01 02 03 04 05 06 07 08 09 10 11 12 13 14 15 16 17 18E2019F
Personal Consumption Expenditures GDP
0
500
1,000
1,500
2,000
2,500
Other segments of the economy outperforming
HOUSING STARTS, U.S
Square Feet, Thousands, New Privately Owned
Housing Units Started, Monthly, SAAR
CONSUMPTION VS. GDP, U.S.
%, y/y, Inflation Adjusted
Estimate of Normal
2000 2018060504030201 07 08 09 10 11 12 13 14 15 16 17
19
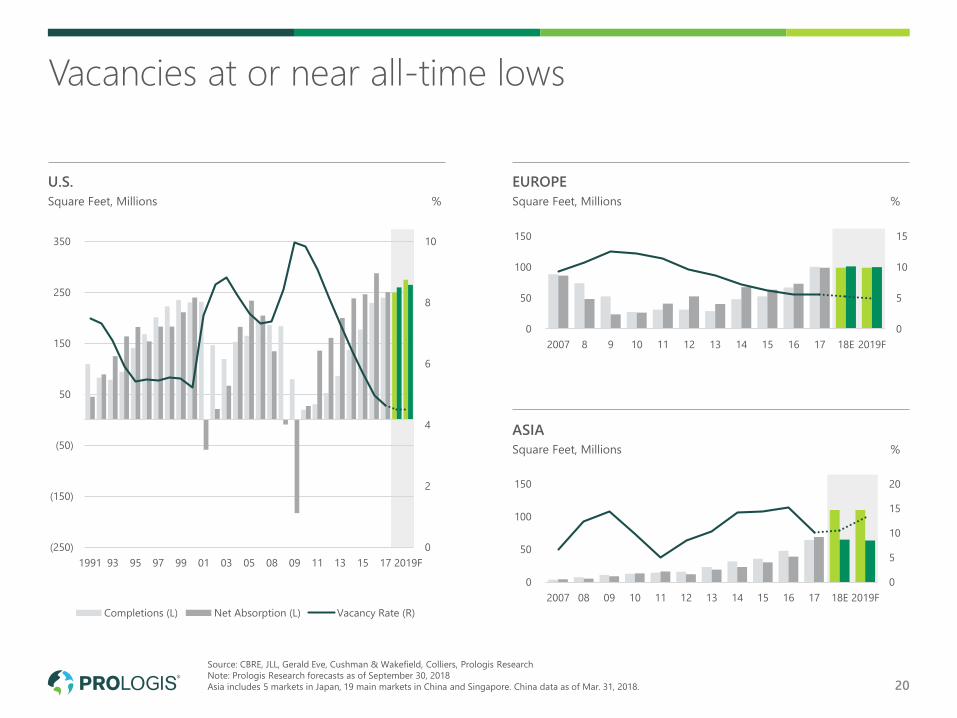
Source: CBRE, JLL, Gerald Eve, Cushman & Wakefield, Colliers, Prologis Research
Note: Prologis Research forecasts as of September 30, 2018
Asia includes 5 markets in Japan, 19 main markets in China and Singapore. China data as of Mar. 31, 2018.
0
2
4
6
8
10
(250)
(150)
(50)
50
150
250
350
1991 93 95 97 99 01 03 05 08 09 11 13 15 17 2019F
Completions (L) Net Absorption (L) Vacancy Rate (R)
0
5
10
15
0
50
100
150
2007 8 9 10 11 12 13 14 15 16 17 18E 2019F
0
5
10
15
20
0
50
100
150
2007 08 09 10 11 12 13 14 15 16 17 18E 2019F
Vacancies at or near all-time lows
U.S.
Square Feet, Millions %
EUROPE
Square Feet, Millions %
ASIA
Square Feet, Millions %
20
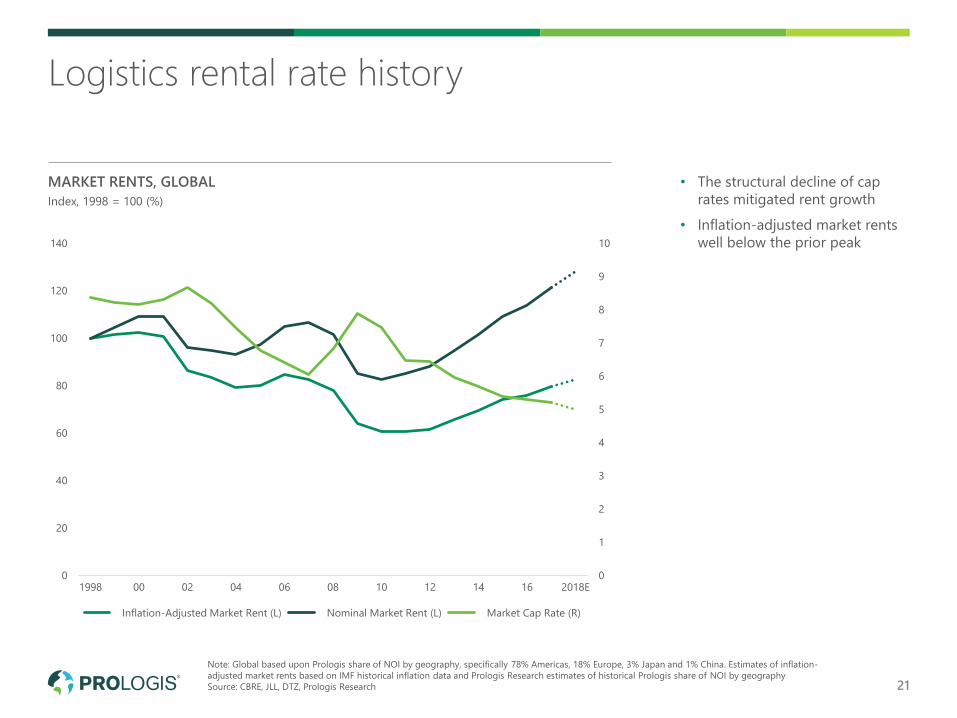
• The structural decline of cap
rates mitigated rent growth
• Inflation-adjusted market rents
well below the prior peak
0
1
2
3
4
5
6
7
8
9
10
0
20
40
60
80
100
120
140
1998 00 02 04 06 08 10 12 14 16 2018E
Inflation-Adjusted Market Rent (L) Nominal Market Rent (L) Market Cap Rate (R)
Note: Global based upon Prologis share of NOI by geography, specifically 78% Americas, 18% Europe, 3% Japan and 1% China. Estimates of inflation-
adjusted market rents based on IMF historical inflation data and Prologis Research estimates of historical Prologis share of NOI by geography
Source: CBRE, JLL, DTZ, Prologis Research
MARKET RENTS, GLOBAL
Index, 1998 = 100 (%)
Logistics rental rate history
21
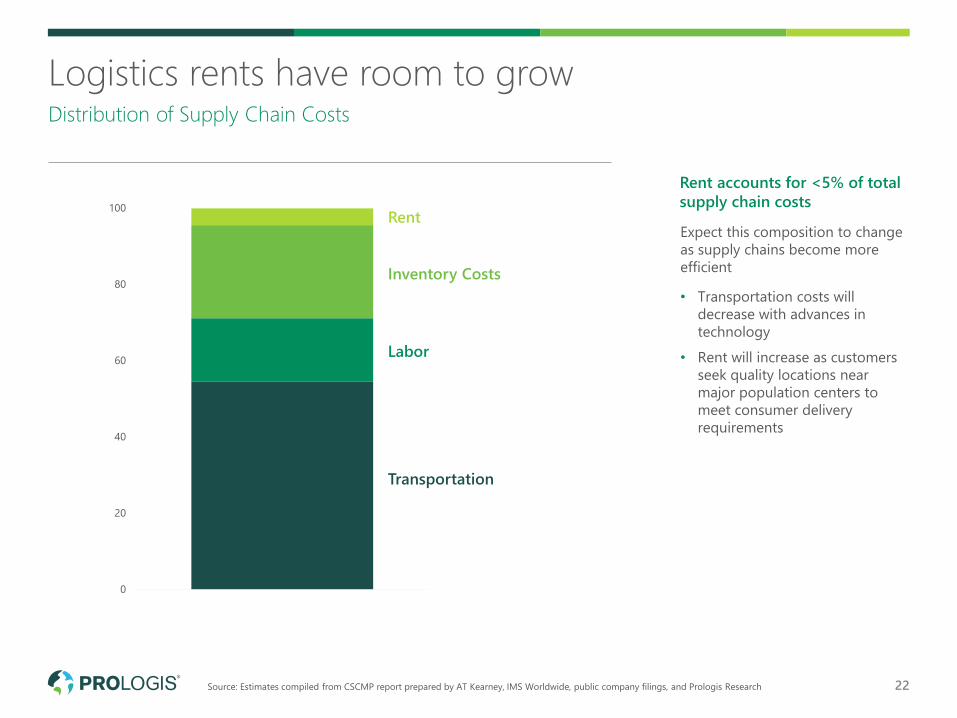
Rent accounts for <5% of total
supply chain costs
Expect this composition to change
as supply chains become more
efficient
• Transportation costs will
decrease with advances in
technology
• Rent will increase as customers
seek quality locations near
major population centers to
meet consumer delivery
requirements
Source: Estimates compiled from CSCMP report prepared by AT Kearney, IMS Worldwide, public company filings, and Prologis Research
Logistics rents have room to growDistribution of Supply Chain Costs
0
20
40
60
80
100
22
Rent
Inventory Costs
Labor
Transportation
Why Prologis
03
Ground breaking at Prologis Park Grande, Mexico City, Mexico
23
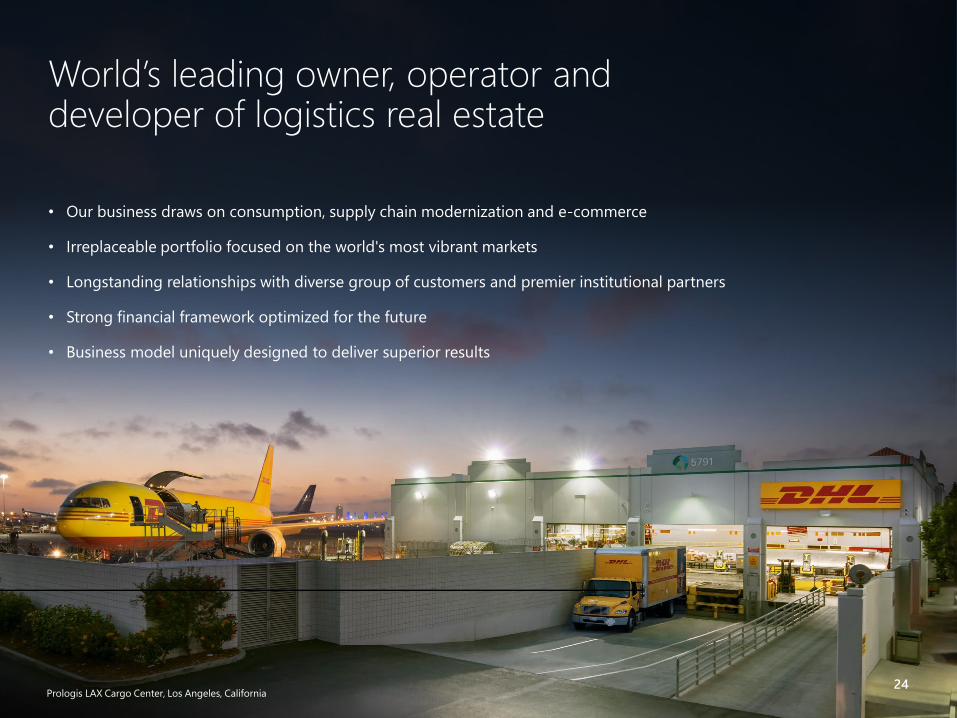
World’s leading owner, operator and developer of logistics real estate
Prologis LAX Cargo Center, Los Angeles, California
• Our business draws on consumption, supply chain modernization and e-commerce
• Irreplaceable portfolio focused on the world's most vibrant markets
• Longstanding relationships with diverse group of customers and premier institutional partners
• Strong financial framework optimized for the future
• Business model uniquely designed to deliver superior results
24
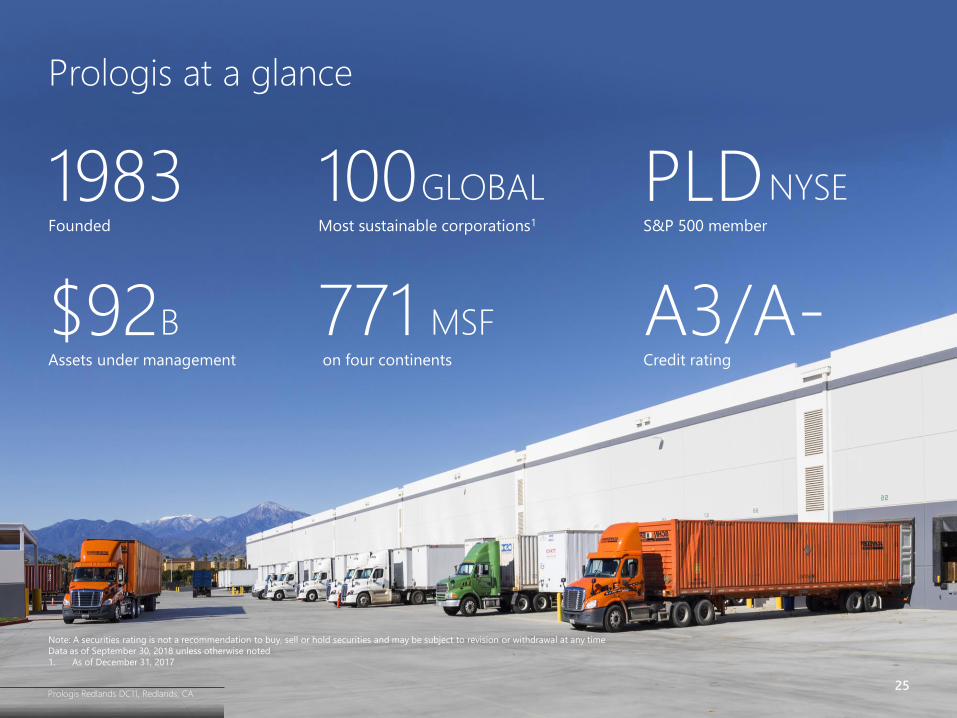
Prologis Redlands DC11, Redlands, CA
Prologis at a glance
Note: A securities rating is not a recommendation to buy, sell or hold securities and may be subject to revision or withdrawal at any time
Data as of September 30, 2018 unless otherwise noted
1. As of December 31, 2017
1983 100GLOBAL
$92B 771 MSF
PLDNYSE
A3/A-
Founded Most sustainable corporations1
Assets under management on four continents
S&P 500 member
Credit rating
25
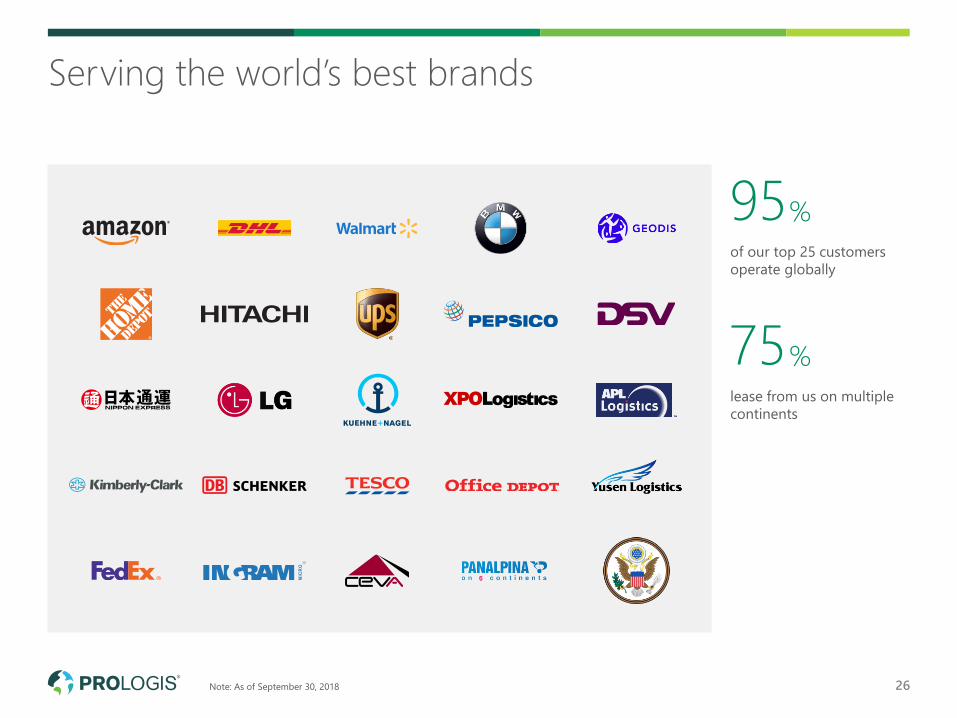
26
Serving the world’s best brands
of our top 25 customers
operate globally
95%
lease from us on multiple
continents
75%
Note: As of September 30, 2018
E-commerce
Manufacturing Transport / Freight Distribution
0
10
20
30
40
50
60
70
80
90
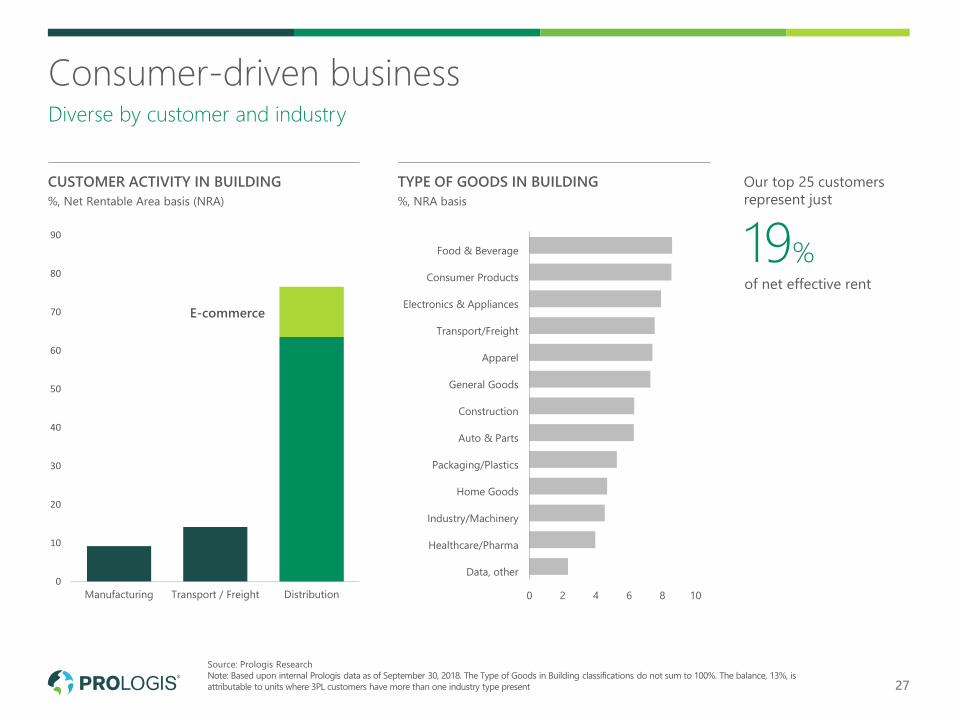
27
CUSTOMER ACTIVITY IN BUILDING
%, Net Rentable Area basis (NRA)
Consumer-driven businessDiverse by customer and industry
Data, other
Healthcare/Pharma
Industry/Machinery
Home Goods
Packaging/Plastics
Auto & Parts
Construction
General Goods
Apparel
Transport/Freight
Electronics & Appliances
Consumer Products
Food & Beverage
0 2 4 6 8 10
TYPE OF GOODS IN BUILDING
%, NRA basis
Our top 25 customers
represent just
19%of net effective rent
Source: Prologis Research
Note: Based upon internal Prologis data as of September 30, 2018. The Type of Goods in Building classifications do not sum to 100%. The balance, 13%, is
attributable to units where 3PL customers have more than one industry type present
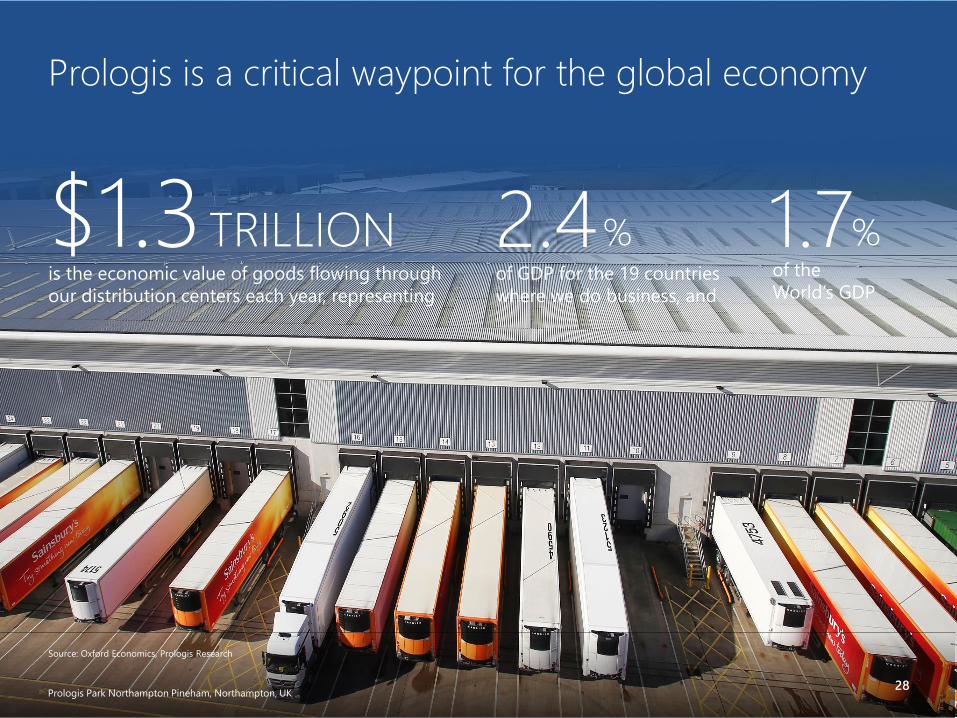
Prologis Park Northampton Pineham, Northampton, UK
Prologis is a critical waypoint for the global economy
$1.3TRILLIONis the economic value of goods flowing through
our distribution centers each year, representing
2.4%of GDP for the 19 countries
where we do business, and
1.7%of the
World’s GDP
Source: Oxford Economics, Prologis Research
28
PLD Other Logistics REITs
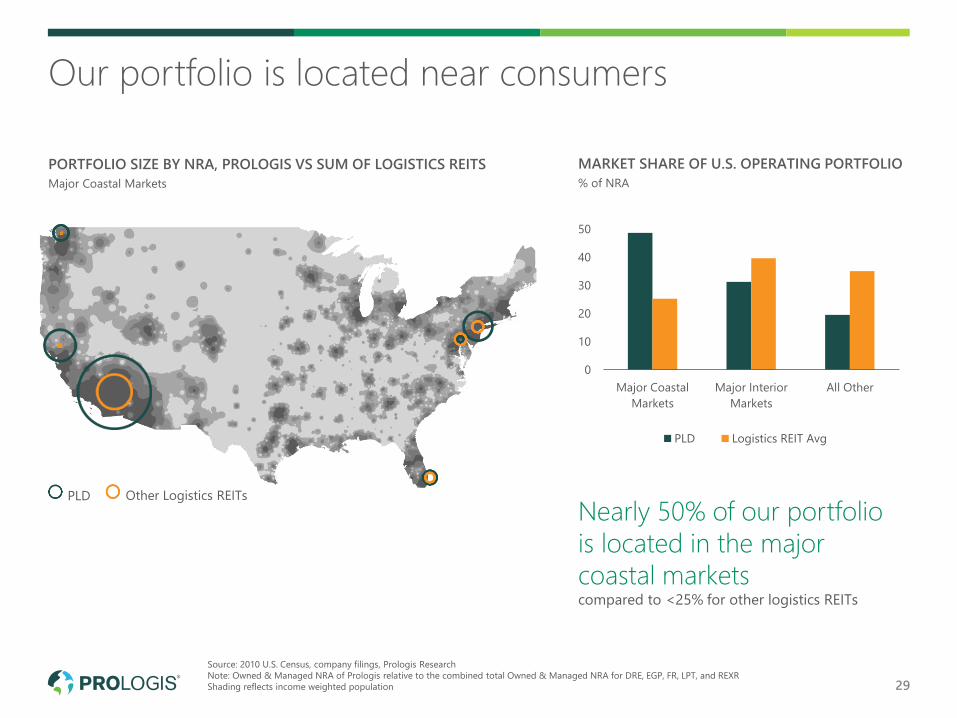
Our portfolio is located near consumers
29
PORTFOLIO SIZE BY NRA, PROLOGIS VS SUM OF LOGISTICS REITS
Major Coastal Markets
Nearly 50% of our portfolio
is located in the major
coastal marketscompared to <25% for other logistics REITs
0
10
20
30
40
50
Major Coastal
Markets
Major Interior
Markets
All Other
PLD Logistics REIT Avg
MARKET SHARE OF U.S. OPERATING PORTFOLIO
% of NRA
Source: 2010 U.S. Census, company filings, Prologis Research
Note: Owned & Managed NRA of Prologis relative to the combined total Owned & Managed NRA for DRE, EGP, FR, LPT, and REXR
Shading reflects income weighted population
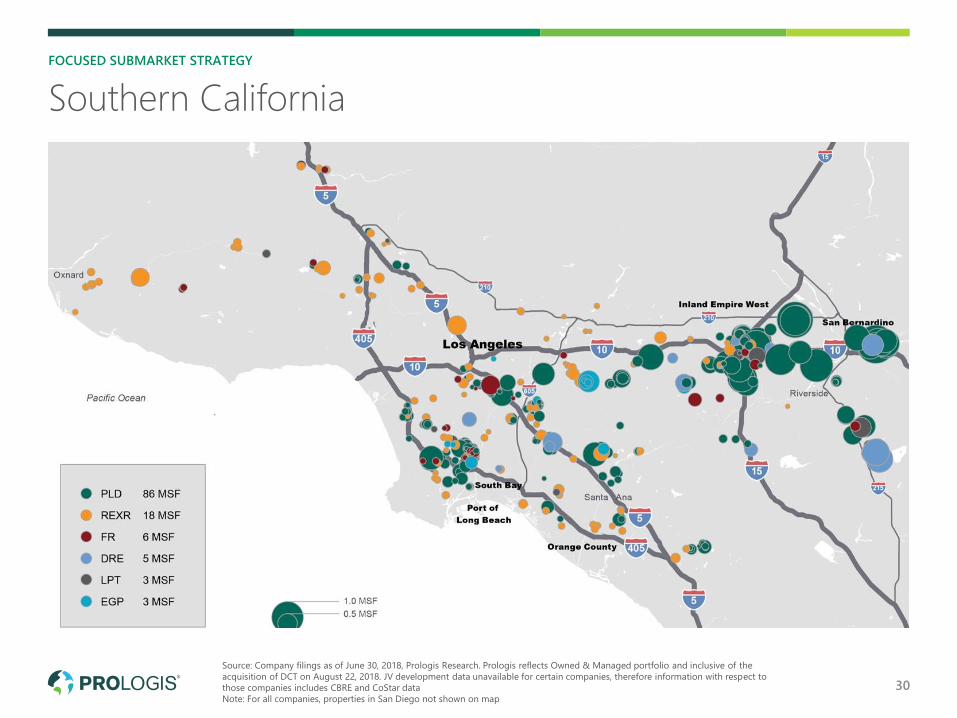
FOCUSED SUBMARKET STRATEGY
Southern California
Source: Company filings as of June 30, 2018, Prologis Research. Prologis reflects Owned & Managed portfolio and inclusive of the
acquisition of DCT on August 22, 2018. JV development data unavailable for certain companies, therefore information with respect to
those companies includes CBRE and CoStar data
Note: For all companies, properties in San Diego not shown on map
30
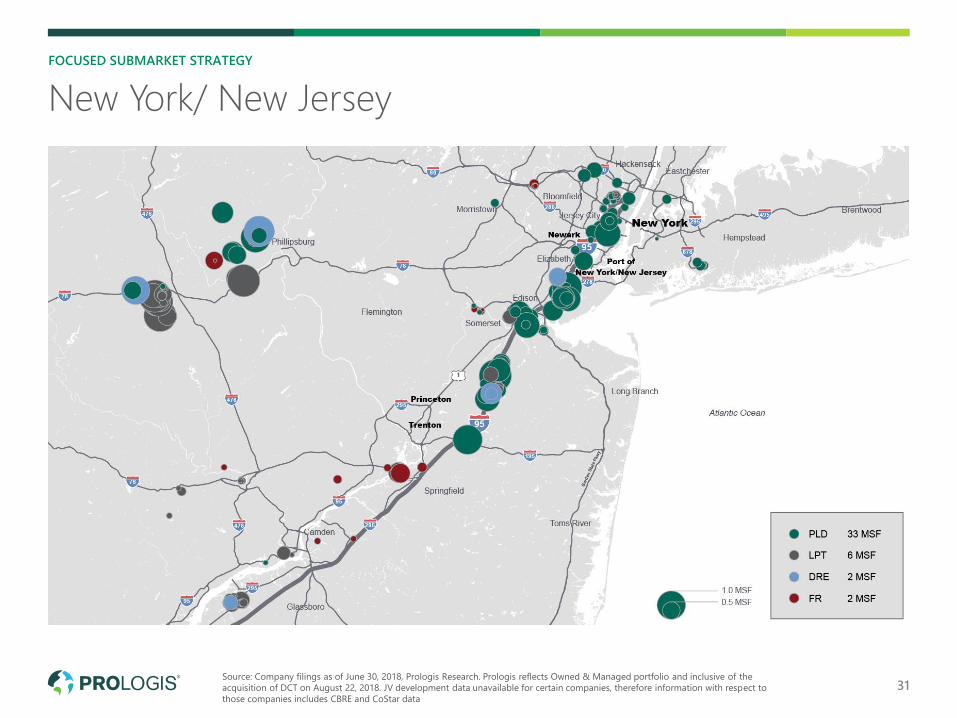
31
FOCUSED SUBMARKET STRATEGY
New York/ New Jersey
Source: Company filings as of June 30, 2018, Prologis Research. Prologis reflects Owned & Managed portfolio and inclusive of the
acquisition of DCT on August 22, 2018. JV development data unavailable for certain companies, therefore information with respect to
those companies includes CBRE and CoStar data
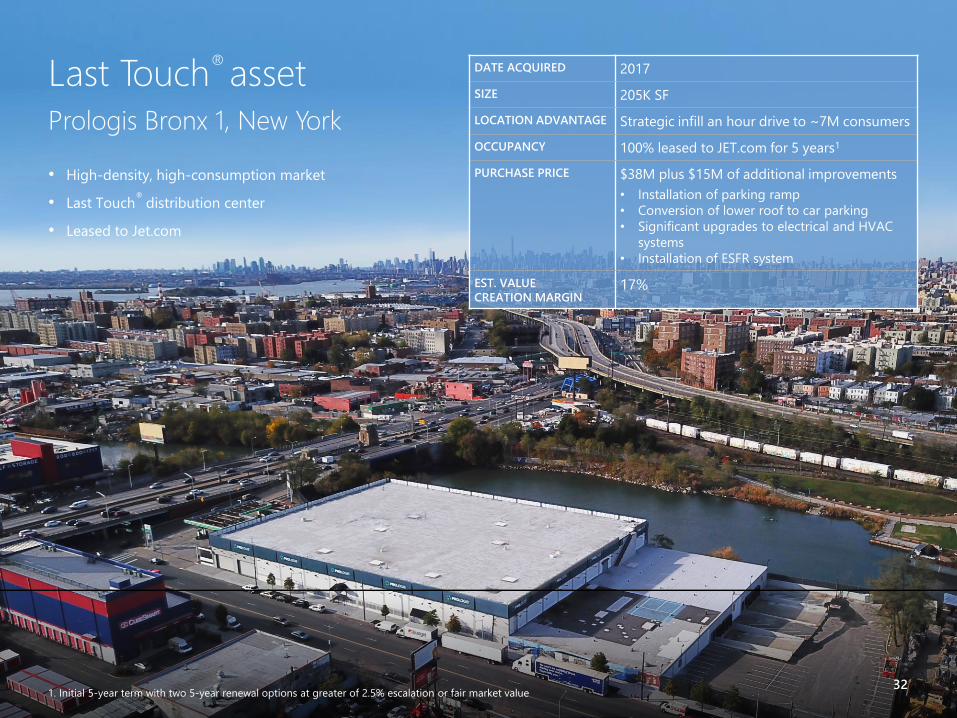
• High-density, high-consumption market
• Last Touch®
distribution center
• Leased to Jet.com
Last Touch®asset
Prologis Bronx 1, New York
DATE ACQUIRED 2017
SIZE 205K SF
LOCATION ADVANTAGE Strategic infill an hour drive to ~7M consumers
OCCUPANCY 100% leased to JET.com for 5 years1
PURCHASE PRICE $38M plus $15M of additional improvements
• Installation of parking ramp
• Conversion of lower roof to car parking
• Significant upgrades to electrical and HVAC
systems
• Installation of ESFR system
EST. VALUE
CREATION MARGIN17%
1. Initial 5-year term with two 5-year renewal options at greater of 2.5% escalation or fair market value32
33
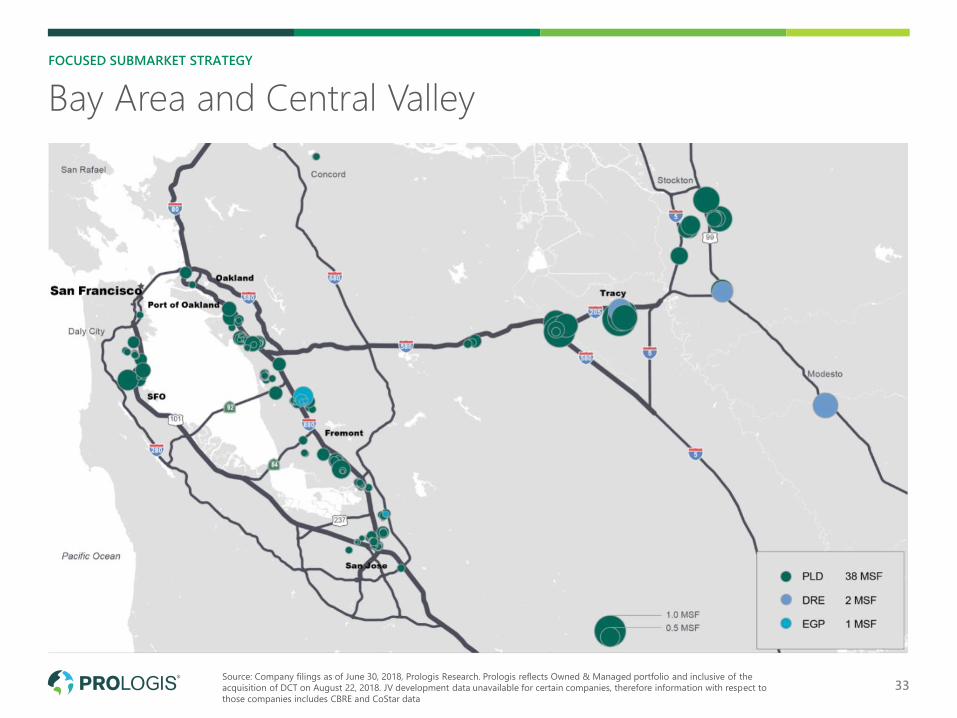
FOCUSED SUBMARKET STRATEGY
Bay Area and Central Valley
Source: Company filings as of June 30, 2018, Prologis Research. Prologis reflects Owned & Managed portfolio and inclusive of the
acquisition of DCT on August 22, 2018. JV development data unavailable for certain companies, therefore information with respect to
those companies includes CBRE and CoStar data
34
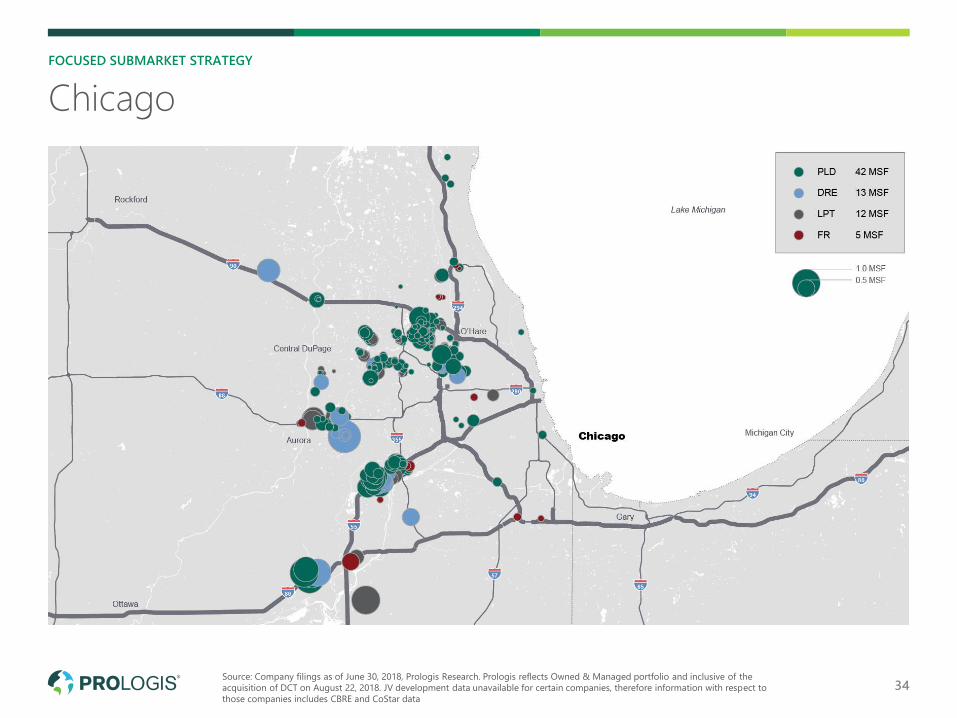
FOCUSED SUBMARKET STRATEGY
Chicago
Source: Company filings as of June 30, 2018, Prologis Research. Prologis reflects Owned & Managed portfolio and inclusive of the
acquisition of DCT on August 22, 2018. JV development data unavailable for certain companies, therefore information with respect to
those companies includes CBRE and CoStar data
35
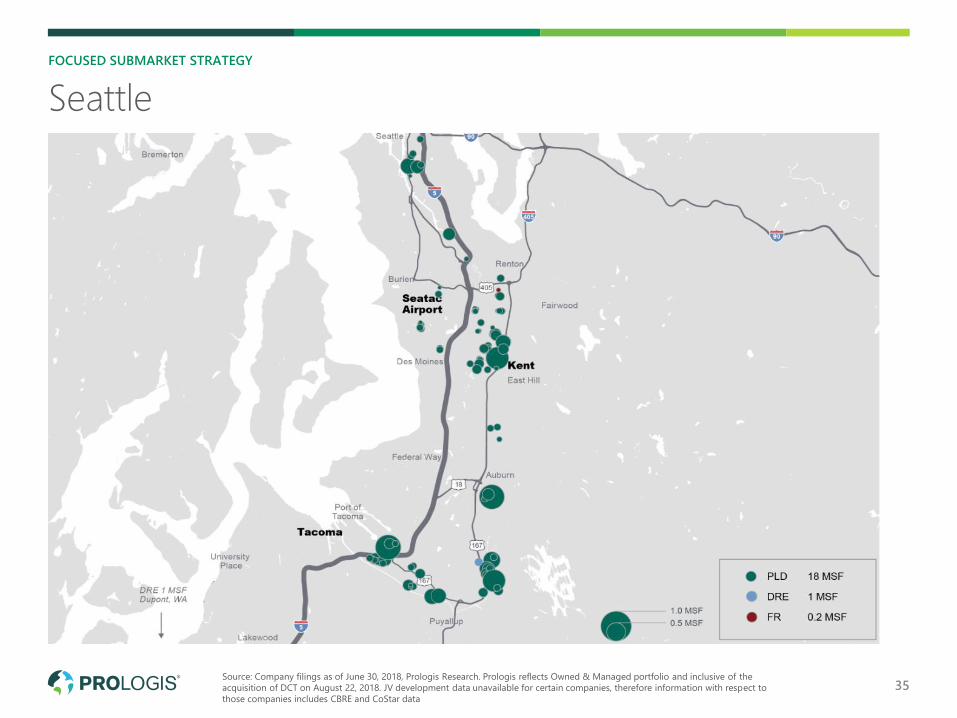
FOCUSED SUBMARKET STRATEGY
Seattle
Source: Company filings as of June 30, 2018, Prologis Research. Prologis reflects Owned & Managed portfolio and inclusive of the
acquisition of DCT on August 22, 2018. JV development data unavailable for certain companies, therefore information with respect to
those companies includes CBRE and CoStar data
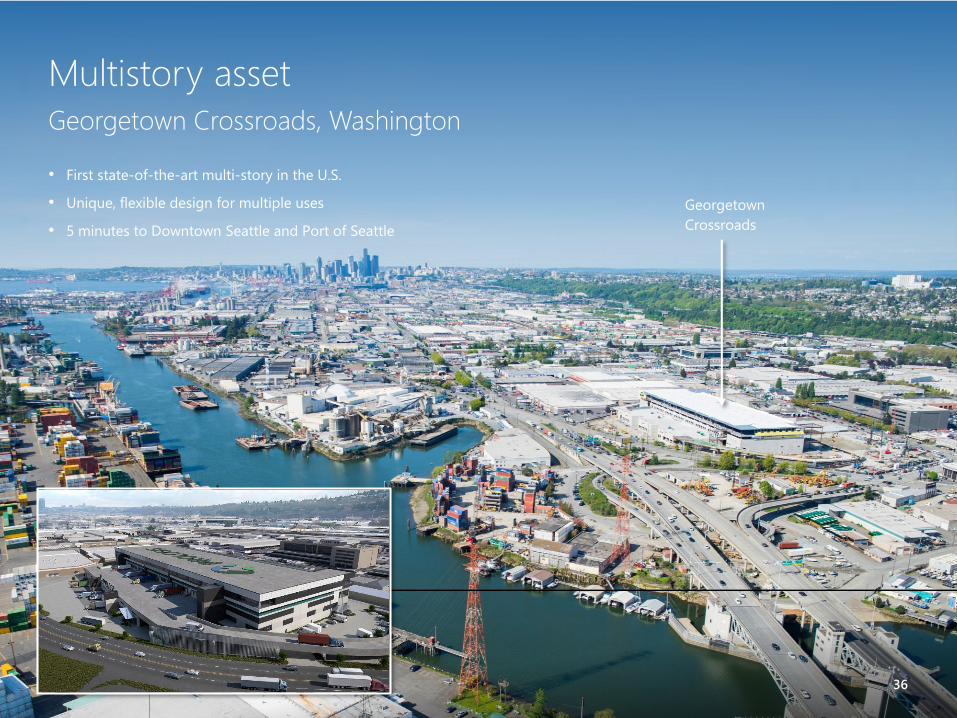
• First state-of-the-art multi-story in the U.S.
• Unique, flexible design for multiple uses
• 5 minutes to Downtown Seattle and Port of Seattle
Multistory asset
Georgetown Crossroads, Washington
Georgetown
Crossroads
36
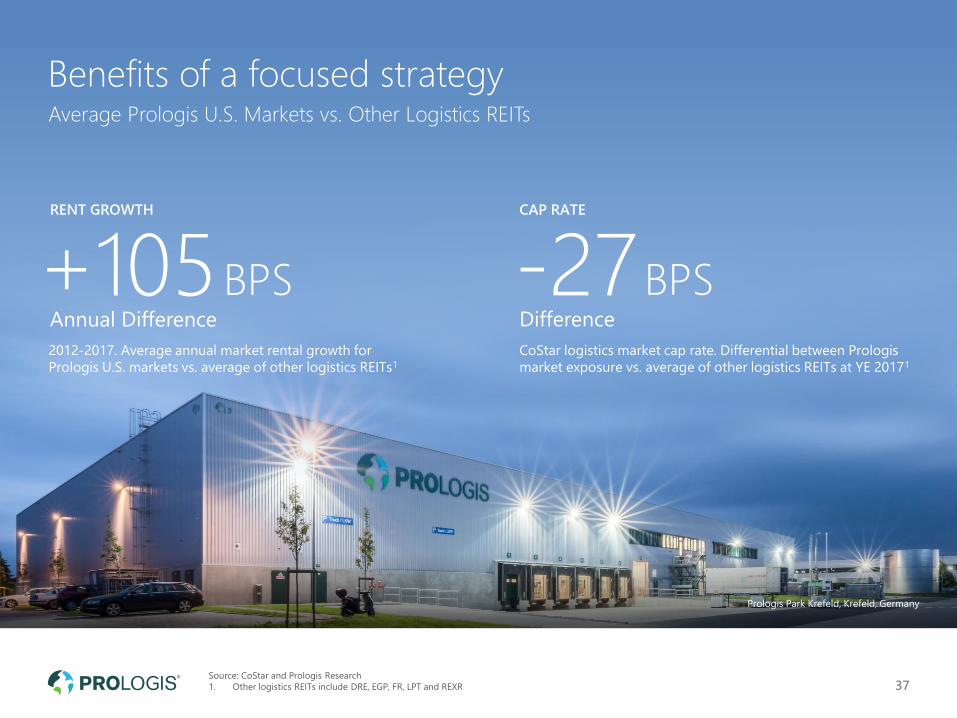
Source: CoStar and Prologis Research
1. Other logistics REITs include DRE, EGP, FR, LPT and REXR 37
Benefits of a focused strategyAverage Prologis U.S. Markets vs. Other Logistics REITs
Prologis Park Krefeld, Krefeld, Germany
RENT GROWTH
+105BPSAnnual Difference
2012-2017. Average annual market rental growth for
Prologis U.S. markets vs. average of other logistics REITs1
-27BPSDifference
CoStar logistics market cap rate. Differential between Prologis
market exposure vs. average of other logistics REITs at YE 20171
CAP RATE
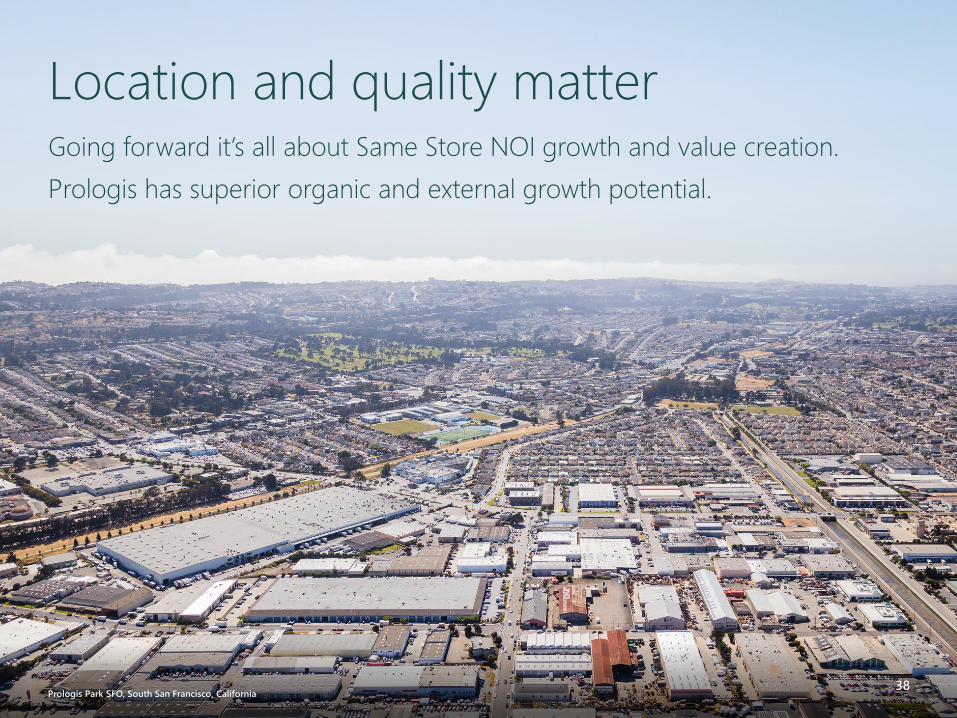
Location and quality matterGoing forward it’s all about Same Store NOI growth and value creation.
Prologis has superior organic and external growth potential.
Prologis Park SFO, South San Francisco, California1. Footer 38

Prologis ESG: Ahead of What’s Next
Prologis Park Stapleton, Denver, Colorado
39
Prologis Partnership with Cool Earth
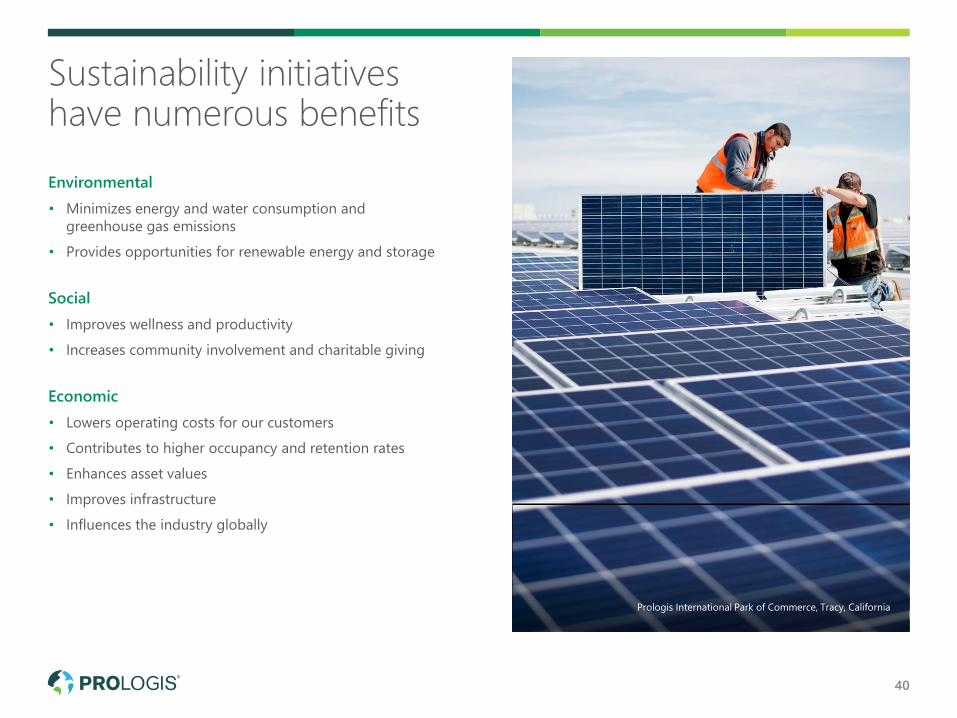
Environmental
• Minimizes energy and water consumption and
greenhouse gas emissions
• Provides opportunities for renewable energy and storage
Social
• Improves wellness and productivity
• Increases community involvement and charitable giving
Economic
• Lowers operating costs for our customers
• Contributes to higher occupancy and retention rates
• Enhances asset values
• Improves infrastructure
• Influences the industry globally
Prologis International Park of Commerce, Tracy, California
Sustainability initiatives have numerous benefits
40
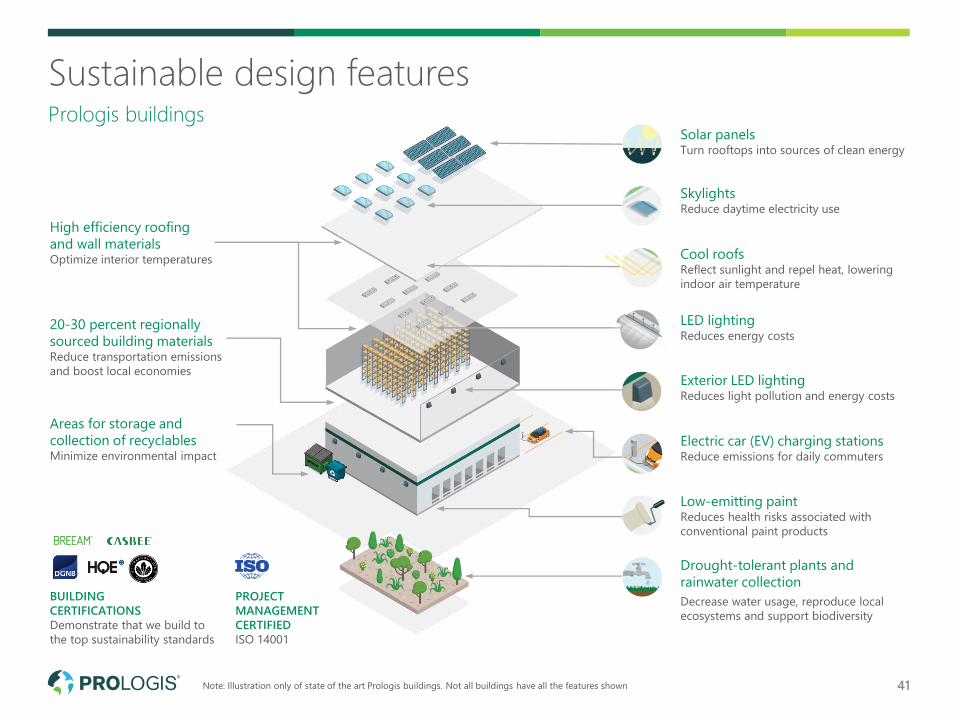
Sustainable design features
41
Prologis buildingsSolar panelsTurn rooftops into sources of clean energy
SkylightsReduce daytime electricity use
Cool roofsReflect sunlight and repel heat, lowering
indoor air temperature
LED lightingReduces energy costs
Exterior LED lightingReduces light pollution and energy costs
Electric car (EV) charging stationsReduce emissions for daily commuters
Low-emitting paintReduces health risks associated with
conventional paint products
Drought-tolerant plants and
rainwater collection
Decrease water usage, reproduce local
ecosystems and support biodiversity
High efficiency roofing
and wall materialsOptimize interior temperatures
20-30 percent regionally
sourced building materialsReduce transportation emissions
and boost local economies
Areas for storage and
collection of recyclables Minimize environmental impact
BUILDING
CERTIFICATIONS
Demonstrate that we build to
the top sustainability standards
PROJECT
MANAGEMENT
CERTIFIED
ISO 14001
Note: Illustration only of state of the art Prologis buildings. Not all buildings have all the features shown
42
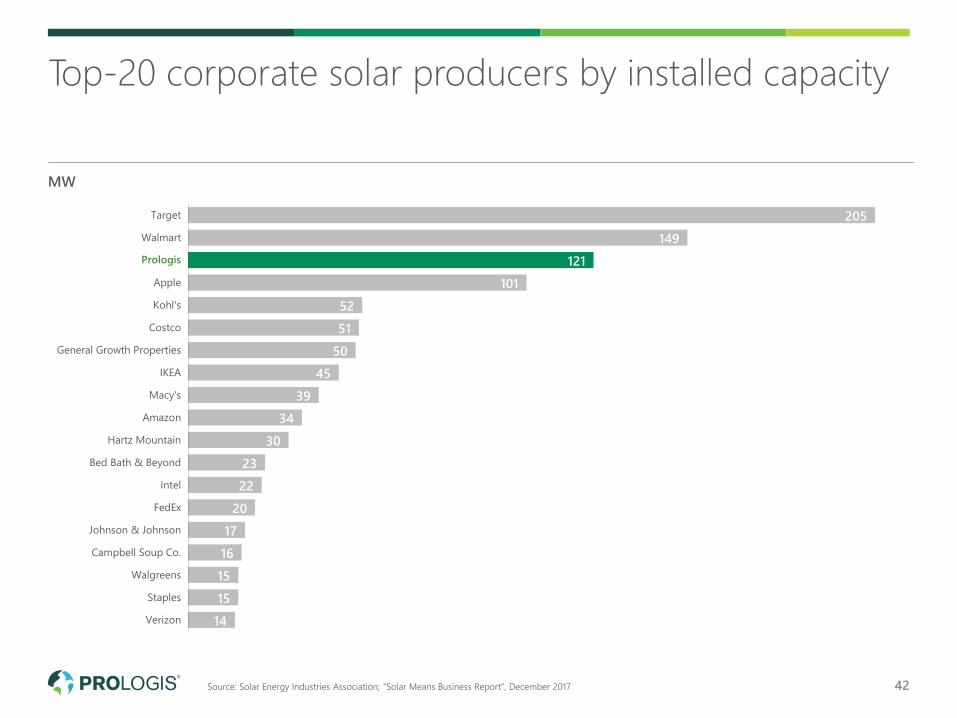
205
149
121
101
52
51
50
45
39
34
30
23
22
20
17
16
15
15
14
Target
Walmart
Prologis
Apple
Kohl's
Costco
General Growth Properties
IKEA
Macy's
Amazon
Hartz Mountain
Bed Bath & Beyond
Intel
FedEx
Johnson & Johnson
Campbell Soup Co.
Walgreens
Staples
Verizon
Top-20 corporate solar producers by installed capacity
MW
Prologis
Source: Solar Energy Industries Association; “Solar Means Business Report”, December 2017
43
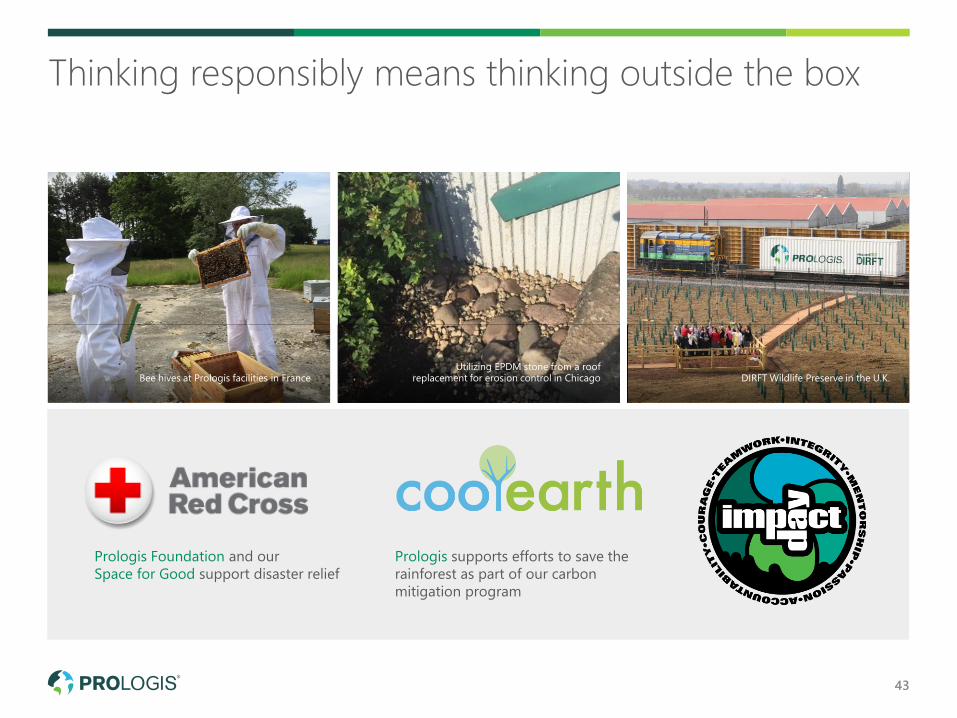
Prologis Foundation and our
Space for Good support disaster relief
Prologis supports efforts to save the
rainforest as part of our carbon
mitigation program
Utilizing EPDM stone from a roof replacement for erosion control in ChicagoBee hives at Prologis facilities in France DIRFT Wildlife Preserve in the U.K.
Thinking responsibly means thinking outside the box
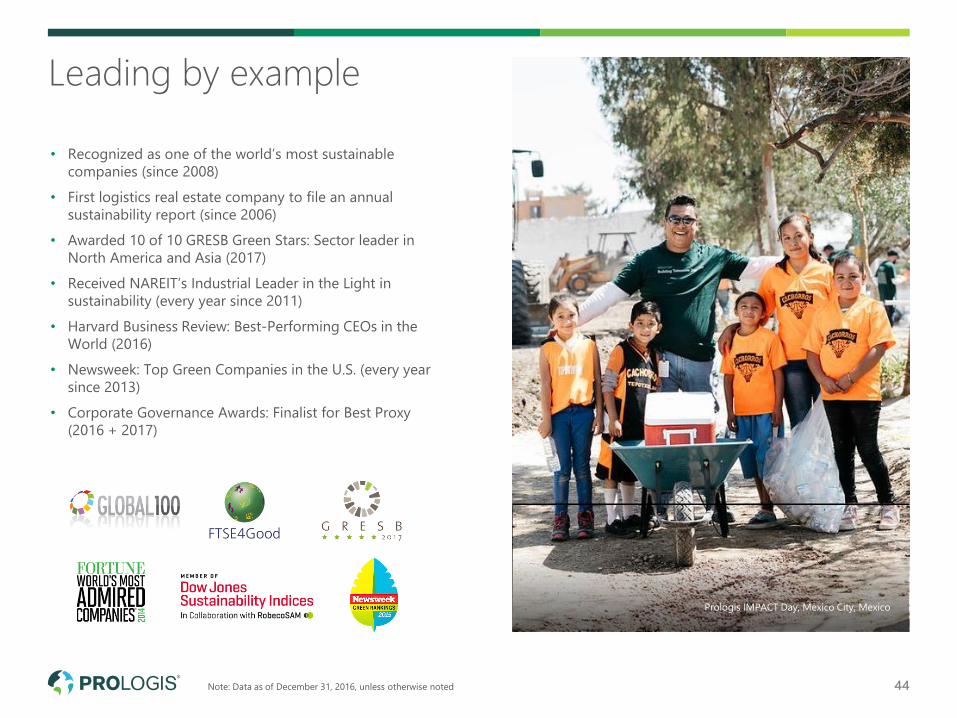
• Recognized as one of the world’s most sustainable
companies (since 2008)
• First logistics real estate company to file an annual
sustainability report (since 2006)
• Awarded 10 of 10 GRESB Green Stars: Sector leader in
North America and Asia (2017)
• Received NAREIT’s Industrial Leader in the Light in
sustainability (every year since 2011)
• Harvard Business Review: Best-Performing CEOs in the
World (2016)
• Newsweek: Top Green Companies in the U.S. (every year
since 2013)
• Corporate Governance Awards: Finalist for Best Proxy
(2016 + 2017)
Prologis IMPACT Day, Mexico City, Mexico
Leading by example
44Note: Data as of December 31, 2016, unless otherwise noted
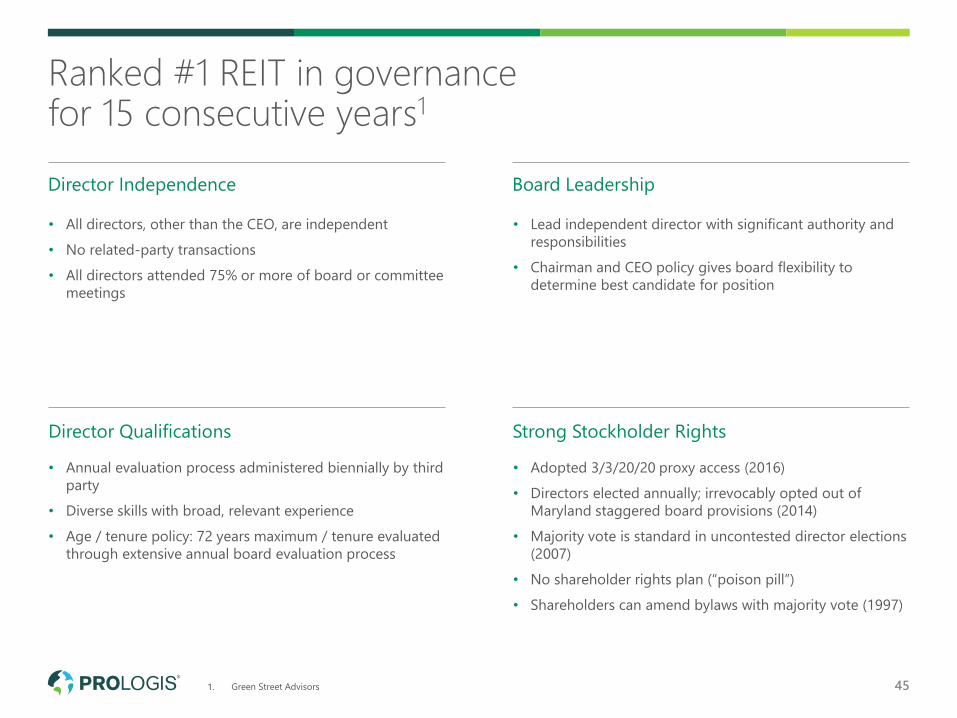
1. Green Street Advisors 45
Ranked #1 REIT in governance for 15 consecutive years1
Director Independence Board Leadership
Director Qualifications Strong Stockholder Rights
• All directors, other than the CEO, are independent
• No related-party transactions
• All directors attended 75% or more of board or committee
meetings
• Annual evaluation process administered biennially by third
party
• Diverse skills with broad, relevant experience
• Age / tenure policy: 72 years maximum / tenure evaluated
through extensive annual board evaluation process
• Lead independent director with significant authority and
responsibilities
• Chairman and CEO policy gives board flexibility to
determine best candidate for position
• Adopted 3/3/20/20 proxy access (2016)
• Directors elected annually; irrevocably opted out of
Maryland staggered board provisions (2014)
• Majority vote is standard in uncontested director elections
(2007)
• No shareholder rights plan (“poison pill”)
• Shareholders can amend bylaws with majority vote (1997)