Embed Size (px)
Citation preview
Joseph L. Pagliari, Jr.
Clinical Professor of Real Estate
March 14, 2012
PREA Spring Conference: Boston
[Plan-Sponsor Council Meeting]
The opinions expressed herein are my own and are not necessarily
consistent with the views of REIS, NCREIF and/or PREA.
REIS Overview:
Some Thoughts and Observations
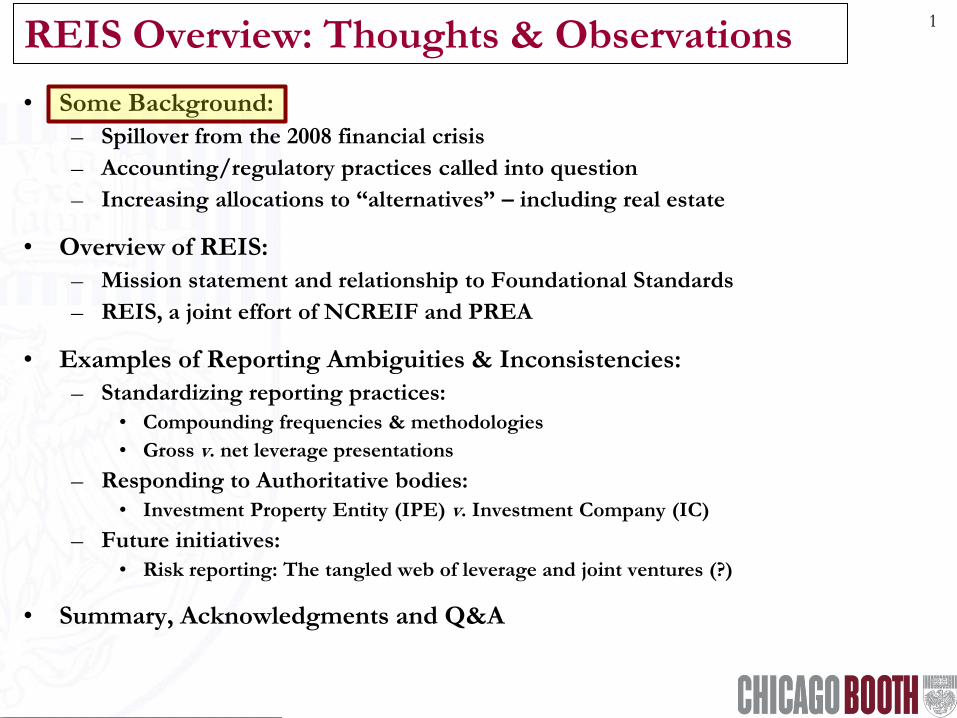
REIS Overview: Thoughts & Observations 1
• Some Background:
– Spillover from the 2008 financial crisis
– Accounting/regulatory practices called into question
– Increasing allocations to “alternatives” – including real estate
• Overview of REIS:
– Mission statement and relationship to Foundational Standards
– REIS, a joint effort of NCREIF and PREA
• Examples of Reporting Ambiguities & Inconsistencies:
– Standardizing reporting practices:
• Compounding frequencies & methodologies
• Gross v. net leverage presentations
– Responding to Authoritative bodies:
• Investment Property Entity (IPE) v. Investment Company (IC)
– Future initiatives:
• Risk reporting: The tangled web of leverage and joint ventures (?)
• Summary, Acknowledgments and Q&A
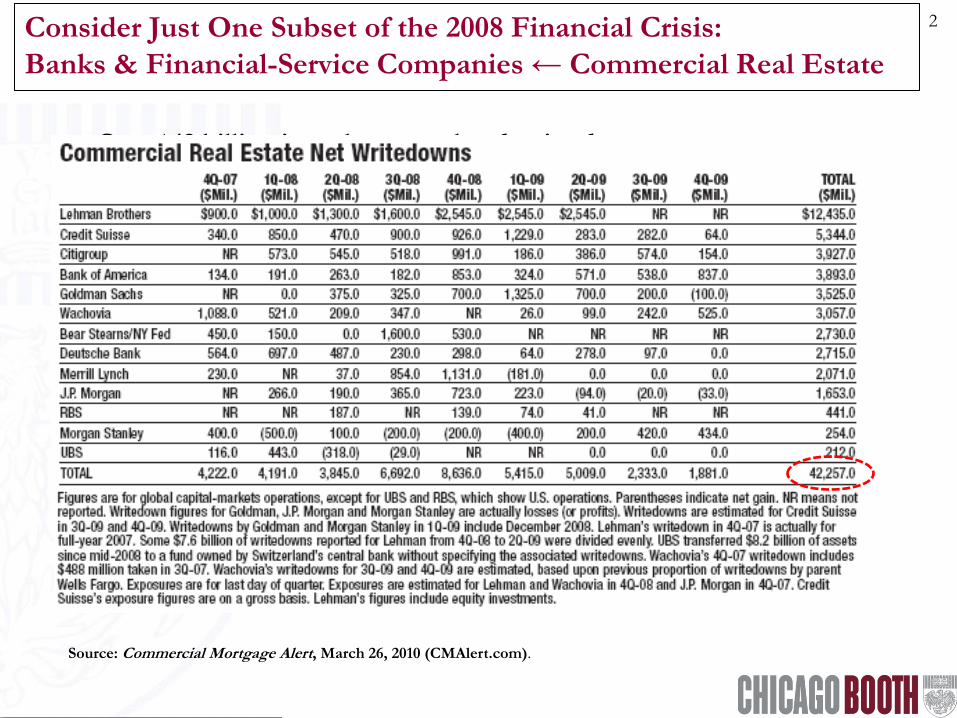
Consider Just One Subset of the 2008 Financial Crisis:
Banks & Financial-Service Companies ← Commercial Real Estate
2
• Over $42 billion in real estate-related write-downs
Source: Commercial Mortgage Alert, March 26, 2010 (CMAlert.com).
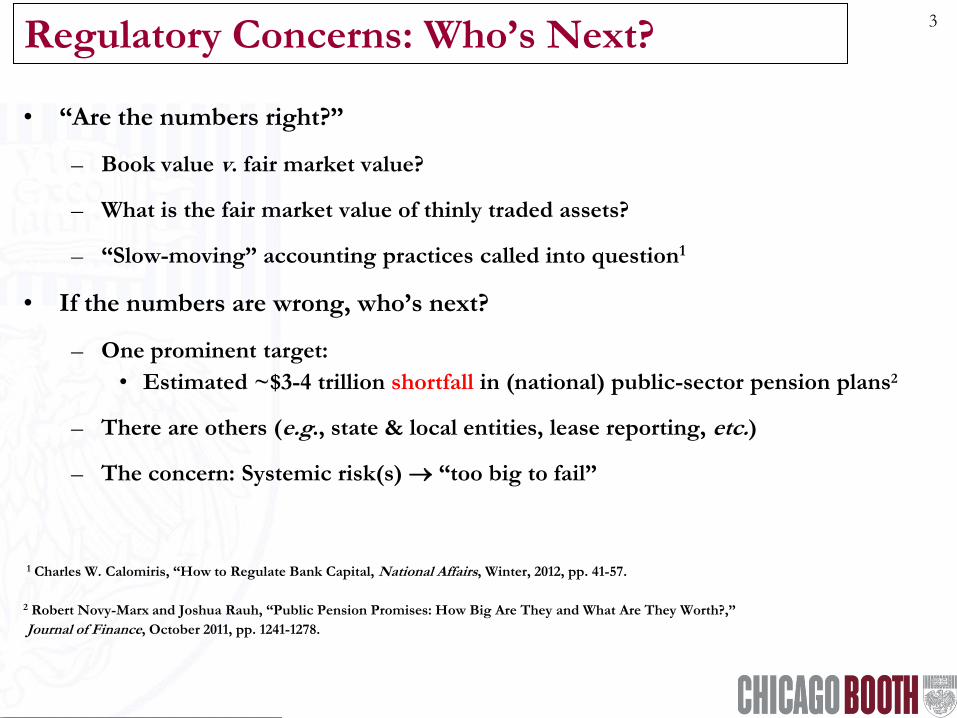
Regulatory Concerns: Who’s Next? 3
• “Are the numbers right?”
– Book value v. fair market value?
– What is the fair market value of thinly traded assets?
– “Slow-moving” accounting practices called into question1
• If the numbers are wrong, who’s next?
– One prominent target:
• Estimated ~$3-4 trillion shortfall in (national) public-sector pension plans2
– There are others (e.g., state & local entities, lease reporting, etc.)
– The concern: Systemic risk(s) “too big to fail”
1 Charles W. Calomiris, “How to Regulate Bank Capital, National Affairs, Winter, 2012, pp. 41-57.
2 Robert Novy-Marx and Joshua Rauh, “Public Pension Promises: How Big Are They and What Are They Worth?,”
Journal of Finance, October 2011, pp. 1241-1278.
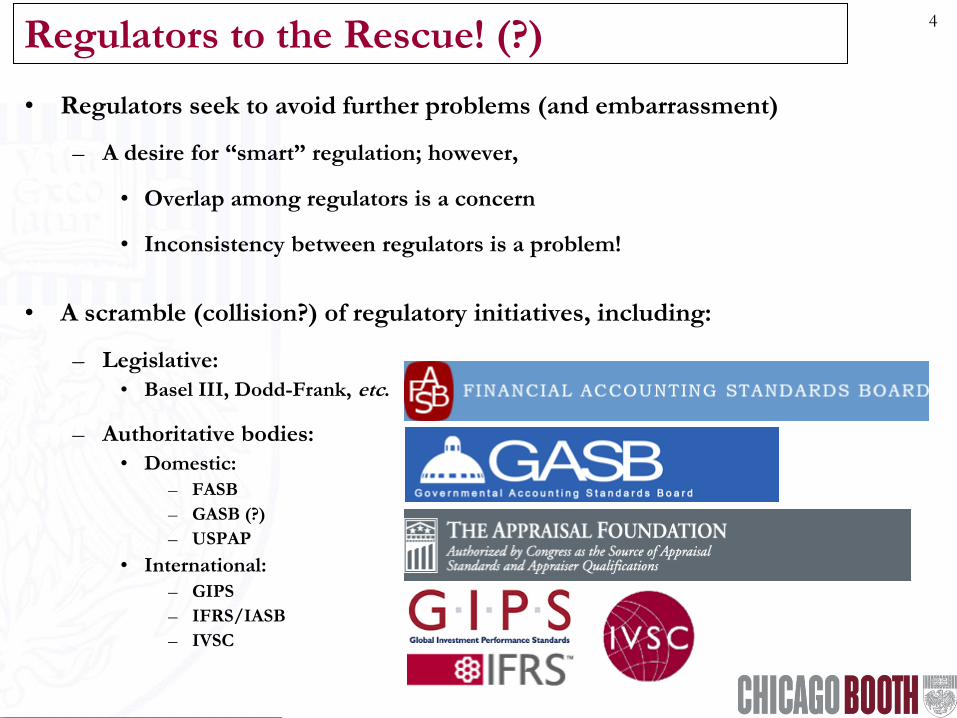
Regulators to the Rescue! (?) 4
• Regulators seek to avoid further problems (and embarrassment)
– A desire for “smart” regulation; however,
• Overlap among regulators is a concern
• Inconsistency between regulators is a problem!
• A scramble (collision?) of regulatory initiatives, including:
– Legislative:
• Basel III, Dodd-Frank, etc.
– Authoritative bodies:
• Domestic:
– FASB
– GASB (?)
– USPAP
• International:
– GIPS
– IFRS/IASB
– IVSC
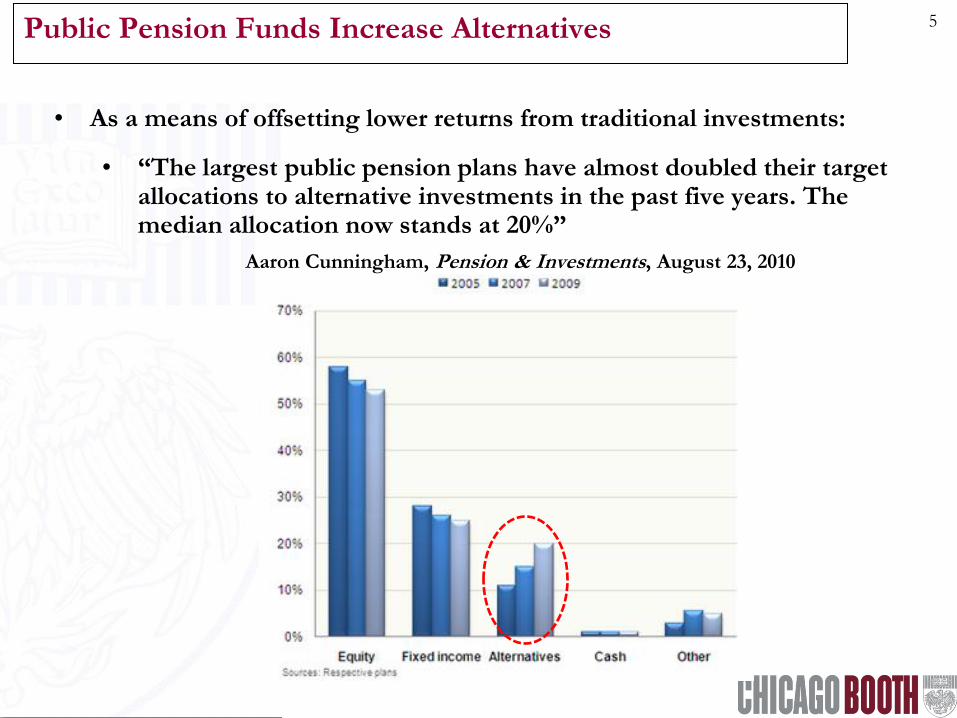
Public Pension Funds Increase Alternatives 5
• As a means of offsetting lower returns from traditional investments:
• “The largest public pension plans have almost doubled their target allocations to alternative investments in the past five years. The median allocation now stands at 20%”
Aaron Cunningham, Pension & Investments, August 23, 2010
Regulators’ View Real Estate Alternative Investments
6
• The trend of late: Regulators view (private) commercial real estate (equities) as part of the larger group of alternative investments
– conceptually, this view has merit; however,
– operationally, this view presents certain problems:
• wide variety of choices along risk/return continuum
[core core+ value-added opportunistic]
• wide variety of platforms/structures
[open-end commingled fund, closed-end separate account, etc.]
• real estate appraisal/valuation tends to be more precise
• real estate finance/credit is highly evolved
[how to treat levered equity positions?
(particularly, highly levered positions with “optionality”?)]
• extensive use of “promoted” interests, often in a variety of JV structures
• Into the breach steps REIS!
– Pushing back against a “one size fits all (alternative investments)” approach
REIS Overview: Thoughts & Observations 7
• Some Background:
– Spillover from the 2008 financial crisis
– Accounting/regulatory practices called into question
– Increasing allocations to “alternatives” – including real estate
• Overview of REIS:
– Mission statement and relationship to Foundational Standards
– REIS, a joint effort of NCREIF and PREA
• Examples of Reporting Ambiguities & Inconsistencies:
– Standardizing reporting practices:
• Compounding frequencies & methodologies
• Gross v. net leverage presentations
– Responding to Authoritative bodies:
• Investment Property Entity (IPE) v. Investment Company (IC)
– Future initiatives:
• Risk reporting: The tangled web of leverage and joint ventures (?)
• Summary, Acknowledgments and Q&A
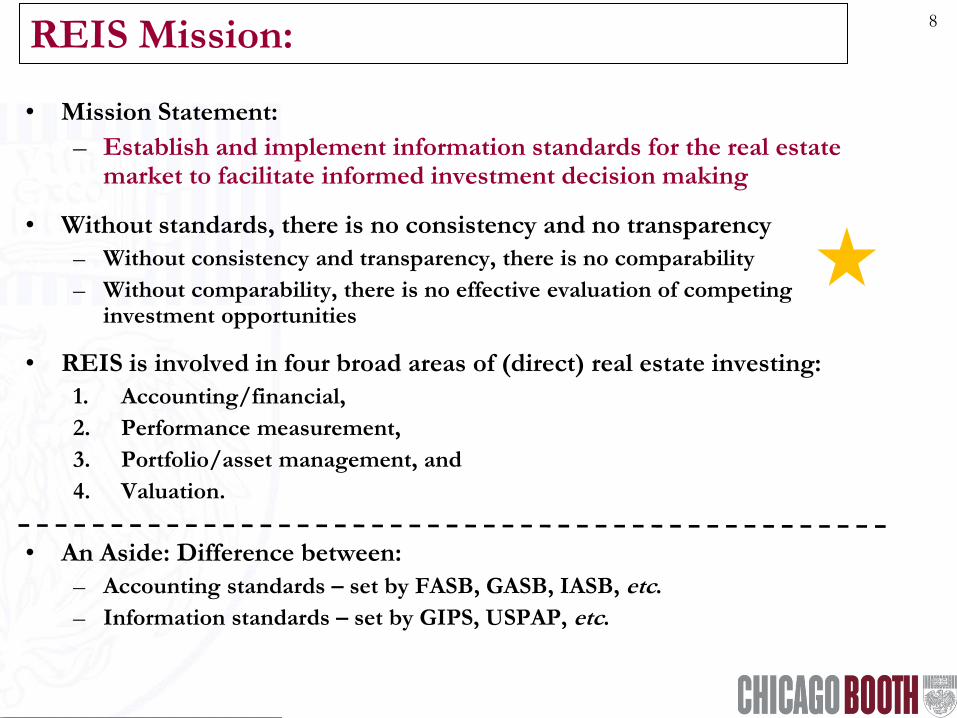
REIS Mission: 8
• Mission Statement:
– Establish and implement information standards for the real estate market to facilitate informed investment decision making
• Without standards, there is no consistency and no transparency
– Without consistency and transparency, there is no comparability
– Without comparability, there is no effective evaluation of competing investment opportunities
• REIS is involved in four broad areas of (direct) real estate investing:
1. Accounting/financial,
2. Performance measurement,
3. Portfolio/asset management, and
4. Valuation.
• An Aside: Difference between:
– Accounting standards – set by FASB, GASB, IASB, etc.
– Information standards – set by GIPS, USPAP, etc.
•Standards , conventions and rules
accountants follow when
recording and summarizing
transactions , and when preparing
financial statements
•U.S. GAAP
•Quality-control standards
applicable for real property,
personal property, intangibles,
and business valuation, appraisal,
analysis and reports
• GIPS
•Principles on how to
calculate and report
investment results
Conflicts, Gaps &/or Ambiguities
•Integrated
Accounting and
Valuation
•Consistency
•Reporting
•REIS
•Transparency •Performance
Measurement
•Guidance on
Initiatives
•Develop &
Refine
Standards
•Increase
Awareness &
Compliance
•USPAP
Purpose Goals
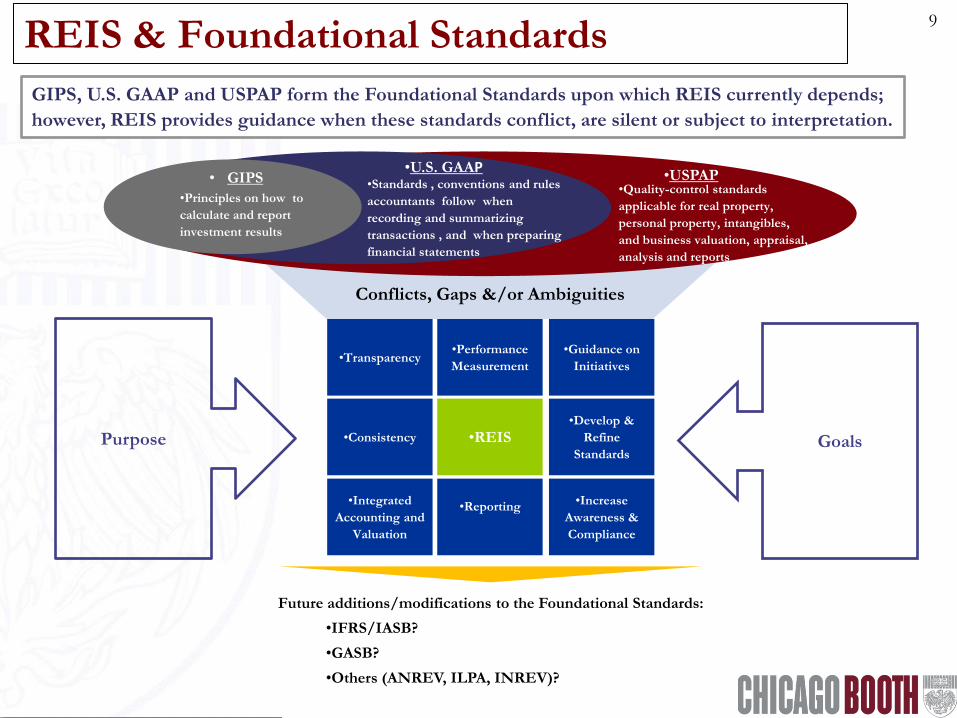
GIPS, U.S. GAAP and USPAP form the Foundational Standards upon which REIS currently depends;
however, REIS provides guidance when these standards conflict, are silent or subject to interpretation.
REIS & Foundational Standards 9
Future additions/modifications to the Foundational Standards:
•IFRS/IASB?
•GASB?
•Others (ANREV, ILPA, INREV)?
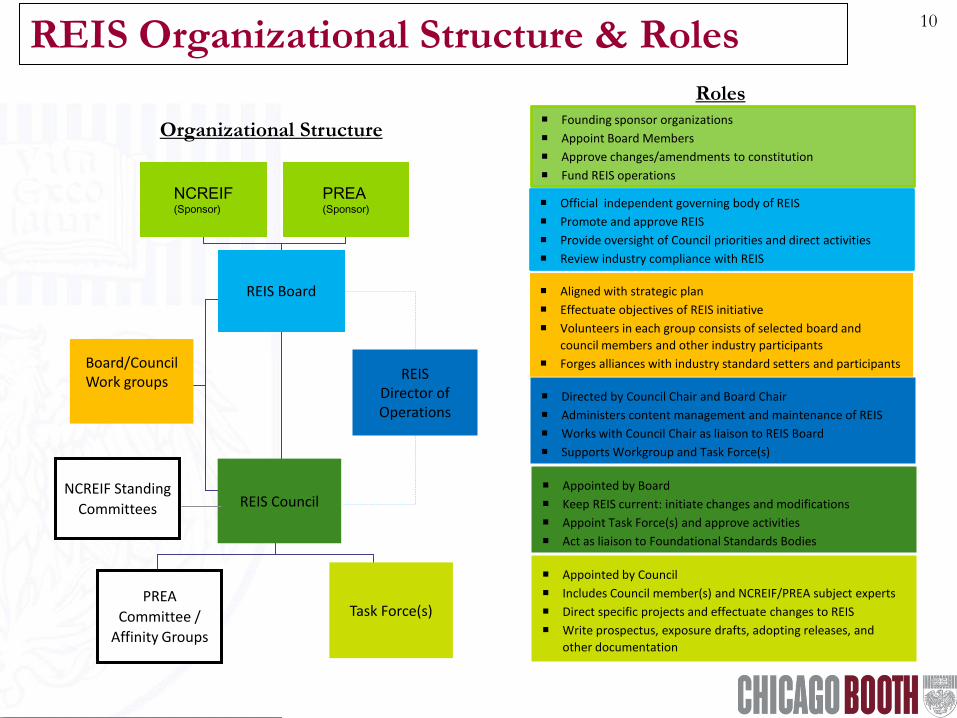
REIS Organizational Structure & Roles 10
NCREIF (Sponsor)
PREA (Sponsor)
NCREIF Standing
Committees
PREA
Committee /
Affinity Groups
REIS Director of Operations
Task Force(s)
REIS Board
REIS Council
Board/Council Work groups
Organizational Structure
Roles Founding sponsor organizations
Appoint Board Members
Approve changes/amendments to constitution
Fund REIS operations
Official independent governing body of REIS
Promote and approve REIS
Provide oversight of Council priorities and direct activities
Review industry compliance with REIS
Aligned with strategic plan
Effectuate objectives of REIS initiative
Volunteers in each group consists of selected board and
council members and other industry participants
Forges alliances with industry standard setters and participants
Directed by Council Chair and Board Chair
Administers content management and maintenance of REIS
Works with Council Chair as liaison to REIS Board
Supports Workgroup and Task Force(s)
Appointed by Board
Keep REIS current: initiate changes and modifications
Appoint Task Force(s) and approve activities
Act as liaison to Foundational Standards Bodies
Appointed by Council
Includes Council member(s) and NCREIF/PREA subject experts
Direct specific projects and effectuate changes to REIS
Write prospectus, exposure drafts, adopting releases, and
other documentation
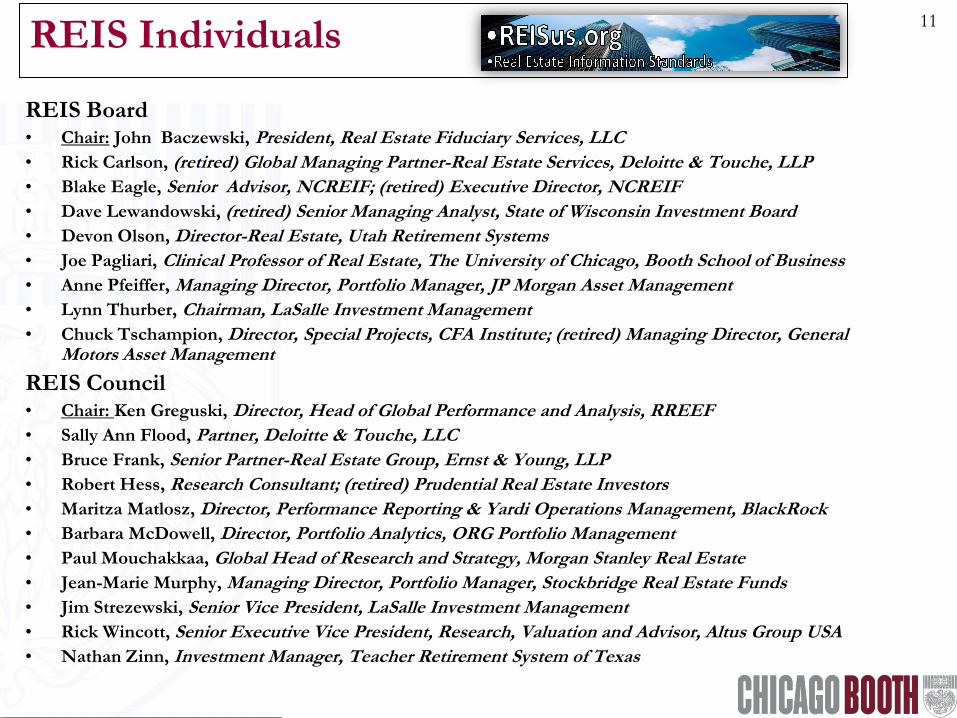
REIS Individuals 11
REIS Board • Chair: John Baczewski, President, Real Estate Fiduciary Services, LLC
• Rick Carlson, (retired) Global Managing Partner-Real Estate Services, Deloitte & Touche, LLP
• Blake Eagle, Senior Advisor, NCREIF; (retired) Executive Director, NCREIF
• Dave Lewandowski, (retired) Senior Managing Analyst, State of Wisconsin Investment Board
• Devon Olson, Director-Real Estate, Utah Retirement Systems
• Joe Pagliari, Clinical Professor of Real Estate, The University of Chicago, Booth School of Business
• Anne Pfeiffer, Managing Director, Portfolio Manager, JP Morgan Asset Management
• Lynn Thurber, Chairman, LaSalle Investment Management
• Chuck Tschampion, Director, Special Projects, CFA Institute; (retired) Managing Director, General Motors Asset Management
REIS Council • Chair: Ken Greguski, Director, Head of Global Performance and Analysis, RREEF
• Sally Ann Flood, Partner, Deloitte & Touche, LLC
• Bruce Frank, Senior Partner-Real Estate Group, Ernst & Young, LLP
• Robert Hess, Research Consultant; (retired) Prudential Real Estate Investors
• Maritza Matlosz, Director, Performance Reporting & Yardi Operations Management, BlackRock
• Barbara McDowell, Director, Portfolio Analytics, ORG Portfolio Management
• Paul Mouchakkaa, Global Head of Research and Strategy, Morgan Stanley Real Estate
• Jean-Marie Murphy, Managing Director, Portfolio Manager, Stockbridge Real Estate Funds
• Jim Strezewski, Senior Vice President, LaSalle Investment Management
• Rick Wincott, Senior Executive Vice President, Research, Valuation and Advisor, Altus Group USA
• Nathan Zinn, Investment Manager, Teacher Retirement System of Texas
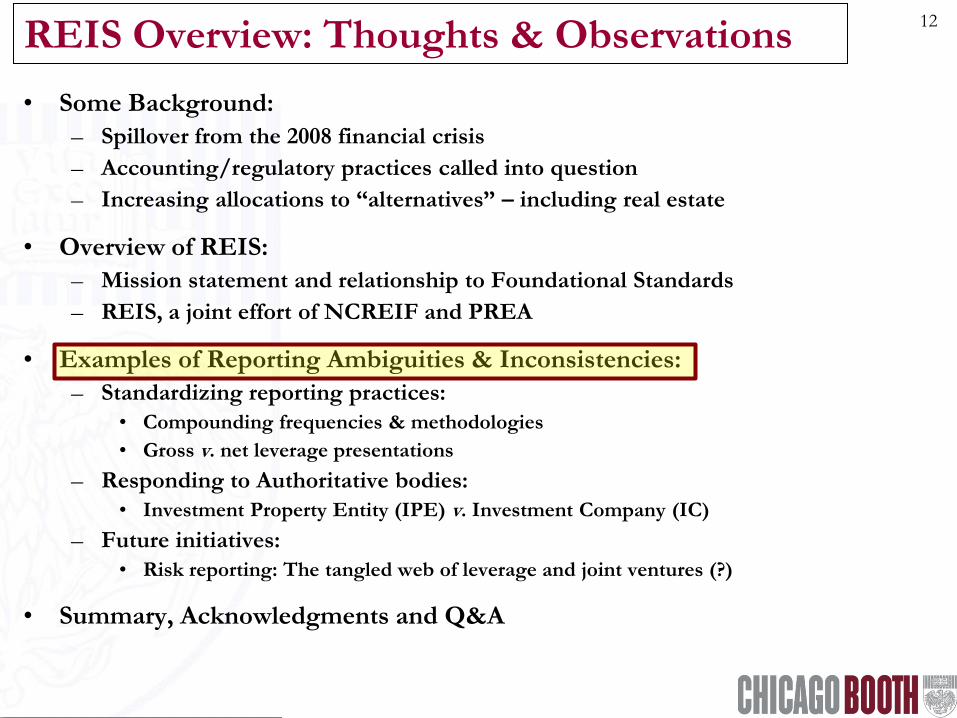
REIS Overview: Thoughts & Observations 12
• Some Background:
– Spillover from the 2008 financial crisis
– Accounting/regulatory practices called into question
– Increasing allocations to “alternatives” – including real estate
• Overview of REIS:
– Mission statement and relationship to Foundational Standards
– REIS, a joint effort of NCREIF and PREA
• Examples of Reporting Ambiguities & Inconsistencies:
– Standardizing reporting practices:
• Compounding frequencies & methodologies
• Gross v. net leverage presentations
– Responding to Authoritative bodies:
• Investment Property Entity (IPE) v. Investment Company (IC)
– Future initiatives:
• Risk reporting: The tangled web of leverage and joint ventures (?)
• Summary, Acknowledgments and Q&A
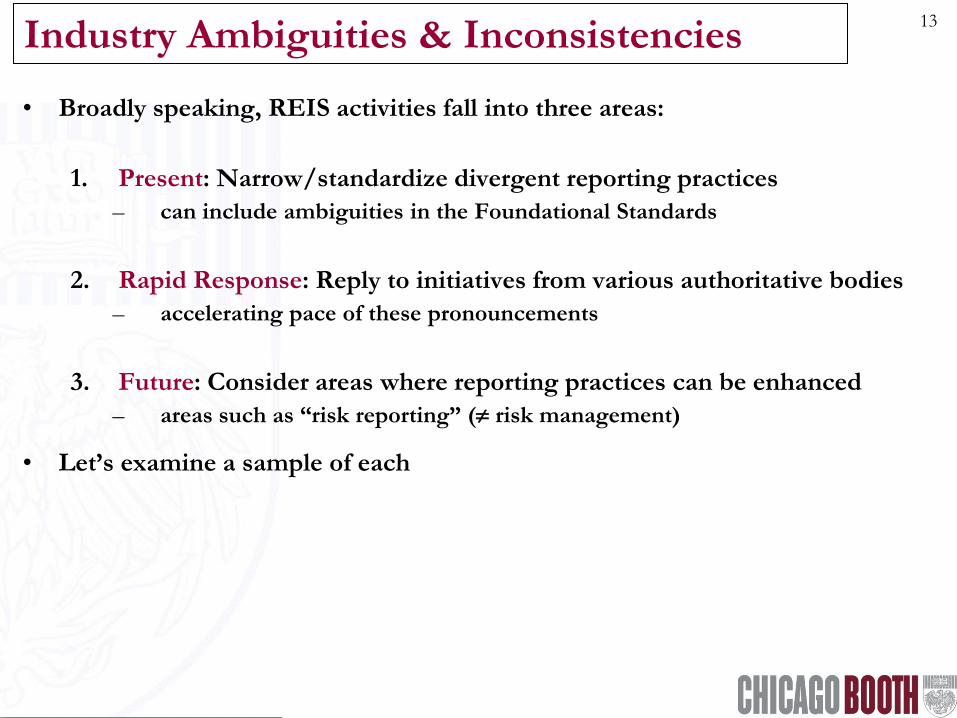
Industry Ambiguities & Inconsistencies 13
• Broadly speaking, REIS activities fall into three areas:
1. Present: Narrow/standardize divergent reporting practices
– can include ambiguities in the Foundational Standards
2. Rapid Response: Reply to initiatives from various authoritative bodies
– accelerating pace of these pronouncements
3. Future: Consider areas where reporting practices can be enhanced
– areas such as “risk reporting” ( risk management)
• Let’s examine a sample of each
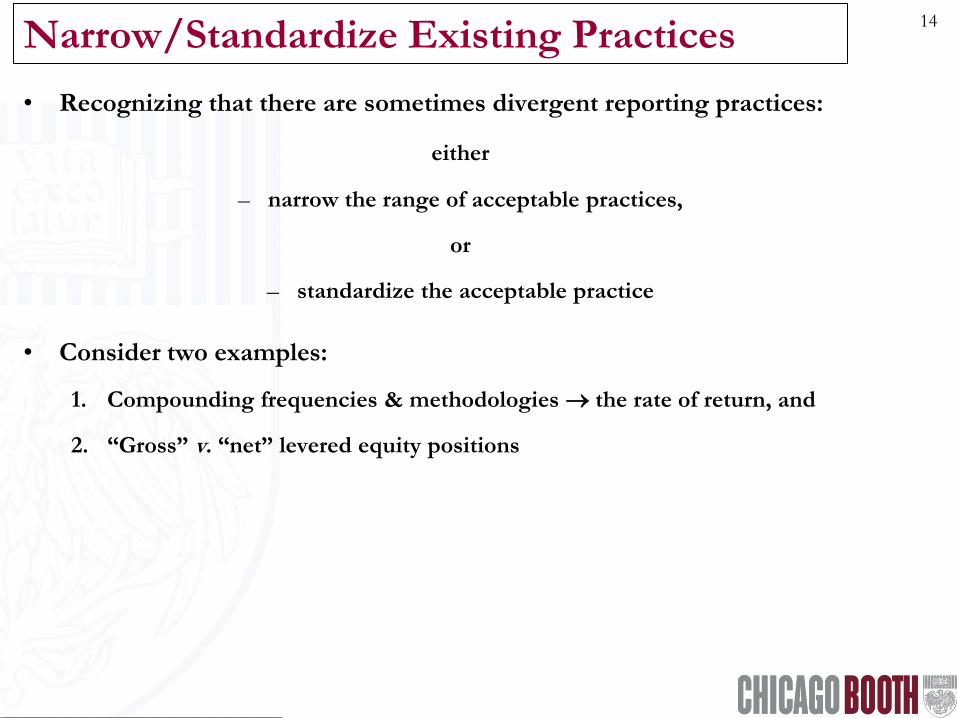
Narrow/Standardize Existing Practices 14
• Recognizing that there are sometimes divergent reporting practices:
either
– narrow the range of acceptable practices,
or
– standardize the acceptable practice
• Consider two examples:
1. Compounding frequencies & methodologies the rate of return, and
2. “Gross” v. “net” levered equity positions
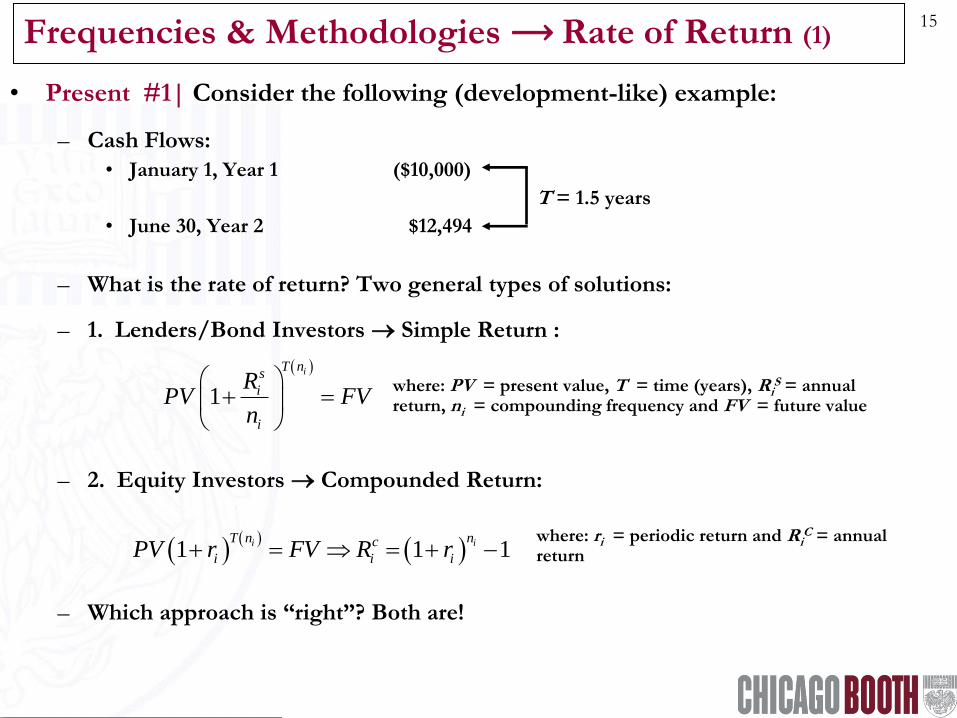
Frequencies & Methodologies ⟶ Rate of Return (1) 15
• Present #1| Consider the following (development-like) example:
– Cash Flows:
• January 1, Year 1 ($10,000)
T = 1.5 years
• June 30, Year 2 $12,494
– What is the rate of return? Two general types of solutions:
– 1. Lenders/Bond Investors Simple Return :
where: PV = present value, T = time (years), RiS = annual
return, ni = compounding frequency and FV = future value
– 2. Equity Investors Compounded Return:
where: ri = periodic return and RiC = annual
return
– Which approach is “right”? Both are!
1
iT ns
i
i
RPV FV
n
1 1 1i iT n nc
i i iPV r FV R r
Compounding Debt/Bond-Type Equity-Type
Frequency T n i R iS
Users R iC
Users
XIRR 16.05%
Annual 1.5 1 16.00% 16.00%
Semi-Annual 1.5 2 15.41% US Treasuries 16.00%
Quarters 1.5 4 15.12% 16.00% NCREIF *
Months 1.5 12 14.93% Whole Loans 16.00% Stock Market
Days 1.5 365 14.85% CMBS 16.00%
Continuous 1.5 14.84% Academics 14.84% Academics
Simple-Return Compound-Return
Methodologies
* However, NCREIF's use of the Modified Dietz method approximates monthly compounding.
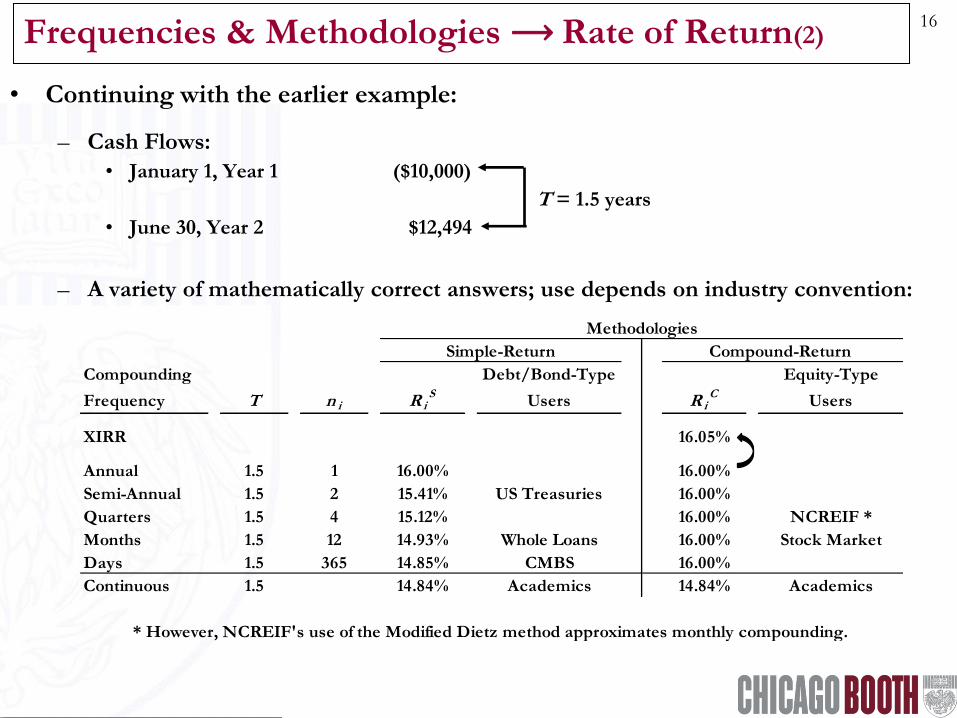
Frequencies & Methodologies ⟶ Rate of Return(2) 16
• Continuing with the earlier example:
– Cash Flows:
• January 1, Year 1 ($10,000)
T = 1.5 years
• June 30, Year 2 $12,494
– A variety of mathematically correct answers; use depends on industry convention:
Frequencies & Methodologies ⟶ Rate of Return (3) 17
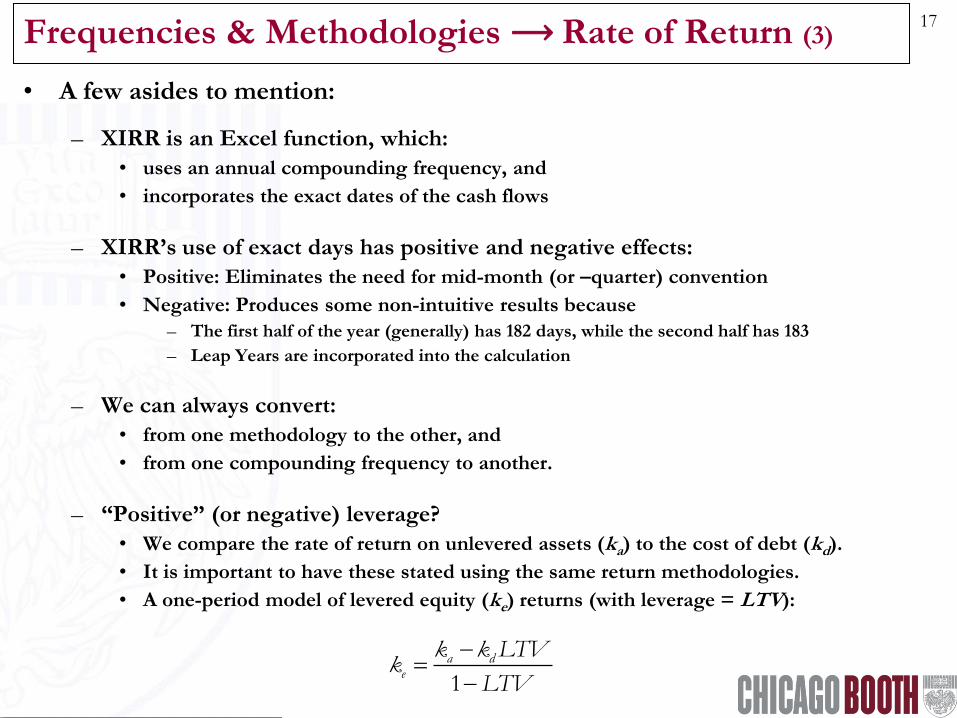
• A few asides to mention:
– XIRR is an Excel function, which:
• uses an annual compounding frequency, and
• incorporates the exact dates of the cash flows
– XIRR’s use of exact days has positive and negative effects:
• Positive: Eliminates the need for mid-month (or –quarter) convention
• Negative: Produces some non-intuitive results because
– The first half of the year (generally) has 182 days, while the second half has 183
– Leap Years are incorporated into the calculation
– We can always convert:
• from one methodology to the other, and
• from one compounding frequency to another.
– “Positive” (or negative) leverage?
• We compare the rate of return on unlevered assets (ka) to the cost of debt (kd).
• It is important to have these stated using the same return methodologies.
• A one-period model of levered equity (ke) returns (with leverage = LTV):
1
a de
k k LTVk
LTV
Frequencies & Methodologies ⟶ Rate of Return (4) 18
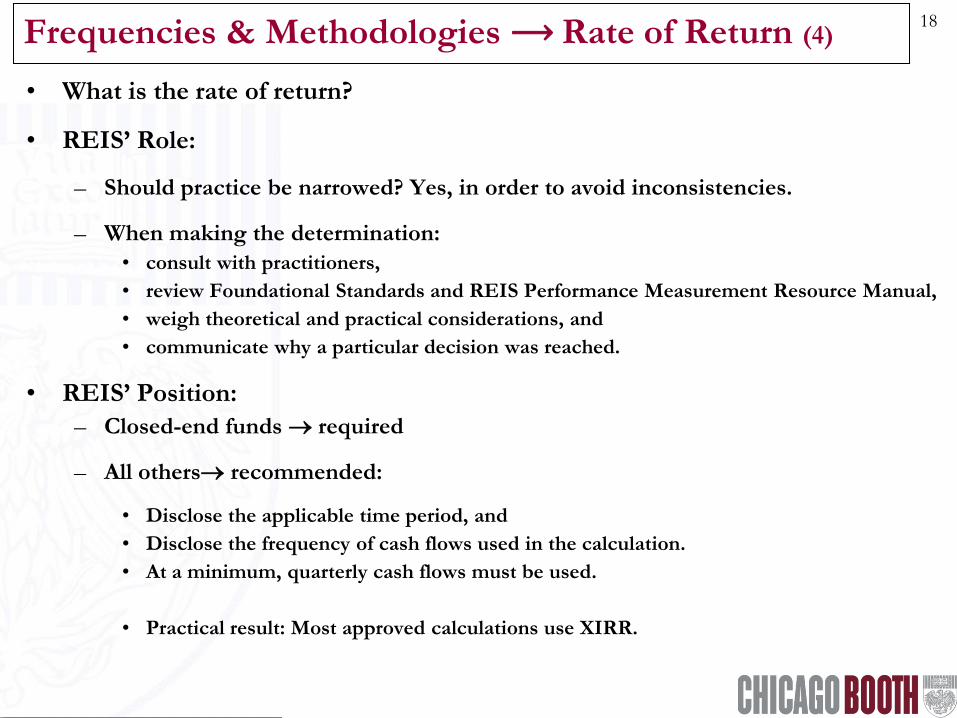
• What is the rate of return?
• REIS’ Role:
– Should practice be narrowed? Yes, in order to avoid inconsistencies.
– When making the determination:
• consult with practitioners,
• review Foundational Standards and REIS Performance Measurement Resource Manual,
• weigh theoretical and practical considerations, and
• communicate why a particular decision was reached.
• REIS’ Position:
– Closed-end funds required
– All others recommended:
• Disclose the applicable time period, and
• Disclose the frequency of cash flows used in the calculation.
• At a minimum, quarterly cash flows must be used.
• Practical result: Most approved calculations use XIRR.
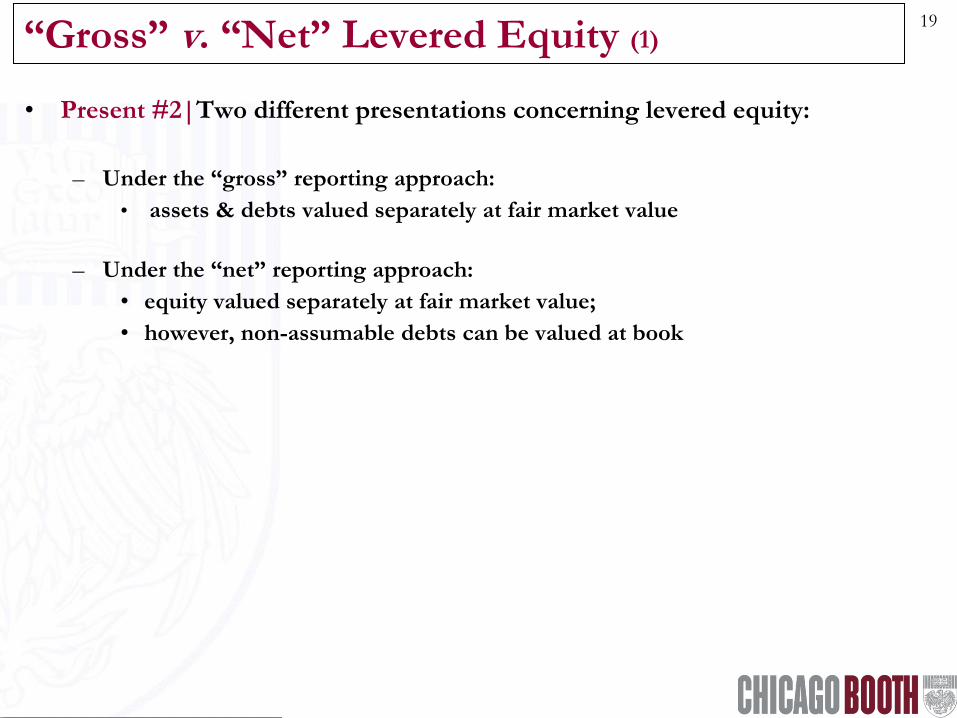
“Gross” v. “Net” Levered Equity (1) 19
• Present #2|Two different presentations concerning levered equity:
– Under the “gross” reporting approach:
• assets & debts valued separately at fair market value
– Under the “net” reporting approach:
• equity valued separately at fair market value;
• however, non-assumable debts can be valued at book
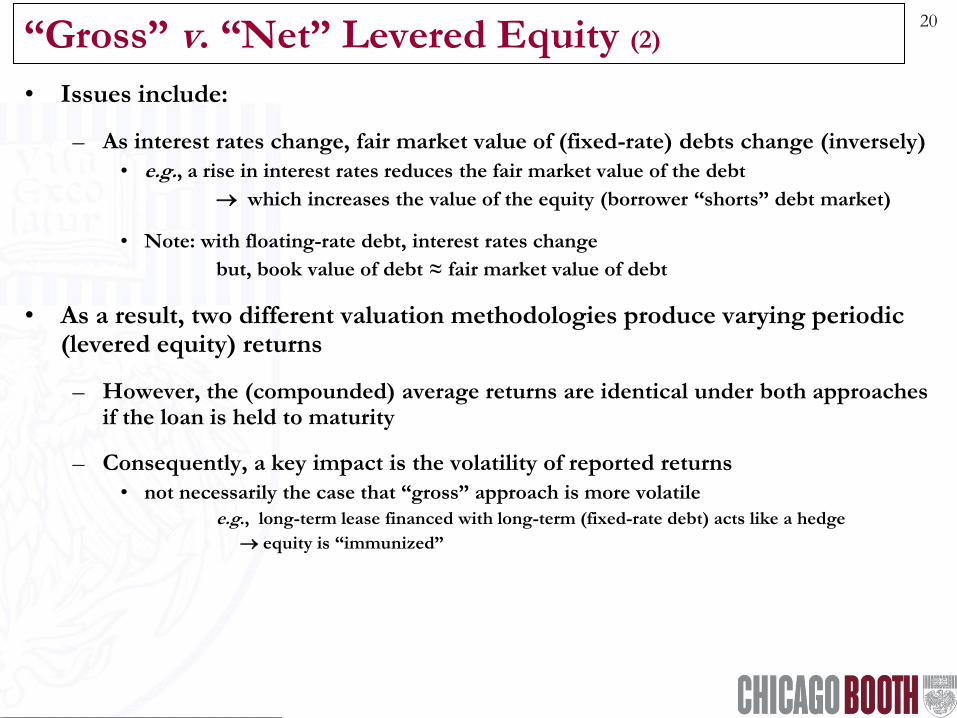
“Gross” v. “Net” Levered Equity (2) 20
• Issues include:
– As interest rates change, fair market value of (fixed-rate) debts change (inversely)
• e.g., a rise in interest rates reduces the fair market value of the debt
which increases the value of the equity (borrower “shorts” debt market)
• Note: with floating-rate debt, interest rates change
but, book value of debt ≈ fair market value of debt
• As a result, two different valuation methodologies produce varying periodic (levered equity) returns
– However, the (compounded) average returns are identical under both approaches if the loan is held to maturity
– Consequently, a key impact is the volatility of reported returns
• not necessarily the case that “gross” approach is more volatile
e.g., long-term lease financed with long-term (fixed-rate debt) acts like a hedge
equity is “immunized”
“Gross” v. “Net” Levered Equity (3) 21
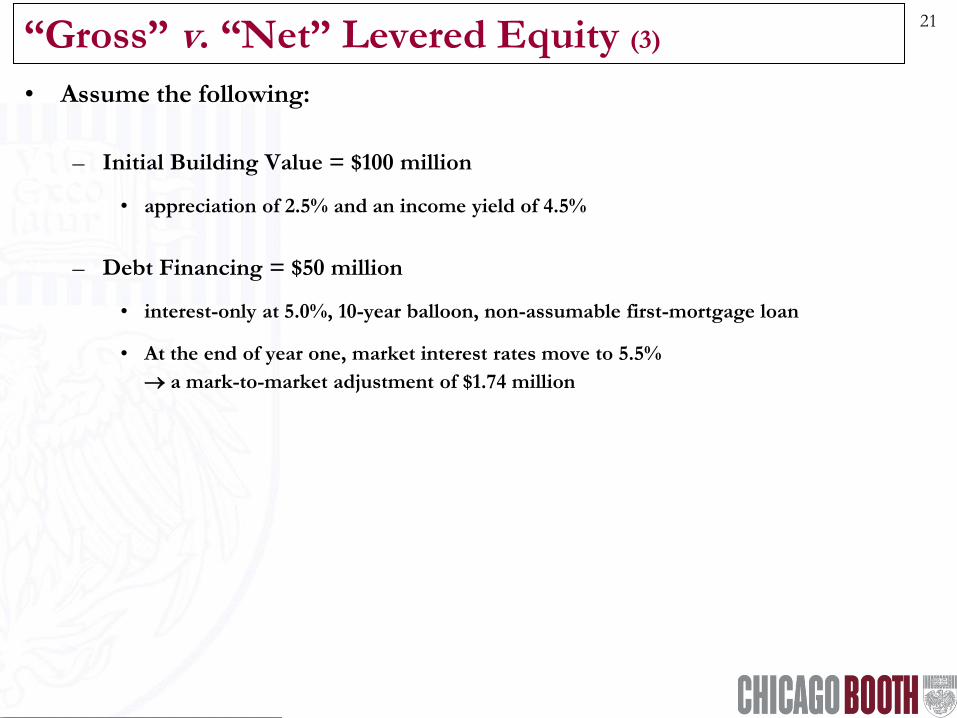
• Assume the following:
– Initial Building Value = $100 million
• appreciation of 2.5% and an income yield of 4.5%
– Debt Financing = $50 million
• interest-only at 5.0%, 10-year balloon, non-assumable first-mortgage loan
• At the end of year one, market interest rates move to 5.5%
a mark-to-market adjustment of $1.74 million
“Gross” v. “Net” Levered Equity (4) 22
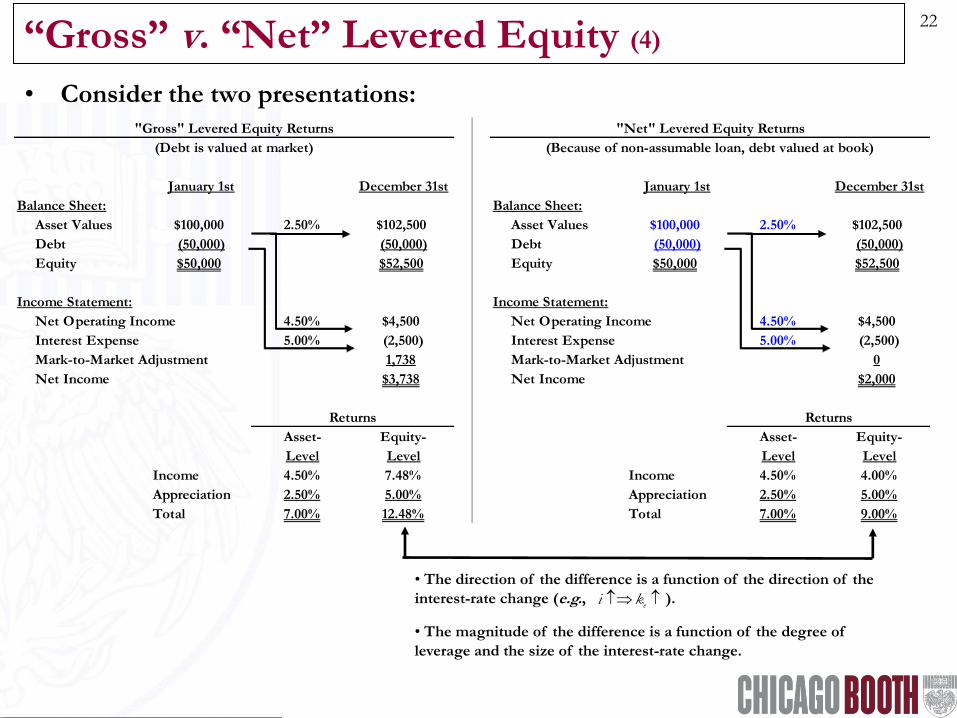
• Consider the two presentations:
• The direction of the difference is a function of the direction of the
interest-rate change (e.g., ).
• The magnitude of the difference is a function of the degree of
leverage and the size of the interest-rate change.
January 1st December 31st January 1st December 31st
Balance Sheet: Balance Sheet:
Asset Values $100,000 2.50% $102,500 Asset Values $100,000 2.50% $102,500
Debt (50,000) (50,000) Debt (50,000) (50,000)
Equity $50,000 $52,500 Equity $50,000 $52,500
Income Statement: Income Statement:
Net Operating Income 4.50% $4,500 Net Operating Income 4.50% $4,500
Interest Expense 5.00% (2,500) Interest Expense 5.00% (2,500)
Mark-to-Market Adjustment 1,738 Mark-to-Market Adjustment 0
Net Income $3,738 Net Income $2,000
Asset- Equity- Asset- Equity-
Level Level Level Level
Income 4.50% 7.48% Income 4.50% 4.00%
Appreciation 2.50% 5.00% Appreciation 2.50% 5.00%
Total 7.00% 12.48% Total 7.00% 9.00%
Returns
"Net" Levered Equity Returns
(Because of non-assumable loan, debt valued at book)
"Gross" Levered Equity Returns
(Debt is valued at market)
Returns
ei k
“Gross” v. “Net” Levered Equity (5) 23
• What is the “right” presentation?
• REIS’ Role:
– Should practice be narrowed? Still debated.
– When making the determination:
• consult with practitioners,
• review Foundational Standards and REIS Performance Measurement Resource Manual,
• weigh theoretical and practical considerations, and
• communicate why a particular decision was reached.
• REIS’ Position:
– re: FASB ASC Topic 820 Implementation Guidance (October, 2009):
• Clarifies valuation criteria.
• However, refrains from recommending or requiring one presentation over the other.
• Practical result: Mixed approaches still prevalent in practice.
Same
as
before
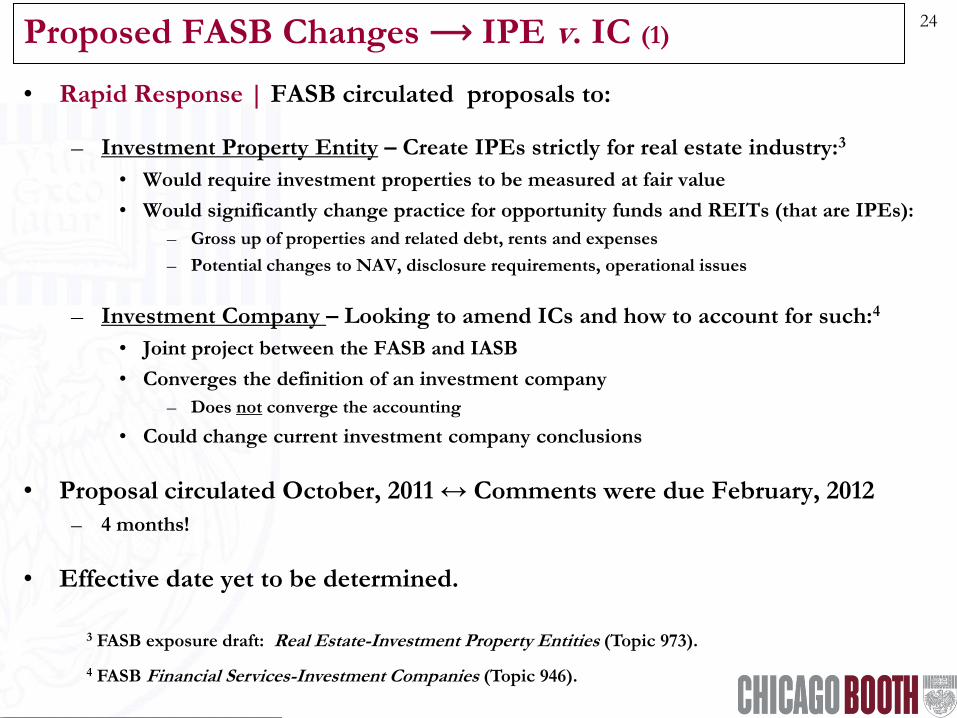
Proposed FASB Changes ⟶ IPE v. IC (1) 24
• Rapid Response | FASB circulated proposals to:
– Investment Property Entity – Create IPEs strictly for real estate industry:3
• Would require investment properties to be measured at fair value
• Would significantly change practice for opportunity funds and REITs (that are IPEs):
– Gross up of properties and related debt, rents and expenses
– Potential changes to NAV, disclosure requirements, operational issues
– Investment Company – Looking to amend ICs and how to account for such:4
• Joint project between the FASB and IASB
• Converges the definition of an investment company
– Does not converge the accounting
• Could change current investment company conclusions
• Proposal circulated October, 2011 ↔ Comments were due February, 2012
– 4 months!
• Effective date yet to be determined.
3 FASB exposure draft: Real Estate-Investment Property Entities (Topic 973).
4 FASB Financial Services-Investment Companies (Topic 946).
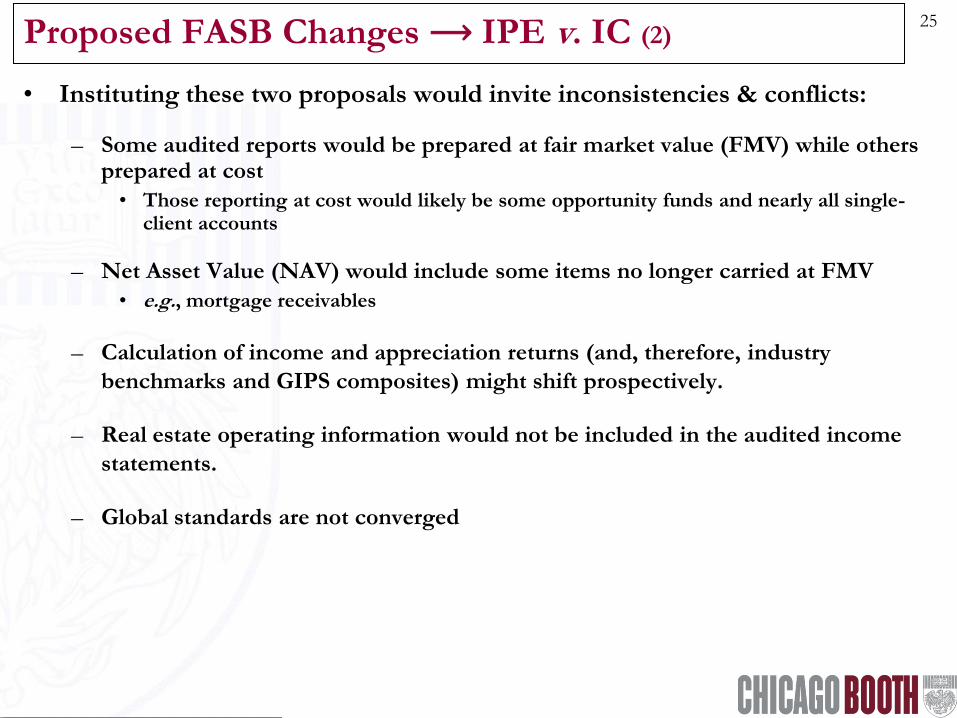
Proposed FASB Changes ⟶ IPE v. IC (2) 25
• Instituting these two proposals would invite inconsistencies & conflicts:
– Some audited reports would be prepared at fair market value (FMV) while others prepared at cost
• Those reporting at cost would likely be some opportunity funds and nearly all single-client accounts
– Net Asset Value (NAV) would include some items no longer carried at FMV
• e.g., mortgage receivables
– Calculation of income and appreciation returns (and, therefore, industry
benchmarks and GIPS composites) might shift prospectively.
– Real estate operating information would not be included in the audited income
statements.
– Global standards are not converged
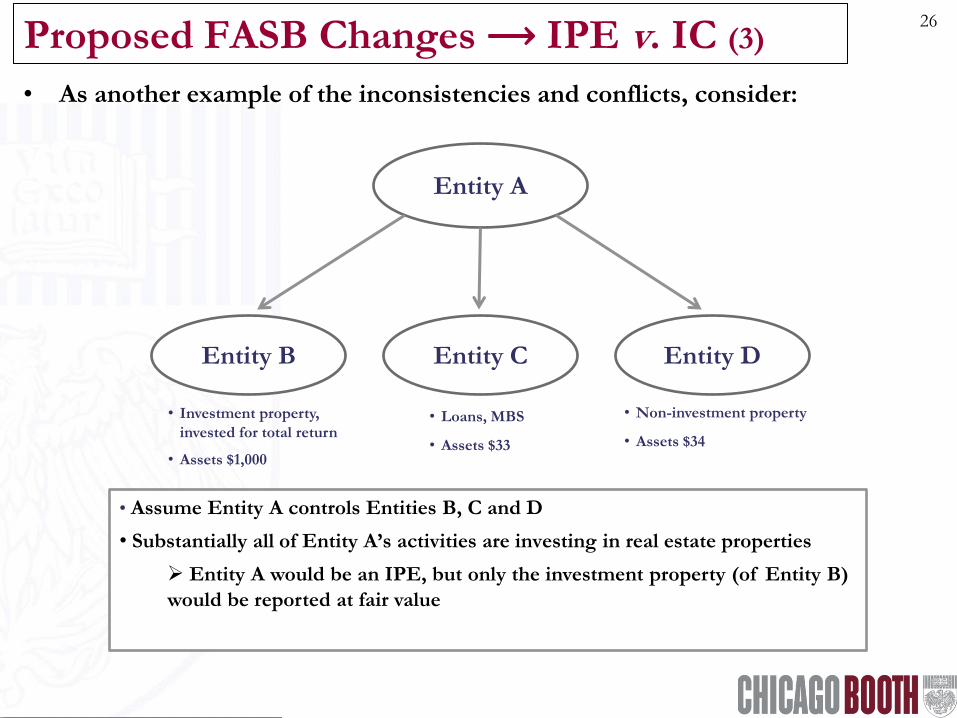
Entity A
Entity D Entity C Entity B
• Investment property,
invested for total return
• Assets $1,000
• Loans, MBS
• Assets $33
• Non-investment property
• Assets $34
• Assume Entity A controls Entities B, C and D
• Substantially all of Entity A’s activities are investing in real estate properties
Entity A would be an IPE, but only the investment property (of Entity B)
would be reported at fair value
Proposed FASB Changes ⟶ IPE v. IC (3) 26
• As another example of the inconsistencies and conflicts, consider:
FASB Changes ⟶ IPE v. IC (4) 27
• REIS’ position:5
– IPE – Rejects the FASB’s exposure draft: REAL ESTATE-INVESTMENT PROPERTY ENTITIES (TOPIC 973)
– IC – Supports the proposed AMENDMENTS TO THE SCOPE, MEASUREMENT, AND DISCLOSURE REQUIREMENTS OF FINANCIAL SERVICES-INVESTMENT COMPANIES (TOPIC 946),
• as a workable, though less-than-perfect, solution.
5 For more details, please see REIS Webinar (2-1-12): Investors Committee Discussion – FASB Exposure Drafts: Investment Property Entities (Topic 973) and Financial Services-Investment Companies (Topic 946), Amendments to the Scope, Measurement, and Disclosure Requirements. WHY INVESTORS SHOULD CARE AND WHAT INVESTORS SHOULD DO.
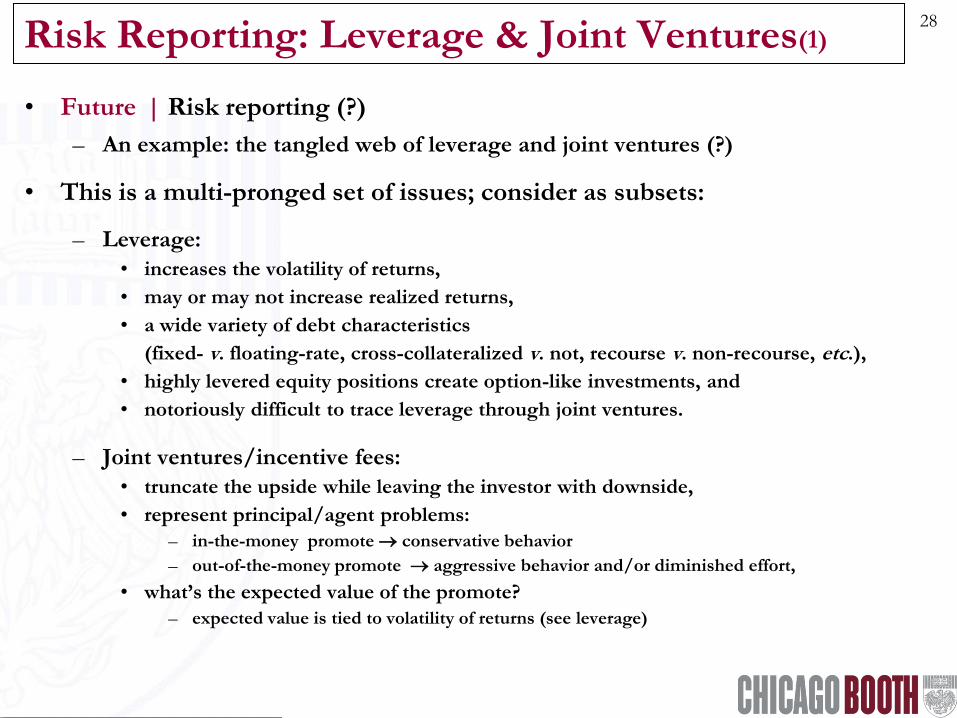
Risk Reporting: Leverage & Joint Ventures(1) 28
• Future | Risk reporting (?)
– An example: the tangled web of leverage and joint ventures (?)
• This is a multi-pronged set of issues; consider as subsets:
– Leverage:
• increases the volatility of returns,
• may or may not increase realized returns,
• a wide variety of debt characteristics
(fixed- v. floating-rate, cross-collateralized v. not, recourse v. non-recourse, etc.),
• highly levered equity positions create option-like investments, and
• notoriously difficult to trace leverage through joint ventures.
– Joint ventures/incentive fees:
• truncate the upside while leaving the investor with downside,
• represent principal/agent problems:
– in-the-money promote conservative behavior
– out-of-the-money promote aggressive behavior and/or diminished effort,
• what’s the expected value of the promote?
– expected value is tied to volatility of returns (see leverage)
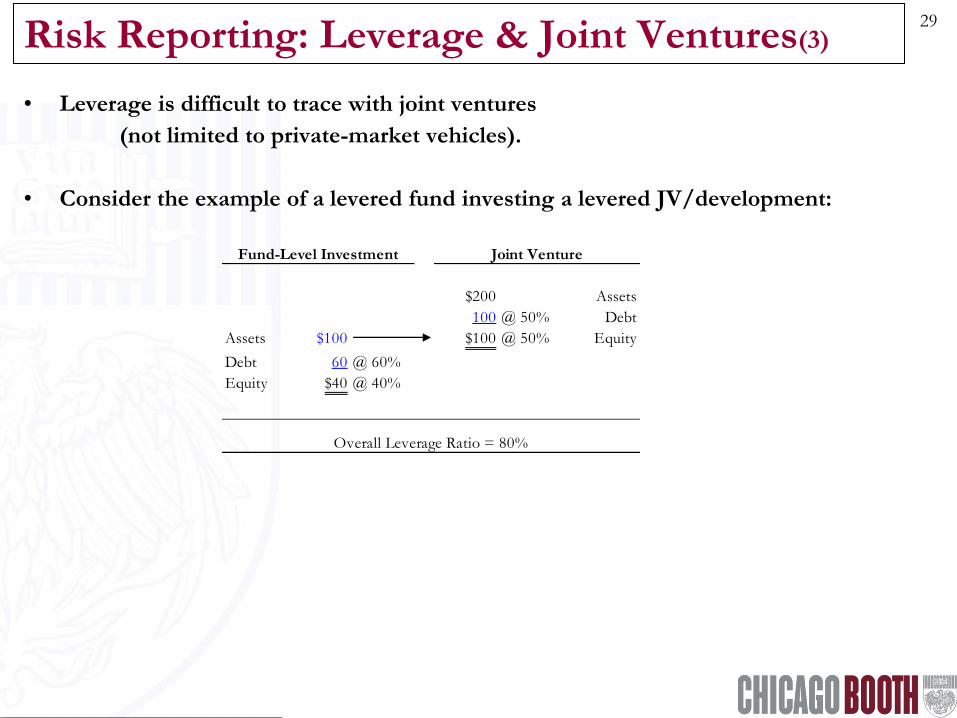
Risk Reporting: Leverage & Joint Ventures(3) 29
• Leverage is difficult to trace with joint ventures
(not limited to private-market vehicles).
• Consider the example of a levered fund investing a levered JV/development:
$200 Assets
100 @ 50% Debt
Assets $100 $100 @ 50% Equity
Debt 60 @ 60%
Equity $40 @ 40%
Fund-Level Investment Joint Venture
Overall Leverage Ratio = 80%
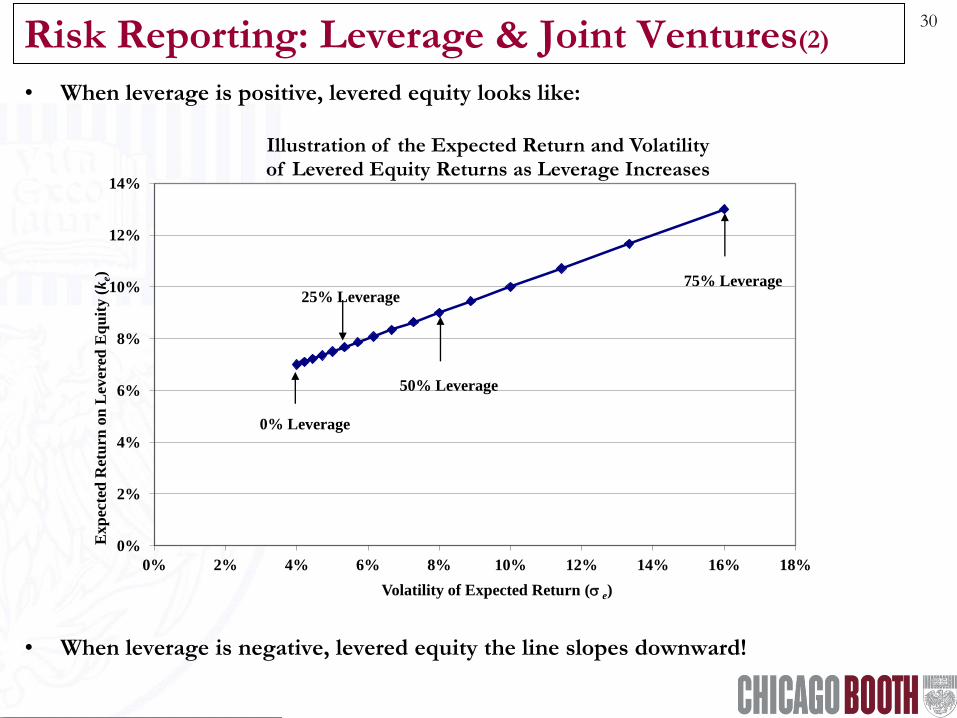
Risk Reporting: Leverage & Joint Ventures(2) 30
• When leverage is positive, levered equity looks like:
• When leverage is negative, levered equity the line slopes downward!
0%
2%
4%
6%
8%
10%
12%
14%
0% 2% 4% 6% 8% 10% 12% 14% 16% 18%
Exp
ecte
d R
etu
rn o
n L
ever
ed E
qu
ity (
ke)
Volatility of Expected Return (s e)
Illustration of the Expected Return and Volatility of Levered Equity Returns as Leverage Increases
0% Leverage
75% Leverage
50% Leverage
25% Leverage
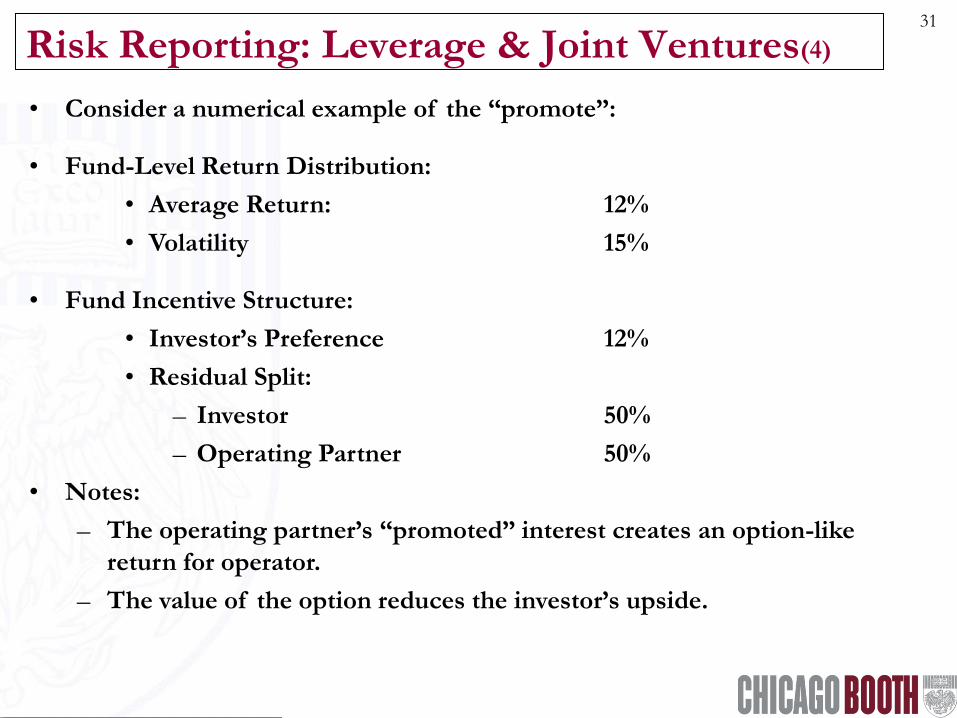
Risk Reporting: Leverage & Joint Ventures(4)
31
• Consider a numerical example of the “promote”:
• Fund-Level Return Distribution:
• Average Return: 12%
• Volatility 15%
• Fund Incentive Structure:
• Investor’s Preference 12%
• Residual Split:
– Investor 50%
– Operating Partner 50%
• Notes:
– The operating partner’s “promoted” interest creates an option-like
return for operator.
– The value of the option reduces the investor’s upside.
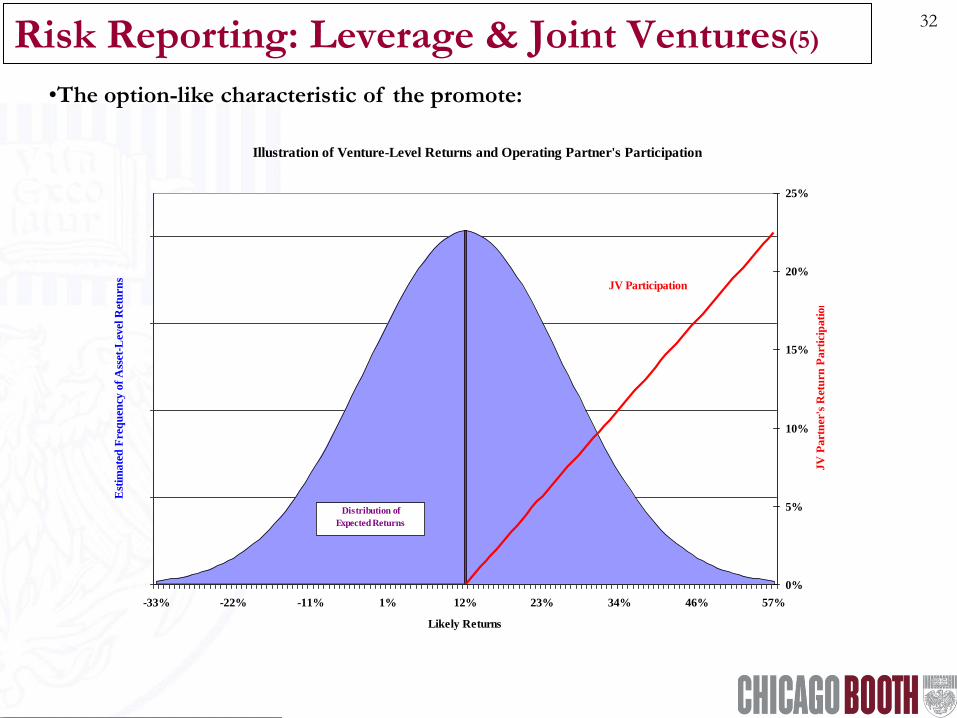
Risk Reporting: Leverage & Joint Ventures(5) 32
Illustration of Venture-Level Returns and Operating Partner's Participation
0%
1%
1%
2%
2%
-33% -22% -11% 1% 12% 23% 34% 46% 57%
Likely Returns
Est
ima
ted
Fre
qu
ency
of
Ass
et-L
evel
Ret
urn
s
0%
5%
10%
15%
20%
25%
JV
Pa
rtn
er's
Ret
urn
Pa
rtic
ipa
tio
n
Distribution of
Expected Returns
JV Participation
•The option-like characteristic of the promote:
Risk Reporting: Leverage & Joint Ventures(6)
33
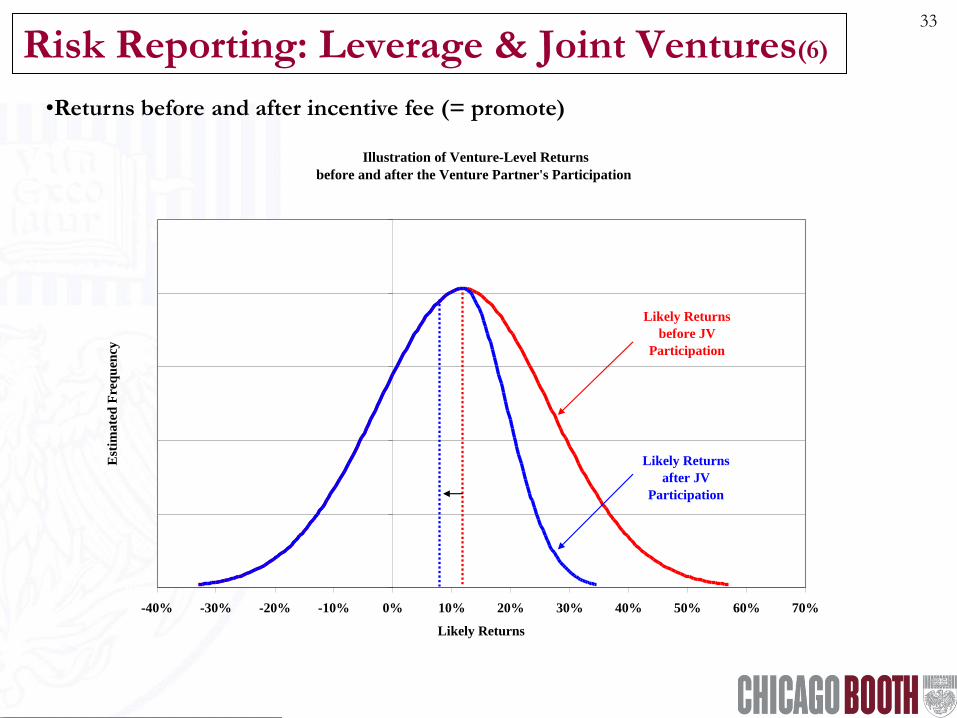
Illustration of Venture-Level Returns
before and after the Venture Partner's Participation
0%
1%
1%
2%
2%
3%
-40% -30% -20% -10% 0% 10% 20% 30% 40% 50% 60% 70%
Likely Returns
Est
imate
d F
req
uen
cy
Likely Returns
before JV
Participation
Likely Returns
after JV
Participation
•Returns before and after incentive fee (= promote)
Risk Reporting: Leverage & Joint Ventures(7) 34
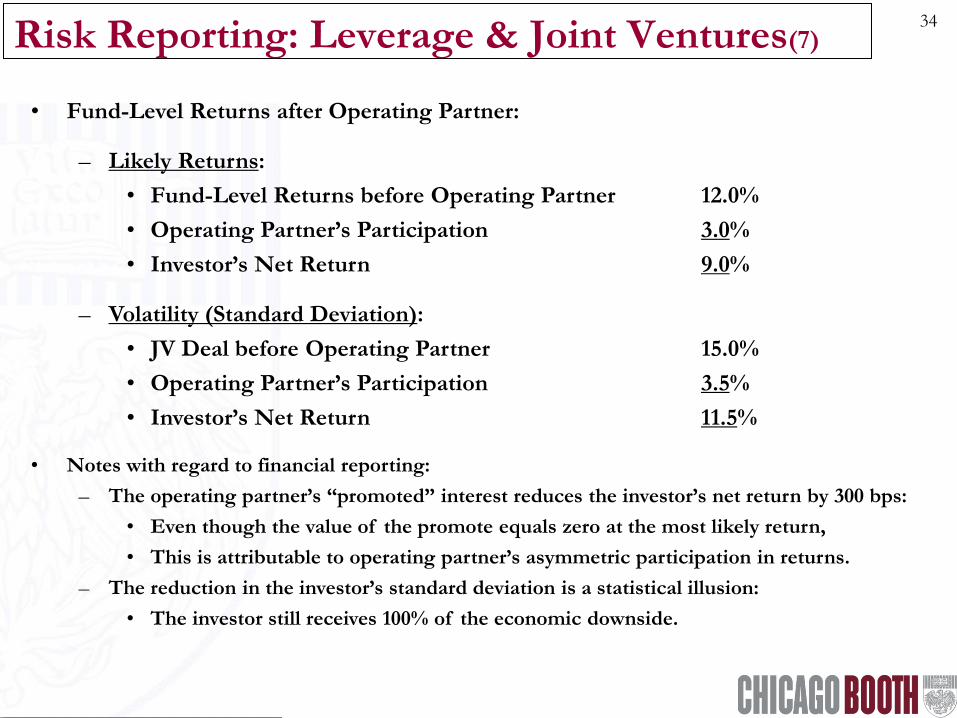
• Fund-Level Returns after Operating Partner:
– Likely Returns:
• Fund-Level Returns before Operating Partner 12.0%
• Operating Partner’s Participation 3.0%
• Investor’s Net Return 9.0%
– Volatility (Standard Deviation):
• JV Deal before Operating Partner 15.0%
• Operating Partner’s Participation 3.5%
• Investor’s Net Return 11.5%
• Notes with regard to financial reporting:
– The operating partner’s “promoted” interest reduces the investor’s net return by 300 bps:
• Even though the value of the promote equals zero at the most likely return,
• This is attributable to operating partner’s asymmetric participation in returns.
– The reduction in the investor’s standard deviation is a statistical illusion:
• The investor still receives 100% of the economic downside.
Risk Reporting: Leverage & Joint Ventures(8) 35
• Now that we have a better understanding, what might be next steps?
• REIS’ potential role:
– What information will better equip investors to make informed judgments?
• clearer reporting of leverage ratios, including JVs, of major investments,
• clearer reporting of “pref” and promote structure of major investments
(note: aggregation “masks” true expected value of promote),
• scenarios/simulations of when promote is “in-the-money,”
• what other guarantees and/or promotes might operating partner/developer be involved with (early warning on “house of cards” ← “sponsor” risk), and
• consider methods to help standardize the historical reporting of:
– past promotes, and/or
– investors’ net returns.
• REIS’ position:
– To-be-determined !
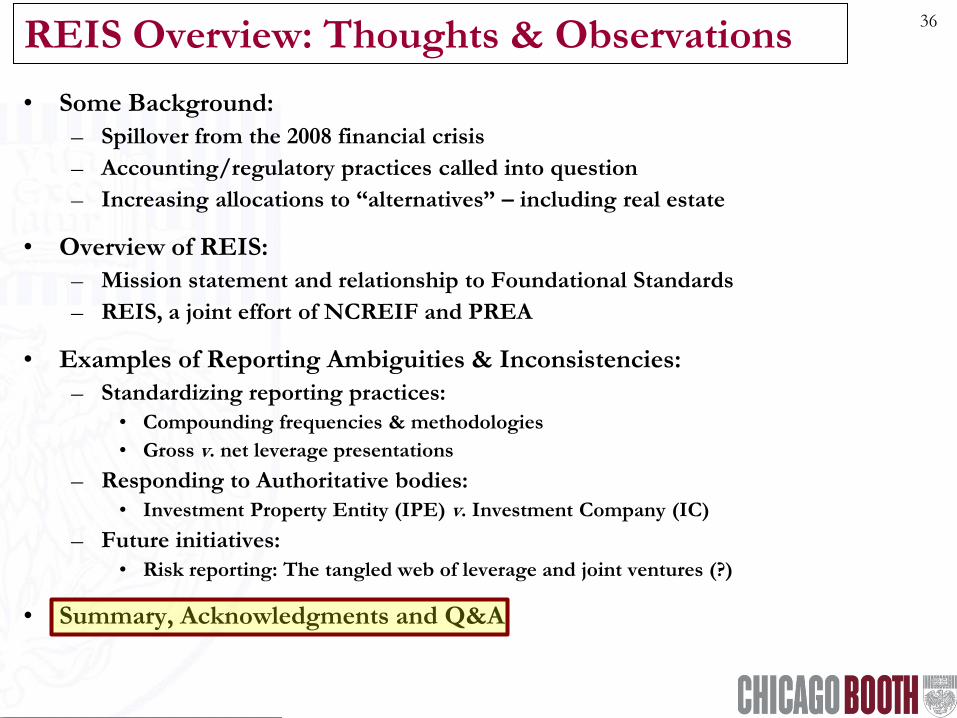
REIS Overview: Thoughts & Observations 36
• Some Background:
– Spillover from the 2008 financial crisis
– Accounting/regulatory practices called into question
– Increasing allocations to “alternatives” – including real estate
• Overview of REIS:
– Mission statement and relationship to Foundational Standards
– REIS, a joint effort of NCREIF and PREA
• Examples of Reporting Ambiguities & Inconsistencies:
– Standardizing reporting practices:
• Compounding frequencies & methodologies
• Gross v. net leverage presentations
– Responding to Authoritative bodies:
• Investment Property Entity (IPE) v. Investment Company (IC)
– Future initiatives:
• Risk reporting: The tangled web of leverage and joint ventures (?)
• Summary, Acknowledgments and Q&A
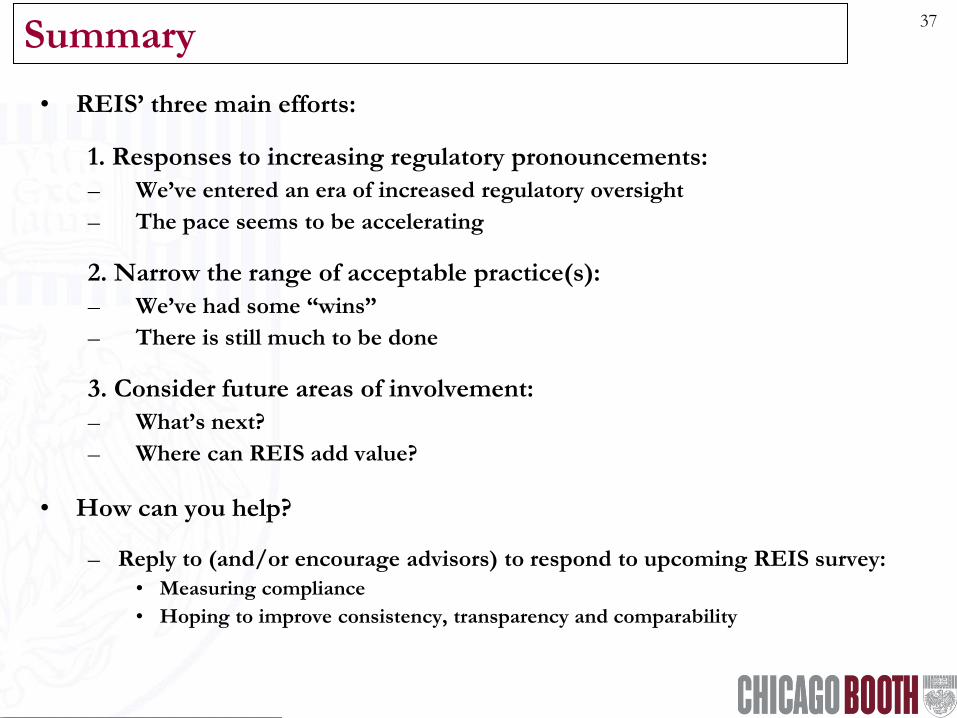
Summary 37
• REIS’ three main efforts:
1. Responses to increasing regulatory pronouncements:
– We’ve entered an era of increased regulatory oversight
– The pace seems to be accelerating
2. Narrow the range of acceptable practice(s):
– We’ve had some “wins”
– There is still much to be done
3. Consider future areas of involvement:
– What’s next?
– Where can REIS add value?
• How can you help?
– Reply to (and/or encourage advisors) to respond to upcoming REIS survey:
• Measuring compliance
• Hoping to improve consistency, transparency and comparability
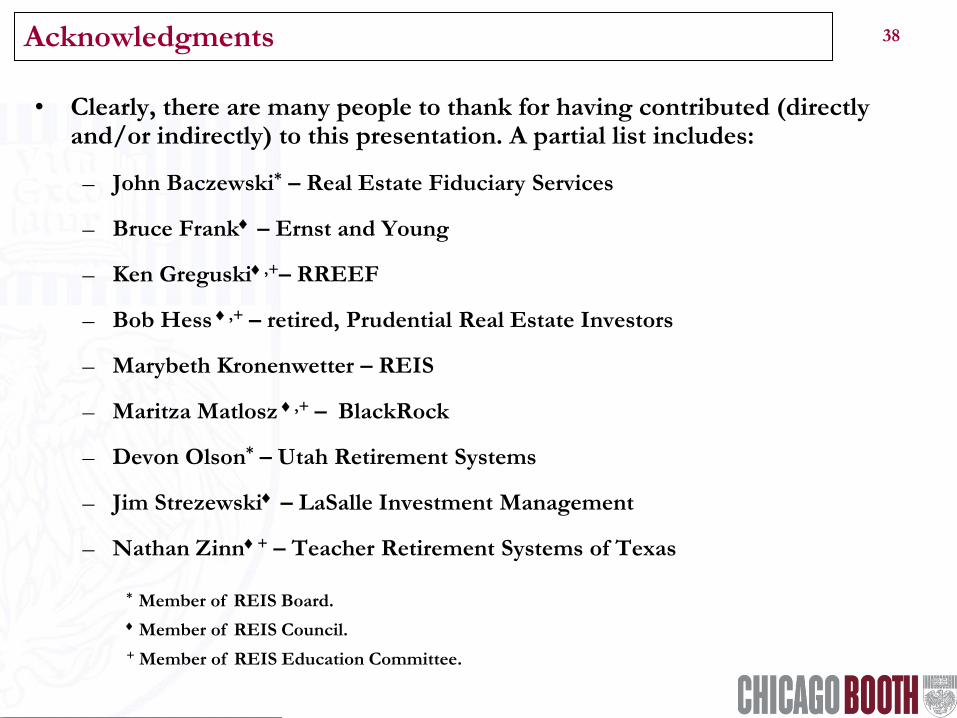
38 Acknowledgments
• Clearly, there are many people to thank for having contributed (directly and/or indirectly) to this presentation. A partial list includes:
– John Baczewski* – Real Estate Fiduciary Services
– Bruce Frank – Ernst and Young
– Ken Greguski,+– RREEF
– Bob Hess ,+ – retired, Prudential Real Estate Investors
– Marybeth Kronenwetter – REIS
– Maritza Matlosz ,+ – BlackRock
– Devon Olson* – Utah Retirement Systems
– Jim Strezewski – LaSalle Investment Management
– Nathan Zinn+ – Teacher Retirement Systems of Texas
* Member of REIS Board.
Member of REIS Council.
+ Member of REIS Education Committee.

39
Questions & (Hopefully Sensible) Answers?