Embed Size (px)
Citation preview

Reinsurance Market Briefing
FIFA Museum AG, Zurich
Carlos Wong-FupuySenior Director
Nick Charteris-BlackManaging Director,Market Development - EMEA
18 September 2019
Catherine ThomasSenior Director, Analytics
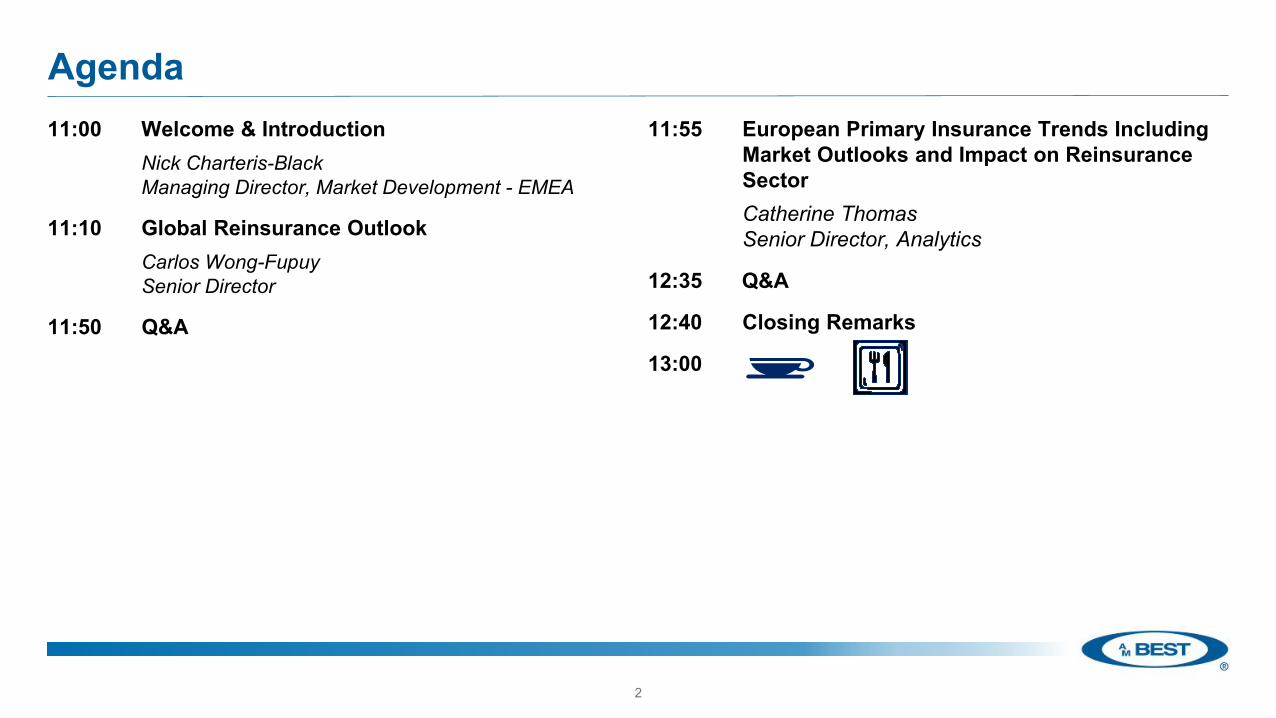
Agenda
2
11:00 Welcome & IntroductionNick Charteris-BlackManaging Director, Market Development - EMEA
11:10 Global Reinsurance OutlookCarlos Wong-FupuySenior Director
11:50 Q&A
11:55 European Primary Insurance Trends Including Market Outlooks and Impact on Reinsurance SectorCatherine ThomasSenior Director, Analytics
12:35 Q&A
12:40 Closing Remarks
13:00

Preparing for Brexit
3
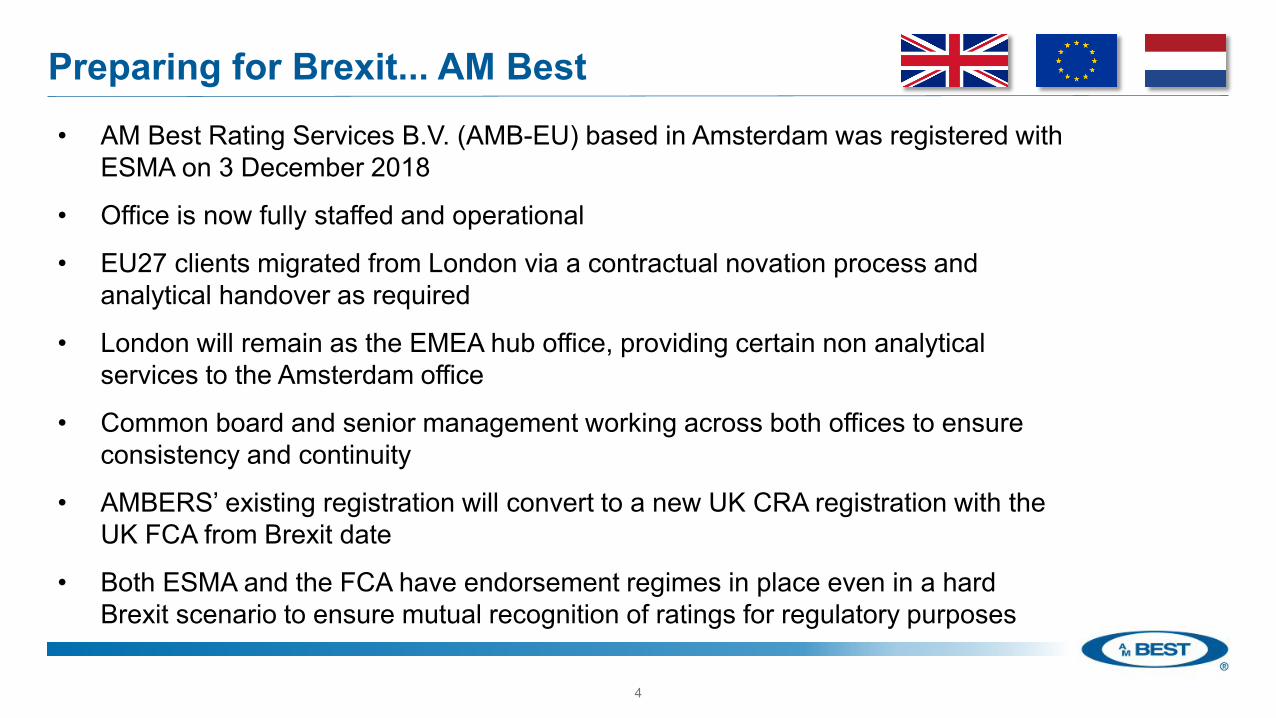
Preparing for Brexit... AM Best• AM Best Rating Services B.V. (AMB-EU) based in Amsterdam was registered with
ESMA on 3 December 2018
• Office is now fully staffed and operational
• EU27 clients migrated from London via a contractual novation process and analytical handover as required
• London will remain as the EMEA hub office, providing certain non analytical services to the Amsterdam office
• Common board and senior management working across both offices to ensure consistency and continuity
• AMBERS’ existing registration will convert to a new UK CRA registration with the UK FCA from Brexit date
• Both ESMA and the FCA have endorsement regimes in place even in a hard Brexit scenario to ensure mutual recognition of ratings for regulatory purposes
4
© AM Best Company, Inc. (AMB) and/or its licensors and affiliates. All rights reserved. ALL INFORMATION CONTAINED HEREIN IS PROTECTED BY COPYRIGHT LAW ANDNONE OF SUCH INFORMATION MAY BE COPIED OR OTHERWISE REPRODUCED, REPACKAGED, FURTHER TRANSMITTED, TRANSFERRED, DISSEMINATED,REDISTRIBUTED OR RESOLD, OR STORED FOR SUBSEQUENT USE FOR ANY SUCH PURPOSE, IN WHOLE OR IN PART, IN ANY FORM OR MANNER OR BY ANYMEANS WHATSOEVER, BY ANY PERSON WITHOUT AMB’s PRIOR WRITTEN CONSENT. All information contained herein is obtained by AMB from sources believed by it to beaccurate and reliable. AMB does not audit or otherwise independently verify the accuracy or reliability of information received or otherwise used and therefore all informationcontained herein is provided “AS IS” without warranty of any kind. Under no circumstances shall AMB have any liability to any person or entity for (a) any loss or damage in wholeor in part caused by, resulting from, or relating to, any error (negligent or otherwise) or other circumstance or contingency within or outside the control of AMB or any of its directors,officers, employees or agents in connection with the procurement, collection, compilation, analysis, interpretation, communication, publication or delivery of any such information, or(b) any direct, indirect, special, consequential, compensatory or incidental damages whatsoever (including without limitation, lost profits), even if AMB is advised in advance of thepossibility of such damages, resulting from the use of or inability to use, any such information. The credit ratings, financial reporting analysis, projections, and other observations, ifany, constituting part of the information contained herein are, and must be construed solely as, statements of opinion and not statements of fact or recommendations to purchase,sell or hold any securities, insurance policies, contracts or any other financial obligations, nor does it address the suitability of any particular financial obligation for a specificpurpose or purchaser. Credit risk is the risk that an entity may not meet its contractual, financial obligations as they come due. Credit ratings do not address any other risk,including but not limited to, liquidity risk, market value risk or price volatility of rated securities. AMB is not an investment advisor and does not offer consulting or advisory services,nor does the company or its rating analysts offer any form of structuring or financial advice. NO WARRANTY, EXPRESS OR IMPLIED, AS TO THE ACCURACY, TIMELINESS,COMPLETENESS, MERCHANTABILITY OR FITNESS FOR ANY PARTICULAR PURPOSE OF ANY SUCH RATING OR OTHER OPINION OR INFORMATION IS GIVEN ORMADE BY AMB IN ANY FORM OR MANNER WHATSOEVER. Each credit rating or other opinion must be weighed solely as one factor in any investment or purchasing decisionmade by or on behalf of any user of the information contained herein, and each such user must accordingly make its own study and evaluation of each security or other financialobligation and of each issuer and guarantor of, and each provider of credit support for, each security or other financial obligation that it may consider purchasing, holding or selling.
5

6
US Securities Laws explicitly prohibit the issuance or maintenance of a credit rating where a person involvedin the sales or marketing of a product or service of the CRA also participates in determining or monitoring thecredit rating, or developing or approving procedures or methodologies used for determining the credit rating.
No part of this presentation amounts to sales / marketing activity and AM Best’s Rating Divisionemployees are prohibited from participating in commercial discussions.
Any queries of a commercial nature should be directed to AM Best’s Market Development function.

Discussion Outline
7
Outlook
Capital
Developments
Performance
Global Reinsurance Market

Global Reinsurance Market Outlook
8
Headwinds TailwindsIntense competition Increasing alignment between traditional
and third-party capitalExcess capacity limits the potential forimprovement
Improving pricing discipline for property cat and retro in particular
Potential for increased inflation Accelerating pricing momentum at the primary insurance level
Less cushion in carried loss reserves US economic growth slows, but continues
Continued interest from third-party capital, even beyond prop-cat lines
Use of third-party capital in retrocession programs reducing earnings volatility
December 2018 – AM Best revised the outlook on the Global Reinsurance sector to Stable
Global Reinsurance MarketPerformance

Global Reinsurance Market Performance
Source: AM Best data and research
Combined Ratio
10
89.7% 90.4% 95.2%
110.1%102.3% 97.6%
2014 2015 2016 2017 2018 Five Year Average

Global Reinsurance Market Performance
European “Big Four” U.S. & Bermuda Lloyd’s
Combined Ratios by Reinsurance Sector
11Source: AM Best data and research
92.4% 91.8% 96.3%108.9%
99.7%87.4% 88.9% 92.5%
109.2% 103.8%
88.1% 90.0%97.9%
114.0%104.6%
2014 2015 2016 2017 2018 2014 2015 2016 2017 2018 2014 2015 2016 2017 2018
Loss Ratio
Expense Ratio

11.6%
9.5%8.3%
-0.3% 1.0%
2014 2015 2016 2017 2018
Five Year Average 6.0%
Global Reinsurance Market Performance
Return on Equity
12Source: AM Best data and research

Global Reinsurance Market Performance
European “Big Four” U.S. & Bermuda Lloyd’s
Return on Equity by Reinsurance Sector
13Source: AM Best data and research
11.0% 11.5%9.7%
2.7%
5.8%
10.9%
7.5% 6.8%
-0.5% -1.5%
14.7%
8.9% 8.1%
-7.3%
-3.7%
2014 2015 2016 2017 2018 2014 2015 2016 2017 2018 2014 2015 2016 2017 2018
Five Year Average
6.0%

Global Reinsurance Market Performance
11%
7%8%
5%6%
3%
Five-Year Average Return onEquity
Five-Year Average Return onEquity
(Excluding Loss ReserveDevelopment)
Year-End 2016Year-End 2017Year-End 2018
Global Reinsurance Market
14Source: AM Best data and research

0
5
10
15
20
2006 2007 2008 2009 2010 2011 2012 2013 2014 2015 2016 2017 2018
(%)
Median ROCE Median WACC
Global Reinsurance Market Performance
Reinsurers' Median return on common equity (ROCE)Compared to Median weighted average cost of capital (WACC) (%)
Source: Bloomberg 15

Global Reinsurance MarketCapital

Global Reinsurance Market Capital
17Notes and Sources: Estimates by Guy Carpenter and AM Best
Estimate - Total Dedicated Reinsurance Capital (USD billions)
292 320 340 332 345 345 341 346
19
48 60 68 75 87 95 92 311
368400 400 420 432 436 438
2012 2013 2014 2015 2016 2017 2018 2019E
Third-Party – Trapped Portion(High Estimate)
Third-Party – Trapped Portion(Low Estimate)
Third-Party
Traditional
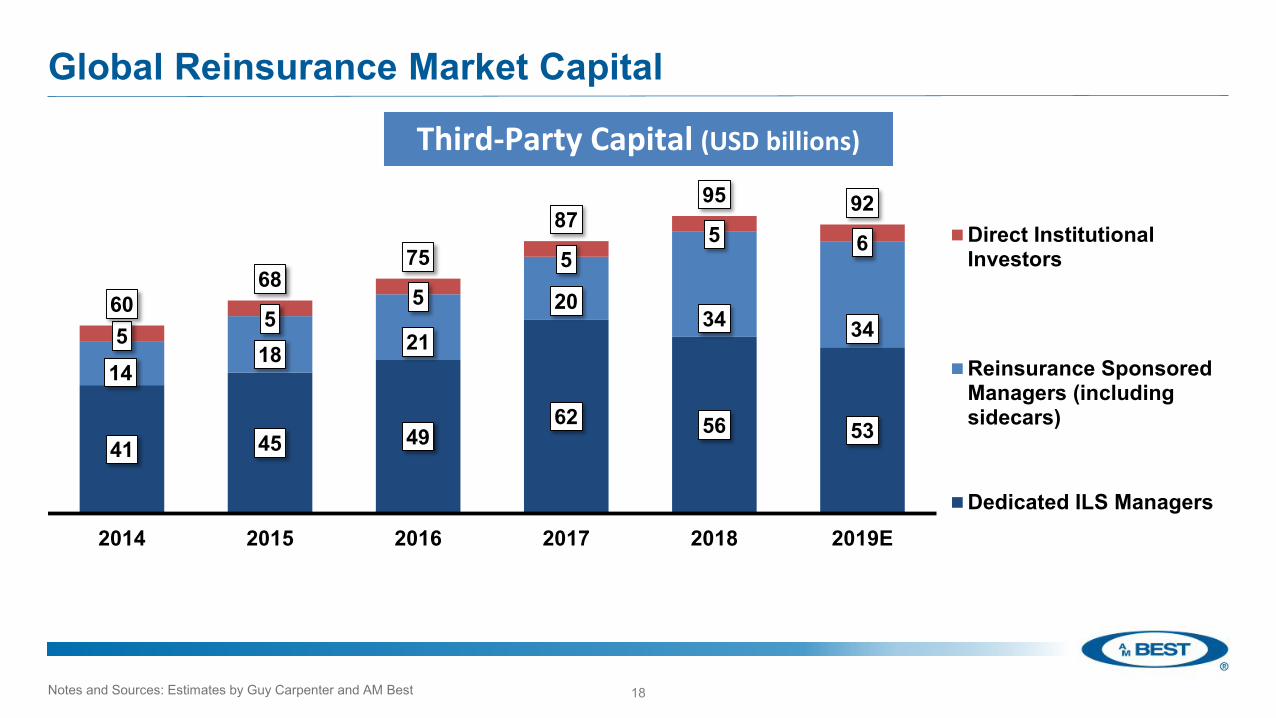
Global Reinsurance Market Capital
18Notes and Sources: Estimates by Guy Carpenter and AM Best
2017 Reinsurance Market Briefing, Monte Carlo10 September 2017
Third-Party Capital (USD billions)
41 45 4962 56 53
1418 21
2034 345
55
55 6
6068
7587
95 92
2014 2015 2016 2017 2018 2019E
Direct InstitutionalInvestors
Reinsurance SponsoredManagers (includingsidecars)
Dedicated ILS Managers

Global Reinsurance - Top 15 ILS Funds (July 2019)
19Notes:Renaissance Re includes Top Layer, DaVinci, Langhorn, Vermeer and Medici.Source: Artemis
2017 Reinsurance Market Briefing, Monte Carlo10 September 2017
Assets Under Management
(AUM)(USD millions) Change in AUM Funds Location ILS Fund Managers Acquisitions
Nephila Capital 11,500 ▼ Bermuda Purchased by Markel 2018
RenaissanceRe Holdings Ltd. 8,200 ▲ Bermuda
Credit Suisse Insurance Linked Strategies Ltd. 8,000 ▼ Zurich, Switzerland
LGT ILS Partners Ltd. 7,100 ▼ Pfaeffikon, Switzerland
Markel CATCo Investment Management 6,800 ▼ Bermuda Purchased by Markel 2015
Fermat Capital Management, LLC 6,300 ▲ Westport, Connecticut, US
Stone Ridge Asset Management 5,930 ▼ New York
Securis Investment Partners LLP 5,900 ▼ London Northill bought out Swiss Re’s interest in 2012
Leadenhall Capital Partners LLP 5,500 ▲ London Purchased by Amlin 2014
AlphaCat Managers 4,200 ▲ Bermuda Purchased by AIG in 2018
Aeolus Capital Management Ltd 4,000 ● Hamilton, Bermuda Purchased by Elliott in 2016
Elementum Advisors, LLC 4,000 ● Chicago, IL White Mountain purchased 30% stake in 2019
Twelve Capital AG 4,000 ● Zurich, Switzerland
Schroder Investment Management 2,930 ▼ London
Amundi Pioneer 2,300 ▲ Boston, MA
Top 15 Fund Managers 86,660
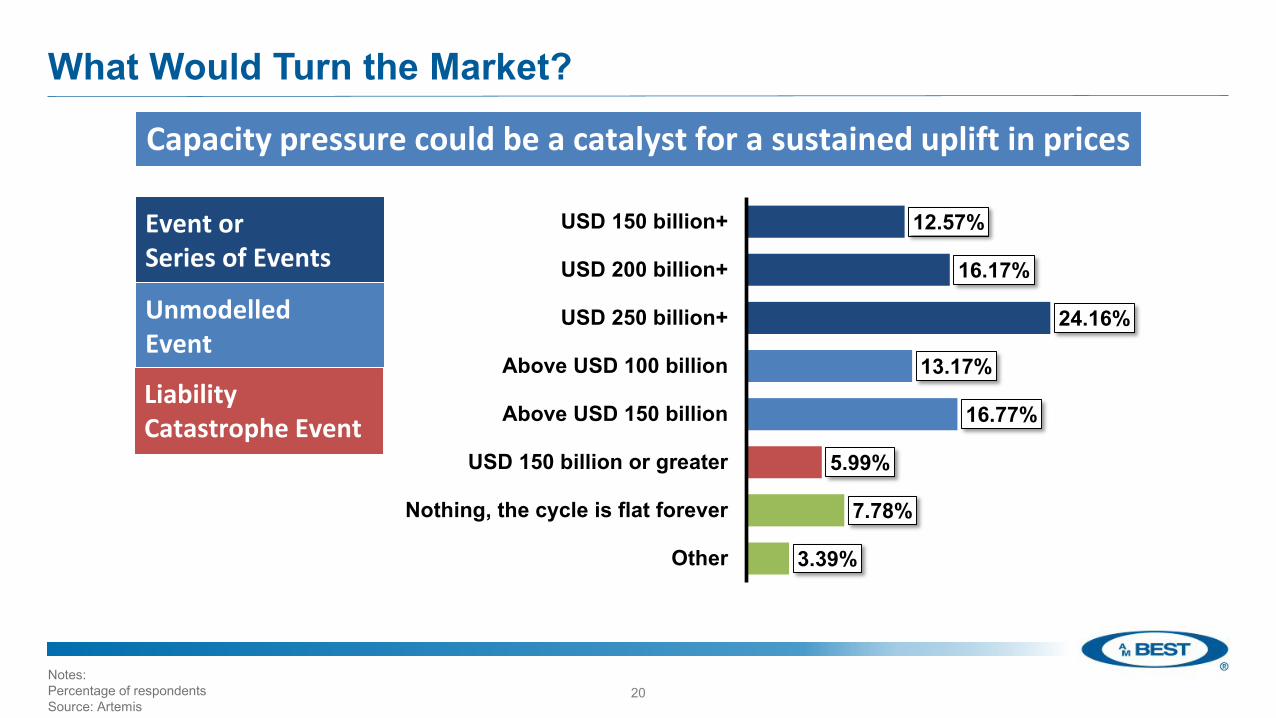
What Would Turn the Market?
20Notes:Percentage of respondentsSource: Artemis
12.57%
16.17%
24.16%
13.17%
16.77%
5.99%
7.78%
3.39%
USD 150 billion+
USD 200 billion+
USD 250 billion+
Above USD 100 billion
Above USD 150 billion
USD 150 billion or greater
Nothing, the cycle is flat forever
Other
Capacity pressure could be a catalyst for a sustained uplift in prices
Event or Series of Events
Unmodelled Event
Liability Catastrophe Event
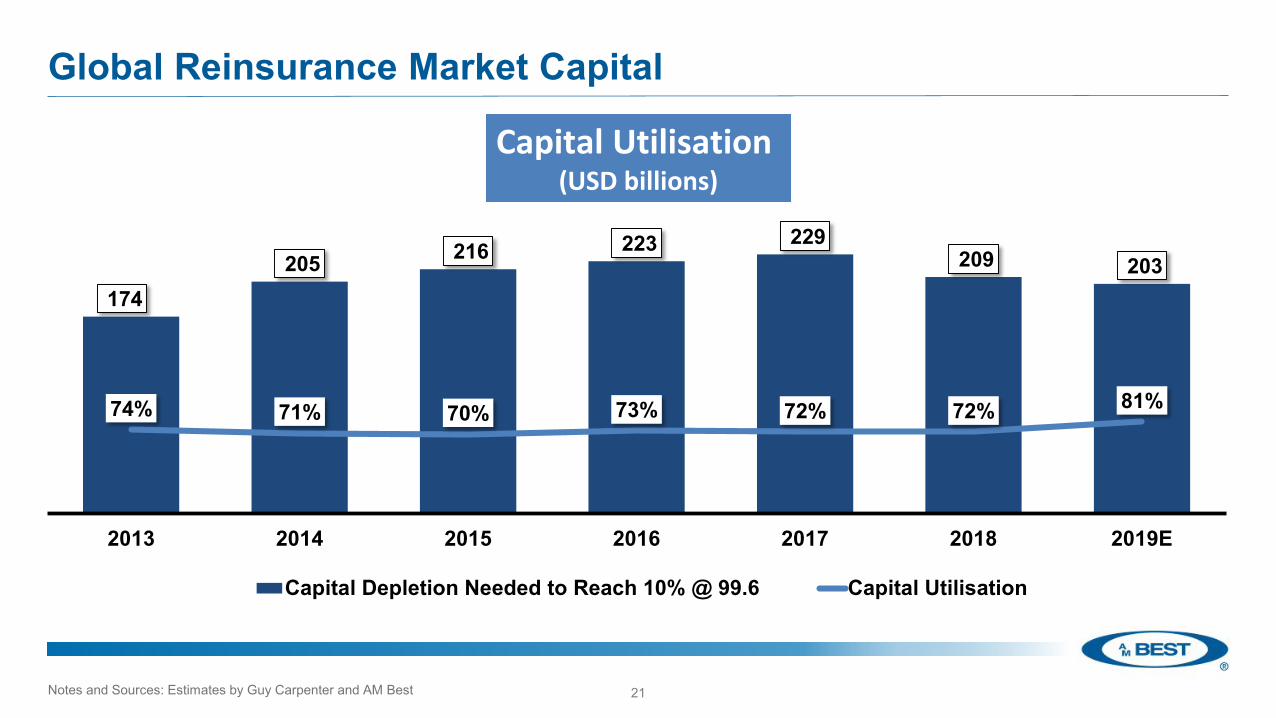
Global Reinsurance Market Capital
21
174 205 216 223 229
209 203
74% 71% 70% 73% 72% 72% 81%
2013 2014 2015 2016 2017 2018 2019E
Capital Depletion Needed to Reach 10% @ 99.6 Capital Utilisation
Capital Utilisation (USD billions)
Notes and Sources: Estimates by Guy Carpenter and AM Best
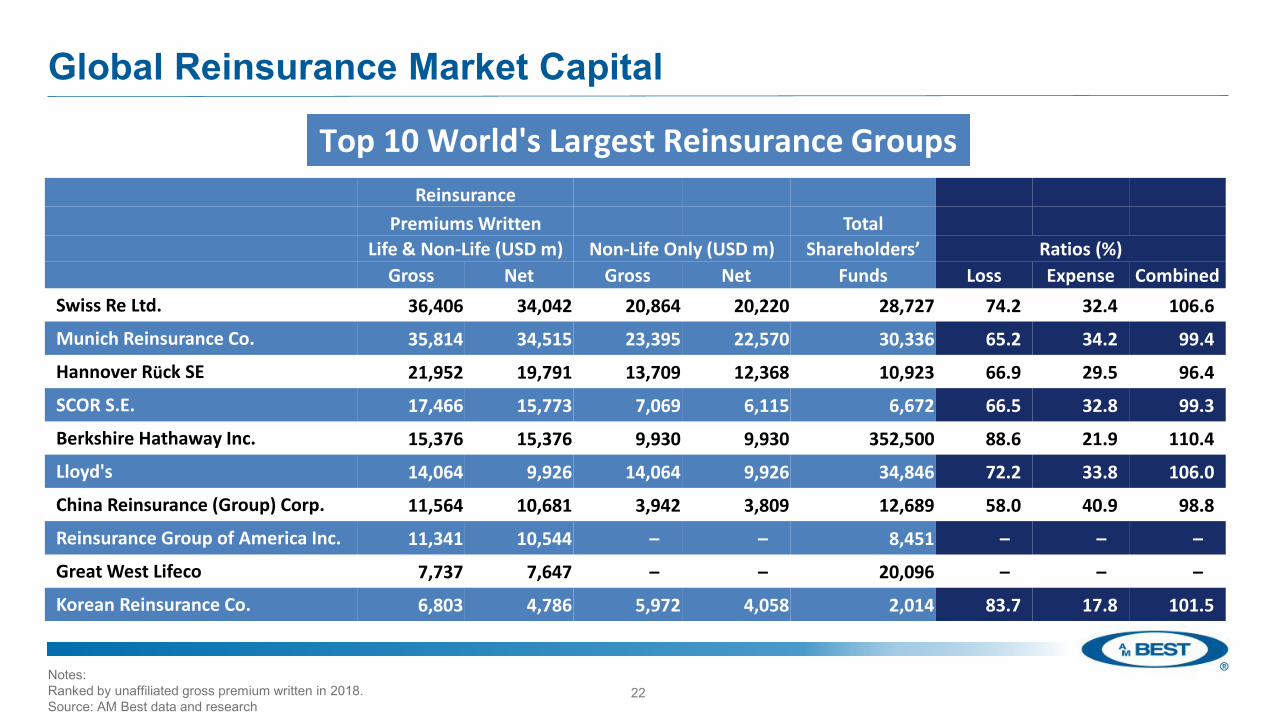
Global Reinsurance Market Capital
22
2017 Reinsurance Market Briefing, Monte Carlo10 September 2017
Top 10 World's Largest Reinsurance GroupsReinsurance
Premiums Written TotalLife & Non-Life (USD m) Non-Life Only (USD m) Shareholders’ Ratios (%)
Gross Net Gross Net Funds Loss Expense CombinedSwiss Re Ltd. 36,406 34,042 20,864 20,220 28,727 74.2 32.4 106.6
Munich Reinsurance Co. 35,814 34,515 23,395 22,570 30,336 65.2 34.2 99.4
Hannover Rück SE 21,952 19,791 13,709 12,368 10,923 66.9 29.5 96.4
SCOR S.E. 17,466 15,773 7,069 6,115 6,672 66.5 32.8 99.3
Berkshire Hathaway Inc. 15,376 15,376 9,930 9,930 352,500 88.6 21.9 110.4
Lloyd's 14,064 9,926 14,064 9,926 34,846 72.2 33.8 106.0
China Reinsurance (Group) Corp. 11,564 10,681 3,942 3,809 12,689 58.0 40.9 98.8
Reinsurance Group of America Inc. 11,341 10,544 – – 8,451 – – –
Great West Lifeco 7,737 7,647 – – 20,096 – – –
Korean Reinsurance Co. 6,803 4,786 5,972 4,058 2,014 83.7 17.8 101.5
Notes:Ranked by unaffiliated gross premium written in 2018.Source: AM Best data and research

Global Reinsurance Market Capital
23
Munich Reinsurance Co.
Swiss Re Ltd.
Lloyd's
Hannover Rück SE
Berkshire Hathaway Inc.
SCOR S.E.
Everest Re Group Ltd.
PartnerRe Ltd.
XL Bermuda Ltd.
Transatlantic Holdings, Inc.
Top 10 Global Reinsurance Groups Non-Life
Top 10 Global Reinsurance GroupsLife
Swiss Re Ltd.
Munich Reinsurance Co.
Reinsurance Group of America Inc.
SCOR S.E.
Hannover Rück SE
Great West Lifeco
Berkshire Hathaway Inc.
Pacific LifeCorp
Assicurazioni Generali SpA
PartnerRe Ltd.
Notes:Ranked by unaffiliated gross premium written in 2018.Source: AM Best data and research

Global Reinsurance Market Capital
24
Life and Non-Life Reinsurance GPW Distribution by Ranking
Rank 1-1067.9%
Rank 11-2017.2%
Rank 21-307.6%
Rank 31-404.8%
Rank 41-502.5%

Surviving Franchises of Today
• Arch• AXIS• Everest Re• Hannover Re• Lloyd’s• Munich Re• RenaissanceRe• SCOR• Swiss Re
ShelteredFranchises
• Allied World• Aspen• AXA-XL• Endurance(Sompo Intl)• General Re• MS Amlin• Odyssey Re• National Indemnity• Partner Re• TransRe• Validus
Franchises that are Gone
• Ariel Re• Flagstone• Harbor Point / Max (Alterra)• IPC Re• Maiden• Montpellier• New Castle Re• Paris Re• Platinum Re• Tokio Millennium Re
What does the Future Hold?
• Fidelis• Greenlight Re• Hamilton• Harrington Re• Third Point Re• Watford Re
Market Landscape ~10 Years In Time
25
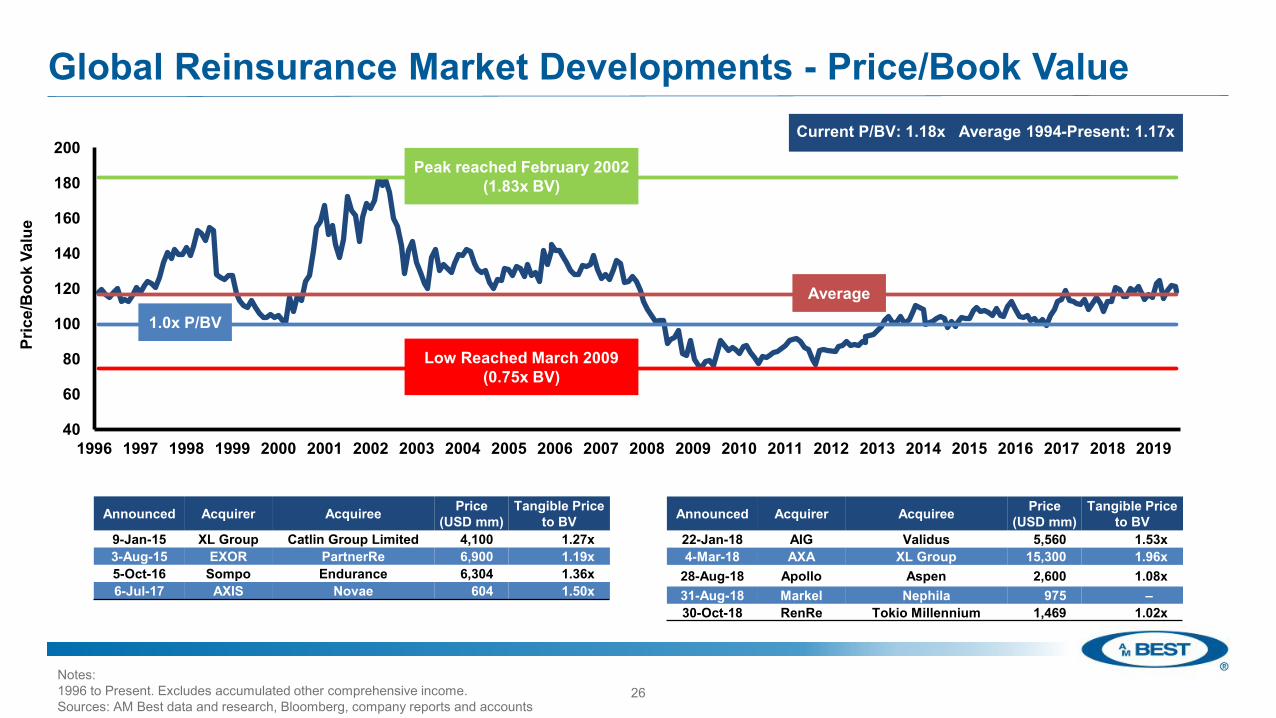
Global Reinsurance Market Developments - Price/Book Value
40
60
80
100
120
140
160
180
200
1996 1997 1998 1999 2000 2001 2002 2003 2004 2005 2006 2007 2008 2009 2010 2011 2012 2013 2014 2015 2016 2017 2018 2019
Pric
e/B
ook
Valu
e
Average
Current P/BV: 1.18x Average 1994-Present: 1.17x
Low Reached March 2009 (0.75x BV)
Peak reached February 2002 (1.83x BV)
1.0x P/BV
Announced Acquirer Acquiree Price (USD mm)
Tangible Price to BV
9-Jan-15 XL Group Catlin Group Limited 4,100 1.27x3-Aug-15 EXOR PartnerRe 6,900 1.19x5-Oct-16 Sompo Endurance 6,304 1.36x6-Jul-17 AXIS Novae 604 1.50x
26Notes:1996 to Present. Excludes accumulated other comprehensive income.Sources: AM Best data and research, Bloomberg, company reports and accounts
Announced Acquirer Acquiree Price (USD mm)
Tangible Price to BV
22-Jan-18 AIG Validus 5,560 1.53x4-Mar-18 AXA XL Group 15,300 1.96x
28-Aug-18 Apollo Aspen 2,600 1.08x31-Aug-18 Markel Nephila 975 –30-Oct-18 RenRe Tokio Millennium 1,469 1.02x
Global Reinsurance MarketDevelopments

Reinsurance Rates – Response to Influx of Alternative Capital
28Source: Guy Carpenter
Supply and Demand
Reinsurance rates in the Florida property cat market dropped in response to an influx of alternative capital

Catastrophe Losses do have Reserve Tails (1)
29
Hurricane Irma (2017) loss creep surprised both reinsurers and ILS funds exceeding USD 1 billion
Impact of development based on Florida footprint
Demand surge stressed claim adjustment process
Assignment of Benefits (AOB) resulted in higher loss cost
AOB lawsuits increased from 1,300 in 2000 to 135,000 in 2018
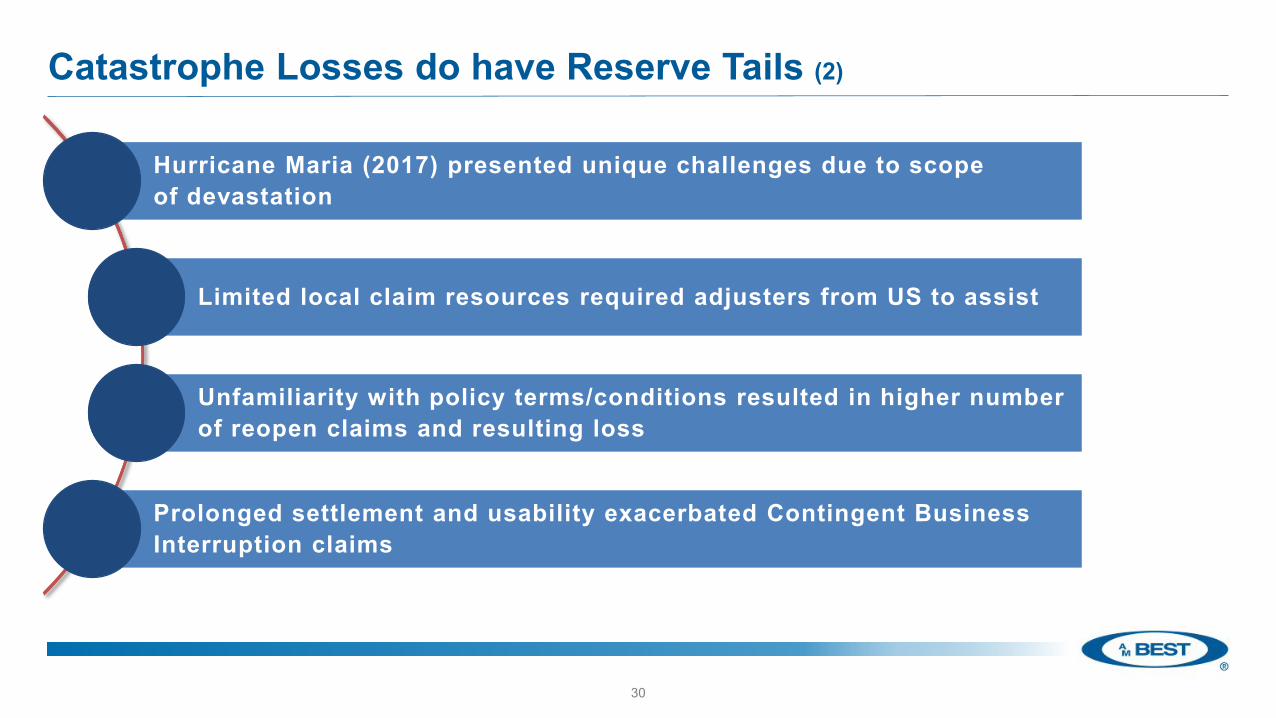
Catastrophe Losses do have Reserve Tails (2)
30
Hurricane Maria (2017) presented unique challenges due to scope of devastation
Limited local claim resources required adjusters from US to assist
Unfamiliarity with policy terms/conditions resulted in higher number of reopen claims and resulting loss
Prolonged settlement and usability exacerbated Contingent Business Interruption claims
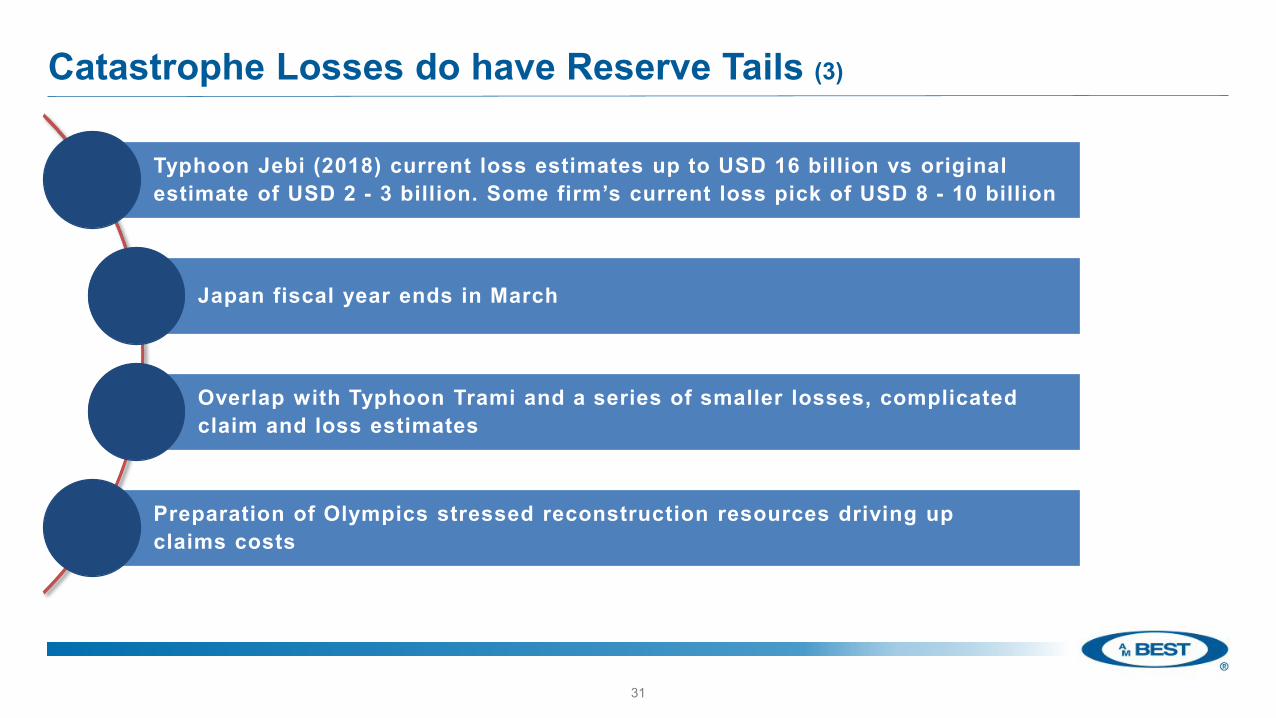
Catastrophe Losses do have Reserve Tails (3)
31
Typhoon Jebi (2018) current loss estimates up to USD 16 billion vs original estimate of USD 2 - 3 billion. Some firm’s current loss pick of USD 8 - 10 billion
Japan fiscal year ends in March
Overlap with Typhoon Trami and a series of smaller losses, complicated claim and loss estimates
Preparation of Olympics stressed reconstruction resources driving up claims costs
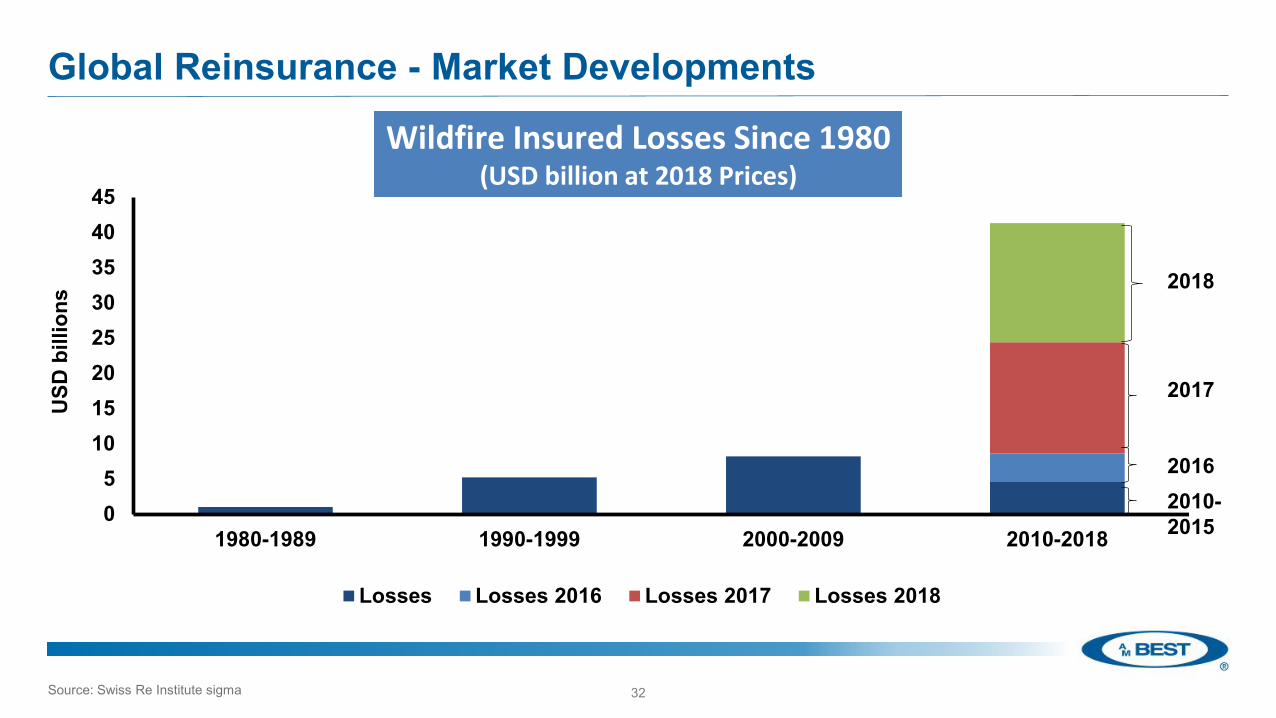
Global Reinsurance - Market Developments
32
2017 Reinsurance Market Briefing, Monte Carlo10 September 2017
05
1015202530354045
1980-1989 1990-1999 2000-2009 2010-2018
USD
bill
ions
Losses Losses 2016 Losses 2017 Losses 2018
Wildfire Insured Losses Since 1980(USD billion at 2018 Prices)
2018
2017
20162010-2015
Source: Swiss Re Institute sigma

Possible Turn in Trajectory
Capital elasticity has flattened the reinsurance market cycle
USD 219 billion in Cat losses over a
24 month period ending
December 2018
Capacity crunch in
retrocession markets
Earnings under
pressure Increased
demand for reinsurance
33
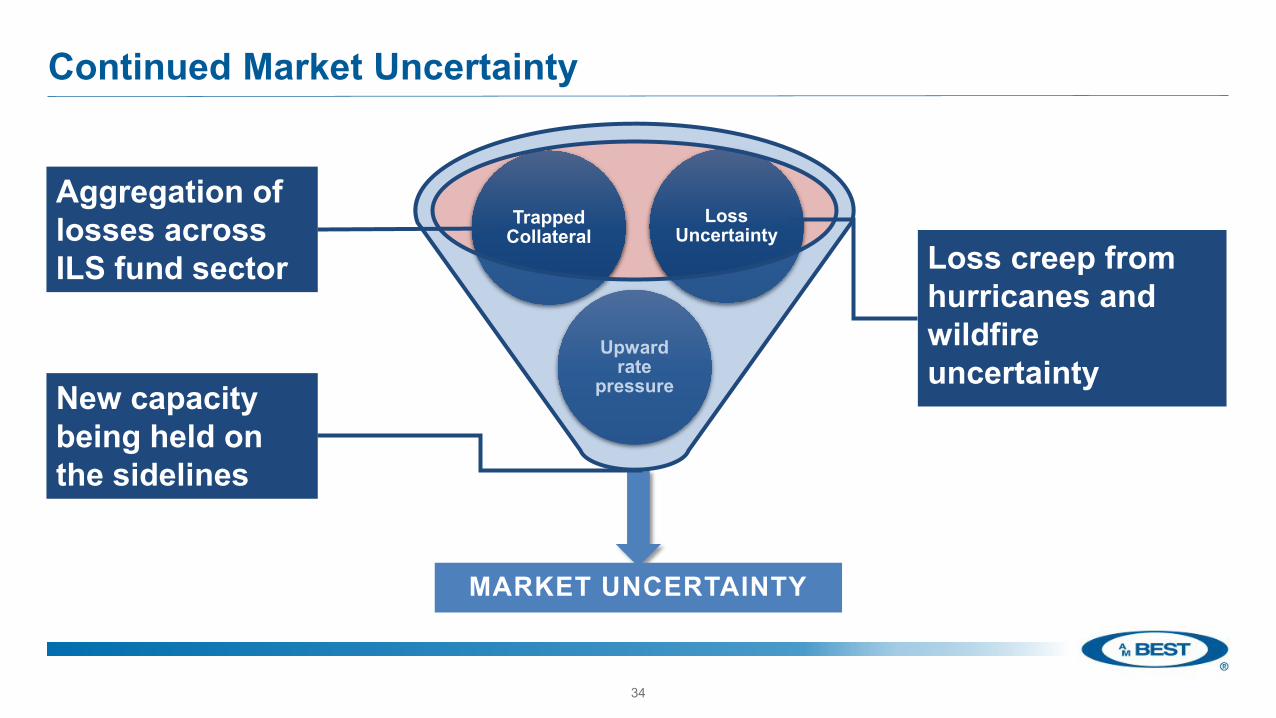
Continued Market Uncertainty
MARKET UNCERTAINTY
Upward rate
pressure
Trapped Collateral
Loss Uncertainty
Loss creep from hurricanes and wildfire uncertainty
New capacity being held on the sidelines
Aggregation of losses across ILS fund sector
34

What has transpired
Predominately European renewals
that were less affected by the 2017
and 2018 CATs
Rates did increase 30% for loss affected
programs(Lloyd’s and US)
Supply and Demand imbalance lead to
retro pricing increases of
15-20%
Casualty programs saw modest rate
improvement with ceding commissions
flat to down
Overall renewal pricing – flat to up
January and June renewal negotiationsran late
35
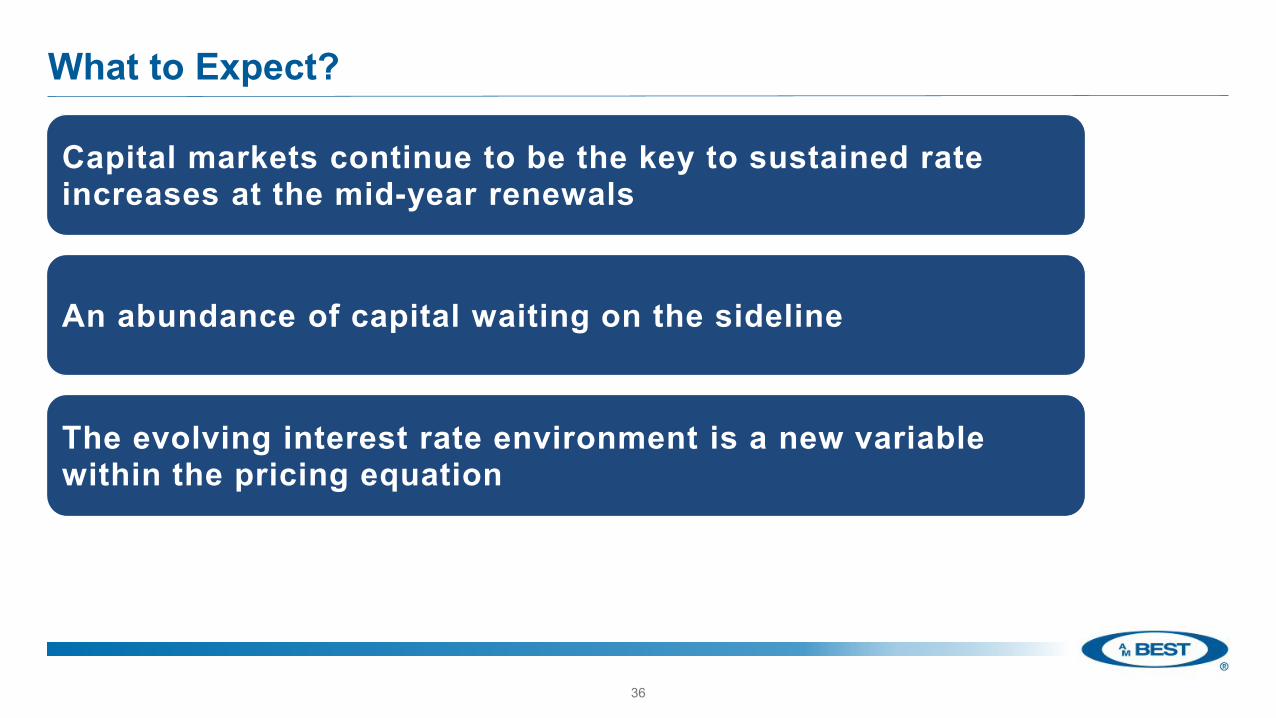
What to Expect?
Capital markets continue to be the key to sustained rate increases at the mid-year renewals
An abundance of capital waiting on the sideline
The evolving interest rate environment is a new variable within the pricing equation
36
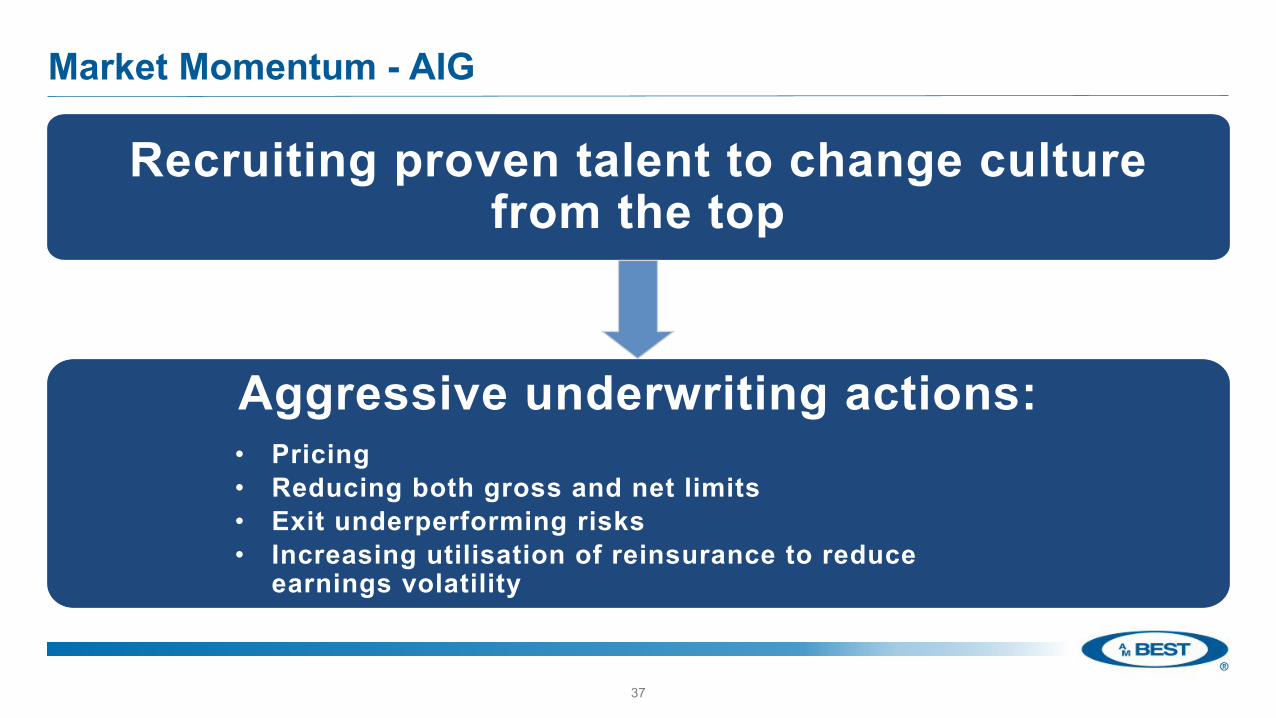
Market Momentum - AIG
37
Recruiting proven talent to change culture from the top
Aggressive underwriting actions:• Pricing • Reducing both gross and net limits • Exit underperforming risks• Increasing utilisation of reinsurance to reduce
earnings volatility

Market Momentum – Lloyd’s
38
Address underperformance and
irrational underwriting behaviour
Implementation of risk-based oversight for
underwriting performance
Limited capacity for worst performing syndicates
Annual planreviews
Performance Management
Directive(PMD)
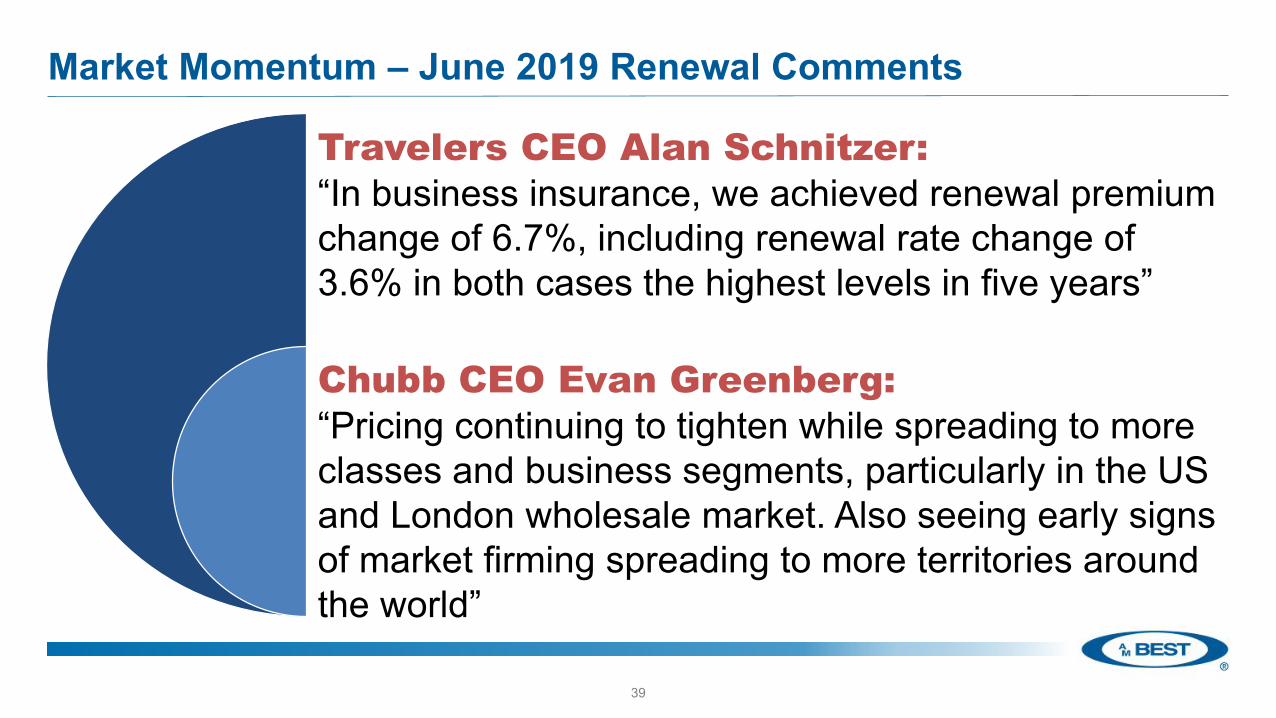
Market Momentum – June 2019 Renewal Comments
39
Travelers CEO Alan Schnitzer: “In business insurance, we achieved renewal premium change of 6.7%, including renewal rate change of 3.6% in both cases the highest levels in five years”
Chubb CEO Evan Greenberg: “Pricing continuing to tighten while spreading to more classes and business segments, particularly in the US and London wholesale market. Also seeing early signs of market firming spreading to more territories around the world”
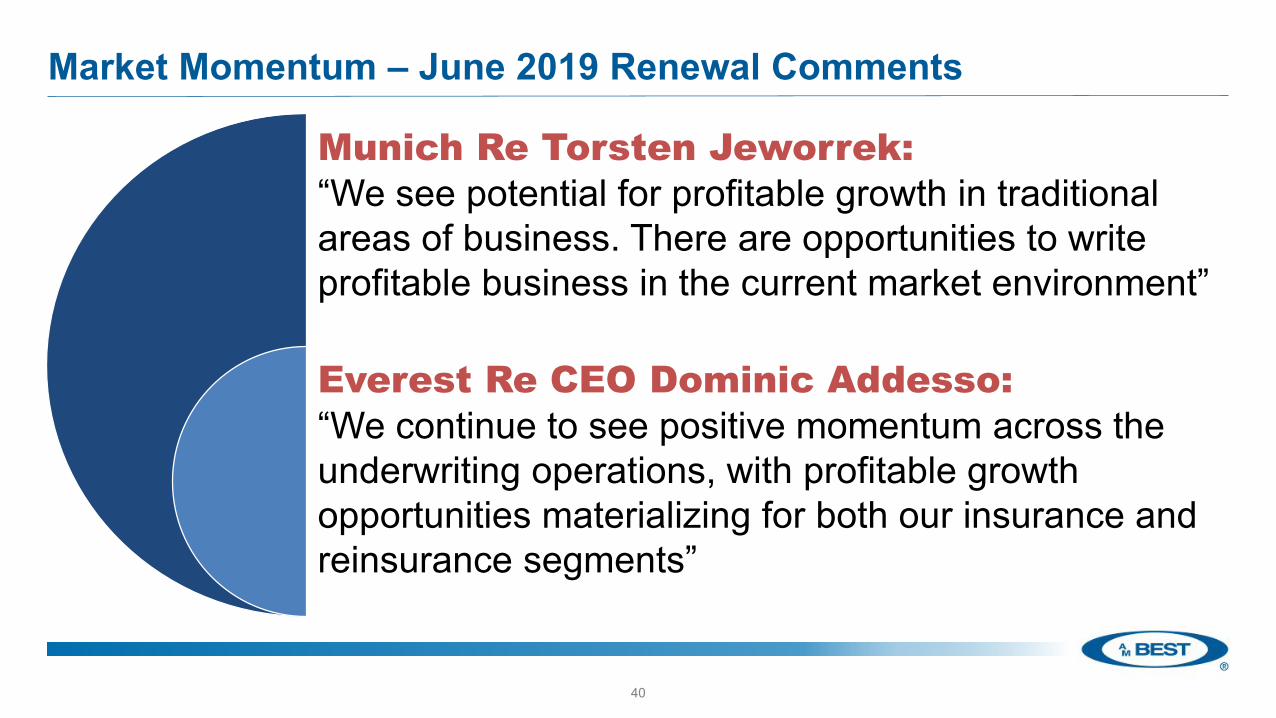
Market Momentum – June 2019 Renewal Comments
40
Munich Re Torsten Jeworrek: “We see potential for profitable growth in traditional areas of business. There are opportunities to write profitable business in the current market environment”
Everest Re CEO Dominic Addesso: “We continue to see positive momentum across the underwriting operations, with profitable growth opportunities materializing for both our insurance and reinsurance segments”
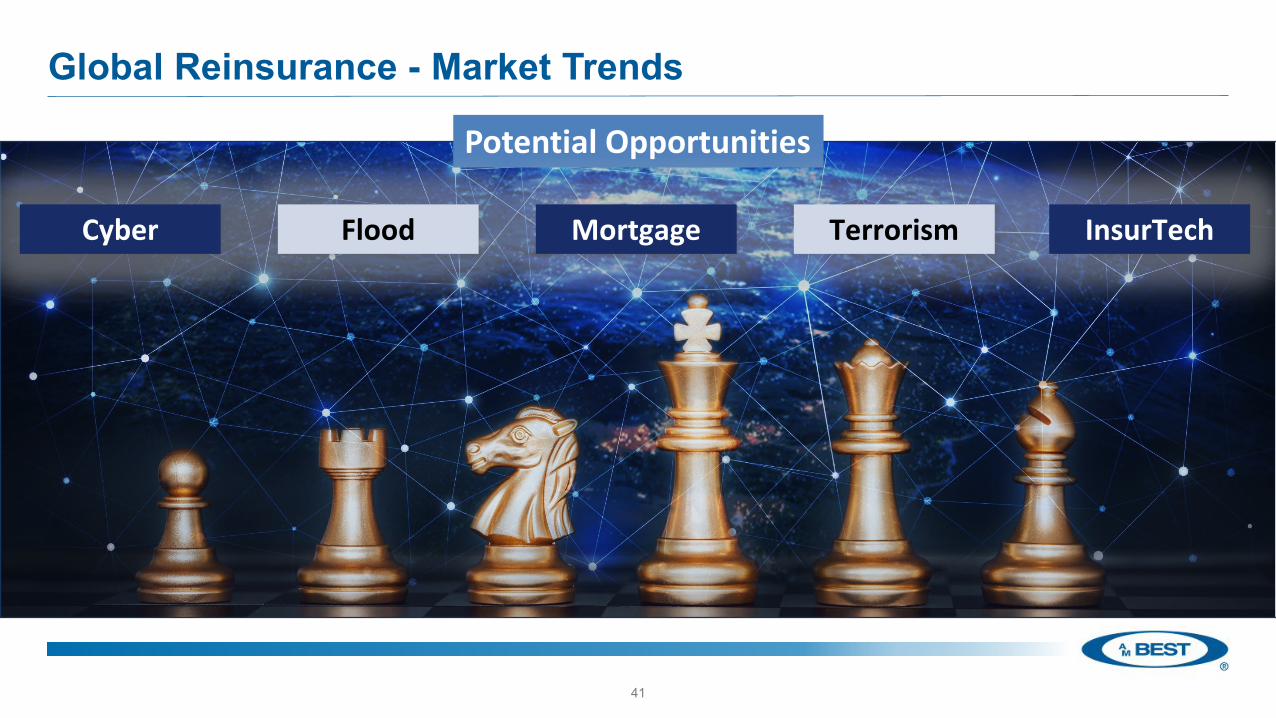
Global Reinsurance - Market Trends
41
Potential Opportunities
Cyber Flood Mortgage Terrorism InsurTech

Global Reinsurance Market Outlook
42
Headwinds TailwindsIntense competition Increasing alignment between traditional
and third-party capitalExcess capacity limits the potential forimprovement
Improving pricing discipline for property cat and retro in particular
Potential for increased inflation Accelerating pricing momentum at the primary insurance level
Less cushion in carried loss reserves US economic growth slows, but continues
Continued interest from third-party capital, even beyond prop-cat lines
Use of third-party capital in retrocession programs reducing earnings volatility
December 2018 – AM Best revised the outlook on the Global Reinsurance sector to Stable

European Primary Insurance Trends,Market Outlooks and Impact on Reinsurance Sector
Catherine ThomasSenior Director, Analytics
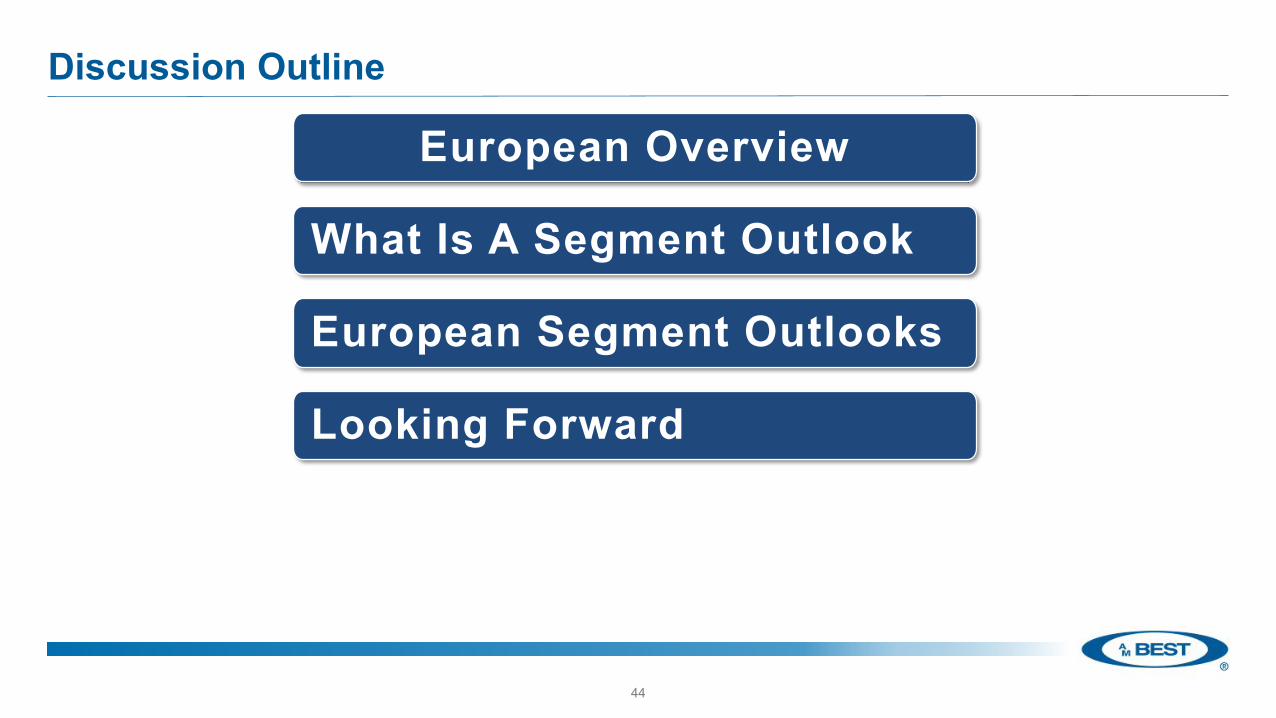
Discussion Outline
44
European Overview
European Segment Outlooks
Looking Forward
What Is A Segment Outlook

European Overview• Stable economic conditions persist although
achieving growth remains challenging
• 2018 - Upgrades outweighed downgrades
• Consolidation - Driven largely by excess capacity and capital in the marketplace. Strong competitive pressures remain as insurers compete for the same business
• 2019 AM Best segment-specific outlooks
• France non-life & life• Germany non-life & life• Italy non-life & life• Spain non-life• UK non-life & life
45
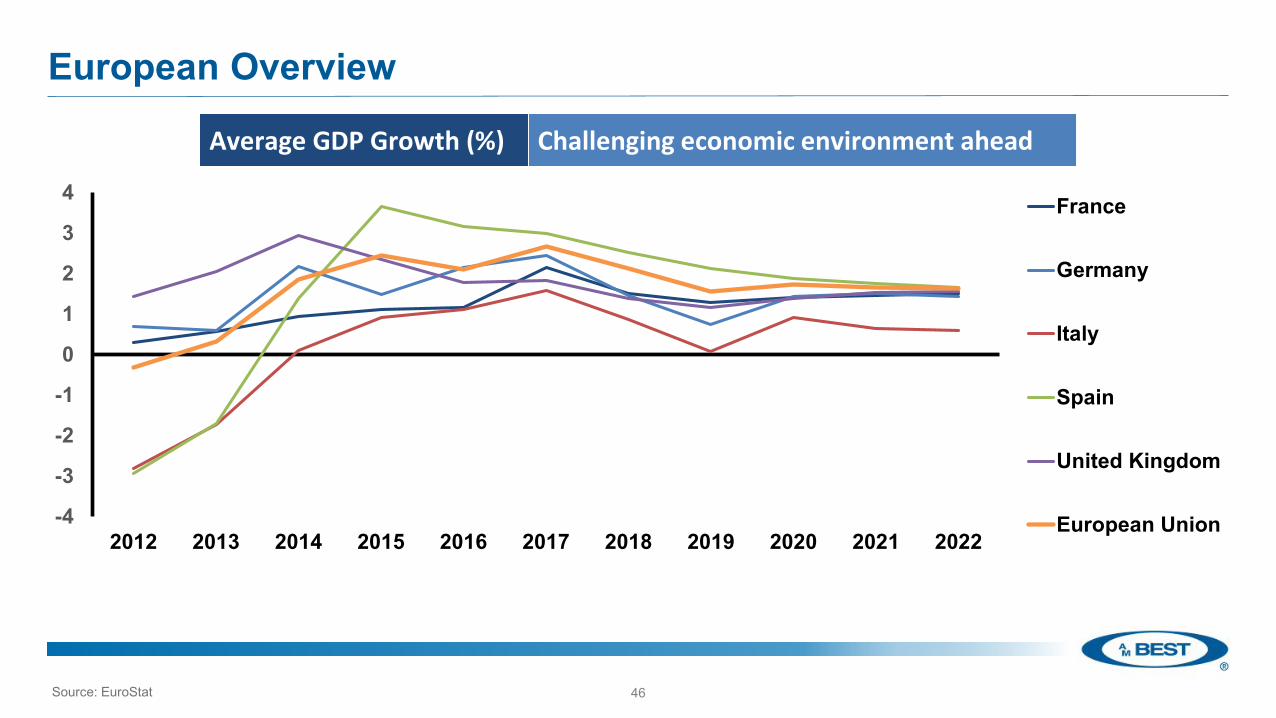
European Overview
46
Average GDP Growth (%) Challenging economic environment ahead
Source: EuroStat
-4
-3
-2
-1
0
1
2
3
4
2012 2013 2014 2015 2016 2017 2018 2019 2020 2021 2022
France
Germany
Italy
Spain
United Kingdom
European Union

European Overview
-1
0
1
2
3
4
5
6
7
2010 2012 2014 2016 2018
Germany
Spain
France
UnitedKingdom
Italy
47
10 Year Government Rates (%) Persistent low rate environment
Notes:Data to July 2019. Source: OECD
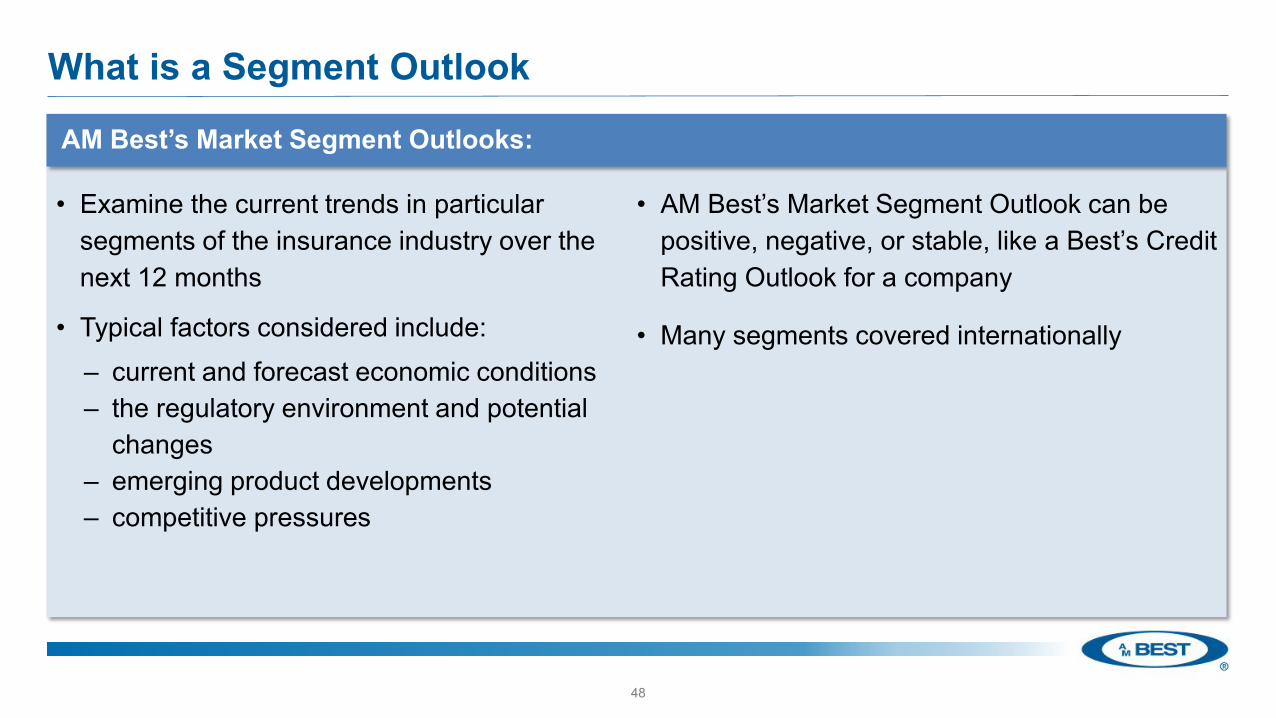
What is a Segment Outlook
• Examine the current trends in particular segments of the insurance industry over the next 12 months
• Typical factors considered include:– current and forecast economic conditions– the regulatory environment and potential
changes– emerging product developments– competitive pressures
• AM Best’s Market Segment Outlook can be positive, negative, or stable, like a Best’s Credit Rating Outlook for a company
• Many segments covered internationally
48
AM Best’s Market Segment Outlooks:

AM Best Segment Outlooks
France
• Non-Life: Stable
Germany
• Non-Life: Stable
Italy
• Non-Life: Stable
Spain
• Non-Life: Stable
UK
• Non-Life: Negative
49
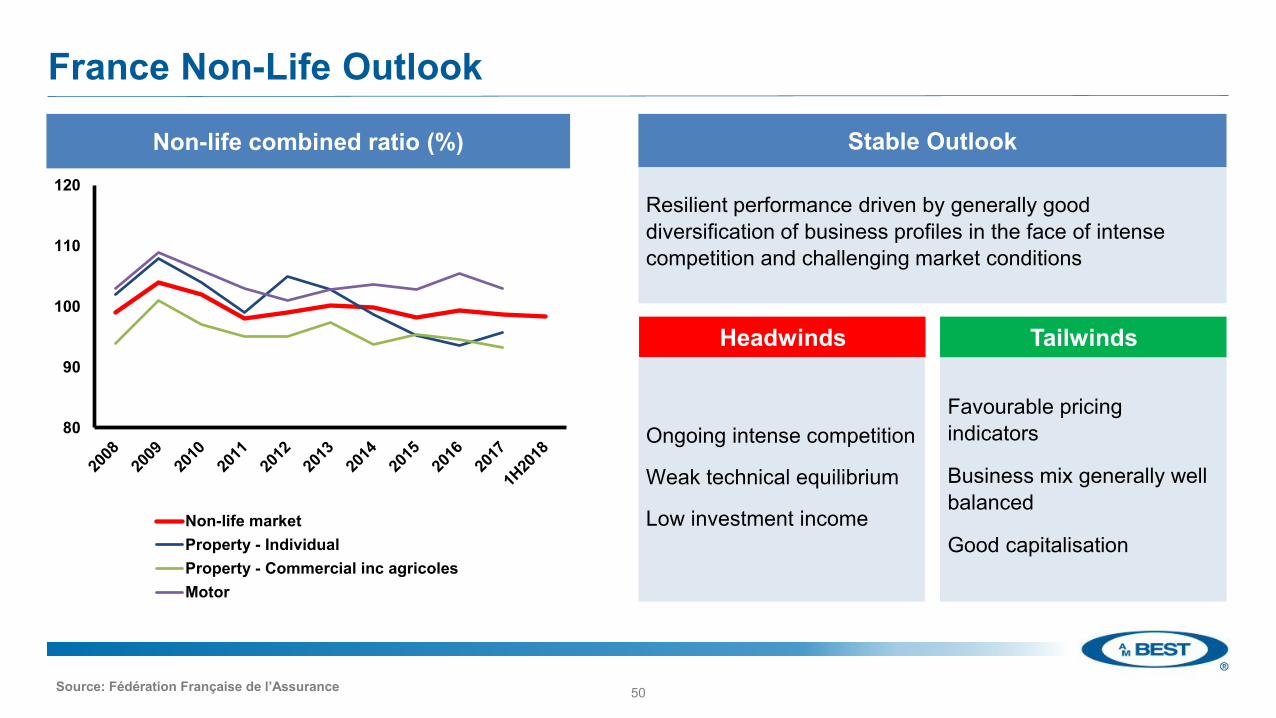
France Non-Life Outlook
Stable Outlook
Resilient performance driven by generally good diversification of business profiles in the face of intense competition and challenging market conditions
Headwinds
Favourable pricing indicators
Business mix generally well balanced
Good capitalisation
Tailwinds
Ongoing intense competition
Weak technical equilibrium
Low investment income
80
90
100
110
120
Non-life marketProperty - IndividualProperty - Commercial inc agricolesMotor
Source: Fédération Française de l’Assurance
Non-life combined ratio (%)
50

Spanish Non-Life Outlook
Stable OutlookInsurers demonstrate solid technical fundamentals, with good performance and strong balance sheets, although sustained political instability could test the sector
Robust but slowing national economy growth
Strong technical performance
Regulatory reforms
Tailwinds
Political instability
Regulatory reforms
Headwinds
Source: AM Best calculations based on ANIA data; ANIA; GDV, FFA; DGSFP; ICEA
Non-life combined ratio (%)
Selected Countries: non-life combined ratio (%)
80
90
100
110
120
2008 2010 2012 2014 2016 2018
France Spain
Italy Germany
51
9092949698
100
2007 2008 2009 2010 2011 2012 2013 2014 2015 2016 2017 2018
Non-life market Motor Health
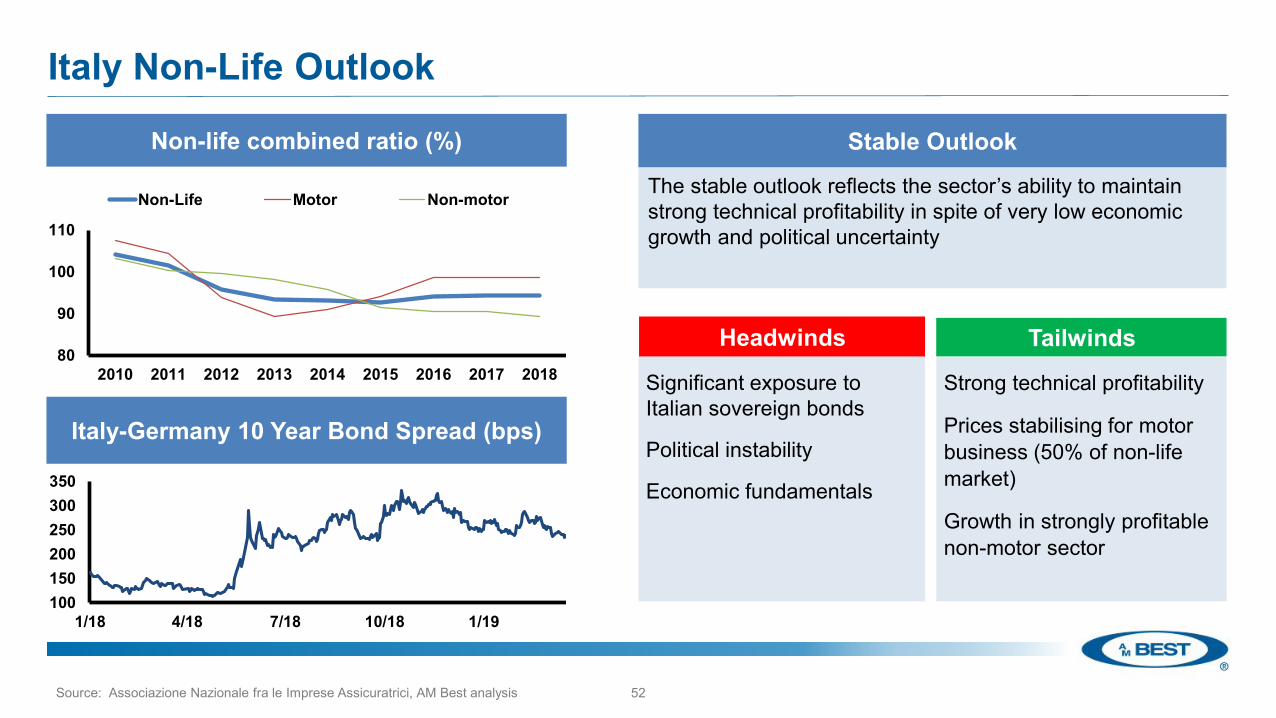
Italy Non-Life Outlook
Stable Outlook
The stable outlook reflects the sector’s ability to maintain strong technical profitability in spite of very low economic growth and political uncertainty
Source: Associazione Nazionale fra le Imprese Assicuratrici, AM Best analysis
100150200250300350
1/18 4/18 7/18 10/18 1/19
80
90
100
110
2010 2011 2012 2013 2014 2015 2016 2017 2018
Non-Life Motor Non-motor
Non-life combined ratio (%)
Italy-Germany 10 Year Bond Spread (bps)
52
Strong technical profitability
Prices stabilising for motor business (50% of non-life market)
Growth in strongly profitable non-motor sector
TailwindsHeadwinds
Significant exposure to Italian sovereign bonds
Political instability
Economic fundamentals
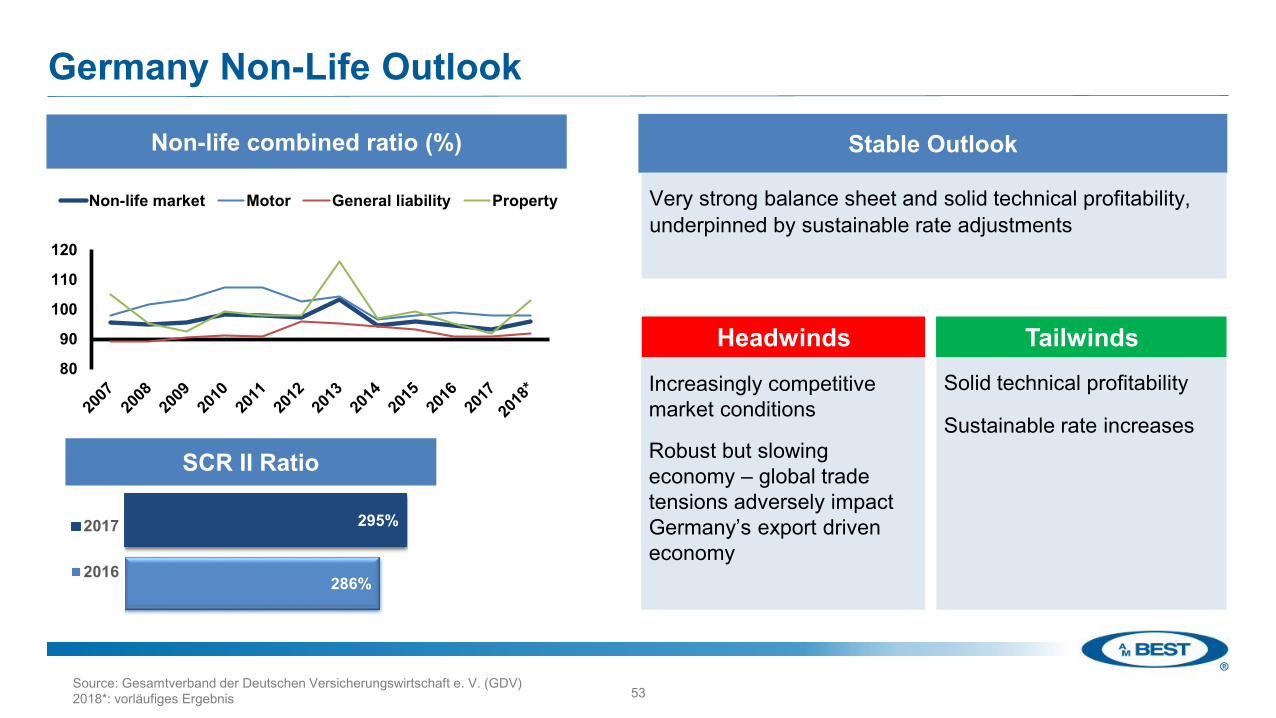
Germany Non-Life Outlook
Stable Outlook
Very strong balance sheet and solid technical profitability, underpinned by sustainable rate adjustments
Solid technical profitability
Sustainable rate increases
Increasingly competitive market conditions
Robust but slowing economy – global trade tensions adversely impact Germany’s export driven economy
TailwindsHeadwinds80
90
100
110
120
Non-life market Motor General liability Property
Non-life combined ratio (%)
286%
295%2017
2016
Source: Gesamtverband der Deutschen Versicherungswirtschaft e. V. (GDV)2018*: vorläufiges Ergebnis
SCR II Ratio
53
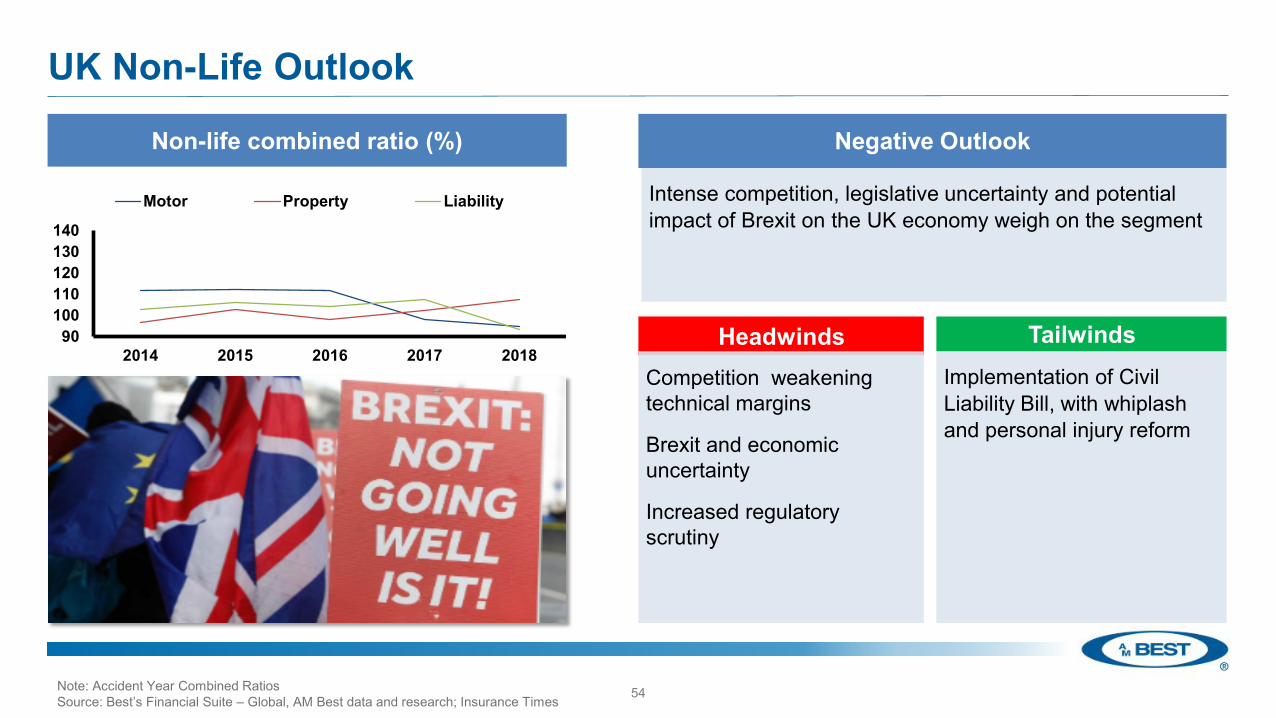
UK Non-Life Outlook
Intense competition, legislative uncertainty and potential impact of Brexit on the UK economy weigh on the segment
Negative Outlook
HeadwindsImplementation of Civil Liability Bill, with whiplash and personal injury reform
TailwindsCompetition weakening technical margins
Brexit and economic uncertainty
Increased regulatory scrutiny
Note: Accident Year Combined RatiosSource: Best’s Financial Suite – Global, AM Best data and research; Insurance Times
Non-life combined ratio (%)
54
90100110120130140
2014 2015 2016 2017 2018
Motor Property Liability

Key things to watch…
Politicalenvironment
Regulatoryupdates
Innovationand
market disruption
Industry consolidation and
competitive pressure
Globaltrade flows
55

AM Best’s Forthcoming Events ‒ Register Now
56
Insurance Market Briefing - GulfOct. 2, Muscat
Insurance Market Briefing - MENAOct. 7, Dubai
Insurance Market Briefing - EuropeNov. 12, London
For further information, visit AM Best’s events webpage
Market Briefing2019 - SIRCOct. 31, Singapore