Embed Size (px)
Citation preview

1Reinsurance Concepts| AIIF 2015| Baku, 2nd July 2015
aAIIF 2015 - Conceptional ideas for reinsurance structures

2
a
The main drivers of earnings volatility
a
3
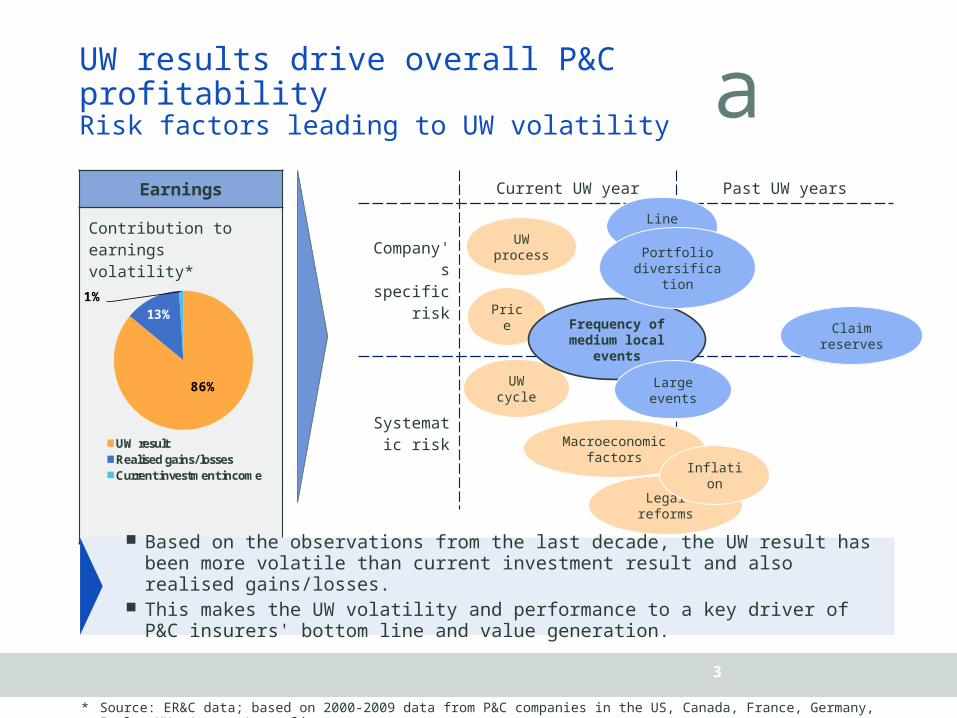
UW results drive overall P&C profitabilityRisk factors leading to UW volatility
Earnings
Contribution to earnings volatility*
* Source: ER&C data; based on 2000-2009 data from P&C companies in the US, Canada, France, Germany, Italy, UK, Japan, Australia
86%
13%1%
UW resultRealised gains/lossesCurrent investment income
Based on the observations from the last decade, the UW result has been more volatile than current investment result and also realised gains/losses.
This makes the UW volatility and performance to a key driver of P&C insurers' bottom line and value generation.
Current UW year Past UW years
Company's specific
risk
Systematic risk
Price
Legal reforms
UW process
UW cycle
Macroeconomic factors
Claim reserves
Frequency of medium local
events
Large events
Inflation
Line size
Portfolio diversificatio
n

a
4
y = 0.3543x - 0.1272R² = 0.523
0.0%
4.0%
8.0%
12.0%
16.0%
20.0%
40.0% 50.0% 60.0% 70.0% 80.0%
Loss
rat
io S
td D
ev
Average retention
Industrial Lines – Increasing Retention Leads to Higher Loss Ratio Volatility
The retention ratios of the large European players in corporate business are quite different.
Based on the observation period 2004 - 2012, there is a clear correlation between retention ratio and loss ratio volatility: Players with a comparably higher retention are facing are higher net loss volatility.
Source: Companies Disclosure
2012 Retention RatioCorrelation Retention & Loss Ratio
Volatility*
* Average retention and standard deviation of net loss ratio from 2004-2012, exception Talanx retention average 2007-2012.
0.0%
10.0%
20.0%
30.0%
40.0%
50.0%
60.0%
70.0%
80.0%
90.0%
TalanxIndustrial
Lines
ZurichGlobal
Corporate
AllianzGlobal
Corporate &Specialty
AXACorporateSolutions
FM Global XLInsurance
a
5
The Azerbaijan insurance market has consistently shown growth rates in recent years, which requires a continuous strengthening of the capital base.
Retained earnings are a key contributor to finance future growth.
Underwriting volatility and performance is the key driver of P&C insurers' bottom line and value generation.
The tendency in Reinsurance buying behaviour is to strive for higher retention ratios especially on Commercial and Industrial books.
We see first signals for the same direction also in Russia, partly also due to loss activity and increased reinsurance costs at the lower end.
There is a distinct correlation observable between higher retention ratios and higher result volatility especially for large single risk business (Property and Construction).
Conclusions
Companies need to find the right balance between volatility and reinsurance budgets.

6
aVolatility reduction through reinsurance How to quantify the positive impact
of reinsurance on earnings stability?
a
7
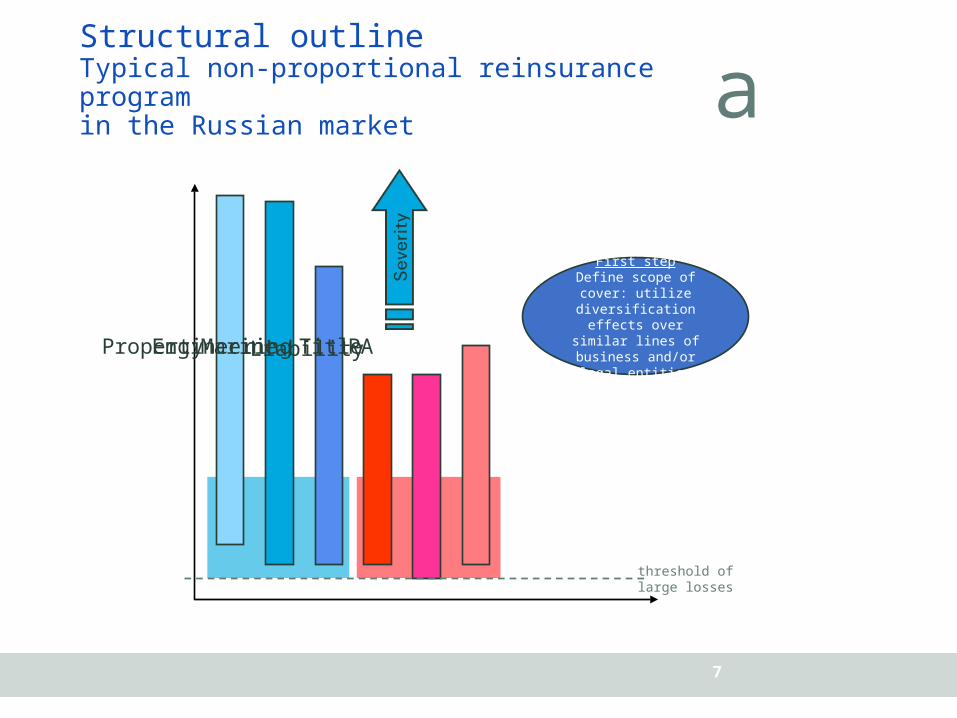
Structural outline Typical non-proportional reinsurance programin the Russian market
threshold of large losses
Pro
pert
y
Engin
eeri
ng
Mari
ne
Liabili
ty
PATitl
e
First stepDefine scope of
cover: utilize diversification effects over similar lines of
business and/or legal entities
a
8
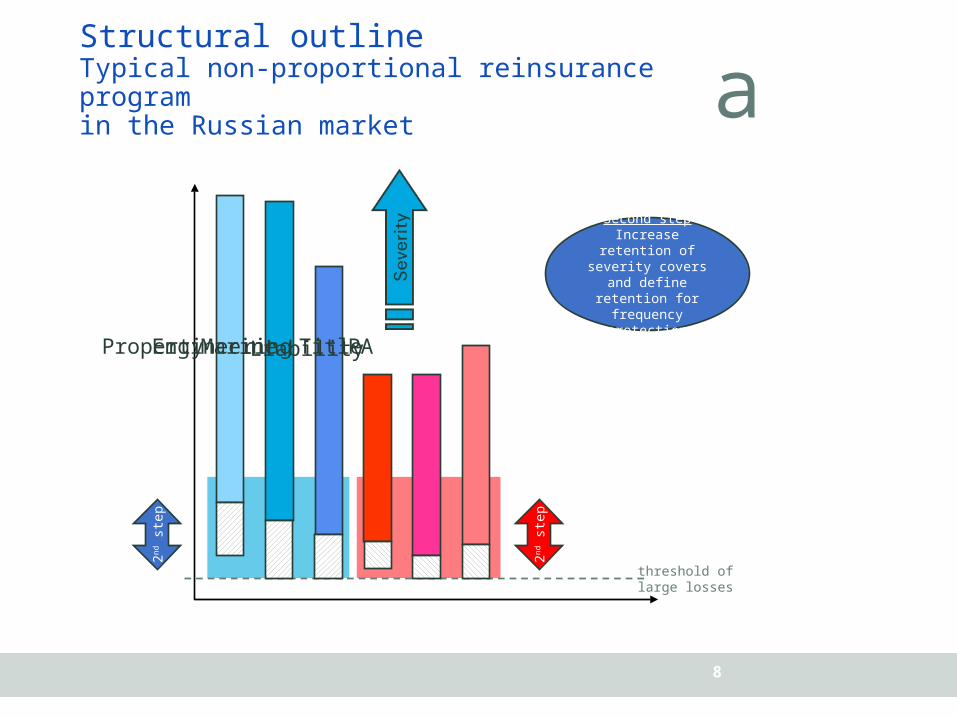
Structural outline Typical non-proportional reinsurance programin the Russian market
threshold of large losses
Pro
pert
y
Engin
eeri
ng
Mari
ne
Liabili
ty
PATitl
e
Second stepIncrease retention of severity covers
and define retention for frequency protection
2nd s
tep
2nd s
tep
a
9
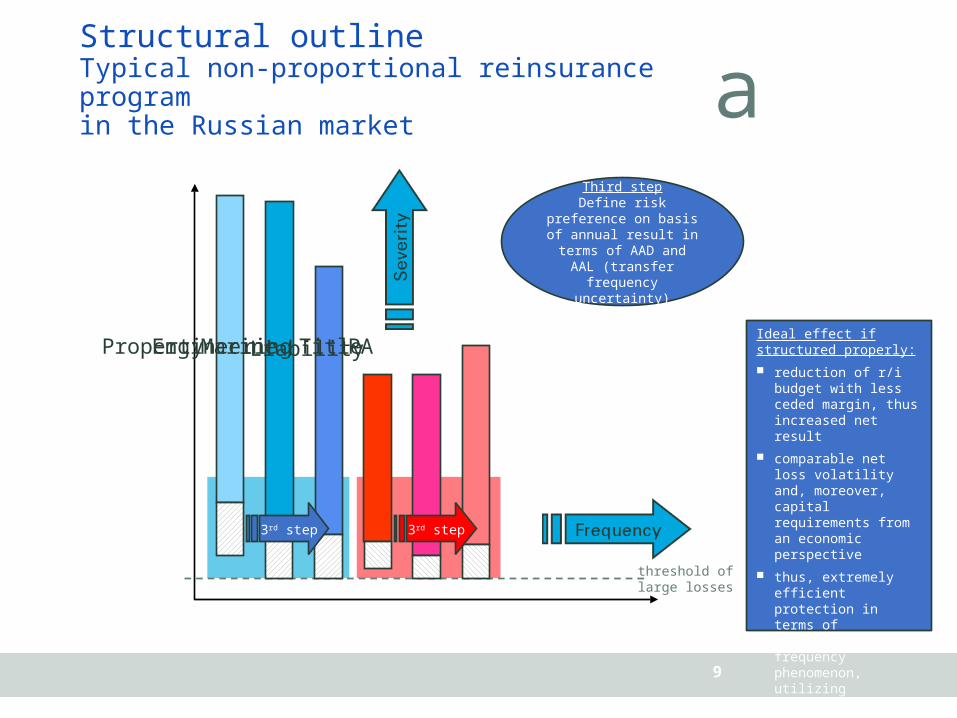
Structural outline Typical non-proportional reinsurance programin the Russian market
threshold of large losses
Pro
pert
y
Engin
eeri
ng
Mari
ne
Liabili
ty
PATitl
e
3rd step
Third stepDefine risk preference
on basis of annual result in terms of AAD
and AAL (transfer frequency uncertainty)
3rd step
Ideal effect if structured properly:
reduction of r/i budget with less ceded margin, thus increased net result
comparable net loss volatility and, moreover, capital requirements from an economic perspective
thus, extremely efficient protection in terms of volatility and frequency phenomenon, utilizing diversification over lines of business
a
10
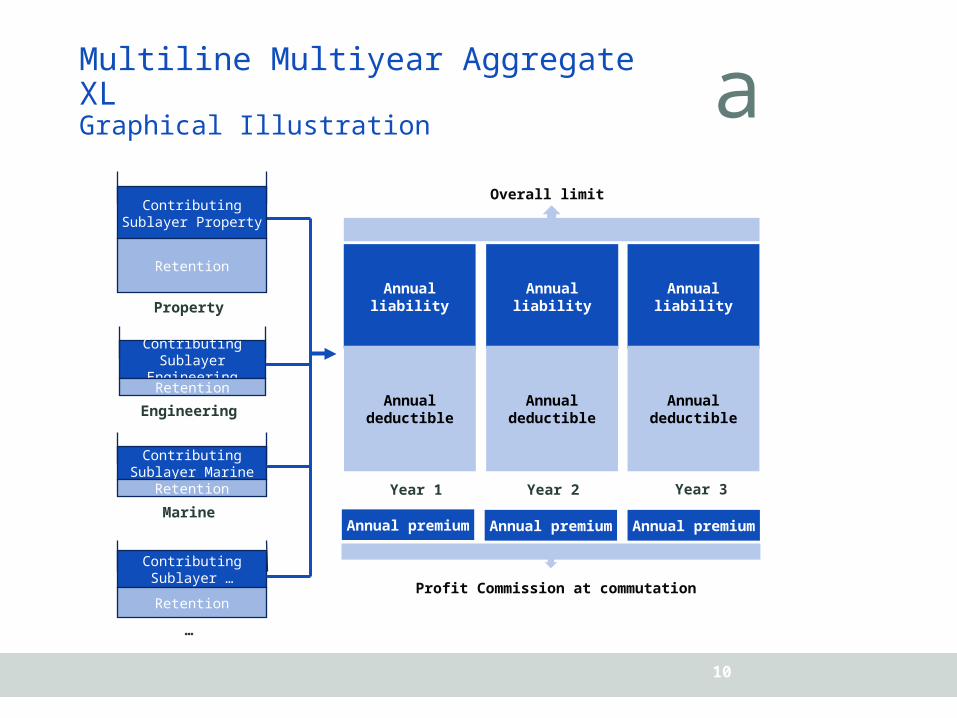
Multiline Multiyear Aggregate XLGraphical Illustration
Contributing Sublayer …
…
Contributing Sublayer Marine
Marine
Contributing Sublayer
Engineering
Engineering
Contributing Sublayer Property
PropertyAnnual liability
Annual liability
Annual liability
Year 1 Year 2 Year 3
Annual deductible
Annual deductible
Annual deductible
Profit Commission at commutation
Overall limit
Annual premium Annual premium Annual premium
Retention
Retention
Retention
Retention
11
a
Efficientseverity protection Facultative Value Propositions
a
12
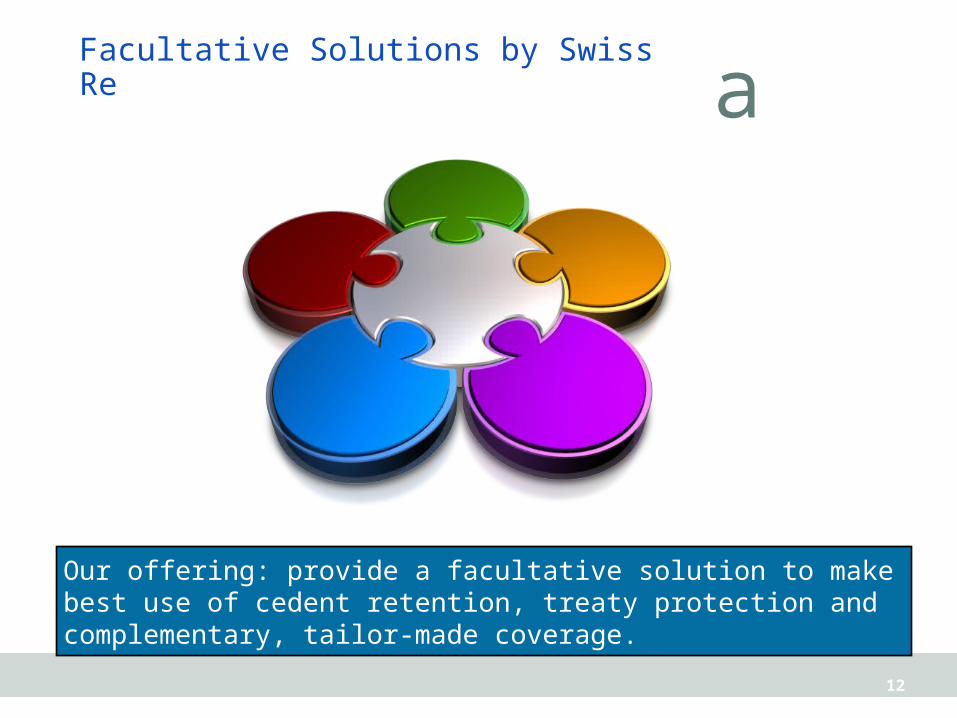
Facultative Solutions by Swiss Re
Our offering: provide a facultative solution to make best use of cedent retention, treaty protection and complementary, tailor-made coverage.
a
13
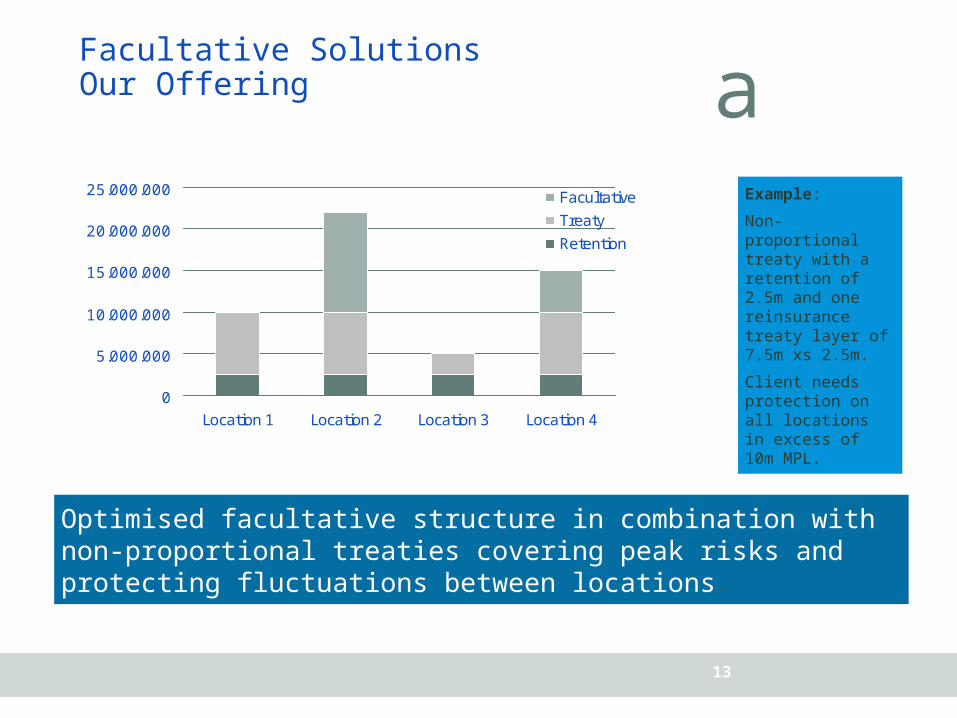
Facultative SolutionsOur Offering
0
5.000.000
10.000.000
15.000.000
20.000.000
25.000.000
Location 1 Location 2 Location 3 Location 4
Facultative
Treaty
Retention
Optimised facultative structure in combination with non-proportional treaties covering peak risks and protecting fluctuations between locations.
Example:
Non-proportional treaty with a retention of 2.5m and one reinsurance treaty layer of 7.5m xs 2.5m.
Client needs protection on all locations in excess of 10m MPL.
a
14
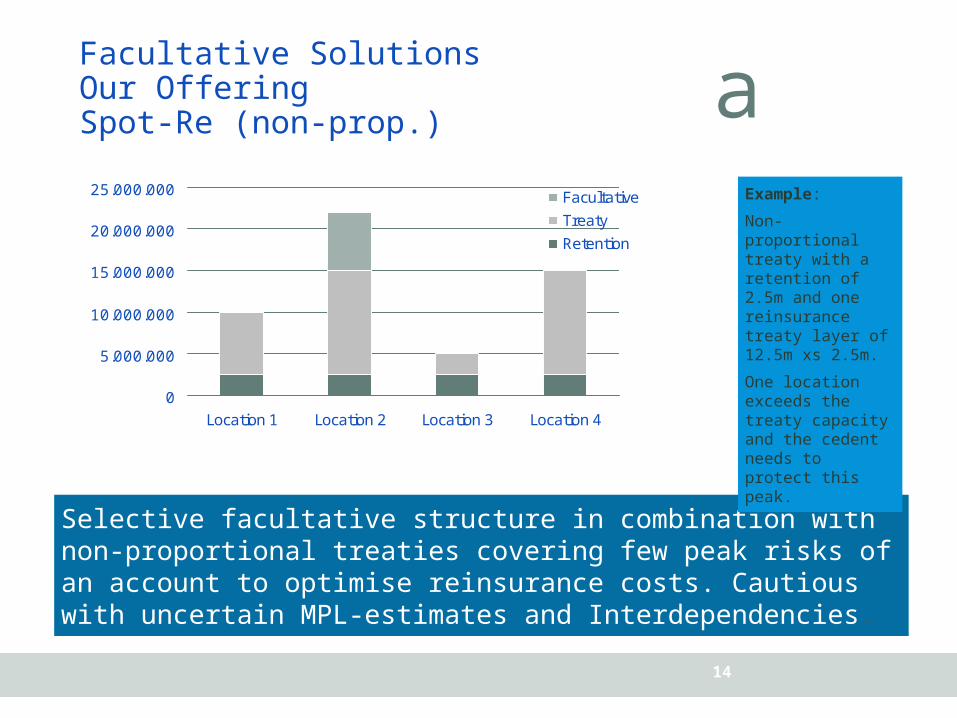
Facultative SolutionsOur OfferingSpot-Re (non-prop.)
0
5.000.000
10.000.000
15.000.000
20.000.000
25.000.000
Location 1 Location 2 Location 3 Location 4
Facultative
Treaty
Retention
Selective facultative structure in combination with non-proportional treaties covering few peak risks of an account to optimise reinsurance costs. Cautious with uncertain MPL-estimates and Interdependencies.
Example:
Non-proportional treaty with a retention of 2.5m and one reinsurance treaty layer of 12.5m xs 2.5m.
One location exceeds the treaty capacity and the cedent needs to protect this peak.
a
0
200.000.000
400.000.000
600.000.000
800.000.000
1.000.000.000
1.200.000.000
1.400.000.000
1.600.000.000
1.800.000.000
Germany Austria Poland Mexico
Insu
red V
alues
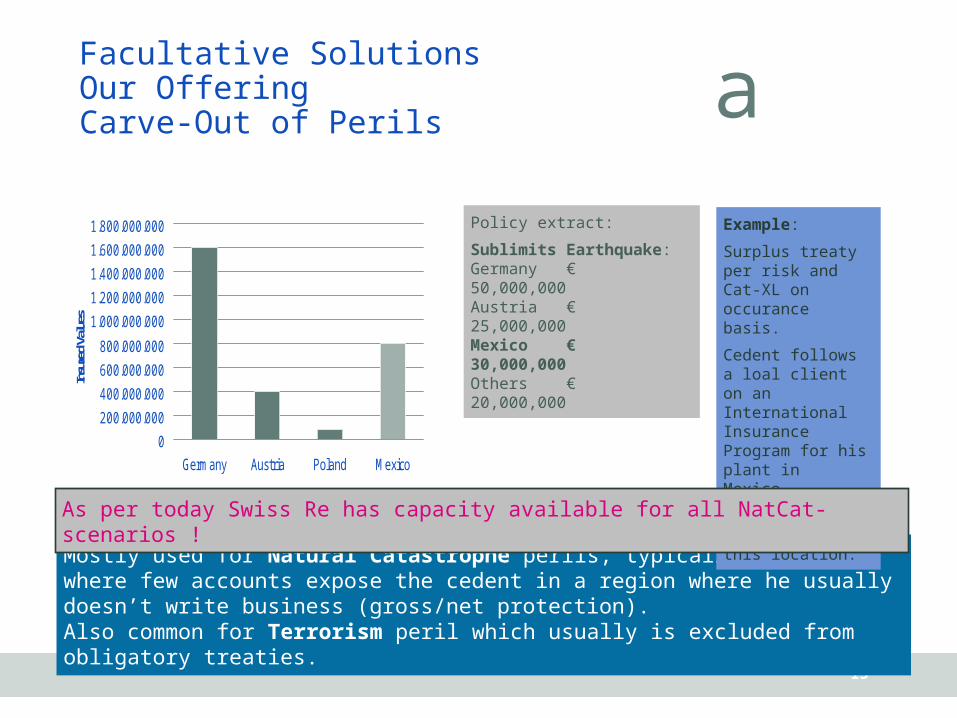
Facultative SolutionsOur OfferingCarve-Out of Perils
15
Mostly used for Natural Catastrophe perils, typically in regions where few accounts expose the cedent in a region where he usually doesn’t write business (gross/net protection). Also common for Terrorism peril which usually is excluded from obligatory treaties.
Example:
Surplus treaty per risk and Cat-XL on occurance basis.
Cedent follows a loal client on an International Insurance Program for his plant in Mexico.
Cedent buys out this peril on this location.
Policy extract:
Sublimits Earthquake:Germany € 50,000,000Austria € 25,000,000Mexico € 30,000,000Others € 20,000,000
As per today Swiss Re has capacity available for all NatCat-scenarios !
a
05.000.000
10.000.00015.000.00020.000.00025.000.00030.000.00035.000.00040.000.00045.000.00050.000.000
Office Court Hotel Apartments
Facultative
Treaty
Retention
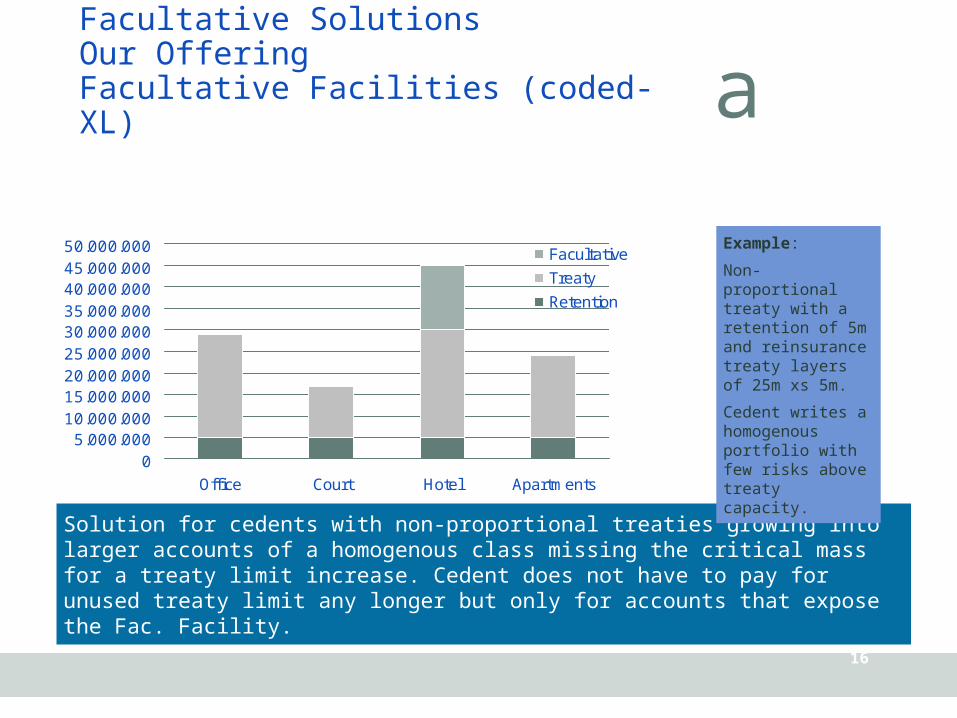
Facultative SolutionsOur OfferingFacultative Facilities (coded-XL)
16
Solution for cedents with non-proportional treaties growing into larger accounts of a homogenous class missing the critical mass for a treaty limit increase. Cedent does not have to pay for unused treaty limit any longer but only for accounts that expose the Fac. Facility.
Example:
Non-proportional treaty with a retention of 5m and reinsurance treaty layers of 25m xs 5m.
Cedent writes a homogenous portfolio with few risks above treaty capacity.

aThank you
a

a
18
Basic Copyright Notice & Disclaimer for Swiss Re Presentations provided to External Parties
©2015 Swiss Re. All rights reserved. You are not permitted to create any modifications or derivatives of this presentation without the prior written permission of Swiss Re.
This presentation is for information purposes only and contains non-binding indications as well as personal judgment. It does not contain any recommendation, advice, solicitation, offer or commitment to effect any transaction or to conclude any legal act. Any opinions or views expressed are of the author and do not necessarily represent those of Swiss Re. Swiss Re makes no warranties or representations as to this presentation’s accuracy, completeness, timeliness or suitability for a particular purpose. Anyone shall at its own risk interpret and employ this presentation without relying on it in isolation.In no event will Swiss Re or one of its affiliates be liable for any loss or damages of any kind, including any direct, indirect or consequential damages, arising out of or in connection with the use of this presentation.