Embed Size (px)
Citation preview
Reichl, K., & Inman, D. (2017). Lumped mass model of a 1Dmetastructure for vibration suppression with no additional mass.Journal of Sound and Vibration, 403, 75-89.https://doi.org/10.1016/j.jsv.2017.05.026
Peer reviewed versionLicense (if available):CC BY-NC-NDLink to published version (if available):10.1016/j.jsv.2017.05.026
Link to publication record in Explore Bristol ResearchPDF-document
This is the author accepted manuscript (AAM). The final published version (version of record) is available onlinevia Elsevier at https://www.sciencedirect.com/science/article/pii/S0022460X17304054 . Please refer to anyapplicable terms of use of the publisher.
University of Bristol - Explore Bristol ResearchGeneral rights
This document is made available in accordance with publisher policies. Please cite only thepublished version using the reference above. Full terms of use are available:http://www.bristol.ac.uk/red/research-policy/pure/user-guides/ebr-terms/
1
Lumped Mass Model of a 1D Metastructure for Vibration Suppression with no Additional Mass
Katherine K. Reichla,*, Daniel J. Inmana
a Department of Aerospace Engineering, University of Michigan, 1320 Beal Ave, Ann Arbor, MI 48109, USA *Corresponding Author. E-mail Address: [email protected] Abstract
The article examines the effectiveness of metastructures for vibration suppression from a weight
standpoint. Metastructures, a metamaterial inspired concept, are structures with distributed vibration
absorbers. In automotive and aerospace industries, it is critical to have low levels of vibrations while also
using lightweight materials. Previous work has shown that metastructures are effective at mitigating
vibrations, but do not consider the effects of mass. This work takes mass into consideration by comparing
a structure with vibration absorbers to a structure of equal mass with no absorbers. These structurers are
modeled as one-dimensional lumped mass models, chosen for simplicity. Results compare both the
steady-state and the transient responses. As a quantitative performance measure, the 𝐻! norm, which is
related to the area under the frequency response function, is calculated and compared for both the
metastructure and the baseline structure. These results show that it is possible to obtain a favorable
vibration response without adding additional mass to the structure. Additionally, the performance measure
is utilized to optimize the geometry of the structure, determine the optimal ratio of mass in the absorber to
mass of the host structure, and determine the frequencies of the absorbers. The trends from this model are
replicated using previous experimental results.
Keywords: vibration suppression, metastructure, passive damping
1. Introduction
Metastructures are a metamaterial inspired concept. Metamaterial research began by investigating
electromagnetic metamaterials which exhibited a negative permittivity and or permeability [1,2]. Inspired
by the electromagnetic metamaterials, the concepts were extended to acoustic metamaterials [3].
Traditional metamaterials utilize the theory of Bragg scattering. The lattices are created such that when
the waves reflect off the structure, they destructively interfere with each other. In order for the Bragg
scattering mechanism to work, the periodic length of the material must be of similar length as the
2
wavelength. Thus, for low frequencies very large structures are required [4]. Metamaterials that rely on
the Bragg scattering mechanism are commonly called phononic crystals. Phononic crystals are materials
which exhibit some type of periodicity and are reviewed in a paper by Hussein et al [5]. Milton and
Willis were the first to conceive the idea of using local absorbers to create structures with negative
effective mass that varies with frequency [6]. Liu et al created the first physical metastructure that was
able to create a bandgap at a frequency lower than that of the Bragg scattering mechanism. This structure
is designed to suppress acoustic waves above 300 Hz. Their acoustic metamaterial contains lead spheres
coated in a silicone rubber within an epoxy matrix. The lead balls in the rubber are referred to as local
resonators. The local resonator mechanism is the same mechanism used for vibration suppression [7].
Since then locally resonant metamaterials have been studied extensively for both acoustic and vibration
isolation applications. The work presented here deals exclusively with vibration mitigation applications.
Structures or materials capable of suppressing vibrations using these local resonators are often referred to
as elastic metamaterials. In a review paper by Zhu et el, the authors provide a review of various type of
plate-type elastic metamaterials and discuss possible applications. They also provide an explanation of the
negative mass density and negative bulk modulus [8]. Here the term metastructure is used to refer to
structures with distributed vibration absorbers. These structures use conventional materials with absorbers
integrated into the structure through geometry and material changes on the centimeter scale. The periodic-
type nature of these structures was inspired from metamaterials but the larger scale modifications makes
the term structure a more fitting term for this work. In the literature, these are also referred to as locally
resonant phononic crystals or elastic metamaterials. The field of auxetics also has considerable overlap
with metastructures. Auxetics are materials that exhibit a negative Poisson’s ratio. These materials are
realized by creating periodic lattice structures. Because of the periodic nature of auxetics, they affect how
waves propagate through them and thus can be used for vibration suppression among other applications
[9].
As Hussein et al describes in his review paper, metastructures are at the cross roads of vibration and
acoustics engineering, and condensed matter physics [5]. Thus, it is important that strengths from both
fields are considered and reviewed for relevancy. Sun et al and Pai looked into the working mechanism of
metastructures for both bending and longitudinal motion. They were able to conclude that the working
mechanism that leads to vibration suppression is based on the concept of mechanical vibration absorbers
that do not need to be small or closely spaced [10,11]. Therefore, it is also relevant to explore the
literature regarding vibration absorbers. Vibration absorbers can also be called tuned mass dampers
(TMDs) or dynamic vibration absorbers. TMDs typically consist of mass-spring-damper systems, while a
vibration absorber does not use a damper to add significant localized damping. Although there is no
3
localized damper added to the vibration absorber, there is still a small amount of material damping which
is inherent in all structures. TMDs are studied widely in the field of earthquake engineering. Igusa and Xu
were the first researchers to look at the effects of using multiple (TMDs) to suppress a single mode of a
structure [12,13]. Later, this was also studied by Yamaguchi and Harnprnchai [14]. Their work focuses on
attaching multiple TMDs to a single degree of freedom system and shows that multiple TMDs can be
more effective than a single TMD. These results can be leveraged in metastructure research.
Another important aspect of the TMD literature is how the optimal parameters for the TMDs were
determined. Many methods have been used and applied to various systems. DenHartog developed the
optimal parameters for a single TMD as an analytical expression [15] and this result has since been
studied by many others as summarized in Sun et al’s review paper [16]. The work presented here focuses
on some of the numerical methods utilized by many TMD researchers specifically the 𝐻! norm.
Parameters are chosen such that the 𝐻! norm is minimized. This performance metric describes the
response of a structure excited across all frequencies [17,18]. The 𝐻! norm provides different results than
those obtained by suppressing a specific frequency range and tend to suppress the fundamental mode
which typically has the largest magnitude response.
The model used in this paper is a one-dimensional lumped mass model, which was chosen for its
simplicity, and allows the dynamics to be understood more thoroughly. Some of the most relevant work
related to 1D metastructures is from Pai who models a longitudinal metastructure consisting of a hollow
tube with many small mass-spring systems distributed throughout the bar. He suggests that the ideal
design for a metastructure, involves absorbers with varying tuned frequencies [11]. Xiao et al looks at a
similar structure as Pai but considers multiple degree of freedom resonators. Their work focuses on
modeling procedures and understanding the bandgap formation mechanisms [19]. The favorable
dynamics response of these structures can also be described as having a negative effective mass which has
been shown analytically and experimentally [6,20,21]. In addition, other researchers have conducted
experiments on longitudinal metastructures. Zhu et al looked at a thin plate with cantilever absorbers cut
out of the plate. They were able to show the ability to accurately predict the band-gap and also compared
various absorber designs [22]. Wang et al tested a glass bar with cantilever absorbers made out of steel
slices and a mass [23]. With the rise in additive manufacturing, 3D printing has become a good method to
realize the complex geometry needed for these structures [24]. Hobeck et al and Nobrega et al both
created longitudinal 3D metastructures and obtained experimental results. Hobeck et al’s work will be
discussed in detail later [25,26].
4
In this paper, the feasibility of adding distributed vibration absorbers to a structure without increasing the
overall weight of the structure is presented. When creating these metastructures, much of the previous
work looks at keeping the stiffness constant, which requires adding additional mass to the structure [27–
29]. Taking an alternative approach, this paper keeps the mass constant by redistributing mass from the
host structure to the distributed absorber system. Mass and suppression properties are inherently tied
together which motivates this approach. Simply adding mass to a structure will result in increased
suppression. It is important to isolate the effects of the dynamics of the vibration absorbers from the
added mass. It must be shown that the additional mass is not causing the increased performance. Since a
lumped mass model is used, the redistribution of mass does not affect the stiffness of the structure. In real
structure where mass and stiffness are coupled, the stiffness would be affected. Other researchers have
looked at constant stiffness structures but haven’t shown if the additional mass or the dynamics of the
absorbers are causing the increased performance. By using a mass constant constraint, this work shows
that the vibration absorber dynamics, and not the additional mass, are increasing the suppression.
Additionally in both automotive and aerospace structures, it is critical to keep the total weight of the
structure low.. The strategy taken here is to model a discrete system undergoing axial vibrations. This is
used as a starting point because the analysis for a unidirectional discrete problem is relatively straight-
forward and enables understanding of the basic issues and phenomenon. The model consists of masses
and springs connected in series with an absorber attached to each one of the masses. The mass and
stiffness of these components are varied in order to get the desired dynamics. Material damping inherent
in all structures is represented by a proportional damping model and is added to this model such the
simulations do not go to infinity. The metastructure described here is compared to a baseline structure
which has no vibration absorbers, which illustrates that the favorable damping comes from the addition of
the distributed vibration absorbers and not from adding mass to the system. The focus of the vibration
suppression is on the fundamental natural frequency of the structure as opposed to creating a band-gap at
higher frequencies, which much of the metamaterial research examines. In engineering applications, it is
important to suppress the frequencies near the fundamental mode of vibration, as these frequencies
typically result in the highest magnitude response. A similar approach is taken when designing TMDs,
explaining the motivation for using performance metrics from the TMD literature.
The work of Igusa and Xu is similar to the work presented here but there are some important differences.
They are comparing the effectiveness of a single TMD and multiple TMDs whereas this work compares
multiple vibration absorbers to no absorbers. Thus their structure with vibration suppression is heavier
than their structure without suppression. In this work the suppression system does not add weight to the
structure. Additionally, Igusa and Xu use TMDs so they can tune the mass, stiffness and damping of each
5
absorber [13]. The work presented here does not add dampers with high levels of localized damping to the
vibration absorbers, thus only mass and stiffness can be tuned.
The methodology used for this paper begins by introducing the model used and the parameters that
characterize this model. The main parameters varied throughout this study are the number of absorbers,
the mass ratio (ratio of absorber mass to mass of the rest of the structure), and the natural frequencies of
the individual absorbers. Other variables in the model are calculated such that the mass of the structure is
constant and the fundamental frequency of the entire structure stays relatively constant throughout the
analysis. Both steady state and transient responses are examined. Next, the analysis of the model is
described and details about the performance measures are provided. These are the 𝐻! and 𝐻! norms,
which measure the total energy of the system and the maximum response respectively. An optimization
procedure is set up to minimize the 𝐻! norm and shows the trade-offs between various parameters. All of
the metastructure models created are compared to a baseline structure which has equal mass but no
distributed vibration absorbers. The constant mass means any increase in performance can be attributed to
the addition of the absorbers. Lastly, the simulation results will be compared to experimental data, from
work completed by Hobeck et al, to show that trends found from this longitudinal model match the trends
found from their experimental data [25].
2. Lumped Mass Model
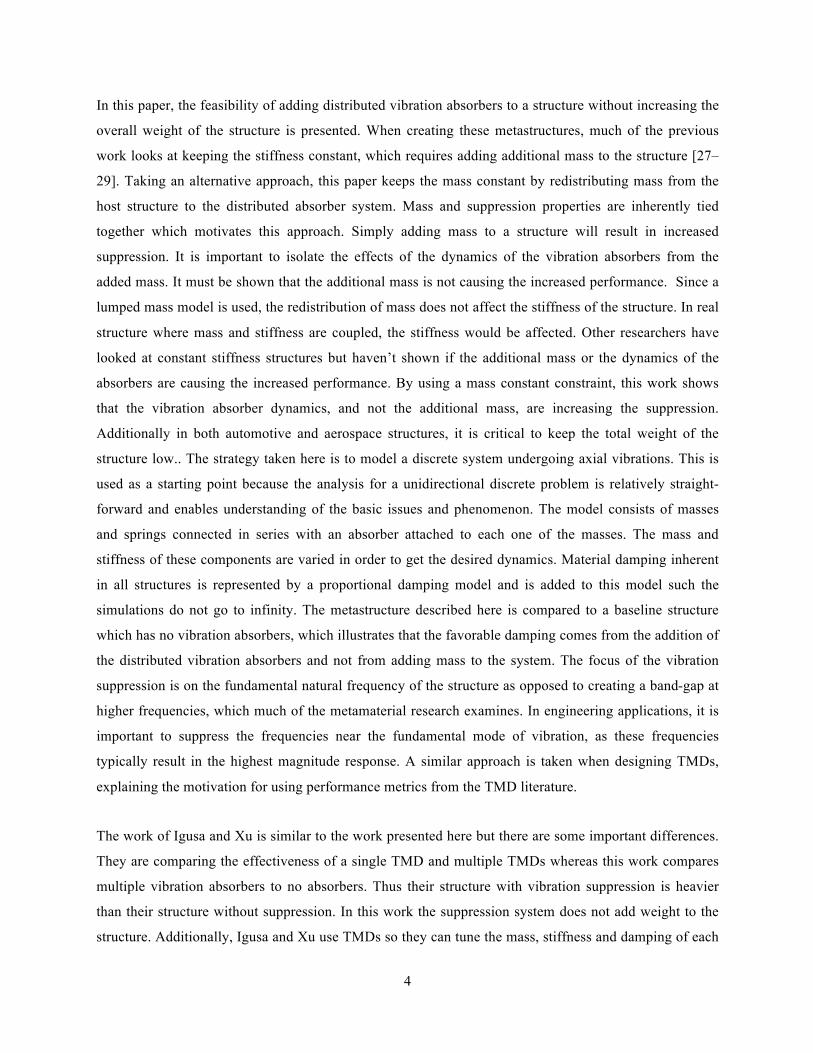
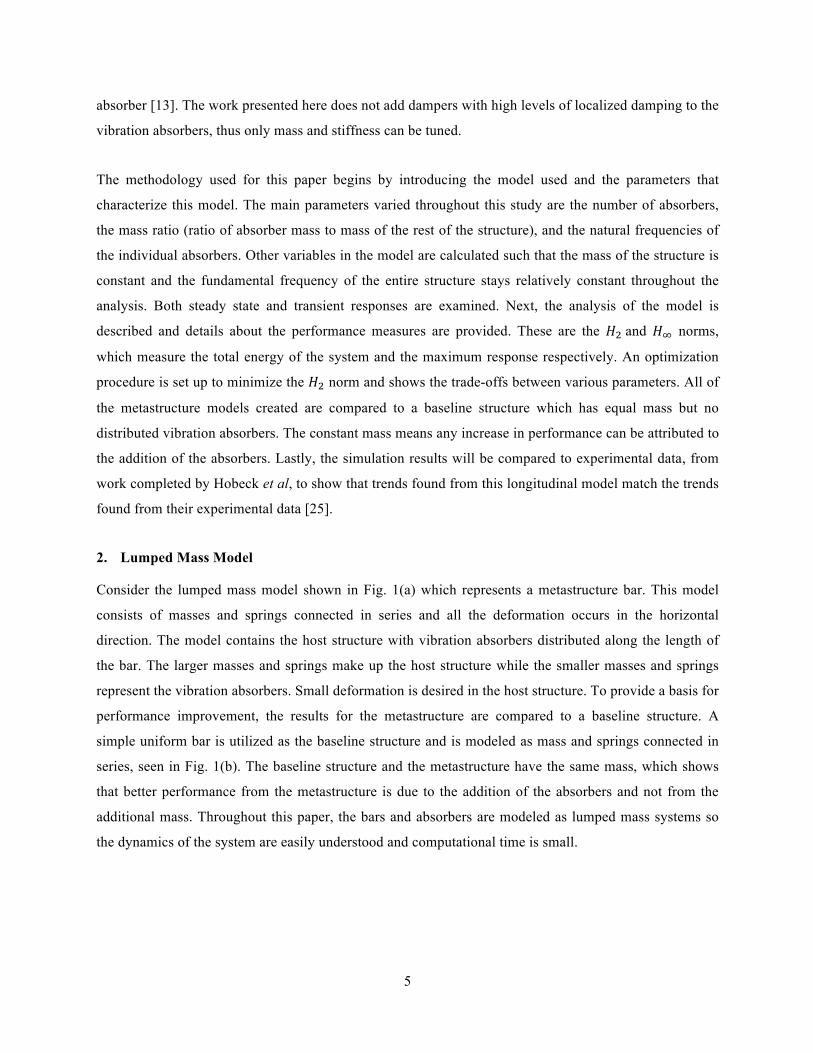
Consider the lumped mass model shown in Fig. 1(a) which represents a metastructure bar. This model
consists of masses and springs connected in series and all the deformation occurs in the horizontal
direction. The model contains the host structure with vibration absorbers distributed along the length of
the bar. The larger masses and springs make up the host structure while the smaller masses and springs
represent the vibration absorbers. Small deformation is desired in the host structure. To provide a basis for
performance improvement, the results for the metastructure are compared to a baseline structure. A
simple uniform bar is utilized as the baseline structure and is modeled as mass and springs connected in
series, seen in Fig. 1(b). The baseline structure and the metastructure have the same mass, which shows
that better performance from the metastructure is due to the addition of the absorbers and not from the
additional mass. Throughout this paper, the bars and absorbers are modeled as lumped mass systems so
the dynamics of the system are easily understood and computational time is small.
6
Fig. 1. Lumped mass models of (a) the metastructure and (b) the baseline structure
The design of these structures was chosen such that the dynamics of structures will be comparable
between the metastructure and the baseline structure. Most importantly, they will have fundamental
natural frequencies near each other. The metastructure is characterized by the number of absorbers it has,
denoted 𝑛. Therefore, 𝑛 + 1 masses make up the host structure. All masses in the host structure, except
the far right mass, have a small absorber connected to it, modeled as a mass and spring. The larger masses
will be referred to as the host masses since these make up the host structure whereas the smaller masses
are called the absorber masses. The host masses all have the same mass to represent a uniform bar but the
mass of the absorbers is allowed to vary throughout the structure. These masses have values of 𝑚 and 𝑚!
respectively where the 𝑖 refers to the 𝑖th absorber mass from the left and ranges from 1 to 𝑛. The springs
connecting the host masses are called the host springs and are denoted 𝑘. The mass ratio, 𝜇 is the ratio of
the mass of the absorber system to the mass in the host structure, and is calculated by
𝜇 =
𝑚!!!!!
(𝑛 + 1)𝑚 (1)
The baseline structure has the same number of masses at the host structure, 𝑁 = 𝑛 + 1. The mass of each
one of these masses, 𝑚 is calculated by taking the total mass of the metastructure divided by the number
/ 2k
/ 2k
1m m
/ 2k
/ 2k
mm( )F t1k
2m2k
/ 2k
/ 2k
/ 2k
/ 2k
mnm
nk
0 / 2k
0 / 2k
0 / 2k
0 / 2k
0m( )F t
0 / 2k
0 / 2k
0 / 2k
0 / 2k
0m 0m0m
L
L
(a) Metastructure : Vibration Absorbers
(b) Baseline Structure : No Vibration Absorbers
7
of masses. The springs in the baseline structure have the same stiffness as the host springs in the
metastructure. For all simulations, structural damping is utilized to approximate the total material
damping in the structure.
2.1. Model Parameters
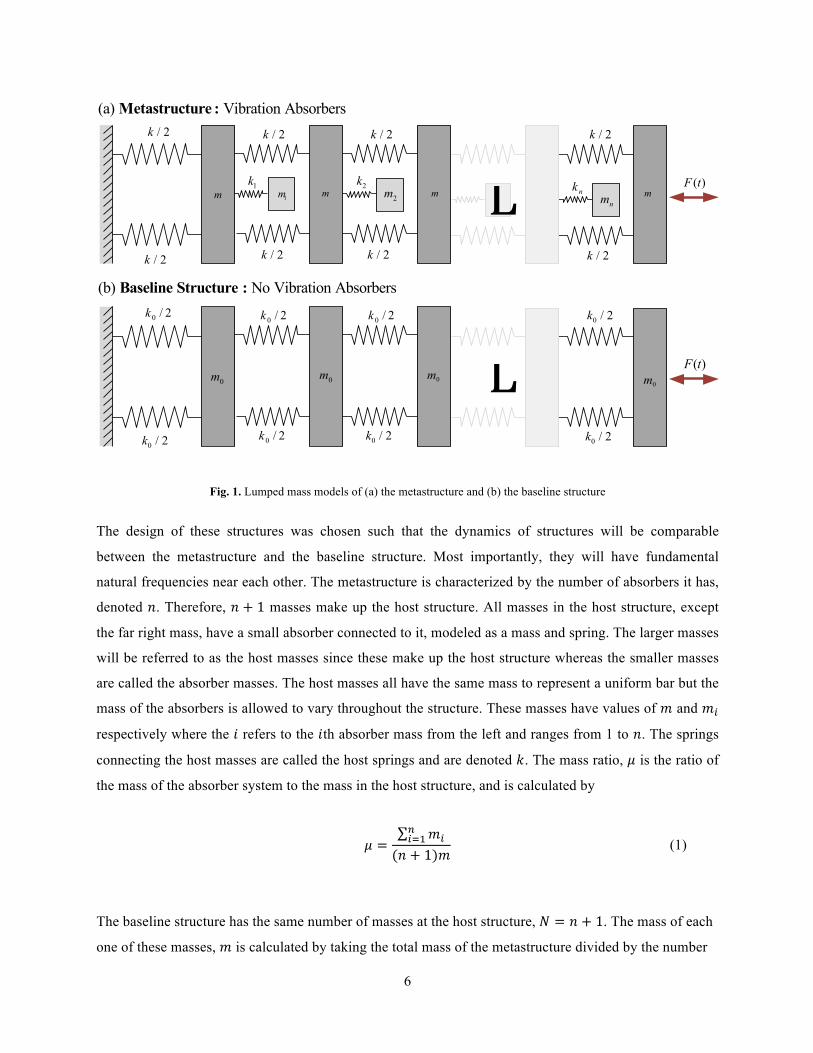
In this section, specific parameters are calculated for the various structures. In order to see the effect of
the number of absorbers, 𝑛 and the mass ratio, 𝜇 these parameters must be varied. For ease of comparison,
the fundamental natural frequencies of the structures should be approximately equal. For each model, 𝑛
and 𝜇 must be specified, and the rest of the parameters are calculated using the methods described below.
In order to achieve relatively constant fundamental frequencies, the mass and stiffness values are chosen
based on a continuous uniform fixed-free bar with a rectangular cross section and parameters shown in
Table 1. A finite element type approach is used to obtain 𝑚 and 𝑘. This approach results in a relatively
constant natural frequency for varying degrees of freedom. The uniform fixed-free bar of length ℓ is
discretized into 𝑛 elements so that the length of each element, ℓ!"!#!$% is calculated as ℓ!"!#!$% = ℓ/𝑛.
The mass and springs values are calculated for the baseline structure as
𝑘! =𝐸𝐴𝑛ℓ
, 𝑚! =𝑚!"!#$
𝑛 + 1 (2)
where 𝑘! and 𝑚! represent the stiffness and mass values for the baseline structure from Fig. 1, and
𝑚!"!#$, 𝐸,𝐴, and ℓ are defined in Table 1. These values fully define the lumped mass baseline structure
model. For the lumped mass metastructure model, the value of the host spring stiffness equals the
stiffness from the spring in the baseline structure. The mass of the host mass must change in order to keep
the mass constant between the two models. To simplify the problem further, the mass of each of the
vibration absorbers is chosen to be constant and is calculated using the mass ratio, 𝜇. The parameters of
the metastructure model are calculated as
𝑘 = 𝑘!, 𝑚 = 1 − 𝜇𝑚!"!#$
𝑛 + 1
𝑚! = 𝜇𝑚!"!#$
𝑛
(3)
8
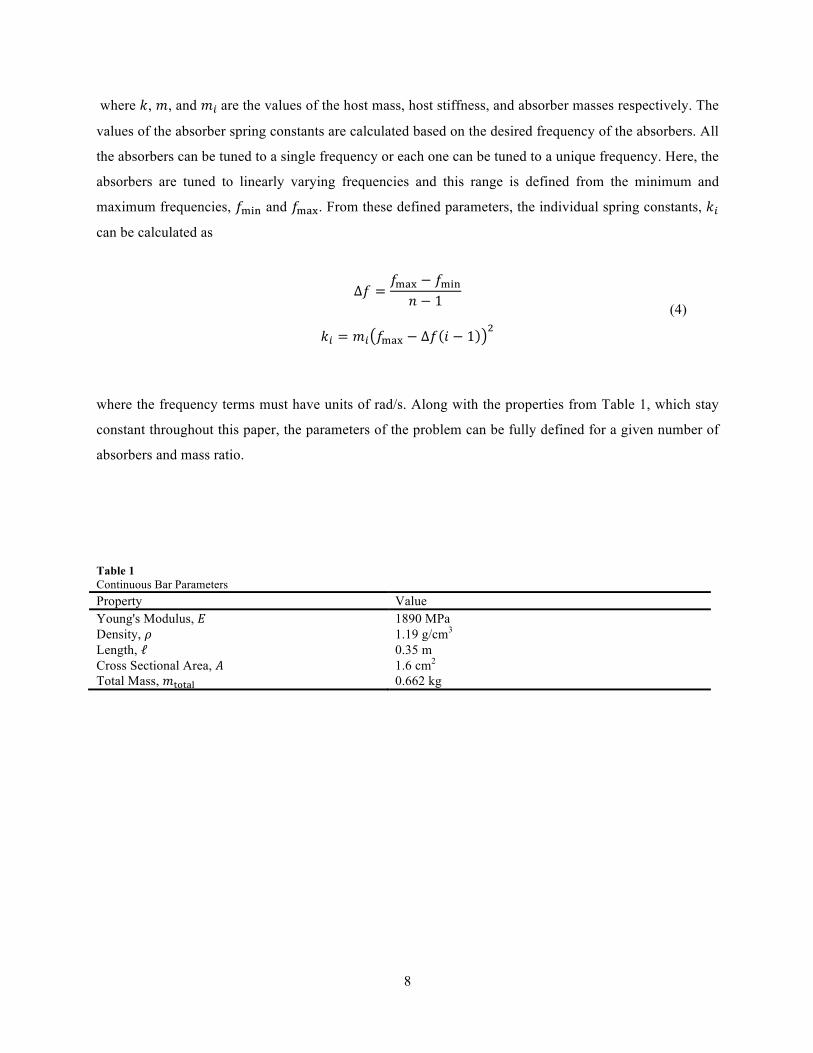
where 𝑘, 𝑚, and 𝑚! are the values of the host mass, host stiffness, and absorber masses respectively. The
values of the absorber spring constants are calculated based on the desired frequency of the absorbers. All
the absorbers can be tuned to a single frequency or each one can be tuned to a unique frequency. Here, the
absorbers are tuned to linearly varying frequencies and this range is defined from the minimum and
maximum frequencies, 𝑓!"# and 𝑓!"#. From these defined parameters, the individual spring constants, 𝑘!
can be calculated as
Δ𝑓 =
𝑓!"# − 𝑓!"#𝑛 − 1
𝑘! = 𝑚! 𝑓!"# − Δ𝑓 𝑖 − 1 !
(4)
where the frequency terms must have units of rad/s. Along with the properties from Table 1, which stay
constant throughout this paper, the parameters of the problem can be fully defined for a given number of
absorbers and mass ratio.
Table 1 Continuous Bar Parameters Property Value Young's Modulus, 𝐸 1890 MPa Density, 𝜌 1.19 g/cm3 Length, ℓ 0.35 m Cross Sectional Area, 𝐴 1.6 cm2 Total Mass, 𝑚!"!#$ 0.662 kg
9
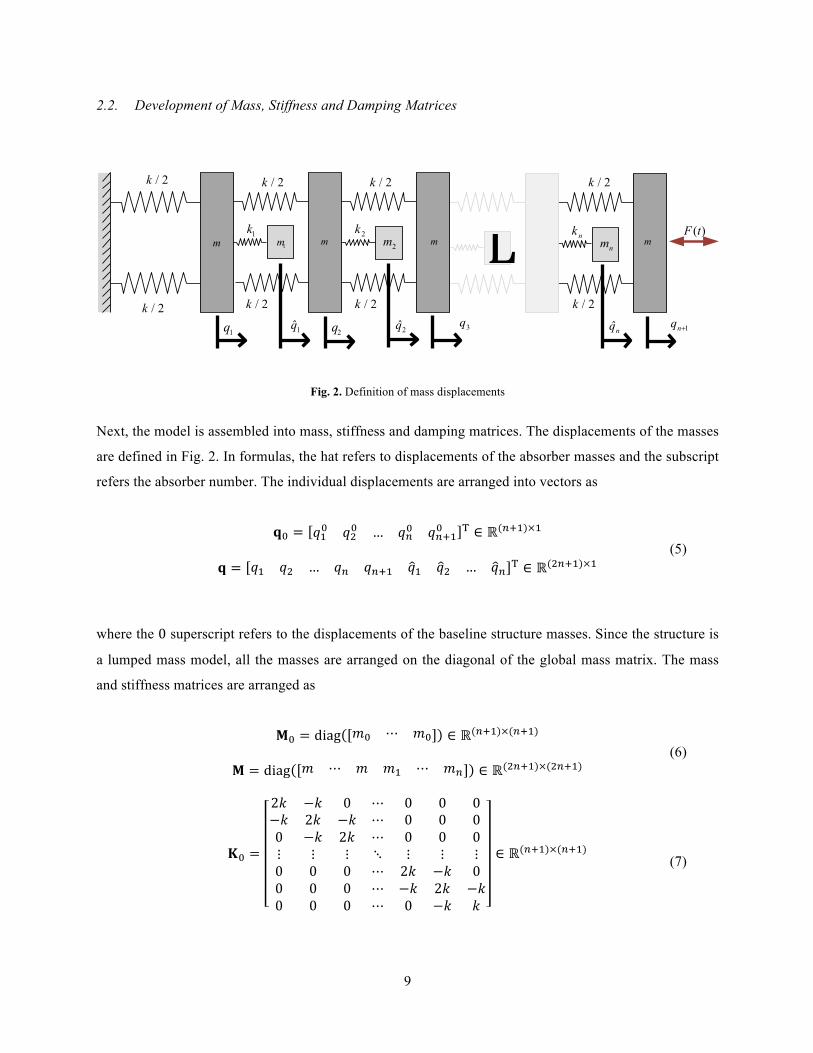
2.2. Development of Mass, Stiffness and Damping Matrices
Fig. 2. Definition of mass displacements
Next, the model is assembled into mass, stiffness and damping matrices. The displacements of the masses
are defined in Fig. 2. In formulas, the hat refers to displacements of the absorber masses and the subscript
refers the absorber number. The individual displacements are arranged into vectors as
𝐪! = 𝑞!! 𝑞!! … 𝑞!! 𝑞!!!! ! ∈ ℝ(!!!)×!
𝐪 = 𝑞! 𝑞! … 𝑞! 𝑞!!! 𝑞! 𝑞! … 𝑞! ! ∈ ℝ(!!!!)×! (5)
where the 0 superscript refers to the displacements of the baseline structure masses. Since the structure is
a lumped mass model, all the masses are arranged on the diagonal of the global mass matrix. The mass
and stiffness matrices are arranged as
𝐌! = diag 𝑚! ⋯ 𝑚! ∈ ℝ(!!!)×(!!!)
𝐌 = diag 𝑚 ⋯ 𝑚 𝑚! ⋯ 𝑚! ∈ ℝ(!!!!)×(!!!!) (6)
𝐊! =
2𝑘 −𝑘 0 ⋯ 0 0 0−𝑘 2𝑘 −𝑘 ⋯ 0 0 00 −𝑘 2𝑘 ⋯ 0 0 0⋮ ⋮ ⋮ ⋱ ⋮ ⋮ ⋮0 0 0 ⋯ 2𝑘 −𝑘 00 0 0 ⋯ −𝑘 2𝑘 −𝑘0 0 0 ⋯ 0 −𝑘 𝑘
∈ ℝ(!!!)×(!!!)
(7)
/ 2k
/ 2k
1m m
/ 2k
/ 2k
mm( )F t1k
2m2k
/ 2k
/ 2k
/ 2k
/ 2k
mnm
nkL1q 1q̂ 2q 2q̂ 3q ˆnq 1nq +
10
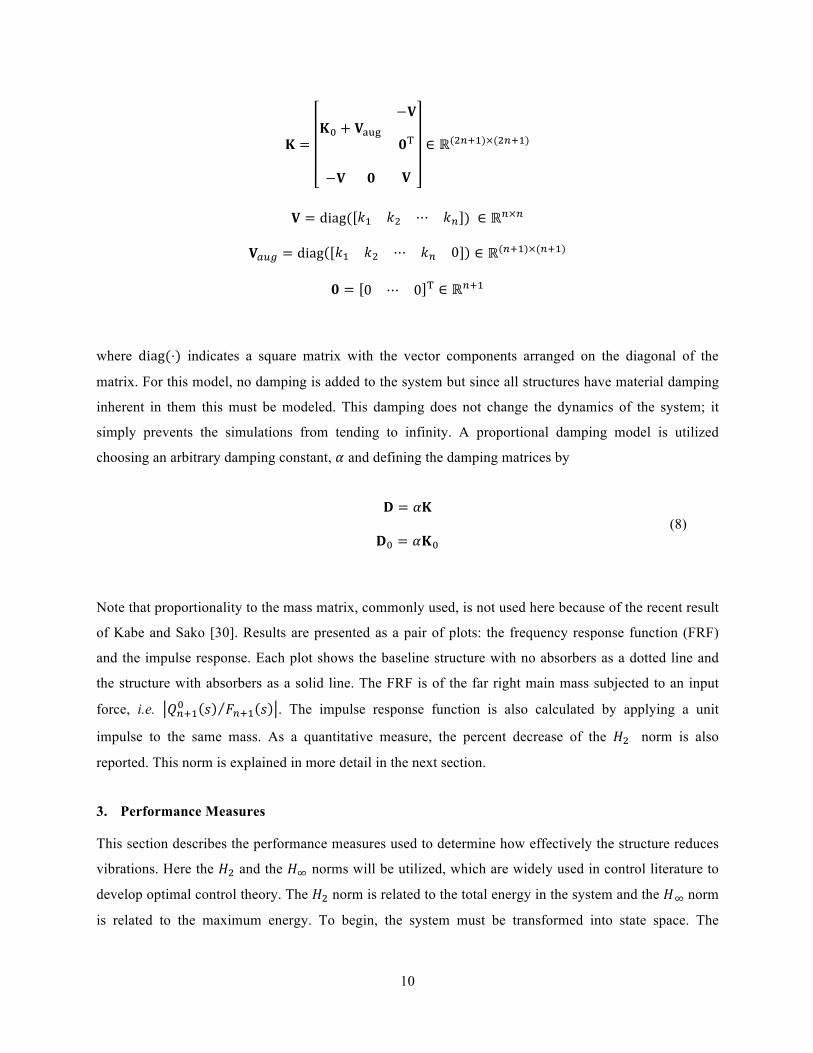
𝐊 =𝐊! + 𝐕!"#
−𝐕
𝟎!
−𝐕 𝟎 𝐕
∈ ℝ(!!!!)×(!!!!)
𝐕 = diag( 𝑘! 𝑘! ⋯ 𝑘! ) ∈ ℝ!×!
𝐕!"# = diag 𝑘! 𝑘! ⋯ 𝑘! 0 ∈ ℝ(!!!)×(!!!)
𝟎 = 0 ⋯ 0 ! ∈ ℝ!!!
where diag(⋅) indicates a square matrix with the vector components arranged on the diagonal of the
matrix. For this model, no damping is added to the system but since all structures have material damping
inherent in them this must be modeled. This damping does not change the dynamics of the system; it
simply prevents the simulations from tending to infinity. A proportional damping model is utilized
choosing an arbitrary damping constant, 𝛼 and defining the damping matrices by
𝐃 = 𝛼𝐊
𝐃! = 𝛼𝐊! (8)
Note that proportionality to the mass matrix, commonly used, is not used here because of the recent result
of Kabe and Sako [30]. Results are presented as a pair of plots: the frequency response function (FRF)
and the impulse response. Each plot shows the baseline structure with no absorbers as a dotted line and
the structure with absorbers as a solid line. The FRF is of the far right main mass subjected to an input
force, i.e. 𝑄!!!! 𝑠 𝐹!!! 𝑠 . The impulse response function is also calculated by applying a unit
impulse to the same mass. As a quantitative measure, the percent decrease of the 𝐻! norm is also
reported. This norm is explained in more detail in the next section.
3. Performance Measures
This section describes the performance measures used to determine how effectively the structure reduces
vibrations. Here the 𝐻! and the 𝐻! norms will be utilized, which are widely used in control literature to
develop optimal control theory. The 𝐻! norm is related to the total energy in the system and the 𝐻! norm
is related to the maximum energy. To begin, the system must be transformed into state space. The
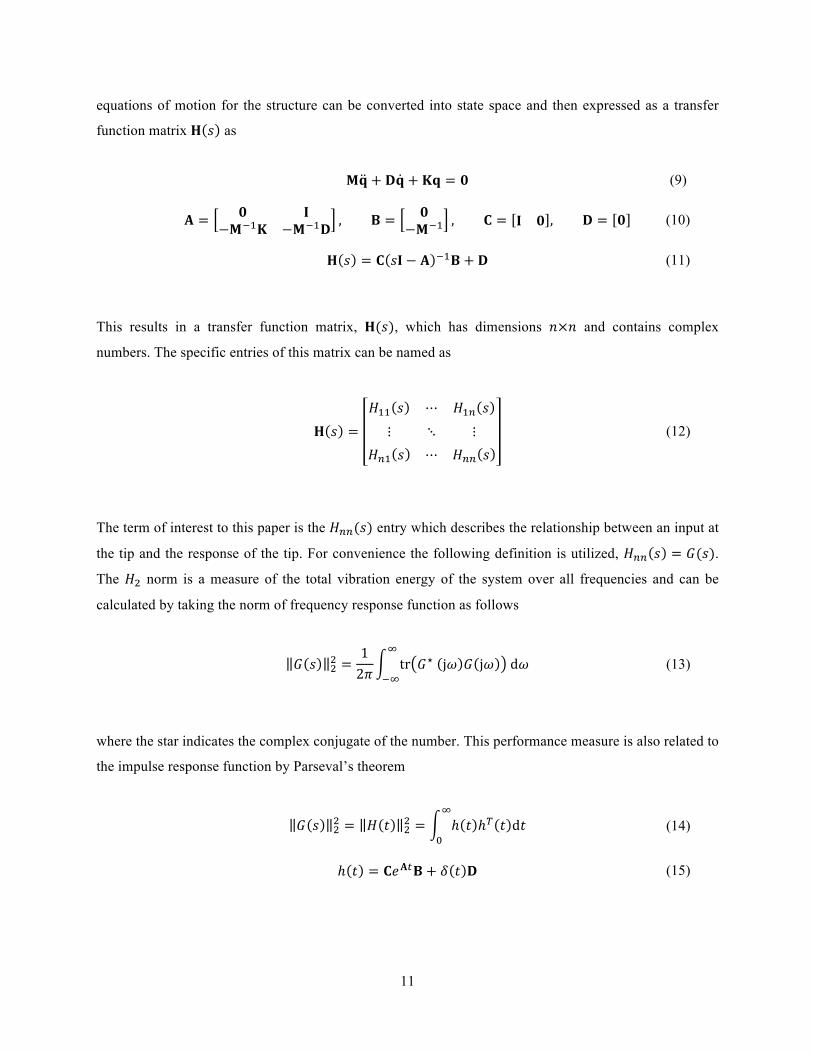
11
equations of motion for the structure can be converted into state space and then expressed as a transfer
function matrix 𝐇 𝑠 as
𝐌𝐪 + 𝐃𝐪 + 𝐊𝐪 = 𝟎 (9) 𝐀 = 𝟎 𝐈
−𝐌!!𝐊 −𝐌!!𝐃 , 𝐁 = 𝟎−𝐌!! , 𝐂 = 𝐈 𝟎 , 𝐃 = 𝟎 (10)
𝐇 𝑠 = 𝐂 𝑠𝐈 − 𝐀 !!𝐁 + 𝐃 (11)
This results in a transfer function matrix, 𝐇(𝑠), which has dimensions 𝑛×𝑛 and contains complex
numbers. The specific entries of this matrix can be named as
𝐇 𝑠 =𝐻!! 𝑠 ⋯ 𝐻!! 𝑠⋮ ⋱ ⋮
𝐻!! 𝑠 ⋯ 𝐻!! 𝑠 (12)
The term of interest to this paper is the 𝐻!!(𝑠) entry which describes the relationship between an input at
the tip and the response of the tip. For convenience the following definition is utilized, 𝐻!! 𝑠 = 𝐺(𝑠).
The 𝐻! norm is a measure of the total vibration energy of the system over all frequencies and can be
calculated by taking the norm of frequency response function as follows
𝐺 𝑠 !
! =12𝜋
tr 𝐺⋆ j𝜔 𝐺 j𝜔 d𝜔!
!! (13)
where the star indicates the complex conjugate of the number. This performance measure is also related to
the impulse response function by Parseval’s theorem
𝐺 𝑠 !
! = 𝐻 𝑡 !! = ℎ 𝑡 ℎ! 𝑡 d𝑡
!
! (14)
ℎ 𝑡 = 𝐂𝑒𝐀!𝐁 + 𝛿 𝑡 𝐃 (15)
12
where ℎ(𝑡) is the impulse response function of the system. The 𝐻! norm is a measure of the maximum
amplitude response, equivalent to looking at the maximum peak of the system in the frequency response
plot, and is calculated as
𝐺 𝑠 ! = max!
𝐺 j𝜔 (16)
The norms of the metastructure and the baseline structure are compared and presented as a percent
decrease in the following section. A larger decrease represents better performance.
4. Simulation Results
Initially, a metastructure model with three main masses, two absorbers, and a mass ratio of 𝜇 = 0.3 is
examined as shown in Error! Reference source not found.. The corresponding baseline structure has a
fundamental natural frequency of 766 Hz. The two absorbers in the metastructure are tuned to that same
frequency, 766 Hz. Using equations Eq. (3) and (4), 𝑚! and 𝑘! are calculated.
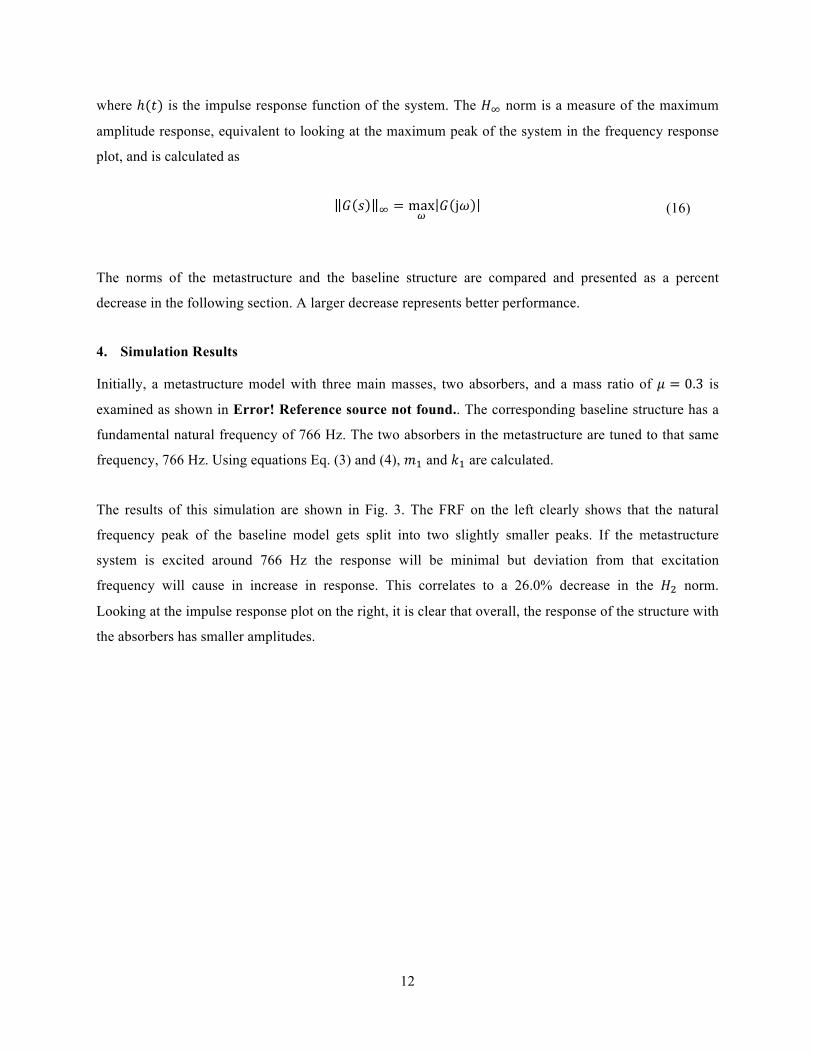
The results of this simulation are shown in Fig. 3. The FRF on the left clearly shows that the natural
frequency peak of the baseline model gets split into two slightly smaller peaks. If the metastructure
system is excited around 766 Hz the response will be minimal but deviation from that excitation
frequency will cause in increase in response. This correlates to a 26.0% decrease in the 𝐻! norm.
Looking at the impulse response plot on the right, it is clear that overall, the response of the structure with
the absorbers has smaller amplitudes.
13
Fig. 3. FRF and the impulse response of two absorbers tuned to the same frequency
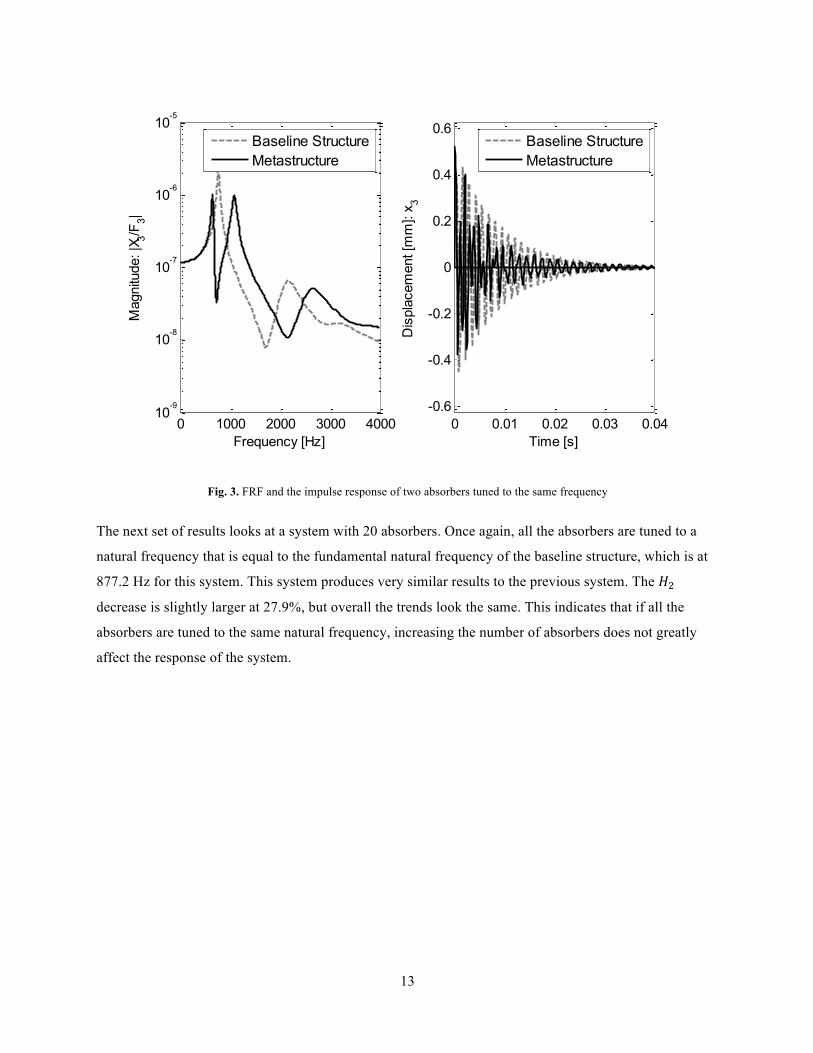
The next set of results looks at a system with 20 absorbers. Once again, all the absorbers are tuned to a
natural frequency that is equal to the fundamental natural frequency of the baseline structure, which is at
877.2 Hz for this system. This system produces very similar results to the previous system. The 𝐻!
decrease is slightly larger at 27.9%, but overall the trends look the same. This indicates that if all the
absorbers are tuned to the same natural frequency, increasing the number of absorbers does not greatly
affect the response of the system.
0 1000 2000 3000 400010
-9
10-8
10-7
10-6
10-5
Frequency [Hz]
Mag
nitu
de: |
X 3/F3|
Baseline StructureMetastructure
0 0.01 0.02 0.03 0.04-0.6
-0.4
-0.2
0
0.2
0.4
0.6
Time [s]
Dis
plac
emen
t [m
m]:
x 3
Baseline StructureMetastructure
14
Fig. 4. FRF and Impulse Response of System with 20 absorbers with constant frequency
Simply increasing the number of absorbers while keeping the natural frequency the same for all absorbers
does not make a significant impact, but it does allow for greater flexibility in the tuning of the parameters.
From the previous results, the frequency at which the absorbers were tuned causes a dip in the FRF at that
frequency. Instead of setting all the absorbers to a single frequency and getting one large dip, the next
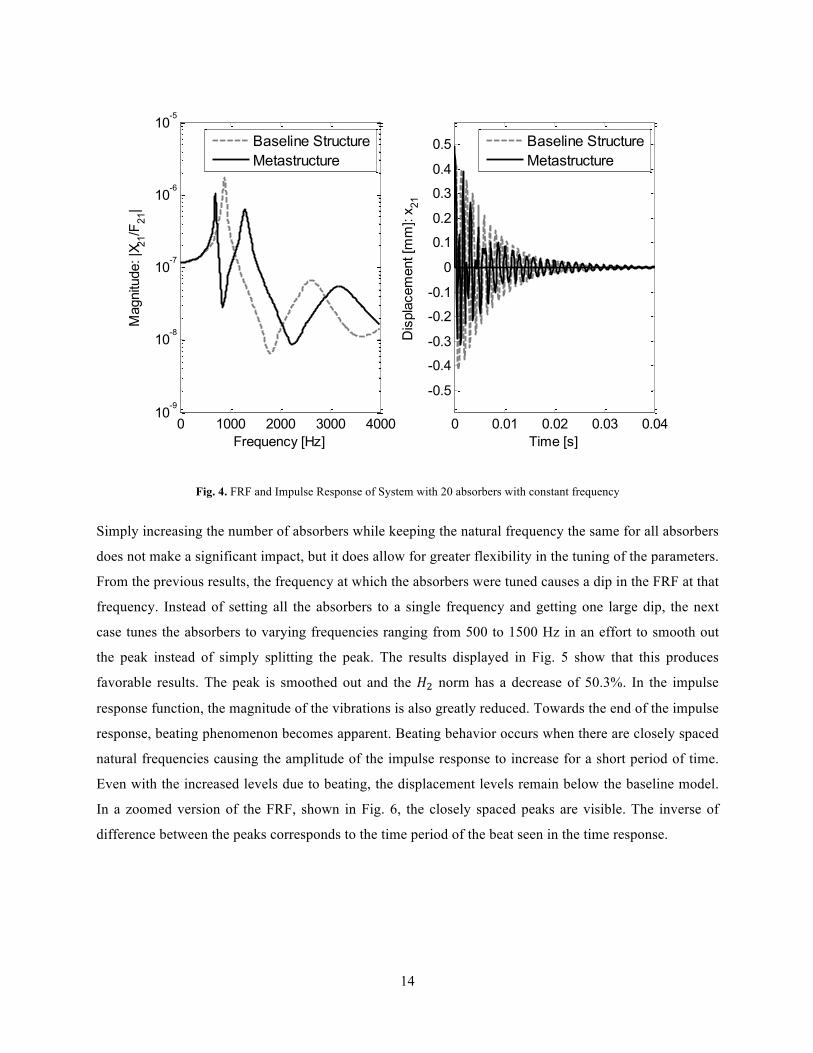
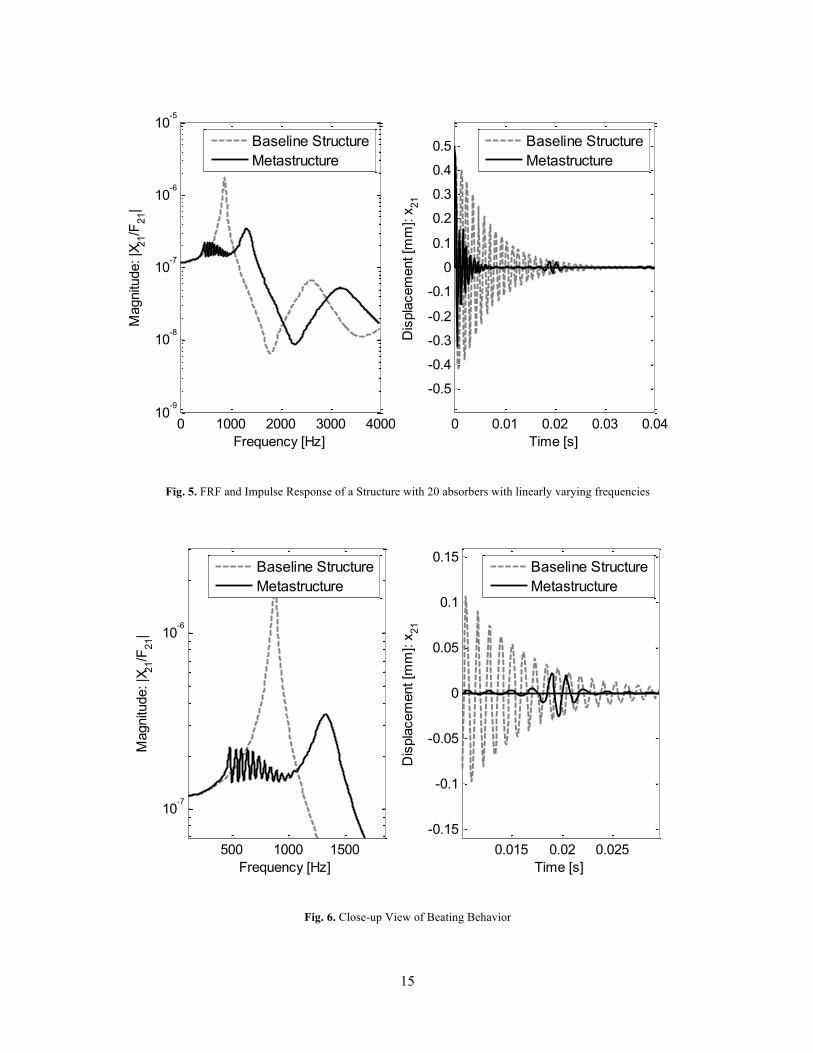
case tunes the absorbers to varying frequencies ranging from 500 to 1500 Hz in an effort to smooth out
the peak instead of simply splitting the peak. The results displayed in Fig. 5 show that this produces
favorable results. The peak is smoothed out and the 𝐻! norm has a decrease of 50.3%. In the impulse
response function, the magnitude of the vibrations is also greatly reduced. Towards the end of the impulse
response, beating phenomenon becomes apparent. Beating behavior occurs when there are closely spaced
natural frequencies causing the amplitude of the impulse response to increase for a short period of time.
Even with the increased levels due to beating, the displacement levels remain below the baseline model.
In a zoomed version of the FRF, shown in Fig. 6, the closely spaced peaks are visible. The inverse of
difference between the peaks corresponds to the time period of the beat seen in the time response.
0 1000 2000 3000 400010
-9
10-8
10-7
10-6
10-5
Frequency [Hz]
Mag
nitu
de: |
X 21/F
21|
Baseline StructureMetastructure
0 0.01 0.02 0.03 0.04
-0.5
-0.4
-0.3
-0.2
-0.1
0
0.1
0.2
0.3
0.4
0.5
Time [s]
Dis
plac
emen
t [m
m]:
x 21
Baseline StructureMetastructure
15
Fig. 5. FRF and Impulse Response of a Structure with 20 absorbers with linearly varying frequencies
Fig. 6. Close-up View of Beating Behavior
0 1000 2000 3000 400010
-9
10-8
10-7
10-6
10-5
Frequency [Hz]
Mag
nitu
de: |
X 21/F
21|
Baseline StructureMetastructure
0 0.01 0.02 0.03 0.04
-0.5
-0.4
-0.3
-0.2
-0.1
0
0.1
0.2
0.3
0.4
0.5
Time [s]
Dis
plac
emen
t [m
m]:
x 21
Baseline StructureMetastructure
500 1000 1500
10-7
10-6
Frequency [Hz]
Mag
nitu
de: |
X 21/F
21|
Baseline StructureMetastructure
0.015 0.02 0.025-0.15
-0.1
-0.05
0
0.05
0.1
0.15
Time [s]
Dis
plac
emen
t [m
m]:
x 21
Baseline StructureMetastructure
16
5. Optimization
Next, an optimized version of this model is examined using a similar procedure to that of Zou and
Nayfeh, who applied their methods to multiple degree of freedom tuned mass dampers [18]. Zou and
Nayfeh optimized their model by minimizing the 𝐻! norm. A similar approach is taken in this model, but
will maximize the percent decrease in the 𝐻! norm from the baseline structure to the metastructure. The
negative of this percentage is used as the objective function and is minimized. The optimization is
performed in MATLAB using a constrained non-linear interior point algorithm (fmincon). When the
optimization is performed, the number of vibration absorbers is constrained to a single value and the
algorithm determines the optimal values of the frequency range and mass ratio. The number of absorbers
was not used as a parameter of the optimization since it does not take an optimal value. More absorbers
lead to higher performance but also lead to a more complex structure. The complexity of a structure is
difficult to quantity. This trade-off between performance and complexity is described in more detail in
Section 6.3. When this optimization procedure is applied to the system with 20 absorbers from Section 4,
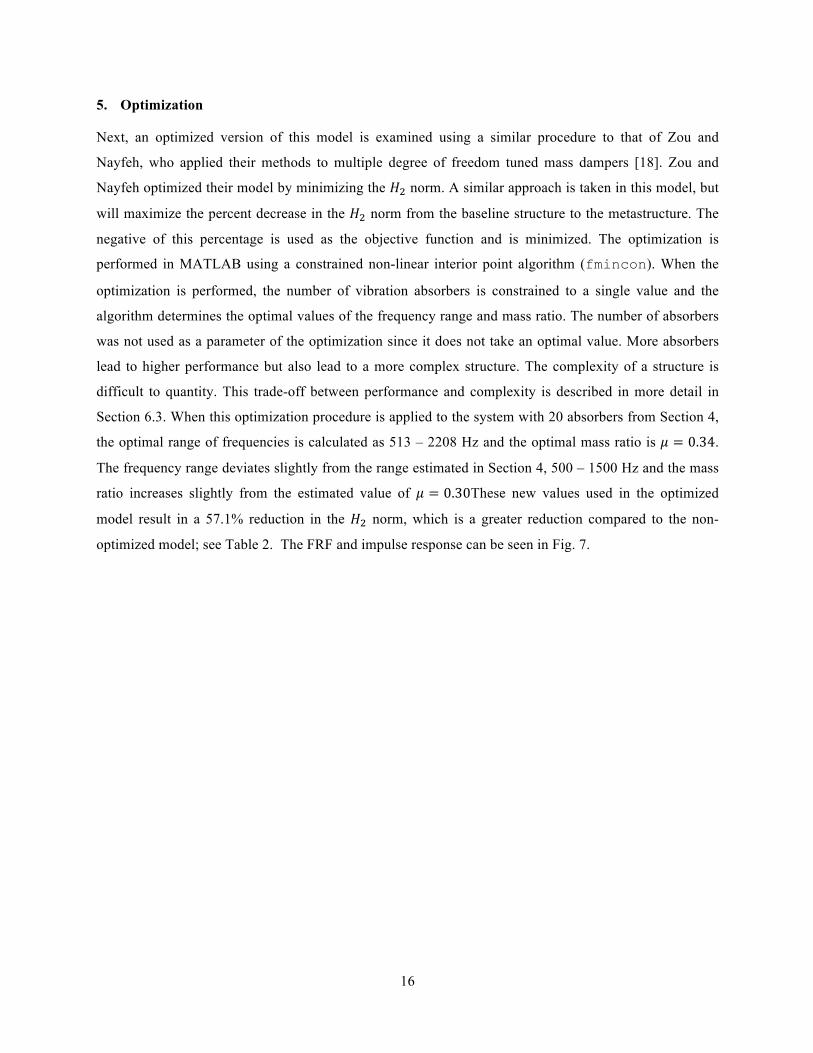
the optimal range of frequencies is calculated as 513 – 2208 Hz and the optimal mass ratio is 𝜇 = 0.34.
The frequency range deviates slightly from the range estimated in Section 4, 500 – 1500 Hz and the mass
ratio increases slightly from the estimated value of 𝜇 = 0.30These new values used in the optimized
model result in a 57.1% reduction in the 𝐻! norm, which is a greater reduction compared to the non-
optimized model; see Table 2. The FRF and impulse response can be seen in Fig. 7.
17
Fig. 7. Optimized Model for 20 absorbers
6. Parameters to Vary
A variety of parameters are examined, to see what the model is capable of and to help understand any
basic phenomenon. This section explores the various parameters of the models to see how to get the best
response in terms of the performance measures defined in the sections below.
6.1. Distribution of the Stiffness
As shown previously, the models in which the absorbers are tuned to frequencies that vary linearly
provide better performance than those that are all tuned to a single frequency. Next, other distributions are
examined. Instead of constraining the distribution to be linear, the optimization code allows each absorber
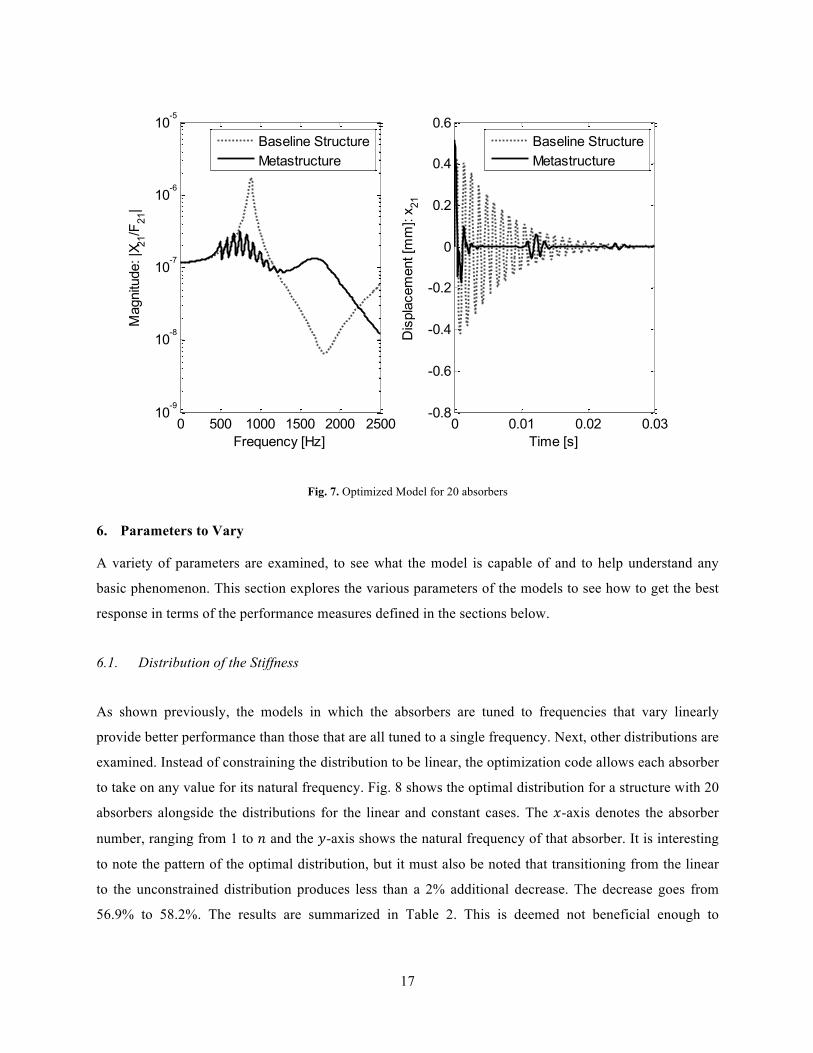
to take on any value for its natural frequency. Fig. 8 shows the optimal distribution for a structure with 20
absorbers alongside the distributions for the linear and constant cases. The 𝑥-axis denotes the absorber
number, ranging from 1 to 𝑛 and the 𝑦-axis shows the natural frequency of that absorber. It is interesting
to note the pattern of the optimal distribution, but it must also be noted that transitioning from the linear
to the unconstrained distribution produces less than a 2% additional decrease. The decrease goes from
56.9% to 58.2%. The results are summarized in Table 2. This is deemed not beneficial enough to
0 500 1000 1500 2000 250010
-9
10-8
10-7
10-6
10-5
Frequency [Hz]
Mag
nitu
de: |
X 21/F
21|
Baseline StructureMetastructure
0 0.01 0.02 0.03-0.8
-0.6
-0.4
-0.2
0
0.2
0.4
0.6
Time [s]
Dis
plac
emen
t [m
m]:
x 21
Baseline StructureMetastructure
18
outweigh the extra time it takes the optimization code to run. For the following analyses, a linear
distribution is utilized.
Fig. 8. Natural Frequeny of Indiviadual Vibration Absorbers
Table 2 Summary of Results from Various Configurations Number of
Absorbers, 𝒏 Absorber Frequency Range (Hz)
Percent Decrease in 𝑯𝟐 Norm
Set to baseline fundamental frequency 2 766 26.0% Set to baseline fundamental frequency 20 877 27.9% Set to vary around baseline frequency 20 500 – 1500 50.3% Optimized with respect to the 𝐻! norm (stiffness varies linearly)
20 513 – 2202 57.1%
Optimized with respect to the 𝐻! norm (no constraint set of stiffness distribution)
20 533 – 3420 58.2%
6.2. Mass Ratio
Next, the effect of the mass ratio on the system is determined. The mass ratio is included in the
optimization procedure described in Section 5 but looking at the effects of varying the mass ratio provides
insight into the behavior of the system. Recall, the definition of the mass ratio is the ratio of the mass of
the absorbers over the mass of the host structure, Eq. (1). Once a mass ratio and a total mass is defined,
the mass of the absorbers can be calculated; see Eq. (3) for details. Next, a optimization procedure similar
0 2 4 6 8 10 12 14 16 18 20500
1000
1500
2000
2500
3000
3500
Absorber Number
Nat
ural
Fre
quen
cy o
f Abs
orbe
r [H
z]
Single Frequency ConstraintLinear DistributionUnconstrained
19
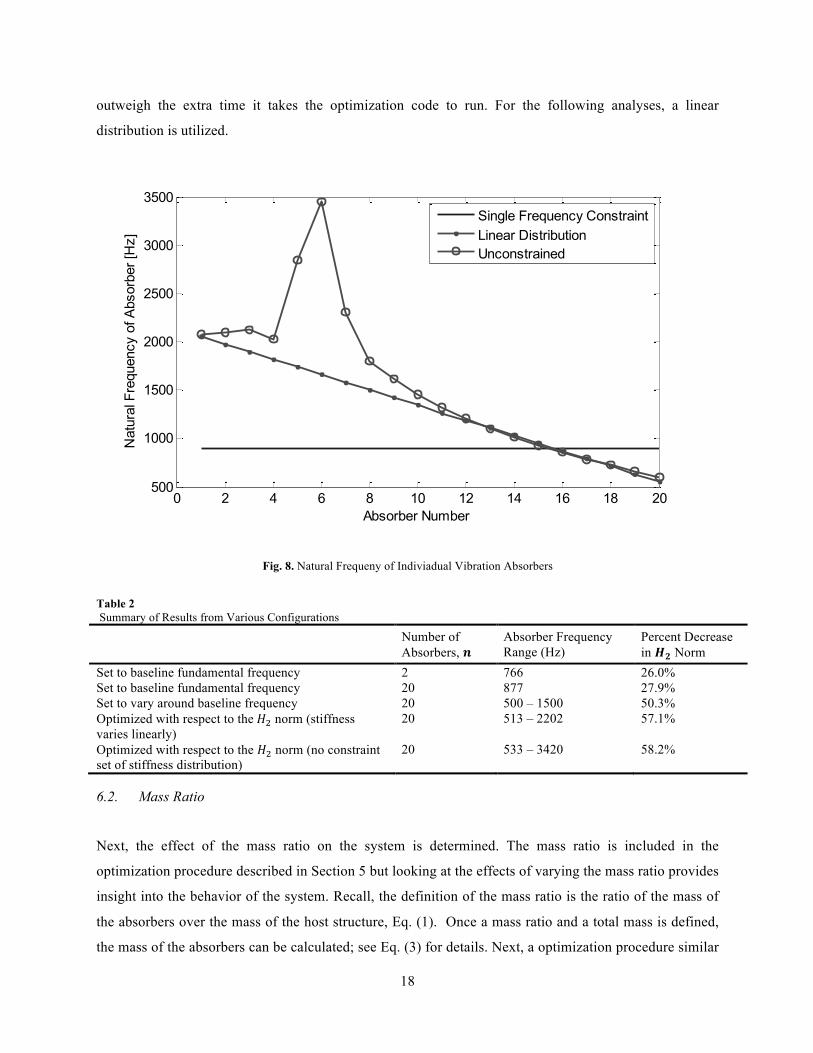
to the one described above is used to calculate the stiffness values of the absorber springs. For each data
point in Fig. 9, the number of absorbers is set to 20, the mass ratio is varied, and the optimization
procedure is performed. The resulting percent decrease is plotted and the shape of the plot shows there is
an optimal mass ratio value which is why the mass ratio was added to the optimization procedure in
Section 5. The existence of an optimal mass value show that there is a tradeoff between mass in the
absorber system and mass in the host structure. Too little mass in the absorber system does not allow
sufficient energy transfer to the absorber mass and too much mass produces a large response from a
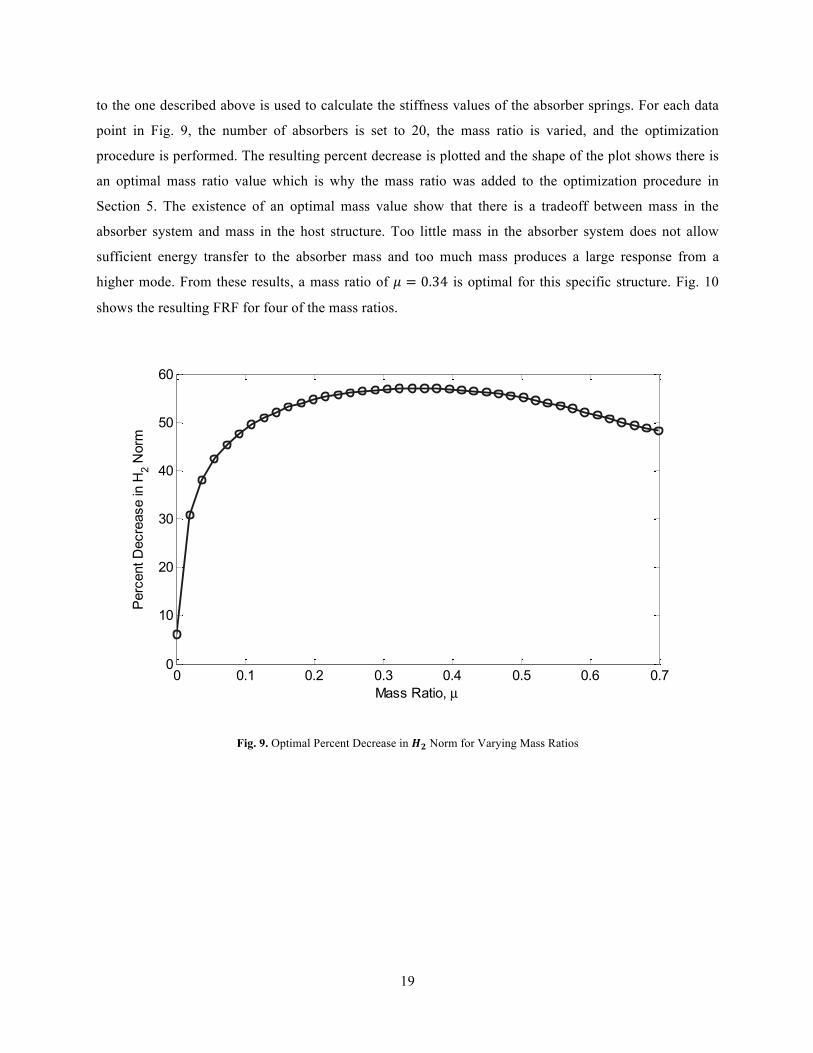
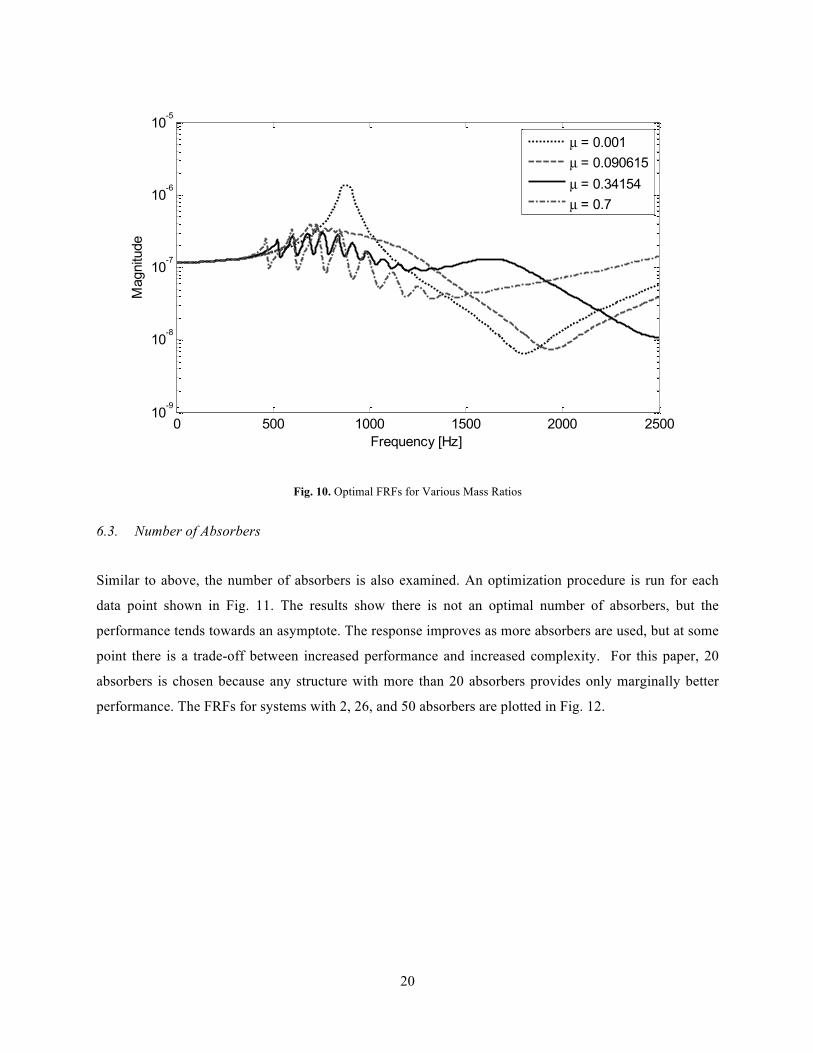
higher mode. From these results, a mass ratio of 𝜇 = 0.34 is optimal for this specific structure. Fig. 10
shows the resulting FRF for four of the mass ratios.
Fig. 9. Optimal Percent Decrease in 𝑯𝟐 Norm for Varying Mass Ratios
0 0.1 0.2 0.3 0.4 0.5 0.6 0.70
10
20
30
40
50
60
Mass Ratio, µ
Per
cent
Dec
reas
e in
H2 N
orm
20
Fig. 10. Optimal FRFs for Various Mass Ratios
6.3. Number of Absorbers
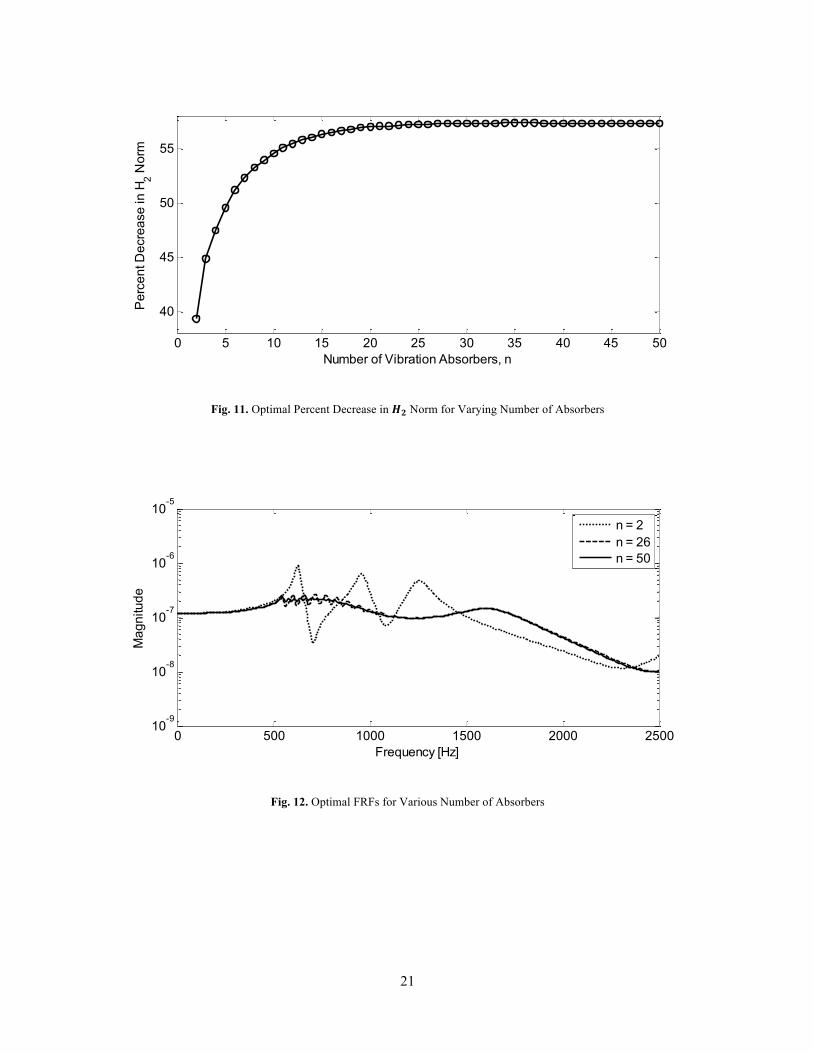
Similar to above, the number of absorbers is also examined. An optimization procedure is run for each
data point shown in Fig. 11. The results show there is not an optimal number of absorbers, but the
performance tends towards an asymptote. The response improves as more absorbers are used, but at some
point there is a trade-off between increased performance and increased complexity. For this paper, 20
absorbers is chosen because any structure with more than 20 absorbers provides only marginally better
performance. The FRFs for systems with 2, 26, and 50 absorbers are plotted in Fig. 12.
0 500 1000 1500 2000 250010
-9
10-8
10-7
10-6
10-5
Frequency [Hz]
Mag
nitu
de
µ = 0.001µ = 0.090615µ = 0.34154µ = 0.7
21
Fig. 11. Optimal Percent Decrease in 𝑯𝟐 Norm for Varying Number of Absorbers
Fig. 12. Optimal FRFs for Various Number of Absorbers
0 5 10 15 20 25 30 35 40 45 50
40
45
50
55
Number of Vibration Absorbers, n
Per
cent
Dec
reas
e in
H2 N
orm
0 500 1000 1500 2000 250010
-9
10-8
10-7
10-6
10-5
Frequency [Hz]
Mag
nitu
de
n = 2n = 26n = 50
22
7. Experimental and Finite Element Trend Verification
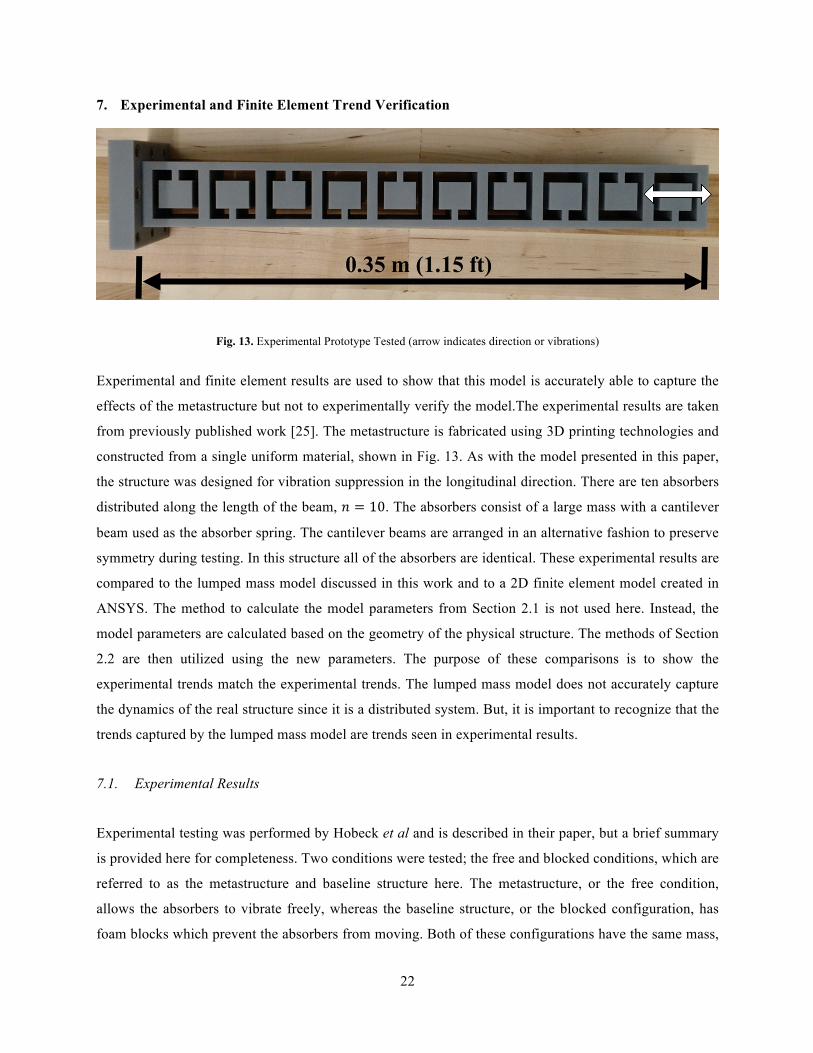
Fig. 13. Experimental Prototype Tested (arrow indicates direction or vibrations)
Experimental and finite element results are used to show that this model is accurately able to capture the
effects of the metastructure but not to experimentally verify the model.The experimental results are taken
from previously published work [25]. The metastructure is fabricated using 3D printing technologies and
constructed from a single uniform material, shown in Fig. 13. As with the model presented in this paper,
the structure was designed for vibration suppression in the longitudinal direction. There are ten absorbers
distributed along the length of the beam, 𝑛 = 10. The absorbers consist of a large mass with a cantilever
beam used as the absorber spring. The cantilever beams are arranged in an alternative fashion to preserve
symmetry during testing. In this structure all of the absorbers are identical. These experimental results are
compared to the lumped mass model discussed in this work and to a 2D finite element model created in
ANSYS. The method to calculate the model parameters from Section 2.1 is not used here. Instead, the
model parameters are calculated based on the geometry of the physical structure. The methods of Section
2.2 are then utilized using the new parameters. The purpose of these comparisons is to show the
experimental trends match the experimental trends. The lumped mass model does not accurately capture
the dynamics of the real structure since it is a distributed system. But, it is important to recognize that the
trends captured by the lumped mass model are trends seen in experimental results.
7.1. Experimental Results
Experimental testing was performed by Hobeck et al and is described in their paper, but a brief summary
is provided here for completeness. Two conditions were tested; the free and blocked conditions, which are
referred to as the metastructure and baseline structure here. The metastructure, or the free condition,
allows the absorbers to vibrate freely, whereas the baseline structure, or the blocked configuration, has
foam blocks which prevent the absorbers from moving. Both of these configurations have the same mass,
23
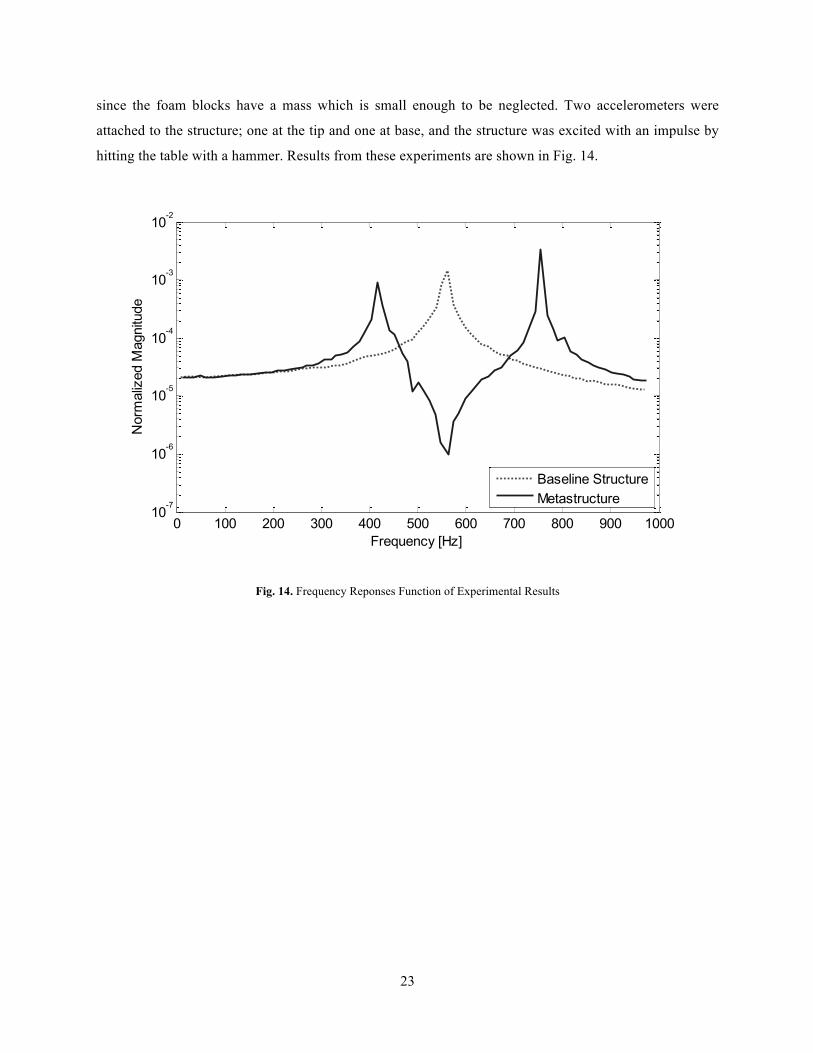
since the foam blocks have a mass which is small enough to be neglected. Two accelerometers were
attached to the structure; one at the tip and one at base, and the structure was excited with an impulse by
hitting the table with a hammer. Results from these experiments are shown in Fig. 14.
Fig. 14. Frequency Reponses Function of Experimental Results
0 100 200 300 400 500 600 700 800 900 100010
-7
10-6
10-5
10-4
10-3
10-2
Frequency [Hz]
Nor
mal
ized
Mag
nitu
de
Baseline StructureMetastructure
24
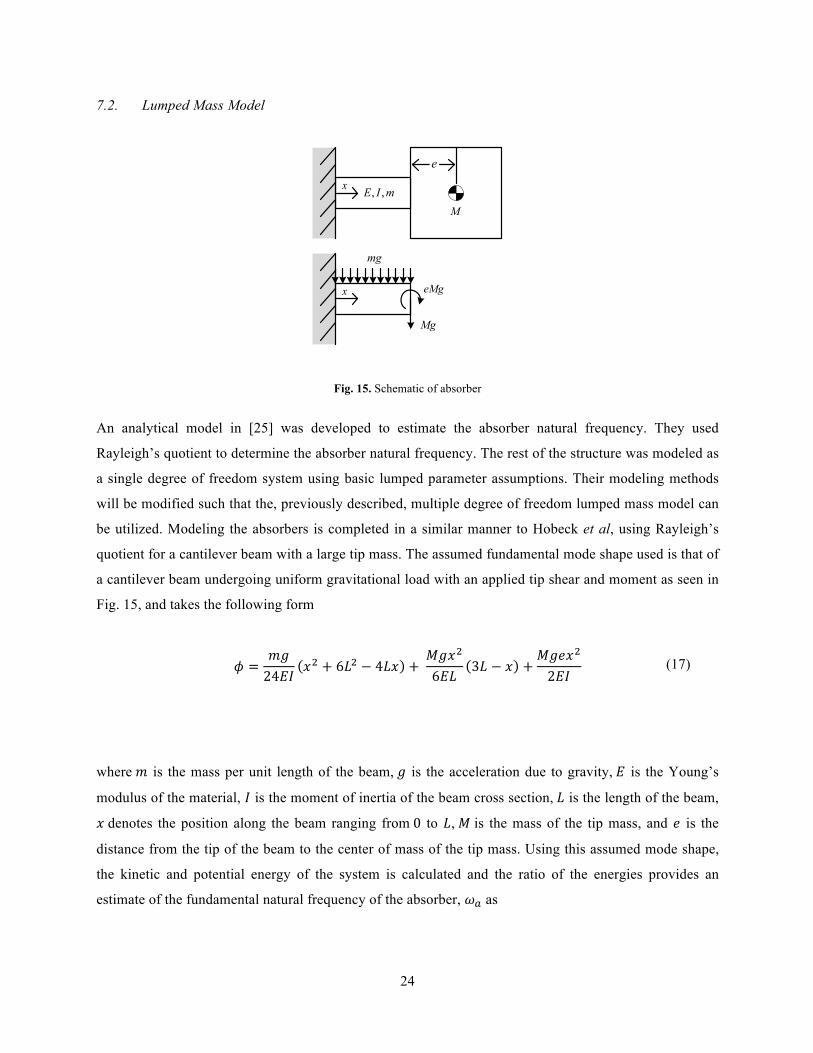
7.2. Lumped Mass Model
Fig. 15. Schematic of absorber
An analytical model in [25] was developed to estimate the absorber natural frequency. They used
Rayleigh’s quotient to determine the absorber natural frequency. The rest of the structure was modeled as
a single degree of freedom system using basic lumped parameter assumptions. Their modeling methods
will be modified such that the, previously described, multiple degree of freedom lumped mass model can
be utilized. Modeling the absorbers is completed in a similar manner to Hobeck et al, using Rayleigh’s
quotient for a cantilever beam with a large tip mass. The assumed fundamental mode shape used is that of
a cantilever beam undergoing uniform gravitational load with an applied tip shear and moment as seen in
Fig. 15, and takes the following form
where 𝑚 is the mass per unit length of the beam, 𝑔 is the acceleration due to gravity, 𝐸 is the Young’s
modulus of the material, 𝐼 is the moment of inertia of the beam cross section, 𝐿 is the length of the beam,
𝑥 denotes the position along the beam ranging from 0 to 𝐿, 𝑀 is the mass of the tip mass, and 𝑒 is the
distance from the tip of the beam to the center of mass of the tip mass. Using this assumed mode shape,
the kinetic and potential energy of the system is calculated and the ratio of the energies provides an
estimate of the fundamental natural frequency of the absorber, 𝜔! as
e
, ,E I mx
M
x
mg
eMg
Mg
𝜙 =
𝑚𝑔24𝐸𝐼
𝑥! + 6𝐿! − 4𝐿𝑥 + 𝑀𝑔𝑥!
6𝐸𝐿3𝐿 − 𝑥 +
𝑀𝑔𝑒𝑥!
2𝐸𝐼 (17)
25
𝜔!! =
12 𝐸𝐼 𝜙!! !𝑑𝑥!
!12 𝑚𝜙!𝑑𝑥!
! + 12𝑀 𝜙! + 𝑒𝜙!! ! + 12 𝐽 𝜙!! !
(18)
where J is the polar moment of inertia of the tip mass, the prime ⋅ ! indicates the derivative with respect
to x, and the L subscript refers to the value of 𝜙 at the tip of the beam, i.e. 𝜙! = 𝜙 𝑥 = 𝐿 .
The lumped mass model requires the mass and stiffness of the absorber. Since the experimental model is
uniform, 𝑘! = 𝑘! = ⋯ = 𝑘!" = 𝑘! and 𝑚! = 𝑚! = ⋯ = 𝑚!" = 𝑚! The mass of the absorber, 𝑚! can
be determined from geometry and material properties. Then the effective stiffness, 𝑘! is calculated as
𝑘! = 𝑚!𝜔!! (19)
The host structure parameters are calculated based on the geometry and material properties of the physical
structure. The host mass, 𝑚!, accounts for the mass of all the material that is not a part of the absorbers.
The host spring stiffness is calculated as
𝑘! =𝐸𝐴ℓ
(20)
where 𝐸 is the Young’s modulus of the material, 𝐴 is the cross-sectional area, and ℓ is the distance
between the host masses. These parameters are then used to determine the mass, stiffness, and damping
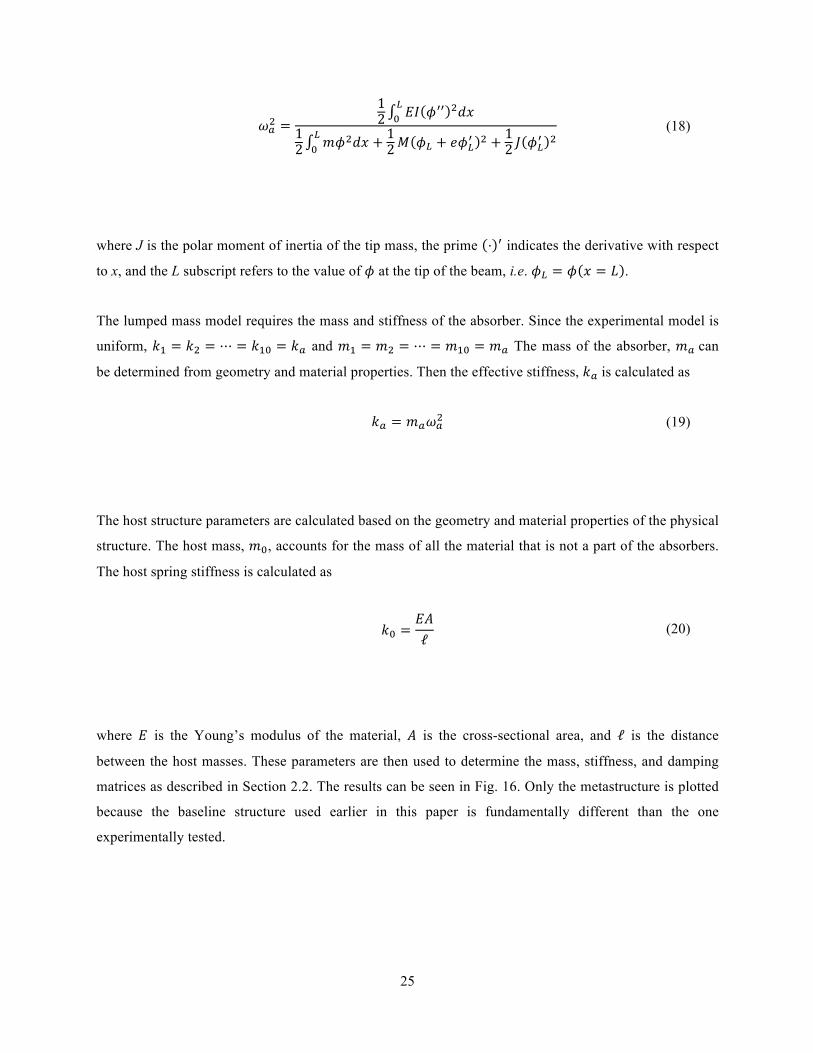
matrices as described in Section 2.2. The results can be seen in Fig. 16. Only the metastructure is plotted
because the baseline structure used earlier in this paper is fundamentally different than the one
experimentally tested.
26
Fig. 16. Frequency Response Function of Lumped Mass Model
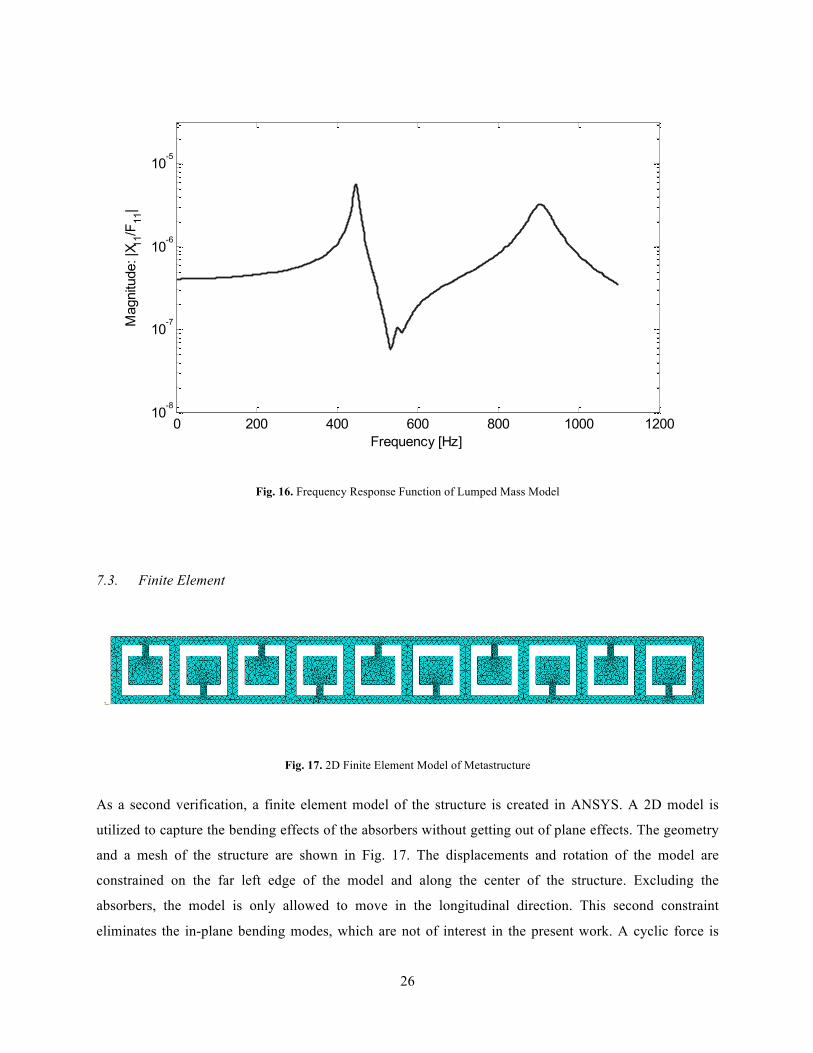
7.3. Finite Element
Fig. 17. 2D Finite Element Model of Metastructure
As a second verification, a finite element model of the structure is created in ANSYS. A 2D model is
utilized to capture the bending effects of the absorbers without getting out of plane effects. The geometry
and a mesh of the structure are shown in Fig. 17. The displacements and rotation of the model are
constrained on the far left edge of the model and along the center of the structure. Excluding the
absorbers, the model is only allowed to move in the longitudinal direction. This second constraint
eliminates the in-plane bending modes, which are not of interest in the present work. A cyclic force is
0 200 400 600 800 1000 120010
-8
10-7
10-6
10-5
Frequency [Hz]
Mag
nitu
de: |
X 11/F
11|
27
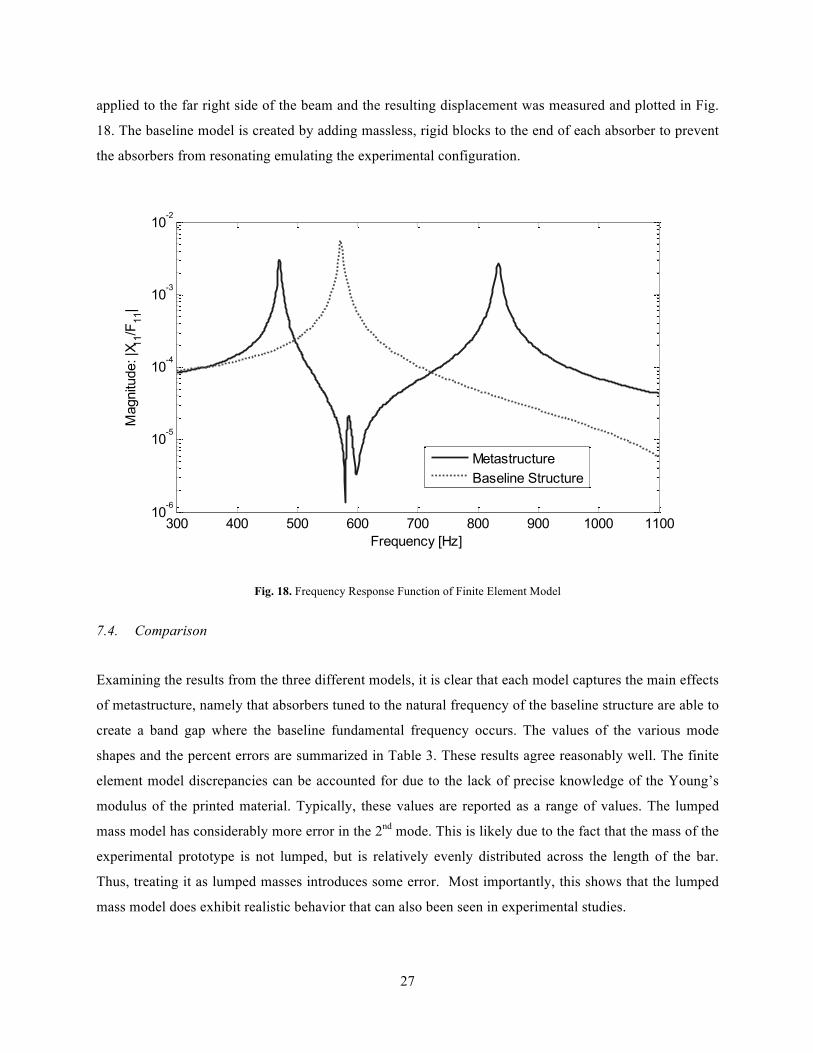
applied to the far right side of the beam and the resulting displacement was measured and plotted in Fig.
18. The baseline model is created by adding massless, rigid blocks to the end of each absorber to prevent
the absorbers from resonating emulating the experimental configuration.
Fig. 18. Frequency Response Function of Finite Element Model
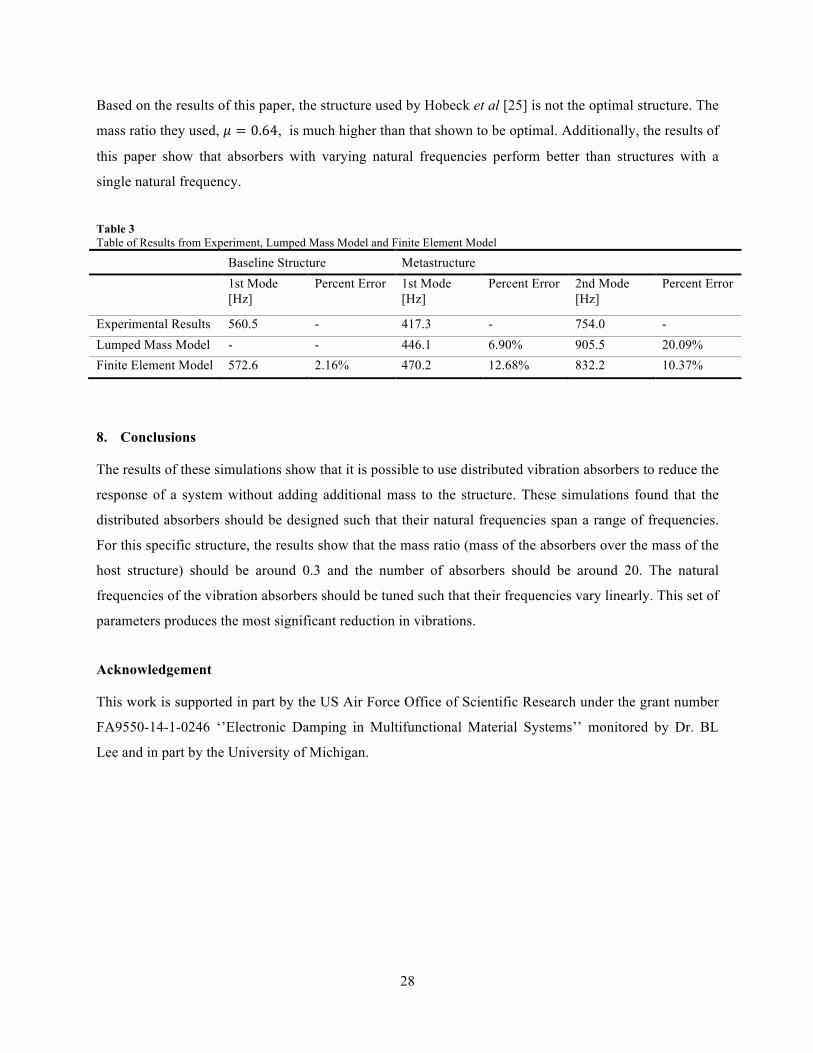
7.4. Comparison
Examining the results from the three different models, it is clear that each model captures the main effects
of metastructure, namely that absorbers tuned to the natural frequency of the baseline structure are able to
create a band gap where the baseline fundamental frequency occurs. The values of the various mode
shapes and the percent errors are summarized in Table 3. These results agree reasonably well. The finite
element model discrepancies can be accounted for due to the lack of precise knowledge of the Young’s
modulus of the printed material. Typically, these values are reported as a range of values. The lumped
mass model has considerably more error in the 2nd mode. This is likely due to the fact that the mass of the
experimental prototype is not lumped, but is relatively evenly distributed across the length of the bar.
Thus, treating it as lumped masses introduces some error. Most importantly, this shows that the lumped
mass model does exhibit realistic behavior that can also been seen in experimental studies.
300 400 500 600 700 800 900 1000 110010
-6
10-5
10-4
10-3
10-2
Frequency [Hz]
Mag
nitu
de: |
X 11/F
11|
MetastructureBaseline Structure
28
Based on the results of this paper, the structure used by Hobeck et al [25] is not the optimal structure. The
mass ratio they used, 𝜇 = 0.64, is much higher than that shown to be optimal. Additionally, the results of
this paper show that absorbers with varying natural frequencies perform better than structures with a
single natural frequency.
Table 3 Table of Results from Experiment, Lumped Mass Model and Finite Element Model Baseline Structure Metastructure 1st Mode
[Hz] Percent Error 1st Mode
[Hz] Percent Error 2nd Mode
[Hz] Percent Error
Experimental Results 560.5 - 417.3 - 754.0 - Lumped Mass Model - - 446.1 6.90% 905.5 20.09% Finite Element Model 572.6 2.16% 470.2 12.68% 832.2 10.37%
8. Conclusions
The results of these simulations show that it is possible to use distributed vibration absorbers to reduce the
response of a system without adding additional mass to the structure. These simulations found that the
distributed absorbers should be designed such that their natural frequencies span a range of frequencies.
For this specific structure, the results show that the mass ratio (mass of the absorbers over the mass of the
host structure) should be around 0.3 and the number of absorbers should be around 20. The natural
frequencies of the vibration absorbers should be tuned such that their frequencies vary linearly. This set of
parameters produces the most significant reduction in vibrations.
Acknowledgement
This work is supported in part by the US Air Force Office of Scientific Research under the grant number
FA9550-14-1-0246 ‘’Electronic Damping in Multifunctional Material Systems’’ monitored by Dr. BL
Lee and in part by the University of Michigan.
29
References
[1] S. Laszlo, E. Shamonina, A historical review, in: Waves in Metamaterials, 2009: pp. 315–324. [2] N. Engheta, R.W. Ziolkowski, Metamaterials: Physics and Engineering Explorations, IEEE, 2006.
[3] S.A. Cummer, J. Christensen, A. Alù, Controlling sound with acoustic metamaterials, Nat. Rev. Mater. 1 (2016) 16001. doi:10.1038/natrevmats.2016.1.
[4] R. Martínez-Sala, J. Sancho, J. V Sánchez, V. Gómez, J. Llinares, F. Meseguer, Sound attenuation by sculpture, Nature. 378 (1995) 241–241. doi:10.1038/378241a0.
[5] M.I. Hussein, M.J. Leamy, M. Ruzzene, Dynamics of Phononic Materials and Structures: Historical Origins, Recent Progress, and Future Outlook, Appl. Mech. Rev. 66 (2014) 040802. doi:10.1115/1.4026911.
[6] G.W. Milton, J.R. Willis, On modifications of Newton’s second law and linear continuum elastodynamics, Proc. R. Soc. A Math. Phys. Eng. Sci. 463 (2007) 855–880. doi:10.1098/rspa.2006.1795.
[7] Z. Liu, X. Zhang, Y. Mao, Y.Y. Zhu, Z. Yang, C.T. Chan, P. Sheng, Locally Resonant Sonic Materials, Science (80-. ). 289 (2000) 1734–1736. doi:10.1126/science.289.5485.1734.
[8] R. Zhu, X.N. Liu, G.K. Hu, F.G. Yuan, G.L. Huang, Microstructural designs of plate-type elastic metamaterial and their potential applications: a review., Int. J. Smart Nano Mater. 6 (2015) 14–40. doi:10.1080/19475411.2015.1025249.
[9] K.K. Saxena, R. Das, E.P. Calius, Three Decades of Auxetics Research − Materials with Negative Poisson’s Ratio: A Review, Adv. Eng. Mater. (2016) 1–24. doi:10.1002/adem.201600053.
[10] H. Sun, X. Du, P.F. Pai, Theory of Metamaterial Beams for Broadband Vibration Absorption, J. Intell. Mater. Syst. Struct. 21 (2010) 1085–1101. doi:10.1177/1045389X10375637.
[11] P.F. Pai, Metamaterial-based Broadband Elastic Wave Absorber, J. Intell. Mater. Syst. Struct. 21 (2010) 517–528. doi:10.1177/1045389X09359436.
[12] T. Igusa, K. Xu, Wide-Band Response of Multiple Subsystems with High Modal Density, in: 2nd Int. Conf. Stoch. Struct. Dyn., 1990: pp. 131–145.
[13] T. Igusa, K. Xu, Vibration Control Using Multiple Tuned Mass Dampers, J. Sound Vib. 175 (1994) 491–503. doi:10.1006/jsvi.1994.1341.
[14] H. Yamaguchi, N. Harnpornchai, Fundamental Characteristics of Multiple Tuned Mass Dampers for Supressing Harmonically Forced Oscillations, Earthq. Eng. Struct. Dyn. 22 (1993) 51–62.
[15] J.P. DenHartog, Mechanical Vibrations, McGraw-Hill, New York, 1947.
[16] J.Q. Sun, M.R. Jolly, M.A. Norris, Passive, Adaptive and Active Tuned Vibration Absorbers—A Survey, J. Vib. Acoust. 117 (1995) 234 – 242. doi:10.1115/1.2838668.
[17] N. Hoang, P. Warnitchai, Design of multiple tuned mass dampers by using a numerical optimizer, Earthq. Eng. Struct. Dyn. 34 (2005) 125–144. doi:10.1002/eqe.413.
[18] L. Zuo, S.A. Nayfeh, Minimax optimization of multi-degree-of-freedom tuned-mass dampers, J. Sound Vib. 272 (2004) 893–908. doi:10.1016/S0022-460X(03)00500-5.
[19] Y. Xiao, J. Wen, X. Wen, Longitudinal wave band gaps in metamaterial-based elastic rods containing multi-degree-of-freedom resonators, New J. Phys. 14 (2012). doi:10.1088/1367-2630/14/3/033042.
[20] Y. Shanshan, Z. Xiaoming, H. Gengkai, Experimental study on negative effective mass in a 1D mass-spring system, New J. Phys. 10 (2008) 0–11. doi:10.1088/1367-2630/10/4/043020.
30
[21] H.H. Huang, C.T. Sun, G.L. Huang, On the negative effective mass density in acoustic metamaterials, Int. J. Eng. Sci. 47 (2009) 610–617. doi:10.1016/j.ijengsci.2008.12.007.
[22] R. Zhu, G.L. Huang, H.H. Huang, C.T. Sun, Experimental and numerical study of guided wave propagation in a thin metamaterial plate, Phys. Lett. A. 375 (2011) 2863–2867. doi:10.1016/j.physleta.2011.06.006.
[23] G. Wang, X.S. Wen, J.H. Wen, Y.Z. Liu, Quasi-One-Dimensional Periodic Structure with Locally Resonant Band Gap, J. Appl. Mech. 73 (2006) 167–170. doi:10.1115/1.2061947.
[24] A. Qureshi, B. Li, K.T. Tan, Numerical investigation of band gaps in 3D printed cantilever-in- mass metamaterials, Sci. Rep. 6 (2016) 1–10. doi:10.1038/srep28314.
[25] J.D. Hobeck, C.M. V Laurant, D.J. Inman, 3D Printing of Metastructures for Passive Broadband Vibration Suppression, in: 20th Int. Conf. Compos. Mater., Copenhagen, 2015.
[26] E.D. Nobrega, F. Gautier, A. Pelat, J.M.C. Dos Santos, Vibration band gaps for elastic metamaterial rods using wave finite element method, Mech. Syst. Signal Process. 79 (2016) 192–202. doi:10.1016/j.ymssp.2016.02.059.
[27] O. Abdeljaber, O. Avci, D.J. Inman, Optimization of chiral lattice based metastructures for broadband vibration suppression using genetic algorithms, J. Sound Vib. 369 (2015) 50–62. doi:10.1016/j.jsv.2015.11.048.
[28] T. Yu, G.A. Lesieutre, Damping of Sandwich Panels via Acoustic Metamaterials, in: AIAA SciTech, 57th AIAA/ASCE/AHS/ASC Struct. Struct. Dyn. Mater. Conf., 2016.
[29] C. Claeys, E. Deckers, B. Pluymers, W. Desmet, A lightweight vibro-acoustic metamaterial demonstrator: Numerical and experimental investigation, Mech. Syst. Signal Process. 70-71 (2015) 853–880. doi:10.1016/j.ymssp.2015.08.029.
[30] A.M. Kabe, B.H. Sako, Issues with Proportional Damping, AIAA J. 54 (2016) 2864–2868. doi:10.2514/1.J054080.