Embed Size (px)
Citation preview
http://www.iaeme.com/IJCIET/index.
International Journal of Civil Engineering and Technology (IJCIET)Volume 9, Issue 11, November 201
Available online at http://www.iaeme.com/ijciet/issues.
ISSN Print: 0976-6308 and ISSN Online: 0976
©IAEME Publication
REHABILITATION PRIOR
ASSESSMENT ON
BASED MODELING
ISLANDS, KARIMUNJAWA
Oceanography Department, Faculty of Fisheries and Marine Science,
Diponegoro University
Center of Excellence for Science and Technology
Mitigation and Rehabilitation Studies (CoREM)
Alfi Satriadi, Agus Anugroho Dwi Suryoputro
Oceanograhy Department, Faculty of Fisheries and Marine Science,
ABSTRACT
This research applied
rehabilitation priority area of dead coral at
of GeoEye-1 satellite image was used to map the benthic habitat and distinguished the
dead coral area as rehabilitation target. The main factors that influence the dead
coral to become a rehabilitation priority area such as wave height, its strate
position for other benthic habitat and coastal protection, and preservation zona.
Certain data such as bathymetry, coastline, tide
develop the 2D numerical oceanography model and produce the four season of wave
height. This prototype research was conduct at Parang islets, Karimunjawa National
Park that inhabitant and have complex activities which impact to the coral reef
ecosystem, such as fishing, trap, tourism, aquaculture, harbor and sea lanes, and
coastal development. This rare and unique research was
survey. Significant accuracy for benthic habitat map has done using overall accuracy,
producer and user accuracy, and Kappa index methods. The position and spatial
distribution of rehabilitation pri
and can espouse the rehabilitation plan of the national park authority.
Keywords: Rehabilitation,
IJCIET/index.asp 2949 [email protected]
International Journal of Civil Engineering and Technology (IJCIET) 2018, pp. 2949–2961, Article ID: IJCIET_09_11_29
http://www.iaeme.com/ijciet/issues.asp?JType=IJCIET&VType=
6308 and ISSN Online: 0976-6316
Scopus Indexed
REHABILITATION PRIORITY AREA
ON DEATH CORAL USING
ASED MODELING APPROACH AT PARANG
ISLANDS, KARIMUNJAWA NATIONAL PARK,
INDONESIA
Muhammad Helmi
Oceanography Department, Faculty of Fisheries and Marine Science,
Diponegoro University Semarang 50275, Indonesia
for Science and Technology (PUI) - Center for Coastal Disaster
tion and Rehabilitation Studies (CoREM), Diponegoro University
Agus Anugroho Dwi Suryoputro, Jarot Marwoto, Heryoso Setiyono
Hariyadi
hy Department, Faculty of Fisheries and Marine Science,
Diponegoro University Indonesia
This research applied a cell-based modeling approach on GIS method to map the
rehabilitation priority area of dead coral at the coral reef ecosystem. High re
1 satellite image was used to map the benthic habitat and distinguished the
dead coral area as rehabilitation target. The main factors that influence the dead
coral to become a rehabilitation priority area such as wave height, its strate
position for other benthic habitat and coastal protection, and preservation zona.
data such as bathymetry, coastline, tide, and wind data ha
develop the 2D numerical oceanography model and produce the four season of wave
his prototype research was conduct at Parang islets, Karimunjawa National
Park that inhabitant and have complex activities which impact to the coral reef
ecosystem, such as fishing, trap, tourism, aquaculture, harbor and sea lanes, and
This rare and unique research was espoused
. Significant accuracy for benthic habitat map has done using overall accuracy,
producer and user accuracy, and Kappa index methods. The position and spatial
distribution of rehabilitation priority area of dead coral were successfully mapped
espouse the rehabilitation plan of the national park authority.
Rehabilitation, coral, remote sensing, GIS, and Karimunjawa
IJCIET_09_11_293
asp?JType=IJCIET&VType=9&IType=11
ITY AREA
USING CELL
T PARANG
NATIONAL PARK,
Oceanography Department, Faculty of Fisheries and Marine Science,
Center for Coastal Disaster
Diponegoro University, Indonesia
Heryoso Setiyono,
hy Department, Faculty of Fisheries and Marine Science,
based modeling approach on GIS method to map the
coral reef ecosystem. High resolution
1 satellite image was used to map the benthic habitat and distinguished the
dead coral area as rehabilitation target. The main factors that influence the dead
coral to become a rehabilitation priority area such as wave height, its strategic
position for other benthic habitat and coastal protection, and preservation zona.
and wind data has collected to
develop the 2D numerical oceanography model and produce the four season of wave
his prototype research was conduct at Parang islets, Karimunjawa National
Park that inhabitant and have complex activities which impact to the coral reef
ecosystem, such as fishing, trap, tourism, aquaculture, harbor and sea lanes, and
espoused by photo plot
. Significant accuracy for benthic habitat map has done using overall accuracy,
producer and user accuracy, and Kappa index methods. The position and spatial
ority area of dead coral were successfully mapped
arimunjawa.

Muhammad Helmi, Alfi Satriadi, Agus Anugroho Dwi Suryoputro, Jarot Marwoto, Heryoso Setiyono
and Hariyadi
http://www.iaeme.com/IJCIET/index.asp 2950 [email protected]
Cite this Article: Muhammad Helmi, Alfi Satriadi, Agus Anugroho Dwi Suryoputro,
Jarot Marwoto, Heryoso Setiyono and Hariyadi, Rehabilitation Priority Area
Assessment on Death Coral Using Cell Based Modeling Approach at Parang Islands,
Karimunjawa National Park, Indonesia, International Journal of Civil Engineering
and Technology (IJCIET) 9(11), 2018, pp. 2949–2961.
http://www.iaeme.com/IJCIET/issues.asp?JType=IJCIET&VType=9&IType=11
1. INTRODUCTION
Coral reefs can reduce wave energy and maintain coastal stability from erosion threats. This
ability also plays an important role in protecting benthic habitats and other aquatic ecosystems
that live behind, such as sea-grass, seaweed, and mangroves. Coral reefs support
continuity aquatic life, such as spawning, nursery ground, and feeding ground areas. Its live
support almost all basic human needs, such as the areas of livelihoods, food, medicines,
aquaculture, tourism, and environmental services. Coral reefs are presently under high
pressure and threat. About 75% coral reefs in the world and 85% in the coral reef triangle
areas have been treat [1] by several of natural and anthropogenic factors [2; 3; 4; 5]. Its
conditions are also not preferable in Indonesia, the threat reaches 95% [1]. There are 60
million people in Indonesia live in the coastal area and depends on the coral reef and brings a
threat to sustaining coral reefs in this region [1].
The purpose of this research is 1) to learn the widespread and spatial distribution of Dead
Coral with Algae (DCA) compared to current live coral; 2) Mapping where the location and
spatial pattern of priority rehabilitation areas of DCA; and 3) To assess whether this cell-
based spatial modeling method can be used and to find out DCA rehabilitation priority area.
This method used in Parang Islets, Karimunjawa Islands, Central Java. Parang Islets consists
of Parang and Kumbang Islands, which unite by clear shallow water with 48.9 ha of coral reef
ecosystems. These populated islands are the western part of Karimunjawa Islands National
Park. The anthropogenic activities in those shallow waters were very complex and have
affected on coral reef ecosystem damage, such as fishing, ecotourism, harbor, and sea-lanes,
aquaculture, services, etc. In this conservation area, there is a common utilization zone and a
preservation zone. In some locations found eroded sandy beaches and coral damage due to
waves that need immediately handled. Scientific data and publications of coral reef conditions
on these islands are rarely found. Parang Islets is an ideal site as a study area, prototypes
for this modeling method implementation.
The damage and threats to coral reefs need to be offset by an intensive rehabilitation
program and implemented in a large area [2; 6]. The area of coral reef damage is significantly
wide, while less rehabilitation capability. This is what causes the rehabilitation program to
require comprehensive and proper planning to meet a high level of effectiveness and success.
This spatial model integrates input data, which were produced by comprehensive mapping
methods, such as remote sensing for DCA mapping, 2D wave numerical model, cell-based
modeling to generate a maximum wave map and participatory mapping for preservation zone
mapping.
This mapping focuses on DCA instead of living corals. This cell-based spatial modeling
application has been widely used for rehabilitation planning on land but rarely applied in
seawater. This research expected to contribute the coral reef researchers, planners, and
managers in the use of approaches and methods to determine DCA rehabilitation priority
areas.

Rehabilitation Priority Area Assessment on Death Coral Using Cell Based Modeling Approach at
Parang Islands, Karimunjawa National Park, Indonesia
http://www.iaeme.com/IJCIET/index.asp 2951 [email protected]
2. MATERIALS AND METHODS
The materials and methods section contains sufficient detail as describe below.
2.1. Study area
Research area was located at the Parang Islets that consist of Parang and Kumbang Islands.
The islets are in the western part of Karimunjawa Islands National Park, Central Java,
Indonesia as seen in Figure 1.
Figure 1 Study area
2.2. Pre-processing of GeoEye-1 Satelite Image
A satellite image that used in this research was GeoEye-1, acquisition date July 16th
, 2011
(GeoEye Inc, USA). The technical specification of the image was 4 multispectral band, spatial
resolution 1.84 m, 11 bits, 4500 columns and 6394 rows of pixels on the Geotiff format. Pre-
processing conduct radiometric and geometric correction of the GeoEye-1 satellite image.
Radiometric correction is needed to remove atmospheric scattering, absorption and to
minimize the light attenuation interference by the atmospheric constituents [7; 8]. A
radiometric correction was done using Dark Object Subtraction (DOS) method to correct or
remove the additive haze component or path radian on each band of the GeoEye-1 image. It
performs the optically of deep water pixels as a dark target. A geometric correction was
performed using orthorectification method based on input data including GeoEye-1 RPC
(rational polynomial coefficient) sensor model, 10m resolution of DEM (Digital Elevation
Model) and GCP (Ground Control Points) from GPS Survey. DEM data was created from
spot height and the contour line of topographic map scale 1:25000 published by BIG
(Indonesia Geospatial Information Agency) on 2012. Geometry reference was developed from
8 GCPs that measure using Garmin76 GPS Map using Datum WGS84 and projection
SUTM49.
Muhammad Helmi, Alfi Satriadi, Agus Anugroho Dwi Suryoputro, Jarot Marwoto, Heryoso Setiyono
and Hariyadi
http://www.iaeme.com/IJCIET/index.asp 2952 [email protected]
2.3. Mapping of death coral with algae
Specular reflection in the form of sunglint on the visible band was corrected using infrared
using sunglint correction [9]. Water column impact [7; 9; 10; 11; 12] on each image band was
normalized with apply the Depth Invariant Index [7; 12]. That correction was done to prepare
the multispectral input band for benthic habitat classification. Unsupervised classification type
has been select and done to produce 25 classes that represent tentative benthic habitat spatial
distribution. Those classes reduced to become eight classes of benthic habitat based on field
survey data, i.e. live coral, DCA, sea-grass, rubble, sand, an associate of DCA and rubble, an
associate of rubble and sea-grass, and associate of sand and rubble. DCA class selected and
extracted as a separate layer from the benthic habitat map. To assess the accuracy of DCA has
conducted a field survey and accuracy assessment, as bellow;
2.3.1. Field Survey
Field survey conducted at 98 sampling sites using photo plot technique on 2015 and 2016
using an underwater camera. Spatial distribution of photo plots is in Figure 1. Purposive
sampling site selected based on variation classes of benthic habitat map. Benthic habitat types
at the field recorded and its position marked by using Garmin76 GPS Map.
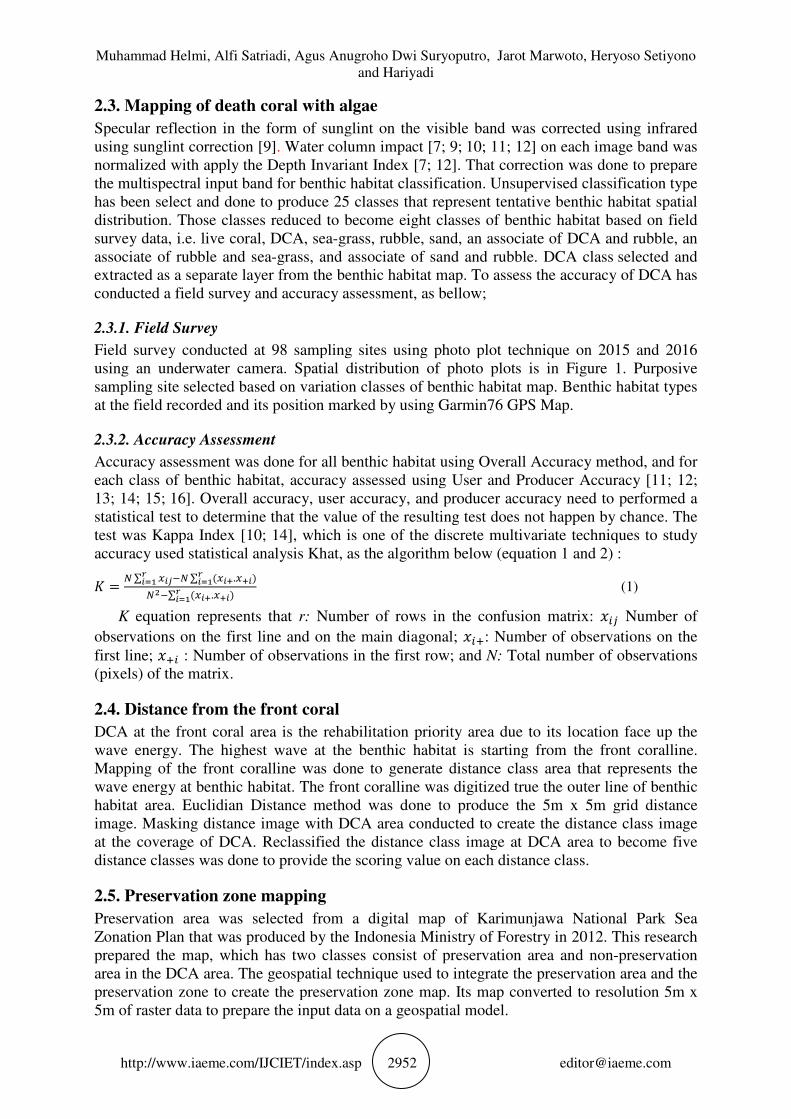
2.3.2. Accuracy Assessment
Accuracy assessment was done for all benthic habitat using Overall Accuracy method, and for
each class of benthic habitat, accuracy assessed using User and Producer Accuracy [11; 12;
13; 14; 15; 16]. Overall accuracy, user accuracy, and producer accuracy need to performed a
statistical test to determine that the value of the resulting test does not happen by chance. The
test was Kappa Index [10; 14], which is one of the discrete multivariate techniques to study
accuracy used statistical analysis Khat, as the algorithm below (equation 1 and 2) :
� = �∑ �����∑ (��.��) ���
������∑ (��.��)
��� (1)
K equation represents that r: Number of rows in the confusion matrix: ��� Number of
observations on the first line and on the main diagonal; ���: Number of observations on the
first line; ��� : Number of observations in the first row; and N: Total number of observations
(pixels) of the matrix.
2.4. Distance from the front coral
DCA at the front coral area is the rehabilitation priority area due to its location face up the
wave energy. The highest wave at the benthic habitat is starting from the front coralline.
Mapping of the front coralline was done to generate distance class area that represents the
wave energy at benthic habitat. The front coralline was digitized true the outer line of benthic
habitat area. Euclidian Distance method was done to produce the 5m x 5m grid distance
image. Masking distance image with DCA area conducted to create the distance class image
at the coverage of DCA. Reclassified the distance class image at DCA area to become five
distance classes was done to provide the scoring value on each distance class.
2.5. Preservation zone mapping
Preservation area was selected from a digital map of Karimunjawa National Park Sea
Zonation Plan that was produced by the Indonesia Ministry of Forestry in 2012. This research
prepared the map, which has two classes consist of preservation area and non-preservation
area in the DCA area. The geospatial technique used to integrate the preservation area and the
preservation zone to create the preservation zone map. Its map converted to resolution 5m x
5m of raster data to prepare the input data on a geospatial model.
Rehabilitation Priority Area Assessment on Death Coral Using Cell Based Modeling Approach at
Parang Islands, Karimunjawa National Park, Indonesia
http://www.iaeme.com/IJCIET/index.asp 2953 [email protected]
2.6. Maximum wave height mapping
Indonesian region is known as “the Maritime Continent” [17] located on the confluence of
Indo-Australian Plate, Pacific Plate, and Eurasian Plate. Because of its unique position, the
Indonesian maritime continent experiences seasonal variation influenced by monsoon wind.
There are four monsoon seasons every year, i.e. southeast (SE) monsoon, northwest (NW)
monsoon, and 2 transition seasons. The SE monsoon (NW monsoon) is associated with
easterlies from Australia (westerlies from the Eurasian continent) that usually occur in Jun,
July, and August (December, January, February) [18]. Since the Java Sea becomes the major
pathways for monsoon wind, the characteristic of ocean parameters in Karimunjawa Islands is
strongly influenced by monsoon wind. Therefore, the wave variation in Karimunjawa Islands
is separated by 4 different characteristics influenced by season.
Maximum of wave height is an image that represents a maximum value of the wave height
on a four-season composite of wave height. Maximum wave height image was generated
using 5m x 5m cell-based modeling on GIS that integrated southeast (SE) monsoon,
northwest (NW) monsoon, and two transition seasons of wave height. Wave height of each
season prepared in the 5m x 5m raster data format based on the spline type interpolation
method from point data of wave height. The wave height was developed from a 2D
oceanographic numerical model that used certain data input, such as coastline, bathymetry
from BIG, 2016, daily speed and wind direction (European Centre for Medium-Range
Weather Forecasts, 2014 - 2015) and tide prediction data per 25 minutes for 1-year data on
2016.
Wave modeling needs wind data that was corrected to prepare it condition from wind in
the land to become wind in the sea surface. Correction of the wind data based on [19] as
below:
Height correction; If the measured data at the measurement station not located at 10 m
altitude, it needs to be converted to a height of 10 m through the equation 3 and 4 :
�(��) = �(�) ���� �� ��
(2)
with z less than 20 m.
Stability correction; This correction is done because of the temperature difference between
air and seawater (equation 5).
U =RT U(10) (5)
Where : RT = 1,1 and U in units m/sec.
Location effect correction; Mostly wind measurement done on the mainland, therefore it is
necessary to make correction of location effect. The relationship between the wind above the
sea and the wind above the nearest land is given by equation 6.
Uw = UL x RL (6)
- Shear stress, Wind speed is converted to a wind stress factor (UA) with the equation 7.
UA = 0.71 U1,23
(m/sec) (7)
The formation of waves is not only generated from the same direction as the wind
direction, but also in various angles to the wind direction. The fetch calculation method of
these angles then determined by the magnitude, and the effective fetch gave by equation 8.

Muhammad Helmi, Alfi Satriadi, Agus Anugroho Dwi Suryoputro, Jarot Marwoto, Heryoso Setiyono
and Hariyadi
http://www.iaeme.com/IJCIET/index.asp 2954 [email protected]
α
α
cos
cos
Σ
Σ=
ieff
XF
(8)
Determination of fetch withdrawal direction is based on wind coming directly at the study
area. From UA data, the length of fetch and its duration through the above equation can be
known high (H) and wave period (T) [19], in equation 9 and 10.
2
1
2-10616.1 FUH A×= (9)
3
1
1- )(10 × 6.238 = FUT A (10)
Wave height data was modeled for 1 year to represent four monsoon seasons. The
composite of height wave was cropped base on DCA area, to represent the maximum wave
height on the DCA area and classified to become 5 class using equal interval classification
type.
The three geospatial data that prepared integrated to produce Rehabilitation Priority Index
(RPI) map using a geospatial model with represent in Table 1.
Table 1 Rpi map geospatial model criteria.
Variables Class and score Weighted
Distance from the front Coral (Dfc) (5), (4) (3) (2) (1) 0.2
Preservation Zona (Pz) Preservation zone (5) and non
preservation zone (1)
0.5
Maximum of Wave Height (Mwh) (5), (4) (3) (2) (1) 0.3
The equation of the cell based modeling to develop the Rehabilitation Priority Index Map
(RPI), as folow (equation 11) :
Rpi = (0.2 x Dfc) + (0.5 x Pz) + (0.3 x Mwh) (11)
Five class of Rpi map has been developed using equal interval method.
2.7. Rehabilitation priority area mapping
Rehabilitation priority area was developed using 5m x 5m cell-based modeling with the task
data processing as follow (Figure 2);
Figure 2 Data processing flow diagram

Rehabilitation Priority Area Assessment on Death Coral Using Cell Based Modeling Approach at
Parang Islands, Karimunjawa National Park, Indonesia
http://www.iaeme.com/IJCIET/index.asp 2955 [email protected]
3. RESULTS AND DISCUSSION
3.1. Satellite Image Processing
Ortho-rectification of the GeoEye-1 satellite image (spatial resolution 0.5m x 0.5m) produce
RMSE 0.87, that means it and the benthic habitat map which produces have field horizontal
accuracy 0.44 m. Figure1 shows the orthorectified of the GeoEye-1 image in the true color
composite type. Sunglint correction and water column correction result based on bottom
correction method and Lyzenga transform is shown in Figure 3.
Image 3b show the Sun Glind correction has been removed the glint on the image that was
impacted by the sunshine on the sea surface water. The bright pixels has been reduced and
produce a seamless image for visual and digital image processing purpose. Image 3c has a
water depth impact that represents the white color or bright tone for the pixel of sand in the
shallow water area and darker blue in the deeper area. Area of the sand pixels are good and
easily view to understand the impact of water column depth impact on the shallow water
compared to the other benthic habitat such as coral reef, sea-grass or macro alga pixels area.
Image 3d is the result of the Bottom Invariant Index Correction and Lyzenga Transform
that significantly reduce the depth impact of the water column. All sand pixels in the different
depth have an almost similar value that represents the similar color and tone on a true color
composite image. The Sun Glint Correction and both methods of Bottom Invariant Index
Correction and Lyzenga Transform be done to have a better benthic habitat map based on a
digital classification image.
Figure 3: True color composite image before (image a) and after Sunglint Correction (image b), and
the image before (image c) and after Bottom Invariant Index Correction and Lyzenga Transform
(image d).
3.2. Benthic Habitat
Equations provided in a text format, rather than as an image. The unsupervised classification
was used in this study for interpretation key of benthic habitat, as there is no study previously.

Muhammad Helmi, Alfi Satriadi, Agus Anugroho Dwi Suryoputro, Jarot Marwoto, Heryoso Setiyono
and Hariyadi
http://www.iaeme.com/IJCIET/index.asp 2956 [email protected]
Figure 4 on the left map is the benthic habitat map that was reclassified from 25 classes that
produce by supervised classification. The 8 classes of benthic habitat were chosen based on
98 photo plots survey of benthic type. Spatial distribution of benthic type photo plot on the
study area is shown in Figure 1.
Mapping of DCA and live corals is the main objective of high-resolution satellite data
processing not the number of benthic classification. Unsupervised has a simple processing
task to differentiate a complex shallow marine habitat based on remote sensing data. Figure 3
on the right map shows the DCA area in Parang Islands. DCA patches are distributed around
waters of the islets especially in the Parang islet.
Figure 4 Benthic habitat map and DCA spatial distribution.
The accuracy test of benthic habitat maps has been done on 98 survey sites using photo
plots, as shown in Figure 1. The accuracy of this map is categorized as good, with Overall
Accuracy = 83.7% or slightly higher than tolerable accuracy (80%). This accuracy indicates
that the overall mapping results are in accordance with the conditions in the field. The
following contingency matrix indicates the compatibility of benthic habitat on the map and
the field.
Table 2 indicates the number of stations that are correct (corresponding between the map
and the field) are more than inappropriate. The number on the diagonal indicates the correct
number of stations. The matrix shows 14 stations of DCA in accordance with the field, while
one station is not DCA, but live coral in the field. Detail condition of all classes is described
on the contingency matrix in Table 2.
Table 2 shows the results of statistical analysis using the Confusion Matrix Method. This
method generates User Accuracy and Producer Accuracy on each class by considering
Omission and Commision Error. Producer accuracy is more reliable because the calculation is
associated with the correct number of pixels x. In contrast, the calculation of User Accuracy is
associated with the number of pixels x interpretation results that are not necessarily true. The
k value is between 0-1. The value of k in the results of this study is not zero, indicating that
the accuracy value of this habitat benthic classification does not occur by chance

Rehabilitation Priority Area Assessment on Death Coral Using Cell Based Modeling Approach at
Parang Islands, Karimunjawa National Park, Indonesia
http://www.iaeme.com/IJCIET/index.asp 2957 [email protected]
Table 2 Contingency matrix of accuracy assessment
*(1) Live Coral, (2) DCA, (3) Sea-grass, (4) Rubble, (5) Sand,(6) Associate of rubble and
sea-grass, (7) Associate of sand and rubble, (8) Associate of rubble and DCA.
This k value is not negative which indicates that the resulting classification is good. This
habitat benthic mapping has high accuracy indicated by the value of k = 0.81 which is close to
the value of 1. Based on the analysis of all accuracy test, the results showed that multispectral
GeoEye-1 satellite image can be used for habitat benthic mapping with significant accuracy.
Figure 4 shows the extent of benthic habitat (total classes) reaching 814.2 ha. The benthic
habitat area in shallow waters is wider than the land area of Parang (452.2 ha) and the
Kumbang Island (9.4 ha). The number of benthic habitat types found can be an indicator that
the region has high biodiversity. The area of live coral reefs found was 202 ha. In this region,
there is coral damage indicated by the presence of DCA. The DCA area was 204 ha (50%)
among coral reef ecosystem which shows a high degree of damage. Live corals were found
scattered near the front coral, thus contributing to the reduction of waves. However, the width
is narrow and relatively in a deeper position. Thus, the waves are reduced. DCA is commonly
found behind or in the inner part of living coral. The wave damp function increase when the
reef is rehabilitated.
3.3. Maximum Wave High in the DCA Area
2D numerical oceanographic modeling produces four-wave height maps, as in Figure 5. The
map shows relatively high waves (0.45 - 0.67m) occur during the west season (NW) with the
direction of incoming waves from the west. High waves in west season are influenced by high
winds blowing from the west due to the influence of NW monsoon. For local people, this
western season is very popular with extreme sea conditions compared to other seasons, which
is characterized by high waves and strong ocean currents. This causes high waves to occur in
shallow water areas on the west and north sides of these small islands. On the western side of
the central part of the archipelago, high waves occur in areas close to the coral front, because
the waters are sheltered by corals that form the barrier reef in front of it. In the southern
waters, the wave height at this NW monsoon can be induced by the relatively broad barrier
reef and the Kumbang island as a barrier.
Benthic Habitat Map Producer
accuracy
User
accuracy
Overall
Accuracy
Kappa
index (k)
Field
Data
BH Class 1 2 3 4 5 6 7 8 Total
1 16 1 1 18 94.1 88.9
83.7 0.81
2 1 14 15 87.5 93.3
3 9 1 10 81.8 90.0
4 11 1 1 13 78.6 84.6
5 1 1 10 12 83.3 83.3
6 1 8 1 1 11 88.9 72.7
7 1 1 9 1 12 75.0 75.0
8 1 1 5 7 71.4 71.4
Total 17 16 11 14 12 9 12 7 98

Muhammad Helmi, Alfi Satriadi, Agus Anugroho Dwi Suryoputro, Jarot Marwoto, Heryoso Setiyono
and Hariyadi
http://www.iaeme.com/IJCIET/index.asp 2958 [email protected]
Figure 5: Four seasons of wave height and maximum wave height maps at coral reef ecosystems at
Parang Islands, Karimunjawa.
The high wave composite maps in the DCA area (Figure 5) clearly represent the
maximum wave conditions in the NW monsoon. This composite map is built from raster data
(5m x 5m spatial resolution) represented by the cell with the highest wave value of existing
four seasons.
3.4. Rehabilitation Priority Index Map
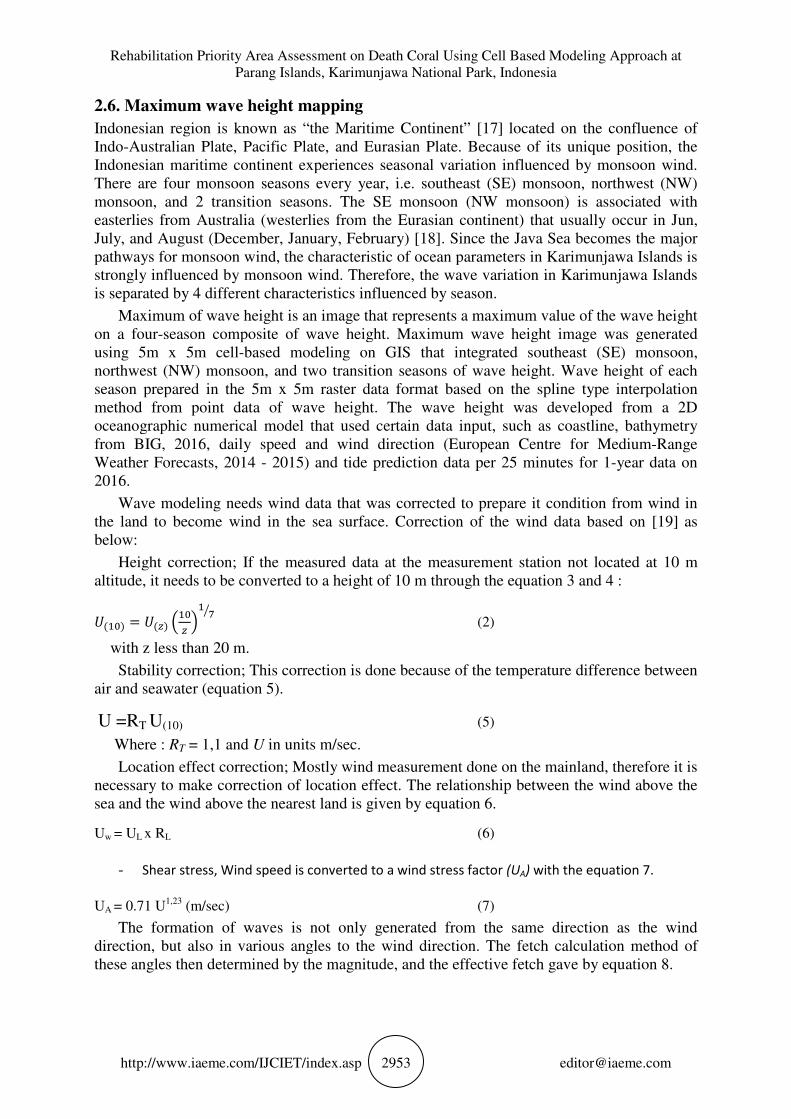
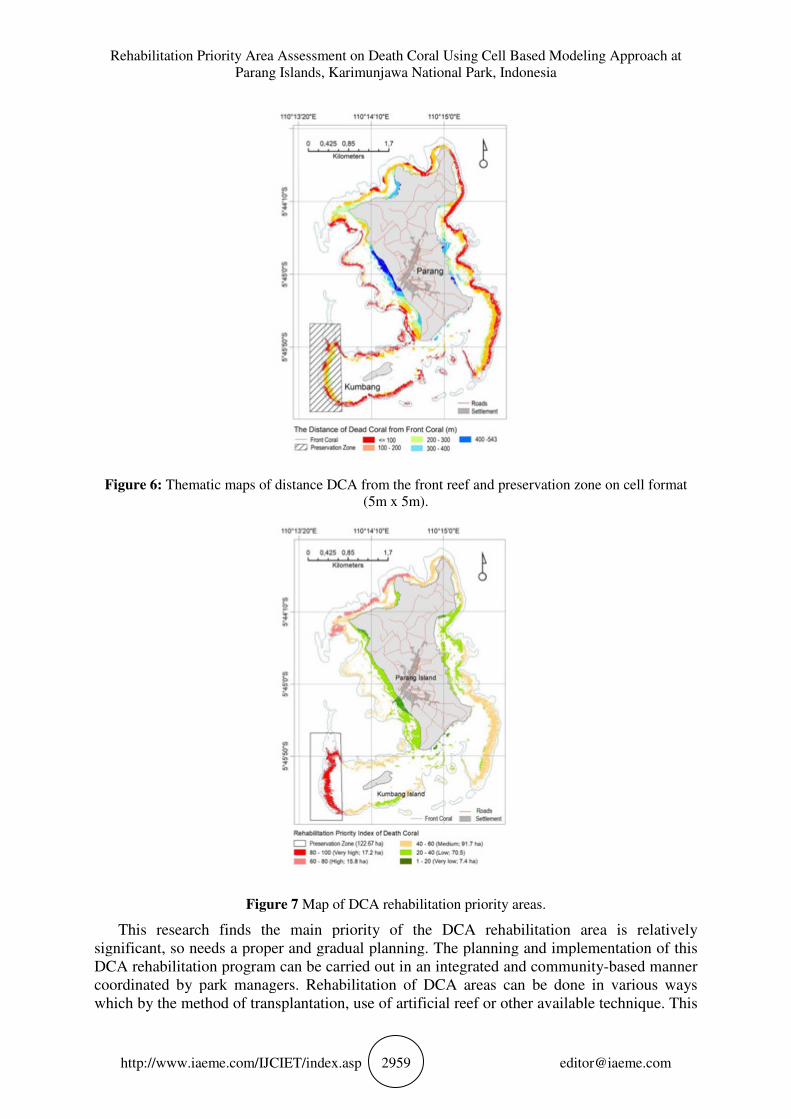
The following cell-based spatial data (5m x 5m) are used as inputs in modeling, i.e. DCA
area, maximum wave high, distance from front coral and preservation area (Figure 6). Figure
7 shows the high priority areas of rehabilitation (the priority index score of 80 - 100) was
found in the southwestern part of the waters of Parang Island and in the western part of
Kumbang Island (Figure 7). This priority area has an area of 17.2 ha and located in the
preservation zone. This rehabilitation area has objectives for protection and conservation. The
high priority DCA rehabilitation areas (the priority index score of 60 - 80) with an area of
15.8 ha spread across the northwest of Parang Island. These two priority areas of DCA are
consistent with the purpose of returning coral reef function as a protective coast and benthic
habitat behind it from strong sea wave drive in during the west season. DCAs in the eastern
region and some bays are not a priority area of rehabilitation since wave energy is relatively
low and the area is not a preservation area. The following is a graph of the area composition
of each class of rehabilitation priority areas in DCA.
Rehabilitation Priority Area Assessment on Death Coral Using Cell Based Modeling Approach at
Parang Islands, Karimunjawa National Park, Indonesia
http://www.iaeme.com/IJCIET/index.asp 2959 [email protected]
Figure 6: Thematic maps of distance DCA from the front reef and preservation zone on cell format
(5m x 5m).
Figure 7 Map of DCA rehabilitation priority areas.
This research finds the main priority of the DCA rehabilitation area is relatively
significant, so needs a proper and gradual planning. The planning and implementation of this
DCA rehabilitation program can be carried out in an integrated and community-based manner
coordinated by park managers. Rehabilitation of DCA areas can be done in various ways
which by the method of transplantation, use of artificial reef or other available technique. This

Muhammad Helmi, Alfi Satriadi, Agus Anugroho Dwi Suryoputro, Jarot Marwoto, Heryoso Setiyono
and Hariyadi
http://www.iaeme.com/IJCIET/index.asp 2960 [email protected]
research demonstrates that the GIS approach, especially cell-based modeling can be used for
planning the priority areas of DCA rehabilitation objectively to support the management of
coral reef conservation areas.
4. CONCLUSIONS
The live coral in the study area is 202.44 ha. This research found a high relative of DCA
(204.07 ha), that shows a high degree of damage. DCA scattered around Parang Island and
Kumbang area. In southwest and northwest of Parang Island, there are high priority areas for
DCA rehabilitation, with the area of 17.2 ha and 15.8 ha respectively. Mapping by using cell-
based modeling is effective for the area of DCA rehabilitation. This priority area for DCA
rehabilitation is an important input for conservation planners and managers in Karimunjawa
National Park.
ACKNOWLEDGMENTS
Thank Research Institutions and Community Service (LPPM) of Diponegoro University for
the funding (RPP scheme No: 275-037/UN7.5.1/PG/2017) of this research. We also thank PT.
Waindo SpecTerra for the support of using ArcGIS 10.3, and ERDAS - ER Mapper software.
REFERENCES
[1] Burke, M. Spalding; K. Reytar; dan A. Perry.2012. “Menengok kembali terumbu karang
yang terancam di Segitiga Terumbu Karang”. World Resources Institute, Scientific
Report: pp 11-66.
[2] Praveena, S. S. Siraj, Aris, and A. Zaharin. 2012. “Coral reefs studies and threats in
Malaysia: a mini review”. Reviews in Environmental Science and Biotechnology. vol. 11,
no 1, pp. 27–39, DOI:10.1007/s11157-011-9261-8.
[3] Arai, 2015. “Diversity and conservation of coral reef fishes in the Malaysian South China
Sea”. Reviews in Fish Biology and Fisheries. vol 25, no 1, pp. 85–101, DOI:
10.1007/s11160-014-9371-9.
[4] Michael, G. Silvan, L. T. Bach, M. Suzanne, and C. Joachim. 2016. “Interactive effects of
three pervasive marine stressors in a post-disturbance coral reef”, Coral Reefs, no 4, vol.
35, no. 4, pp. 1281–1293, DOI: 10.1007/s00338-016-1489-x.
[5] Selkoe, B. S. Halpern, C. M. Ebert, E. C. Franklin, E. R. Selig, K. S. Casey, J. Bruno, and
R. J. Toonen. 2009. “A map of human impacts to a "Pristine" coral reef ecosystem, The
Papahānaumokuākea marine national monument”, Coral Reefs, no 3, vol 28 pp. 635-650.
DOI: 10.1007/s00338-009-0490-z.
[6] Marques, T.B. Ramos, S. Caeiro, and M. H. Costa. 2013. “Adaptive-participative
sustainability indicators in marine protected areas: Design and communication”, Ocean &
Coastal Management. vol. 72, pp. 36 - 45, DOI: 10.1016/j.ocecoaman.2011.07.007.
[7] Kabiri, B. Pradhan, 2013. “A novel approach to estimate diffuse attenuation coefficients
for QuickBird satellite images: A case study at Kish Island, the Persian Gulf”. Indian
Society of Remote Sensing. vol. 41, pp. 797-806, DOI: 10.1007/s12524-013-0293-0.
[8] Phinn, C. M. Roelfsema, and P. J. Mumby. 2011. “International journal of remote
analysis for mapping geomorphic and ecological zones on coral reefs”, International
Journal of Remote Sensing, pp. 37–41.
[9] Wicaksono, and M. Hafizt. 2013. “Mapping seagrass from space: Addressing the
complexity of seagrass LAI mapping”, European Journal of Remote Sensing, no 1 vol. 46,
pp. 18-39.

Rehabilitation Priority Area Assessment on Death Coral Using Cell Based Modeling Approach at
Parang Islands, Karimunjawa National Park, Indonesia
http://www.iaeme.com/IJCIET/index.asp 2961 [email protected]
[10] Zhang. 2015. “Applying data fusion techniques for benthic habitat mapping and
monitoring in a coral reef ecosystem”, ISPRS Journal of Photogrammetry and Remote
Sensing, vol. 104, pp. 213–223, DOI: 10.1016/j.isprsjprs.2014.06.005.
[11] Siregar, S. Wouthuyzen, A. Sunuddin, A. Anggoro, and A. Mustika. 2013. “Shallow water
habitat mapping and reef fish stock estimation using high resolution satellite data”, Jurnal
Ilmu dan Teknologi Kelautan Tropis, vol. 5, no. 2, pp. 453–464.
[12] Dadhich, K. Nadaoka, T. Yamamoto, and H. Kayanne. 2013. “Detecting coral bleaching
using high-resolution satellite data analysis and 2-dimensional thermal model simulation
in the Ishigaki fringing reef, Japan”. no 2, vol. 31, pp. 425–439, DOI: 10.1007/s00338-
011-0860-1.
[13] Kabiri, H. Rezai, and M. Moradi, and F. Pourjomeh. 2014. “Coral reefs mapping using
parasailing aerial photography-feasibility study: Kish Island, Persian Gulf”, pp. 691–699,
DOI: 10.1007/s11852-014-0345-9.
[14] Pu, and S. Landry. 2012. “A comparative analysis of high spatial resolution IKONOS and
WorldView-2 imagery for mapping urban tree species”, Remote Sensing of Environment,
vol. 124, pp. 516–533, DOI: 10.1016/j.rse.2012.06.011.
[15] Diesing, P. Mitchell, and D. Stephens. 2016. “Image-based seabed classification: what can
we learn from terrestrial remote sensing?”. Review Article, ICES Journal of Marine
Science: Journal du Conseil, no 10, vol 73, pp. 2425–2441.
[16] Karnieli, and A. Caras. 2013. “Ground-level spectroscopy analyses and classification of
coral reefs using a hyperspectral camera”. Coral Reefs, vol 32, pp. 825–834, DOI:
10.1007/s00338-013-1033-1.
[17] Qu, Y. Du, J. Strachan, G. Meyers, and J. Sling. 2005. “Sea surface temperature and its
variability in the Indonesian region” Oceanography Journal, vol. 18, no. 4.
[18] Setiawan, R.Y. and A. Habibi. 2016. “SST Cooling in the Indonesian Seas”, Indonesia
Journal of Marine Science, vol. 15 (1) 42 – 46.
[19] CERC (The Coastal Engineering Research Center). 1984. “Shore protection manual”. US
Army Corps of Engineers. Washington: pp. 143.