Embed Size (px)
Citation preview
Regulatory Proposal 1 July 2019 to 30 June 2024
16 March 2018

2
Contents
1. About this regulatory proposal 15
2. Next steps and stakeholders’ feedback 17
3. About Power and Water 18
4. Regulatory base line 25
5. What Power and Water has delivered 33
6. What stakeholders are saying 39
7. What Power and Water will deliver 47
8. Response to F&A paper 50
9. Demand forecasts 55
10. Capex forecasts 61
11. Opex forecasts 77
12. Regulatory Asset Base and Depreciation 91
13. Rate of return, inflation and debt and equity raising costs 102
14. Estimated cost of corporate income tax 110
15. Incentive schemes 115
16. Pass through events 120
17. Annual revenue requirements, X-factors for SCS 126
18. Metering services 130
19. Fee-based and Quoted ACS 134
20. Public lighting 140
21. Indicative prices and bill impacts 141
22. Negotiating Framework 145
23. Confidentiality 149
24. Certifications 150
25. Abbreviations 151
3 Regulatory Proposal Executive Summary
Executive Summary
Embracing the future
Power and Water Corporation (Power and Water) provides electricity distribution, gas supply, water and sewerage services to customers across the Northern Territory (NT), as well as electricity generation and retail services to some minor centres. We are proud to be owned by the NT Government, and therefore the people of the NT.
This is the first time we have submitted a regulatory proposal, tariff structure statement (TSS) and regulatory information notice (RIN) to the Australian Energy Regulator (AER), which, on 1 July 20151, assumed responsibility from the NT’s Utilities Commission (UC) for the economic regulation of our electricity distribution services. We welcome this transition to the national economic regulatory framework and its challenges.
We are committed to delivering the electricity distribution services our customers need and value as efficiently as possible. Consistent with this, our organisational vision is:
…to be a best practice, commercially focused and customer centric multi-utility respected by the community for its contribution to the Northern Territory economy and its pursuit of the long-term interests of consumers.
Over the last three years, we have experienced a period of unprecedented change.
On 1 July 2014, we were structurally separated from the newly created government-owned corporations Jacana Energy (Jacana) and Territory Generation (TGen). We provided transitional services to them to support their establishment and early years of operations but now only provide retail billing functions for Jacana (for its mass market customers), which we expect to transition to them in full during 2018.
Between 2017 and 2021, we are implementing a major Business Transformation Program to become a more flexible, responsive, customer-centric, professional and sustainable organisation, consistent with our vision. Within the current regulatory period we have met the challenge of a Ministerial Direction, which reduced our revenue by 17.5 per cent, or $173.5 million (Nominal), over the current regulatory period below the UC’s Final Determination.
Concurrently, the legislative and regulatory framework under which we operate is changing extensively. The NT Government is committed to greater harmonisation between the framework for the NT’s electricity networks and other National Electricity Market (NEM) jurisdictions. This includes the progressive adoption (between 1 July 2016 and 1 July 2019) of the National 1 Refer Electricity Networks (Third Party Access) Act

4 Regulatory Proposal Executive Summary
Electricity Law (NT NEL) and National Electricity (NT) Rules (NT NER). Mature, well-established distribution network service providers (DNSPs) in other jurisdictions have operated under the national framework for many years and have been able to respond gradually as it has evolved. However, the current framework is new for us and we are on a steep-learning curve as we begin to apply it. As part of this, we are developing a new working relationship with the AER. One implication of this change is that the AER requires new information from us to meet its approach to regulation. This is information we have not necessarily systematically captured and maintained in the past.
We are therefore concurrently implementing several significant change and reform programs. Although we are embracing this change, being a relatively small business, it is a big challenge for us to deliver it smoothly.
We are a unique business
All electricity DNSPs are unique. We believe that our differences are starker than most typical DNSPs operating in the NEM. This means we are not readily comparable with other DNSPs.
We service, by a considerable margin, the smallest customer base in the NEM, but our service area is extremely diverse. We provide our electricity distribution services to approximately 85,000 customers and an estimated 244,300 people, across an area of 1.3 million square kilometres. About 75 per cent of our customers are in the Darwin region and the remainder are in the Alice Springs, Katherine and Tennant Creek regions.
We manage and operate three small, geographically-isolated and diverse electricity distribution networks2 in challenging conditions:
• Our geographic remoteness from other Australian population centres, and competition from the resource sector, limits markets for the competitive procurement of goods and services and increases our labour and contractor costs compared to most other DNSPs in the NEM.
• The extreme heat that occurs from late September through into early March, has a significant impact on field crew productivity, as demonstrated through the ongoing research that we are working on with Thermal Hyperformance.3
• Our customers use energy fairly consistently on most days, but our systems have long afternoon peaks and are increasingly showing a second evening peak.
2 We operate electricity distribution and transmission assets. The NT Government has deemed that transmission
assets will be treated as distribution assets for the purposes of economic regulation – see section 9 of the National Electricity (Northern Territory) (National Uniform Legislation) Act.
3 A study and paper - “Workability and Impact on Darwin and Alice Springs” was performed by Matt Brearley PhD, Managing Director, Thermal Hyperformance Pty Ltd.
5 Regulatory Proposal Executive Summary
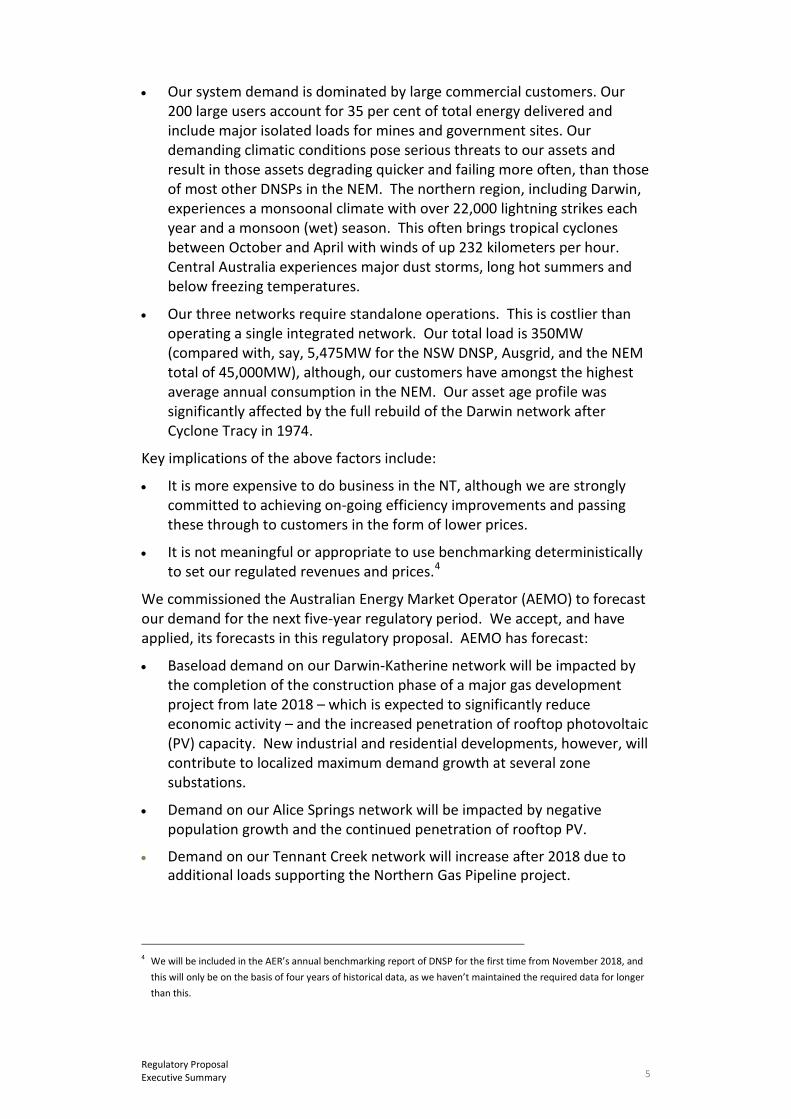
• Our system demand is dominated by large commercial customers. Our 200 large users account for 35 per cent of total energy delivered and include major isolated loads for mines and government sites. Our demanding climatic conditions pose serious threats to our assets and result in those assets degrading quicker and failing more often, than those of most other DNSPs in the NEM. The northern region, including Darwin, experiences a monsoonal climate with over 22,000 lightning strikes each year and a monsoon (wet) season. This often brings tropical cyclones between October and April with winds of up 232 kilometers per hour. Central Australia experiences major dust storms, long hot summers and below freezing temperatures.
• Our three networks require standalone operations. This is costlier than operating a single integrated network. Our total load is 350MW (compared with, say, 5,475MW for the NSW DNSP, Ausgrid, and the NEM total of 45,000MW), although, our customers have amongst the highest average annual consumption in the NEM. Our asset age profile was significantly affected by the full rebuild of the Darwin network after Cyclone Tracy in 1974.
Key implications of the above factors include:
• It is more expensive to do business in the NT, although we are strongly committed to achieving on-going efficiency improvements and passing these through to customers in the form of lower prices.
• It is not meaningful or appropriate to use benchmarking deterministically to set our regulated revenues and prices.4
We commissioned the Australian Energy Market Operator (AEMO) to forecast our demand for the next five-year regulatory period. We accept, and have applied, its forecasts in this regulatory proposal. AEMO has forecast:
• Baseload demand on our Darwin-Katherine network will be impacted by the completion of the construction phase of a major gas development project from late 2018 – which is expected to significantly reduce economic activity – and the increased penetration of rooftop photovoltaic (PV) capacity. New industrial and residential developments, however, will contribute to localized maximum demand growth at several zone substations.
• Demand on our Alice Springs network will be impacted by negative population growth and the continued penetration of rooftop PV.
• Demand on our Tennant Creek network will increase after 2018 due to additional loads supporting the Northern Gas Pipeline project.
4 We will be included in the AER’s annual benchmarking report of DNSP for the first time from November 2018, and
this will only be on the basis of four years of historical data, as we haven’t maintained the required data for longer than this.

6 Regulatory Proposal Executive Summary
We have listened to our customers and stakeholders
Achieving our vision of being a best practice, commercially-focused and customer-centric multi-utility requires that we understand our customers’ needs and preferences. We have therefore undertaken the largest network customer engagement and research program in our history. Our customers, stakeholders and system participants have given us rich input on their priorities and preferences to inform this regulatory proposal.
We undertook our engagement over 2017 in two phases, starting with initial preference testing through focus groups and interviews, then moving to a second phase of researching specific options relating to the issues and preferences we heard in phase 1. Our program included: focus groups; in-depth customer and stakeholder interviews; Customer Advisory Council meetings; deliberative forums; a large energy users’ forum; and tariff-related consultation papers.
We heard that our priorities should be:
• increasing our cost efficiency to support lower power prices
• maintaining current reliability and responsiveness levels for most customers and improving reliability for poor performing rural and urban areas
• adopting pricing structures that are more sustainable by charging for demand, which will help lower future network costs, and
• deploying smart meters consistent with our national peers to support NT energy market competition and modernisation.
Our proposal
Our regulatory proposal will deliver network bill savings (excluding the impact of inflation) for most of our customers:
• Small Households – 1.4 per cent or $16 reduction for a typical small residential customer consuming 8,500 kWh per year with an accumulation meter, or 2.1 per cent or $24 reduction if the customer has a smart meter. This customer class currently has retail price protection through the electricity Pricing Order, so our charges will not directly affect their retail electricity bill
• Large Household – 4.5 per cent or $82 reduction for a typical large residential customer consuming 15,000 kWh per year with an accumulation meter, or 16.2 per cent or $296 reduction if the customer has a smart meter. This customer class currently has retail price protection through the electricity Pricing Order, so our charges will not directly affect their retail electricity bill
• Small businesses – 4.9 per cent or $207 increase for a typical small business customer consuming 38,000 kWh per year with an accumulation meter, or 22.5 per cent or $959 reduction if the customer has a smart meter. This customer class currently has retail price protection through
7 Regulatory Proposal Executive Summary
the electricity Pricing Order, so our charges will not directly affect their retail electricity bill
• Large business – 10.9 per cent or $9,758 reduction for a typical large business customer consuming 1,000,000 kWh per year.
Our regulatory proposal is, with a small number of exceptions, consistent with the AER’s preferred regulatory positions. We have fully accepted the AER’s proposals in its May 2017 Framework and Approach (F&A) paper, namely:
• We accept its service classification, under which Type 1-6 metering services will be treated as alternative control services (ACS) and we will have no negotiated distribution services. Our service classification will deliver fit-for-purpose regulation and facilitate future competition where feasible, especially in metering.
• We will apply a revenue cap control mechanism for standard control services (SCS) and caps on prices of individual services for ASC. This will deliver revenue and price certainty and stability, while allowing for a reduction in network prices for SCS if demand increases.
• We will apply the AER’s efficiency benefit sharing scheme (EBSS), capital efficiency sharing scheme (CESS), demand management incentive scheme (DMIS) and demand management innovation allowance mechanism (DMIA mechanism) for SCS. This will incentivise expenditure efficiency and efficient demand management.
• We will not apply the service target performance incentive scheme (STPIS) in the next regulatory period, including the national guaranteed service level (GSL) scheme. We will instead apply the NT GSL scheme and our expenditure program will focus on delivering service outcomes that customers want and are willing to pay for.
• We accept the AER applying its Expenditure Forecast Assessment Guidelines to our expenditure forecasts and using forecast depreciation to determine the opening RAB for the start of the next regulatory period. This will promote regulatory transparency and certainty.
In addition, our regulatory proposal:
• applies our cost allocation method (CAM) that we have submitted to the AER. This efficiently allocates our costs to, and between, our electricity distribution services
• reflects our capitalisation policy (in our CAM), under which costs are capitalised in the ratio of our direct capital expenditure (capex) to our direct total expenditure
• includes a new connection policy, which will be used to calculate cash contribution payments from our customers for work that we undertake to connect them to our distribution networks. This policy complies with the AER’s Connection Charge Guideline
8 Regulatory Proposal Executive Summary
• applies our Expenditure Forecasting Method that we submitted to the AER in June 2017 for forecasting our capex and operating expenditure (opex) for the next regulatory period
• reflects expenditure forecasts that have been developed based on a 1 July 2017 “regulatory baseline” assumption that we tested with our Customer Advisory Council, and
• proposes to manage any future unknown increased costs arising from additional regulatory obligations through pass through applications. This is a conservative approach that will ensure that we only pass on the efficient costs of our known regulatory obligations through our network prices.
Standard Control Services (SCS) Proposal
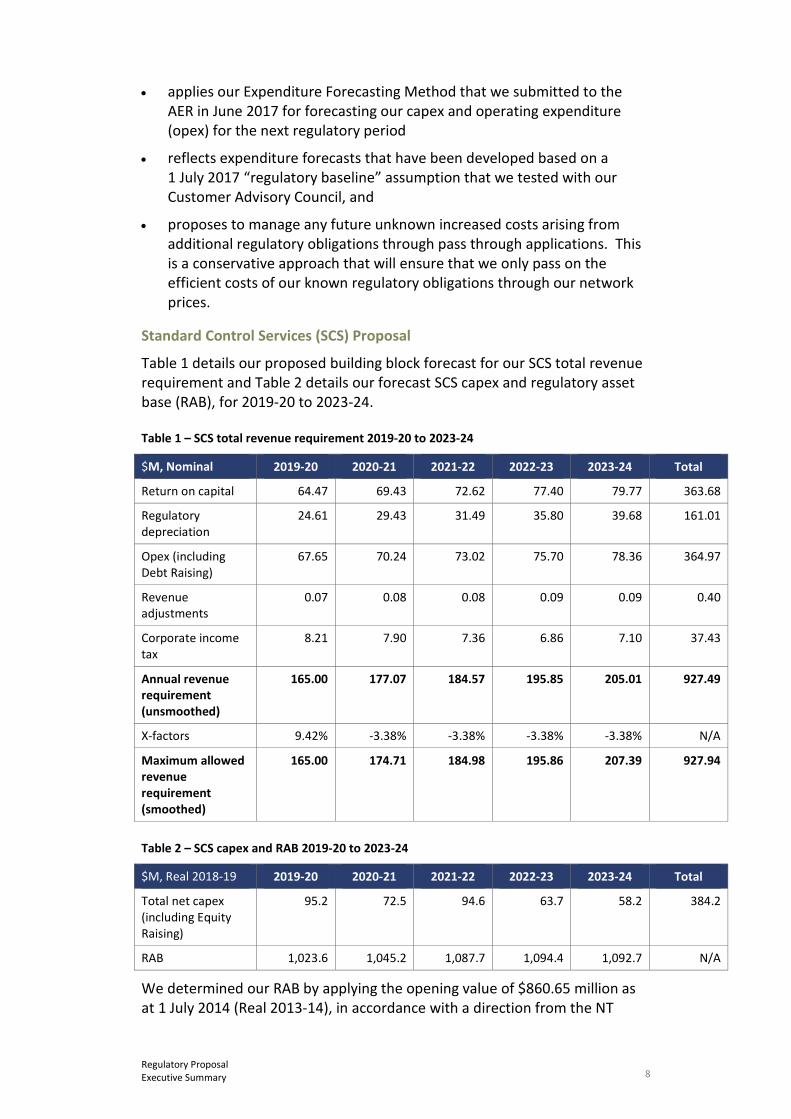
Table 1 details our proposed building block forecast for our SCS total revenue requirement and Table 2 details our forecast SCS capex and regulatory asset base (RAB), for 2019-20 to 2023-24.
Table 1 – SCS total revenue requirement 2019-20 to 2023-24
$M, Nominal 2019-20 2020-21 2021-22 2022-23 2023-24 Total
Return on capital 64.47 69.43 72.62 77.40 79.77 363.68
Regulatory depreciation
24.61 29.43 31.49 35.80 39.68 161.01
Opex (including Debt Raising)
67.65 70.24 73.02 75.70 78.36 364.97
Revenue adjustments
0.07 0.08 0.08 0.09 0.09 0.40
Corporate income tax
8.21 7.90 7.36 6.86 7.10 37.43
Annual revenue requirement (unsmoothed)
165.00 177.07 184.57 195.85 205.01 927.49
X-factors 9.42% -3.38% -3.38% -3.38% -3.38% N/A
Maximum allowed revenue requirement (smoothed)
165.00 174.71 184.98 195.86 207.39 927.94
Table 2 – SCS capex and RAB 2019-20 to 2023-24
$M, Real 2018-19 2019-20 2020-21 2021-22 2022-23 2023-24 Total
Total net capex (including Equity Raising)
95.2 72.5 94.6 63.7 58.2 384.2
RAB 1,023.6 1,045.2 1,087.7 1,094.4 1,092.7 N/A
We determined our RAB by applying the opening value of $860.65 million as at 1 July 2014 (Real 2013-14), in accordance with a direction from the NT
9 Regulatory Proposal Executive Summary
Minister. This is a $67.69 million reduction on the value of $928.34 million stated in the NT NER to correct for an error in the previous valuation relied on by the UC. We applied the AER’s roll forward model (RFM) and post-tax revenue model (PTRM) to determine our SCS RAB. This approach will ensure we recover a fair return on, and of, our efficient assets.
We have forecast an increase in our gross capex (excluding metering) in the next regulatory period to $445.64 million (Real 2018-19), compared with $356.36 million in the current period. This will allow us to maintain the current average service performance that our new and existing customers want and are willing to pay for:
• Replacement capex (repex) addresses identified asset issues and historical failures. Key repex projects include: replacing the Berrimah zone substation that is generally at the end of its serviceable life; replacing high voltage cable for safety reasons; replacing corroded poles in Alice Springs; and replacing multiple minor asset classes that fail in service or where inspection has identified condition failure. Our repex forecast has been developed consistent with the AER’s Repex model.
• Augmentation capex (augex) addresses specific capacity constraints across our distribution networks, as well as minor fault level and safety issues. Key projects include: upgrading our Wishart zone substation; installing a third transformer at our Archer zone substation; upgrading overloaded feeders; and uprating our transmission line to maintain safety and compliance.
• Information and communications technology (ICT) capex will focus on: responding to customer and stakeholder feedback to improve customer service outcomes; upgrading systems to support our network operations in line with industry standards; improving the accuracy and integrity of our core systems; refreshing applications and infrastructure in-line with industry practices; implementing tools to improve the reliability of enterprise data and reporting function capability.
• Capitalised overheads reflect our regulatory capitalisation approach. We have forecast our capitalised overheads using the base-step-trend approach applied to opex. We capitalise network and corporate overheads in proportion to the ratio of direct capex to total direct costs, as set out in our CAM.
We have forecast a post-tax nominal rate of return of 6.62 per cent by adopting the AER’s 2013 Rate of Return Guideline, except for determining the cost of debt, where we propose adopting the trailing average return on debt without transition. We agree with the AER that a trailing average approach best serves the long-term interests of consumers. We also accept that a DNSP should not receive a windfall gain when adopting that approach – and consumers should not be asked to (effectively) pay twice for the same high period in the interest rate cycle.
10 Regulatory Proposal Executive Summary
However, in our circumstances, we consider that adopting the trailing average approach immediately would not provide a windfall gain because unlike all other service providers regulated by the AER that we are aware of:
• the allowed return on debt reflected in our current tariffs (4.21%) is significantly below an on-the-day rate – and when averaged with the UC determined return on debt for the prior period (8.51%) gives a value (6.36%) that is consistent with the 10-year trailing average that we propose (6.37%), and
• adopting a trailing average approach would not include rates observed during the peak of the GFC over 2008 and early 2009 – as the averaging period used to apply that approach need only stretch back to July 2009.
Ongoing use of the 10 year trailing average approach for the return on debt allowance will give a much smoother price path for customers than can occur with the ‘rate on the day’ approach – where significant swings can occur from one (five year) regulatory period to the next. In our case, we did not receive an allowance for the higher interest rates observed just prior to the start of 2014-19 that we would have if a rate on the day approach was used to set that allowance, and would have preceded a counteracting downswing in 2019. Rather, in 2014 via a Ministerial Direction, the NT Government effectively rejected the higher prices that would have come from applying the rate on the day approach and instead sought a lower and smoother price path for our customers.
This means that we are not transitioning from a rate on the day to a trailing average – we are, in effect, already operating in a trailing average regime when looked at over a 10-year period. In these circumstances, therefore, it would be unreasonable to transition from an on-the-day approach where that approach is not the basis for our current tariffs and where doing so would compensate us below what is efficient for our debt portfolio. In contrast, an immediate adoption would be fair and – as explained below – is also consistent with recent AER, Australian Competition Tribunal (Tribunal) and Federal Court decisions.
We have forecast a reduction in opex (excluding debt raising costs) in the next regulatory period to $336.52 million ($Real 2018-19), compared with $389.24 million in the current period. This has been determined using the AER’s preferred base-step-trend approach, except for debt raising costs.
We have used 2016-17 as the base year with adjustments, including a top down efficiency target of 10 per cent. We expect to update the base year forecast in our revised regulatory proposal for our actual 2017-18 opex, when it becomes available.
We have incorporated five step changes into our opex forecast totalling $1.48 million per annum. These relate to costs of:
• administering the national connection process required under the new chapter 5A of the NT NER, which establishes more onerous obligations for
11 Regulatory Proposal Executive Summary
connecting new customers than under the existing jurisdictional arrangements
• preparing and maintaining a five-year rolling sampling plan for type 7 metering installations for the Northern and Southern Regions and assessing against that plan
• operating the metering data management system which is required to comply with our data verification, substitution and estimation obligations under the new Chapter 7A of the NT NER
• increased planning functions created with the introduction of the NT NER, and
• making increased GSL payments, due to the introduction of the NT’s Electricity Industry Performance Code, which increased the rebates payable to customers that experience poor service performance.
We have calculated a price rate of change adjustment to our opex that incorporates the AER’s preferred labour and material weighting of the base year opex and a forecast wage price index for real labour cost changes and no real change for materials. We have calculated an output rate of change adjustment to our opex that incorporates the AER’s preferred output growth factors and weights – customer numbers, circuit length and ratcheted maximum demand – and uses factor forecasts sourced from AEMO’s demand forecasts to underpin our expenditure forecasts.
We have forecast our regulatory depreciation by applying real straight-line depreciation and the “year-on-year tracking” method, rather than the AER’s default weighted average remaining life method. This aligns the return of capital (depreciation) with the economic lives of our assets. These lives are generally earlier than those reflected in the AER’s default weighted average remaining life calculation.
We have forecast corporate income tax by applying the PTRM and the AER’s preferred approach.
Our TSS explains and justifies the following proposed reforms to network tariffs, which are supported by customer and stakeholder engagement feedback:
• removing our existing declining block demand and energy tariffs
• introducing cost reflective demand charges and excess kVAr charges for all customers with advanced meters
• shifting peak times from 06:00 to 18:00 seven days per week to 12:00 to 21:00 on weekdays, and
• transitioning to fully cost reflective tariffs for large energy users.
Alternative Control Services (ACS) proposal
The key change in the service classification from the current regulatory period to the next period is to Type 1 to 6 metering services, which will become ACS.
12 Regulatory Proposal Executive Summary
We have established a separate RAB for our metering assets and have forecast annual revenue requirements using a building block approach.
We are proposing a change to our meter roll-out so that in the next regulatory period we will install advanced meters to customers on a new and replacement basis, with supporting ICT communications. This will also have the benefit of enabling us to introduce cost reflective tariffs that encourage our customers to use our network more efficiently. We developed this policy following:
• a cost benefit study
• an assessment of directions in other NEM jurisdictions
• understanding customers’ preferences through our engagement process
• the NT Government’s commitment to 50 per cent renewables by 20305, and
• our understanding of non-quantified benefits that may be derived by us and the broader community (including generators, retailers, and customers), taking account of the experiences in other jurisdictions.
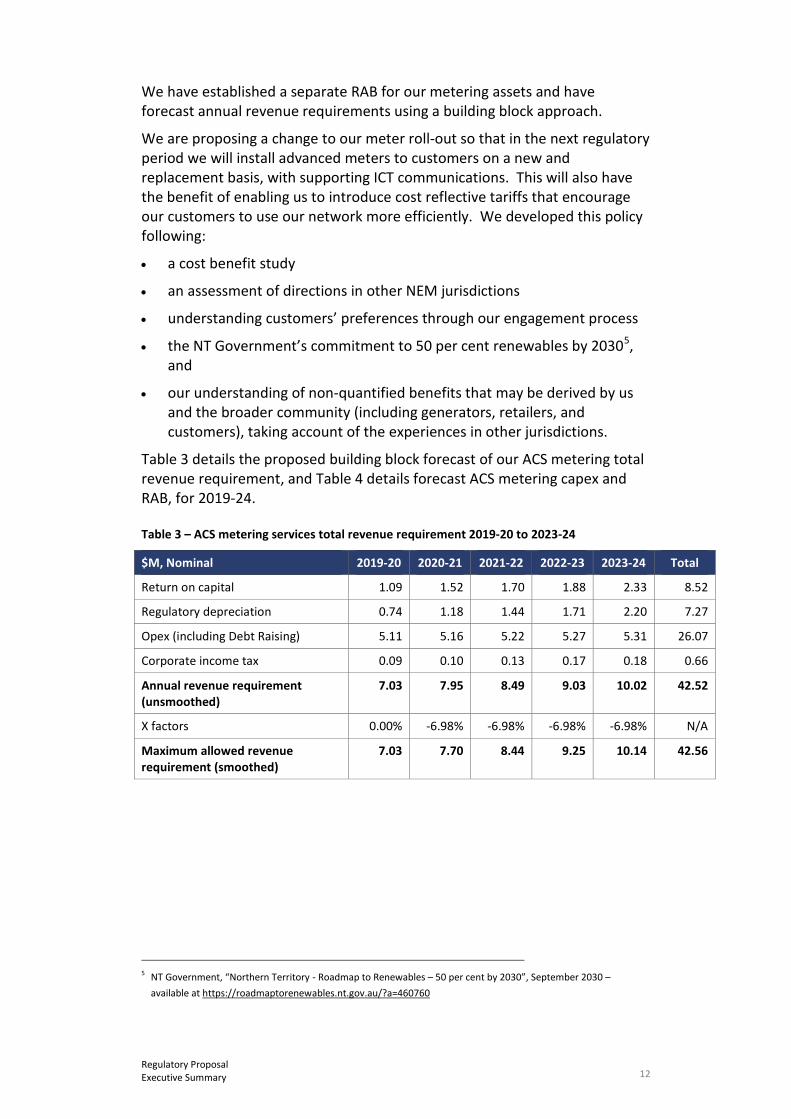
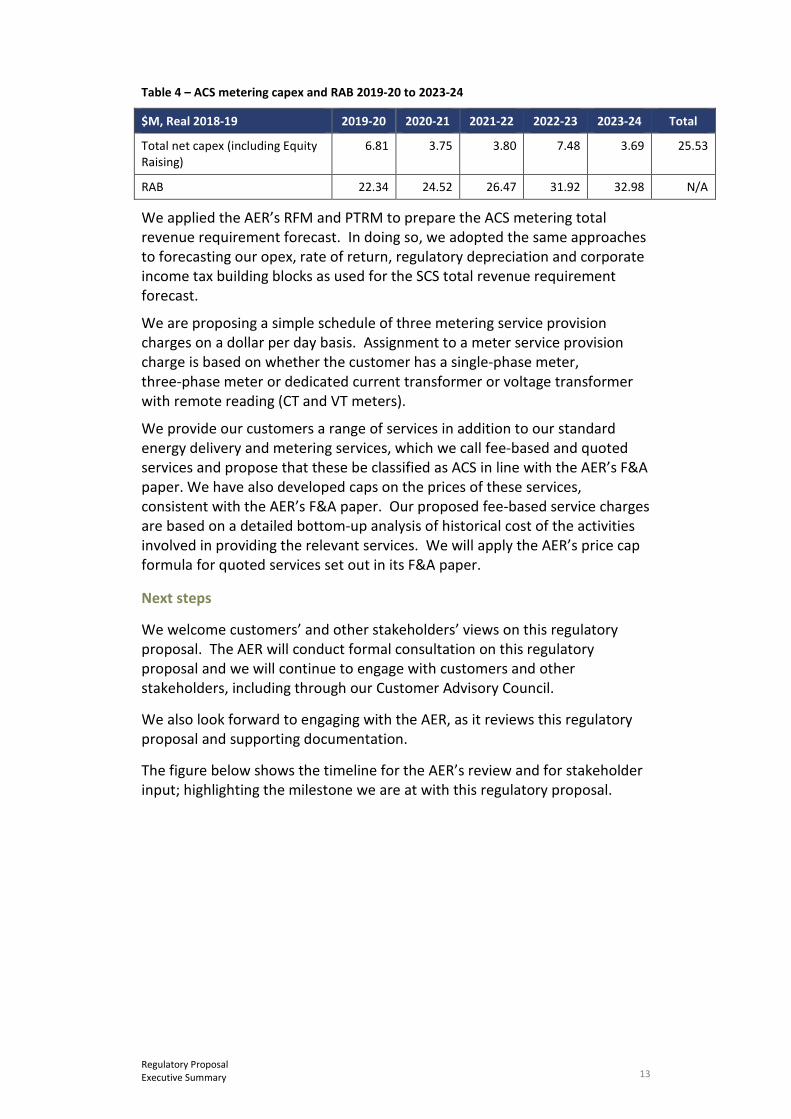
Table 3 details the proposed building block forecast of our ACS metering total revenue requirement, and Table 4 details forecast ACS metering capex and RAB, for 2019-24.
Table 3 – ACS metering services total revenue requirement 2019-20 to 2023-24
$M, Nominal 2019-20 2020-21 2021-22 2022-23 2023-24 Total
Return on capital 1.09 1.52 1.70 1.88 2.33 8.52
Regulatory depreciation 0.74 1.18 1.44 1.71 2.20 7.27
Opex (including Debt Raising) 5.11 5.16 5.22 5.27 5.31 26.07
Corporate income tax 0.09 0.10 0.13 0.17 0.18 0.66
Annual revenue requirement (unsmoothed)
7.03 7.95 8.49 9.03 10.02 42.52
X factors 0.00% -6.98% -6.98% -6.98% -6.98% N/A
Maximum allowed revenue requirement (smoothed)
7.03 7.70 8.44 9.25 10.14 42.56
5 NT Government, “Northern Territory - Roadmap to Renewables – 50 per cent by 2030”, September 2030 –
available at https://roadmaptorenewables.nt.gov.au/?a=460760
13 Regulatory Proposal Executive Summary
Table 4 – ACS metering capex and RAB 2019-20 to 2023-24
$M, Real 2018-19 2019-20 2020-21 2021-22 2022-23 2023-24 Total
Total net capex (including Equity Raising)
6.81 3.75 3.80 7.48 3.69 25.53
RAB 22.34 24.52 26.47 31.92 32.98 N/A
We applied the AER’s RFM and PTRM to prepare the ACS metering total revenue requirement forecast. In doing so, we adopted the same approaches to forecasting our opex, rate of return, regulatory depreciation and corporate income tax building blocks as used for the SCS total revenue requirement forecast.
We are proposing a simple schedule of three metering service provision charges on a dollar per day basis. Assignment to a meter service provision charge is based on whether the customer has a single-phase meter, three-phase meter or dedicated current transformer or voltage transformer with remote reading (CT and VT meters).
We provide our customers a range of services in addition to our standard energy delivery and metering services, which we call fee-based and quoted services and propose that these be classified as ACS in line with the AER’s F&A paper. We have also developed caps on the prices of these services, consistent with the AER’s F&A paper. Our proposed fee-based service charges are based on a detailed bottom-up analysis of historical cost of the activities involved in providing the relevant services. We will apply the AER’s price cap formula for quoted services set out in its F&A paper.
Next steps
We welcome customers’ and other stakeholders’ views on this regulatory proposal. The AER will conduct formal consultation on this regulatory proposal and we will continue to engage with customers and other stakeholders, including through our Customer Advisory Council.
We also look forward to engaging with the AER, as it reviews this regulatory proposal and supporting documentation.
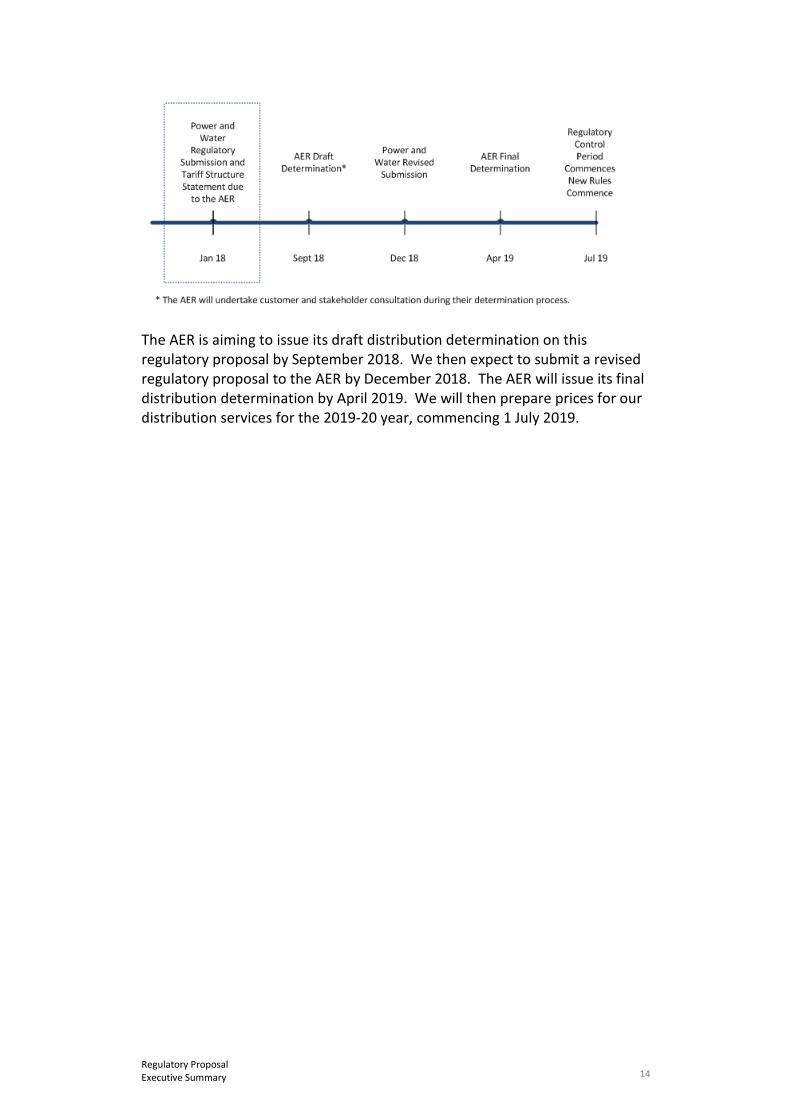
The figure below shows the timeline for the AER’s review and for stakeholder input; highlighting the milestone we are at with this regulatory proposal.
14 Regulatory Proposal Executive Summary
The AER is aiming to issue its draft distribution determination on this regulatory proposal by September 2018. We then expect to submit a revised regulatory proposal to the AER by December 2018. The AER will issue its final distribution determination by April 2019. We will then prepare prices for our distribution services for the 2019-20 year, commencing 1 July 2019.
15 Regulatory Proposal About this regulatory proposal
1. About this regulatory proposal
Key messages
This is the first time that we have submitted a regulatory proposal to the AER under the NT NER.
We have complied with the requirements of the NT NER and the AER’s RIN in this regulatory proposal and in the supporting documents.
This is our regulatory proposal for our next regulatory period, 1 July 2019 to 30 June 2024 (2019-24). It proposes revenues required to maintain the safety, quality, reliability and security of our distribution services and of the assets that we use to deliver them.
This proposal:
• addresses the requirements of the NT NER and the AER’s RIN, as listed at the start of each chapter
• applies, and complies with, the regulatory baseline discussed in chapter 4
• has benefited from customer and other stakeholder consultation and input discussed in chapter 6
• addresses matters covered in the AER’s F&A paper discussed in chapter 8
• implements our Expenditure Forecasting Method submitted to the AER in May 2017, and
• implements our cost allocation method (CAM) that we have submitted to the AER.
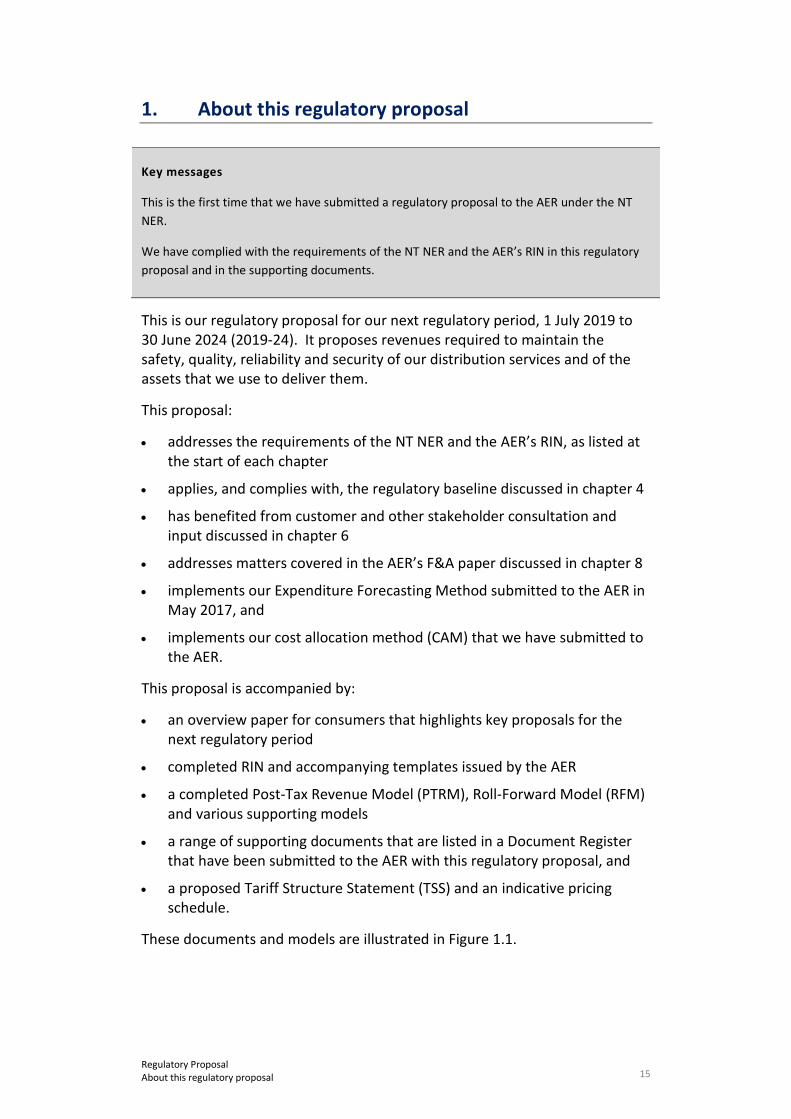
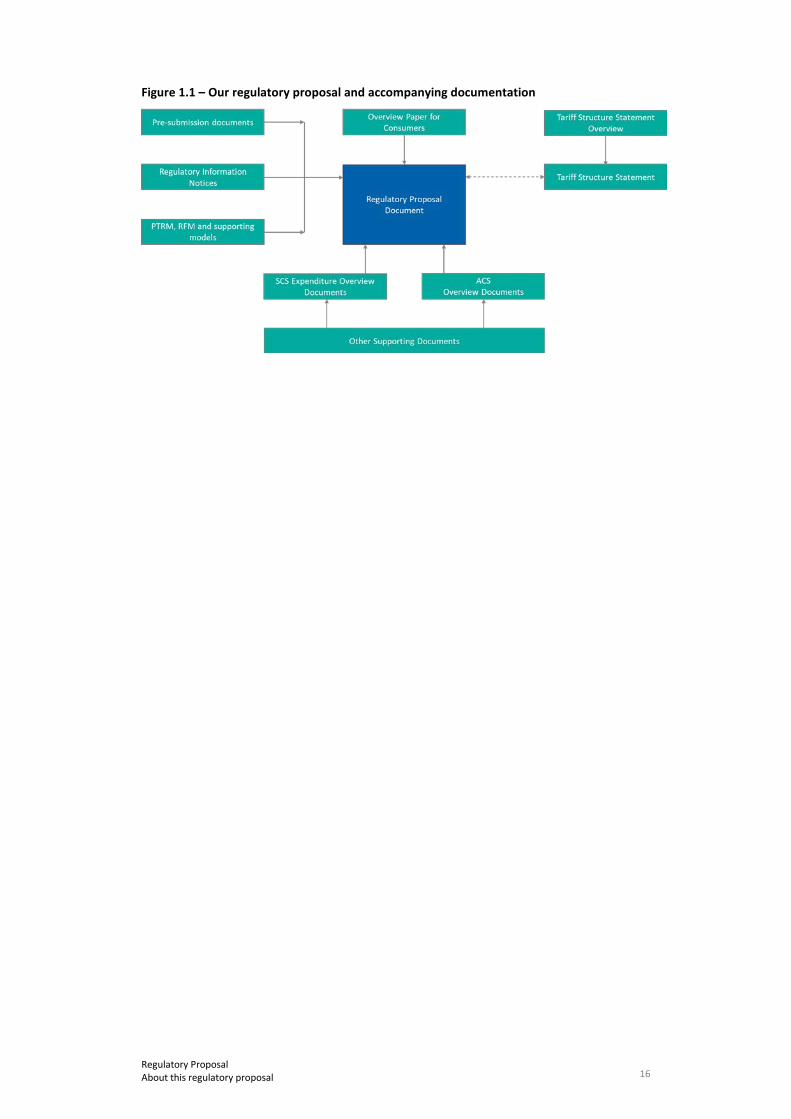
This proposal is accompanied by:
• an overview paper for consumers that highlights key proposals for the next regulatory period
• completed RIN and accompanying templates issued by the AER
• a completed Post-Tax Revenue Model (PTRM), Roll-Forward Model (RFM) and various supporting models
• a range of supporting documents that are listed in a Document Register that have been submitted to the AER with this regulatory proposal, and
• a proposed Tariff Structure Statement (TSS) and an indicative pricing schedule.
These documents and models are illustrated in Figure 1.1.
16 Regulatory Proposal About this regulatory proposal
Figure 1.1 – Our regulatory proposal and accompanying documentation

17 Regulatory Proposal Next steps and stakeholders’ feedback
2. Next steps and stakeholders’ feedback
Key messages
We will continue to engage with our stakeholders throughout 2018 and 2019, as the AER reviews our regulatory proposal and makes its draft and final determinations.
We welcome customers and other stakeholders’ views on this regulatory proposal. Please share your views with us by:
• email to [email protected], or
• post to:
Ms Jodi Triggs Power and Water Corporation Senior Executive Manager Network Regulation and Commercial GPO Box 3596 Darwin NT 0801
The AER is inviting submissions on our regulatory proposal. We will continue to engage with our customers and other stakeholders on our regulatory proposal up to, and after this date, including through our Customer Advisory Council.
The AER will issue its draft Distribution Determination on this regulatory proposal by September 2018. We will then submit a revised regulatory proposal to the AER by December 2018. The AER will issue its final Distribution Determination by April 2019. We will then prepare our prices for our distribution services for the 2019-20 year, commencing 1 July 2019, based on that determination.

18 Regulatory Proposal About Power and Water
3. About Power and Water
NT NER Nil
RIN 26 - Related Party Transactions; 28 - Corporate Structure; 29 - Forecast map of distribution system
Key messages
• This regulatory proposal covers the services that we provide to our approximately 85,000 electricity customers in and around Darwin, Katherine, Tennant Creek and Alice Springs.
• We face a unique and challenging operating environment:
− our remoteness creates limited competitive options for management, labour, materials and services that we require
− extreme weather and environmental conditions impact our: asset lives and performance; network access; labour productivity; vegetation growth; reliability performance; and our preparation for, and response to, significant weather events, and
− we operate on a small scale compared with our peer DNSPs, with low asset density and relatively high usage and demand per customer.
These factors mean that it is problematic to compare our service performance outcomes with other DNSPs in the NEM.
• Our expenditure forecasts reflect efficiency savings to be achieved in the current regulatory period as well as further savings we intend to achieve in the next period.
We are established under the Power and Water Corporation Act 2002 (PWC Act) and are a NT government owned corporation under the Government Owned Corporations Act 2001 (GOC Act). Our objectives under section 4 of the GOC Act are to:
• operate at least as efficiently as any comparable business, and
• maximise the sustainable return to the NT Government on our investment.
3.1 Our Business Overview
On 1 July 2014, we were structurally separated with our:
• major generation assets and independent power producers’ (IPPs) contracts transferred to the newly created government owned corporation Territory Generation (TGen), and
• non-Indigenous Essential Services’ retail electricity customers on the regulated network transferred to the newly created government owned corporation Jacana Energy (Jacana).

19 Regulatory Proposal About Power and Water
We now provide electricity distribution, gas supply, water and sewerage services to customers across the NT, as well as electricity generation in five minor centres. We also have a not-for profit subsidiary, Indigenous Essential Services Pty Ltd.
We provide electricity distribution services to approximately 85,000 customers and an estimated 244,300 people across an area of 1.3 million square kilometres, about 75 per cent of which are in the Darwin region and the remainder are in the Alice Springs, Katherine and Tennant Creek regions.
Power and Water as a whole, has five business lines that are supported by a Business Services’ group:
• Power Networks plans, builds, operates and maintains our electricity networks. Our aim is to fulfil our role in a safe, reliable, affordable and environmentally sustainable manner.
• Water Services provides water supply and sewerage services in the NT’s five major centres. We also supply water in 13 minor centres and sewerage services in five minor centres.
• Remote Operations provides electricity, water and sewerage services to 72 geographically isolated and dispersed remote indigenous communities and 66 outstations under an agreement with the NT Department of Housing and Community Development.
• System Control monitors and controls the operation of the power systems in the NT and oversees the safe, secure and reliable operation of the regulated power systems.
• Gas Supply manages long-term gas acquisition, sales and pipeline haulage contracts to ensure quality gas is delivered to electricity generators and other major gas customers in a timely manner.
• Business Services provides business support, encompassing customer services, people and culture, information technology, finance, communications, governance, risk and compliance services.
Power Networks is responsible for both regulated and non-regulated networks. Power Networks, along with parts of System Control’s and Business Services’ activities, are the focus of this regulatory proposal.
3.2 Our electricity distribution service area
We operate under a network licence issued by the UC on 31 March 2000 under Part 3 of the Electricity Reform Act. Schedule 2 of the licence defines our regulated electricity networks to be:
• Darwin (city, suburbs and surrounding rural areas)
• Katherine (township and surrounding rural areas)
• Darwin-Katherine Transmission Line (132kV)
20 Regulatory Proposal About Power and Water
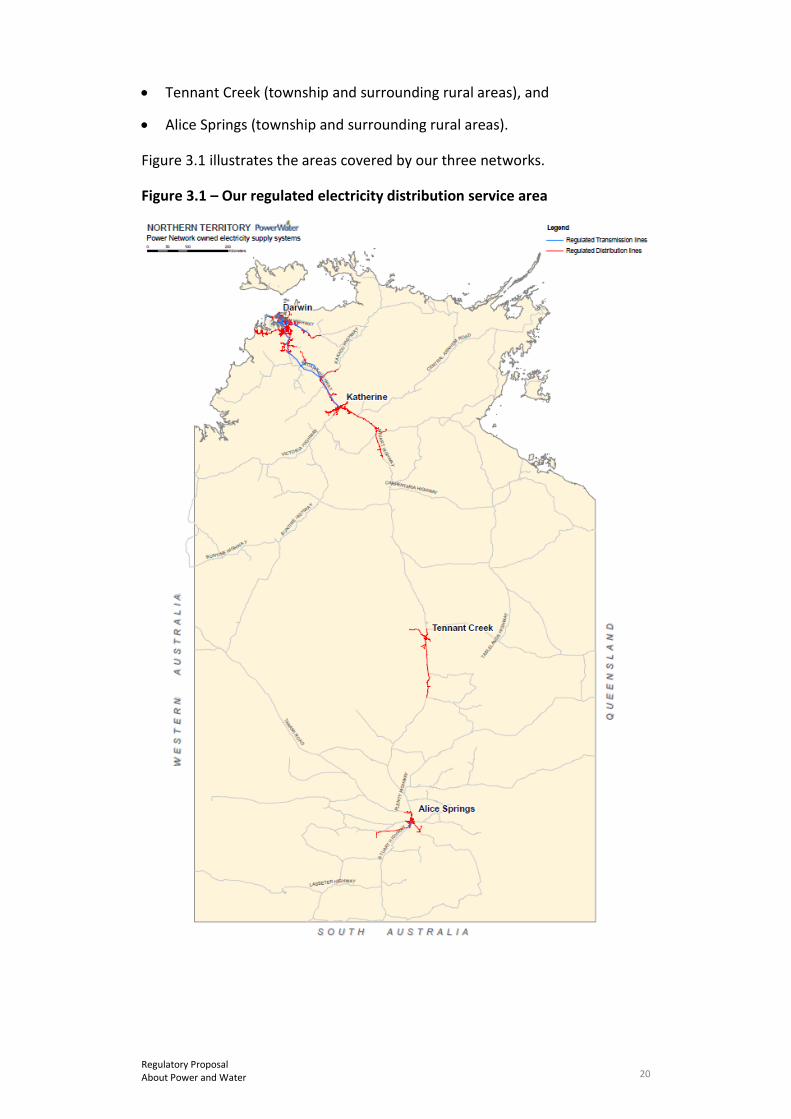
• Tennant Creek (township and surrounding rural areas), and
• Alice Springs (township and surrounding rural areas).
Figure 3.1 illustrates the areas covered by our three networks.
Figure 3.1 – Our regulated electricity distribution service area
21 Regulatory Proposal About Power and Water
All our transmission and distribution assets have been deemed to be treated as distribution assets for economic regulation purposes and so are covered by this regulatory proposal.6
Our network licence defines the terms and conditions under which we can own and operate our regulated electricity network within the prescribed geographic areas and connect this network to another electricity network. None of our three regulated electricity networks is currently connected to the national grid.
3.3 We are a unique business
We are a unique business that is not readily comparable with other DNSPs in the NEM:
• Geographic factors – our remoteness from other Australian population centres, and competition from the resource sector, limits options for the competitive procurement of goods and services and increases our labour and contractor costs compared to most other DNSPs in the NEM.
• Weather / environmental factors – we operate in demanding climatic conditions that pose serious threats to our assets and can result in those assets degrading quicker and failing more often than those of most other DNSPs in the NEM:
− Our northern region, including Darwin, experiences a monsoonal climate with over 22,000 lightning strikes each year and a tropical cyclone (wet) season between October and April. Our northern coastline can be exposed to winds of up to 232 kilometres per hour, and
− Central Australia experiences dust storms, a long hot summer / wet season and a below freezing winter / dry season.
• Network factors – we are the smallest DNSP in the NEM by customer number and staff, with three separate networks. This requires standalone operations for each service area, which is costlier than operating a single integrated network. Our total load is 350MW (compared, say, with 5,475MW for the NSW DNSP, Ausgrid, and the NEM total of 45,000MW), although our customers have amongst the highest average annual consumption in the NEM. Our asset age profile is significantly affected by the full rebuild of the Darwin network after 1974 Cyclone Tracy.
We also note that our sub-transmission / transmission lines comprise 11.68 per cent of our total circuit length. This relatively higher proportion is a result of historical decisions made by the NT Government, especially
6 See section 9 of the National Electricity (Northern Territory) (National Uniform Legislation) Act 2016.
22 Regulatory Proposal About Power and Water
for the Darwin-Katherine 132kV line. Our 132kV and 66kV power lines are more expensive to operate and maintain than those of lower voltages.
In addition, we have historically not collected and maintained our data in the same format and categories as other DNSPs and that which the AER now requires through its RINs.
Taken together, these factors mean that it is problematic to compare our provision of distribution services with other DNSPs in the NEM. This is discussed further in section 11.3 in the context of benchmarking our opex forecasts.
3.4 Our vision and focus areas
Our organisational vision is:
…….to be a best practice, commercially focused and customer centric multi-utility respected by the community for its contribution to the Northern Territory economy and its pursuit of the long-term interests of consumers.
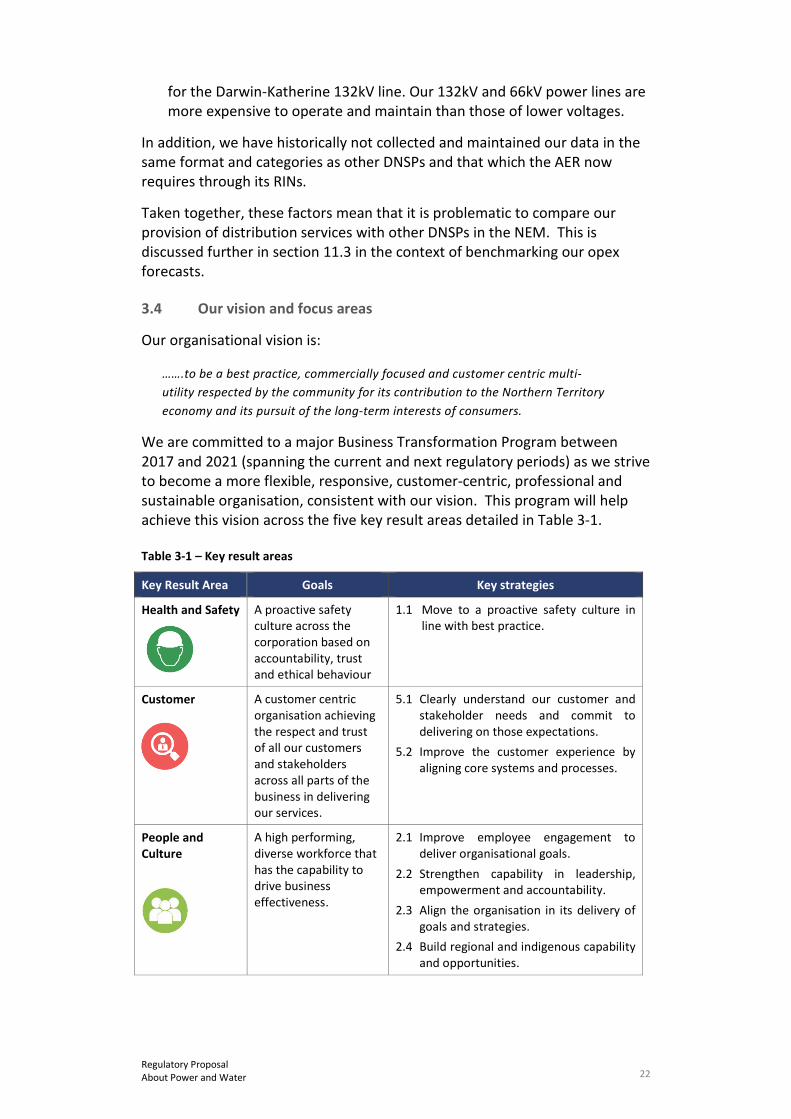
We are committed to a major Business Transformation Program between 2017 and 2021 (spanning the current and next regulatory periods) as we strive to become a more flexible, responsive, customer-centric, professional and sustainable organisation, consistent with our vision. This program will help achieve this vision across the five key result areas detailed in Table 3-1.
Table 3-1 – Key result areas
Key Result Area Goals Key strategies
Health and Safety A proactive safety culture across the corporation based on accountability, trust and ethical behaviour
1.1 Move to a proactive safety culture in line with best practice.
Customer A customer centric organisation achieving the respect and trust of all our customers and stakeholders across all parts of the business in delivering our services.
5.1 Clearly understand our customer and stakeholder needs and commit to delivering on those expectations.
5.2 Improve the customer experience by aligning core systems and processes.
People and Culture
A high performing, diverse workforce that has the capability to drive business effectiveness.
2.1 Improve employee engagement to deliver organisational goals.
2.2 Strengthen capability in leadership, empowerment and accountability.
2.3 Align the organisation in its delivery of goals and strategies.
2.4 Build regional and indigenous capability and opportunities.
23 Regulatory Proposal About Power and Water
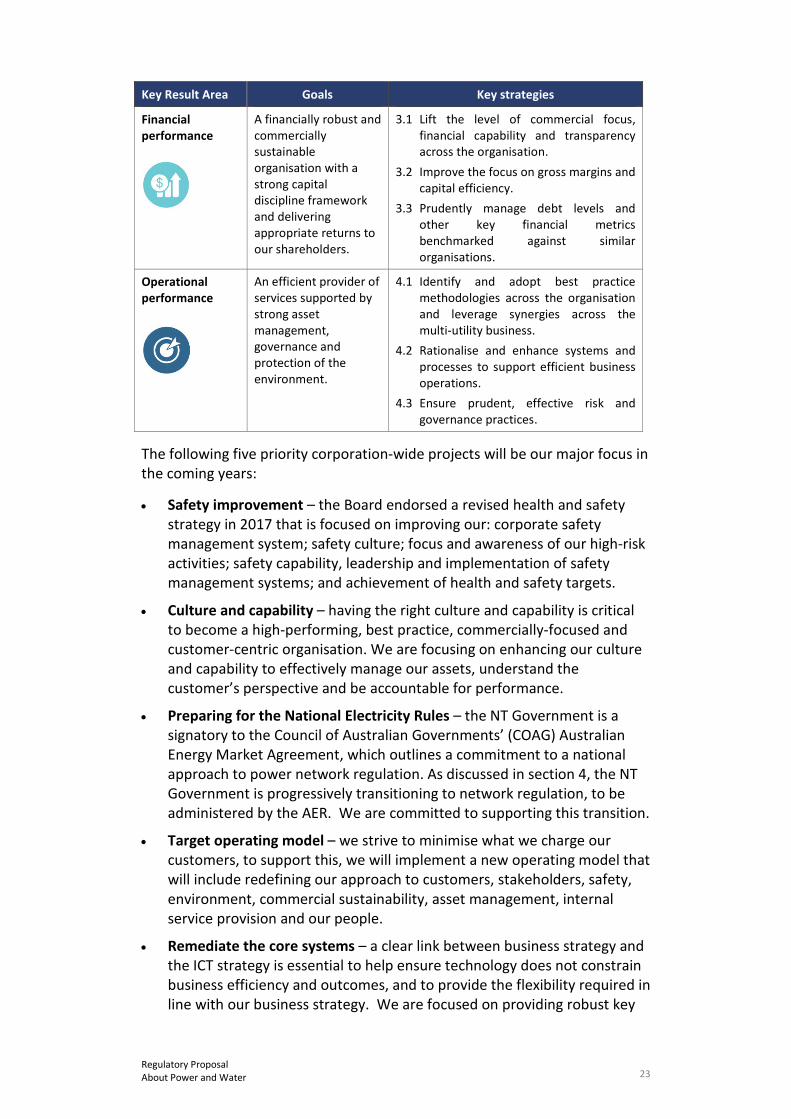
Key Result Area Goals Key strategies
Financial performance
A financially robust and commercially sustainable organisation with a strong capital discipline framework and delivering appropriate returns to our shareholders.
3.1 Lift the level of commercial focus, financial capability and transparency across the organisation.
3.2 Improve the focus on gross margins and capital efficiency.
3.3 Prudently manage debt levels and other key financial metrics benchmarked against similar organisations.
Operational performance
An efficient provider of services supported by strong asset management, governance and protection of the environment.
4.1 Identify and adopt best practice methodologies across the organisation and leverage synergies across the multi-utility business.
4.2 Rationalise and enhance systems and processes to support efficient business operations.
4.3 Ensure prudent, effective risk and governance practices.
The following five priority corporation-wide projects will be our major focus in the coming years:
• Safety improvement – the Board endorsed a revised health and safety strategy in 2017 that is focused on improving our: corporate safety management system; safety culture; focus and awareness of our high-risk activities; safety capability, leadership and implementation of safety management systems; and achievement of health and safety targets.
• Culture and capability – having the right culture and capability is critical to become a high-performing, best practice, commercially-focused and customer-centric organisation. We are focusing on enhancing our culture and capability to effectively manage our assets, understand the customer’s perspective and be accountable for performance.
• Preparing for the National Electricity Rules – the NT Government is a signatory to the Council of Australian Governments’ (COAG) Australian Energy Market Agreement, which outlines a commitment to a national approach to power network regulation. As discussed in section 4, the NT Government is progressively transitioning to network regulation, to be administered by the AER. We are committed to supporting this transition.
• Target operating model – we strive to minimise what we charge our customers, to support this, we will implement a new operating model that will include redefining our approach to customers, stakeholders, safety, environment, commercial sustainability, asset management, internal service provision and our people.
• Remediate the core systems – a clear link between business strategy and the ICT strategy is essential to help ensure technology does not constrain business efficiency and outcomes, and to provide the flexibility required in line with our business strategy. We are focused on providing robust key
24 Regulatory Proposal About Power and Water
operational and financial information to better support operational decision making and performance accountability across the organisation. By remediating the ICT core systems and processes, we will ensure technology does not impede our ability to achieve our objectives.
Power Networks will contribute to achieving our strategy to deliver against our key result areas through the following:
• Customer-centric service delivery model – implement customer and stakeholder engagement programs and strategies.
• Prepare for the transition to the new regulatory regime – including developing internal capability, stakeholder engagement and initiatives to support the new commercial and regulatory environment.
• Develop capability to respond to ‘disruptive’ technologies and meet future customer requirements – including actively engaging with customers and facilitating energy solutions such as advanced meters and advanced energy management and power quality systems.
• Develop a Strategic Asset Management Plan – based on ISO 55000 to improve network security, reliability and capability.
• Implement a Metering Strategy – including a meter data management system solution to improve efficiency and cost effectiveness of the metering business and take advantage of advanced metering technology to reduce operational costs and estimated meter reads and to enable network tariff reform.
• Investigate demand management opportunities – to identify opportunities to defer capex and optimise asset utilisation.
• Improved safety culture and accountability – implement a safety culture program and re-set the safety management framework.
These initiatives are reflected in our capex and opex forecasts for the next regulatory period that are detailed in chapters 10, 11 and 18 of this regulatory proposal.
25 Regulatory Proposal Regulatory base line
4. Regulatory base line
NT NER 6.5.6(a)(2) and 6.5.7(a)(2) - Opex and capex forecasts must comply with regulatory obligations / requirements
RIN 30 - Transitional issues
Key messages
• We have taken a conservative and transparent approach to dealing with the uncertainty surrounding our future regulatory framework in the next regulatory period and beyond.
• Our expenditure forecasts are based on applicable legislative and regulatory instruments as in force on 1 July 2017 (i.e. “the regulatory baseline”).7
• We will update our expenditure forecasts in our revised regulatory proposal (to be submitted to the AER in December 2018) for any further regulatory changes between 1 July 2017 and 30 June 2018.
• We will manage any increased costs above the AER’s final distribution determination through pass through applications in the next regulatory period.
4.1 Substantial driver of network costs
As a regulated utility, our regulatory obligations are a substantial driver of costs associated with the construction, operation and maintenance of the electricity network. This chapter and Attachment 1.3 overview these obligations and how we propose to deal with them under a changing legislative and regulatory framework.
4.2 NT NER requirements
Clause 6.5.6(a)(2) and clause 6.5.7(a)(2) of the NT NER require us to include opex and capex forecasts in this regulatory proposal that “comply with all applicable regulatory obligations or requirements associated with the provision of standard control services”.
Clause 6.3.1(c)(2) and clause 6.8.2(d) of the NT NER requires this regulatory proposal to comply with the requirements of, and to contain or be accompanied by the information required by, any relevant RIN. The AER’s Reset RIN requires us to provide various information by reference to its “regulatory obligations or requirements”. The Reset RIN defines this term by reference to the definition in the NT NER. The glossary in chapter 10 of the
7 We have included in the regulatory baseline the new Electricity Industry Performance Code (Standards of Service
and Guaranteed Service Levels) that the Utilities Commission published on 25 October 2017. This updates, merges and replaces the Retail Supply Electricity Standards of Service Code and Guaranteed Service Level Code.
26 Regulatory Proposal Regulatory base line
NT NER states that the term “regulatory obligation or requirement” “has the meaning assigned in the Law”. Section 2D of the National Electricity Law (Law) states:
(1) A regulatory obligation or requirement is—
(a) in relation to the provision of an electricity network service by a regulated network service provider—
(i) a distribution system safety duty or transmission system safety duty; or
(ii) a distribution reliability standard or transmission reliability standard; or
(iii) a distribution service standard or transmission service standard; or
(b) an obligation or requirement under—
(i) this Law or Rules; or
…..
(ii) an Act of a participating jurisdiction, or any instrument made or issued under or for the purposes of that Act, that levies or imposes a tax or other levy that is payable by a regulated network service provider; or
(iii) an Act of a participating jurisdiction, or any instrument made or issued under or for the purposes of that Act, that regulates the use of land in a participating jurisdiction by a regulated network service provider; or
(iv) an Act of a participating jurisdiction or any instrument made or issued under or for the purposes of that Act that relates to the protection of the environment; or
(v) an Act of a participating jurisdiction, or any instrument made or issued under or for the purposes of that Act (other than national electricity legislation or an Act of a participating jurisdiction or an Act or instrument referred to in subparagraphs (ii) to (iv)), that materially8 affects the provision, by a regulated network service provider, of electricity network services that are the subject of a distribution determination or transmission determination.
4.3 A legislative and regulatory framework in transition
The legislative and regulatory framework within which we operate is undergoing extensive changes. Importantly, as indicated in the NT Government’s strategy for the transition outlined in the box below, this is a
8 Note for purposes of NT transitional regulatory change events and rule 6.6.1 of the NT NER, regulation 10A of the
NT Modification Regulations states that a ‘relevant obligation’ for the purposes of sub regulation (3) is to apply this definition with the word “materially” to be deleted, i.e. the reference is to “affects”.

27 Regulatory Proposal Regulatory base line
phased process that is intended to deliver bespoke instruments and differential rules suitable for the NT.
Where we aim to be
Government is committed to continuing to adopt a more harmonised approach to economic regulation of the Territory’s electricity networks with jurisdictions in the NEM as appropriate for the Territory. The Department of Treasury and Finance on behalf of the Territory Government is undertaking the following actions:
• progressive adoption of the National Electricity Law and Rules from 1 July 2016 (to be completed by 1 July 2019), as provided for under the National Electricity (Northern Territory) (National Uniform Legislation) Act, including exemptions as necessary to ensure the costs do not outweigh the benefits to Territorians in the longer term. This phased transition provides certainty to PWC and the electricity industry as a whole. This certainty is considered vital to promoting competition in the Territory given most electricity companies in Australia are familiar with the way the AER operates, and thus more comfortable in dealing with access arrangements under the national regulatory framework; and
• provision for the Australian Energy Market Commission (AEMC), the body responsible for the development and maintenance of one uniform set of rules in the NEM, to have regard for the Territory’s ‘local electricity systems’ when making rules and to make ‘differential rules’ in respect to the Territory’s electricity systems where appropriate. This is vital to achieving the Territory’s commitment to adopt a more harmonised approach while recognising the Territory’s differences.
Source: Department of Treasury and Finance, Northern Territory (2016)9
Some future regulatory changes are known at the time of submitting this regulatory proposal, with certain national rules already made for the NT, subject to future commencement dates. Other regulatory changes are not yet clear.
Key uncertainties associated with the NT Law include the scope and content of any further transitional arrangements, and the timing (and possibly extent) of the application of the National Electricity Retail Law (the NERL) in the NT.
As at 1 July 2017, under the National Electricity (Northern Territory) (National Uniform Legislation) (Modification) Regulations 2016 (the NT Modification Regulations), the NT had also adopted (or adopted a modified version of) various provisions of the NER. Some provisions were adopted with effect from 1 July 2019, and some with effect from a future date when the NT adopts the NERL as a law of the NT.
9 NT Treasury – Strategy for Northern Territory Utilities, 22 June 2016, available at
http://www.treasury.nt.gov.au/PMS/Publications/Economics/Utilities%20Reform/I-SNTU-2016.pdf

28 Regulatory Proposal Regulatory base line
The NER as in force in the NT on 1 July 2017 was published by the AEMC as Version 19. These are referred to as the NT NER and have been the basis on which this regulatory proposal has been developed, herein referred to as the “regulatory baseline”.
Some published rules have no effect in the NT, with qualifying provisions stating that the application of the chapter or rule is to be revisited as part of the phased implementation of the NER in the NT. Their future application, and potentially modified content, is unclear.
Other published provisions have no effect but relevant notes flag that they will take effect at a later unspecified date. See for example the note following the Chapter 7 Metering heading in the NT NER:
This Chapter has no effect in this jurisdiction but will take effect at a later date. Chapter 7A applies in this jurisdiction from 1 July 2019 in substitution for this Chapter.
Criteria for assessing when the transition to this Chapter will take effect will be considered as part of the phased implementation of the Rules in this jurisdiction.
The relevant metering obligations are those in Chapter 7A commencing 1 July 2019, and from 1 July 2017 to 1 July 2019, the relevant metering obligations are those set out in existing NT regulatory instruments. Despite the note above that the chapter will take effect at a later date, at this stage it is unclear when that will be, and whether any modifications will be required in order to achieve the policy objective of a harmonised approach with differential rules that recognise the NT’s differences.
In addition to the evolving national electricity framework for the NT, other NT legislative and regulatory instruments continue to create regulatory obligations and requirements for us, notwithstanding some areas of inconsistency with the national requirements.
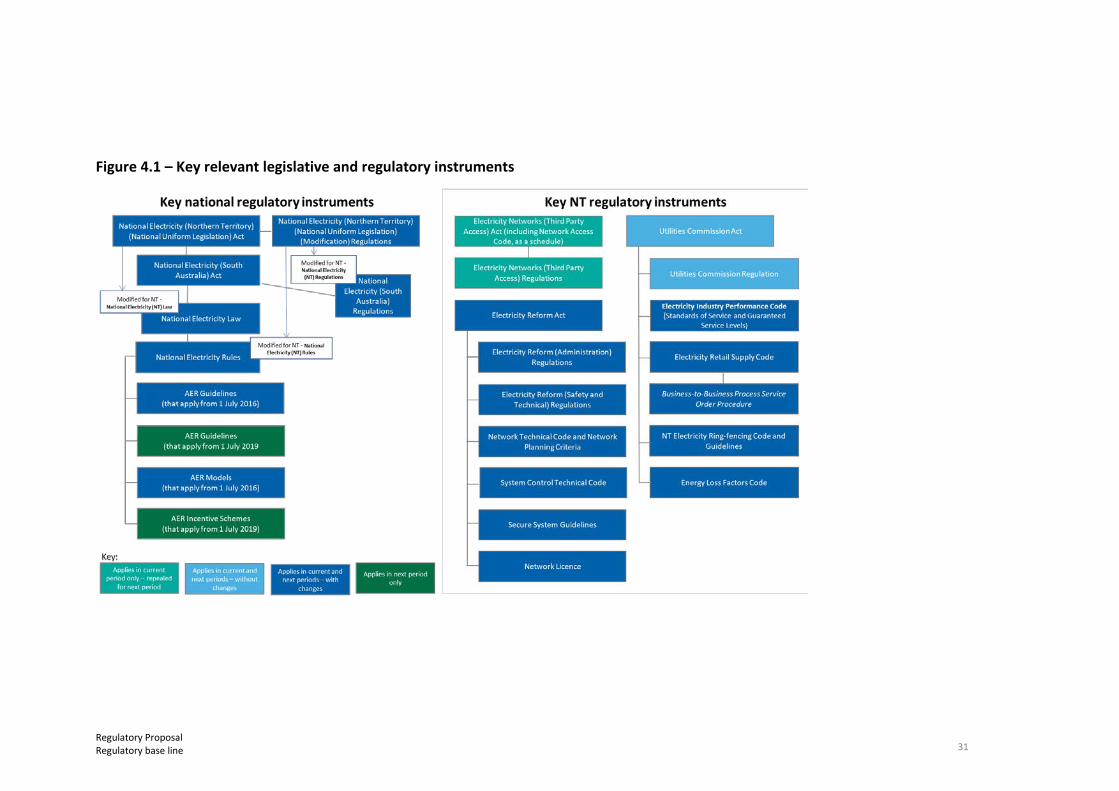
Figure 4.1 below details the key national and NT legislative and regulatory instruments that apply in the current, and will apply in the next, regulatory periods. This is not an exhaustive list. There are many other instruments with which we must comply, including in relation to matters such as occupational health and safety, indigenous affairs and environmental obligations.
Some of the key legislative and regulatory instruments in Figure 4.1:
• apply only in the current regulatory period, and will be repealed for the next regulatory period
• will apply in both the current and the next regulatory periods without any changes
• will apply in both the current and the next regulatory periods, although the instruments will change between periods, and
• will be new in the next regulatory period.
29 Regulatory Proposal Regulatory base line
Attachment 1.3 sets out key national and NT instruments, and anticipated changes to them where known across the current and next regulatory periods.
4.4 Further reviews affecting regulatory certainty
Some initial changes to national and NT regulatory instruments have been implemented, while other important transitional and long-term arrangements remain unclear. As noted above, the NT Modification Regulations add many provisions in the NT NER that clearly state, “the application of this [Chapter/ rule] will be revisited as part of the phased implementation of the Rules in this jurisdiction”.10
Future positions adopted – and resulting regulatory obligations – will depend on the outcomes of many further review and consultation processes to be conducted by the Department of Treasury and Finance, UC, the AEMC and Power and Water.
There remain some differences in terminology, ambiguities, areas of duplication, and other inconsistencies between national and pre-existing NT-based instruments. Though expected to be addressed progressively through ongoing reviews, these factors may contribute to areas of inefficiency and uncertainty for us and our customers during the current and next regulatory periods.
Though we will continue to provide active support and input to all reviews, we cannot control nor anticipate the outcomes with any certainty.
4.5 Consequences for this proposal
The consequences of the transition for this proposal are:
• Baseline required – We have established a pragmatic regulatory baseline for developing the capex and opex forecasts. The baseline uses legislative and regulatory instruments as in force on 1 July 2017, to allow sufficient time to prepare meaningful forecasts.11 That means:
− Our forecasts include capex and opex associated with the NT NER in force as of 1 July 2017, and either commenced by that date, or are to commence (specified in the NT NER) during the next regulatory period, where the content of the proposed provision is certain.
− Where a published rule has no effect, but relevant notes flag its possible future application at a later unspecified date or upon a trigger (such as future application in the NT of the NERL), then we have
10 See for example Chapters 2, 2A, 3, 4, also 5.1 to 5.9 in the National Electricity (NT) Rules. 11 We have included in the regulatory baseline the new Electricity Industry Performance Code (Standards of Service
and Guaranteed Service Levels) that the Utilities Commission published on 25 October 2017. This updates, merges and replaces the Retail Supply Electricity Standards of Service Code and Guaranteed Service Level Code.

30 Regulatory Proposal Regulatory base line
adopted a pragmatic position that the rule creates no current regulatory obligation or requirement.
− Where there is a gap in the new regulatory arrangements we will continue to meet our previous obligations.
− We reserve the right to revise our Regulatory Proposal in response to regulatory changes that occur between 1 July 2017 and the conclusion of this price determination process.
The baseline instruments are set out in detail in Reset RIN Template 7.3.
• Importantly, the baseline does not include NT NER obligations where notes within the rules stipulate the rules do not apply, and that application will be revisited in the future as part of the phased implementation of the rules in the NT.
• Inconsistencies remain – There remain some differences in terminology, ambiguities, areas of duplication, and other inconsistencies between national and pre-existing NT instruments. Though expected to be addressed progressively through ongoing reviews, in the short term, these factors may contribute to areas of inefficiency and uncertainty for us and our customers during the next regulatory period.
• Changes to the baseline – If there is a change to the baseline during the current determination process, and while there remains sufficient time for cost revisions, then we will aim to adjust our expenditure forecasts to reflect the change in our revised regulatory proposal.
• Pass through – If, however, a change is not reflected in our forecasts, then a pass through application may be appropriate. Our nominated pass through events are set out in chapter 16 of this regulatory proposal.
Our regulatory baseline is summarized in Figure 4.1 below.
Attachment 1.3 of this regulatory proposal entitled “Regulatory Obligations and Requirements applicable to Power and Water Corporation” describes each instrument in Figure 4.1 and identifies how it may change between the current and next regulatory periods.
31 Regulatory Proposal Regulatory base line
Figure 4.1 – Key relevant legislative and regulatory instruments

32 Regulatory Proposal Regulatory base line
4.6 Benefits of this approach
Our proposed approach of establishing a regulatory baseline at 1 July 2017 has several benefits:
• It enables us to be clear about the scope of activities that form the basis of our expenditure forecasts in this regulatory proposal and ultimately in the AER’s final determination.
• It deals transparently with uncertainty about further changes in our legislative and regulatory obligations in the current and next regulatory periods, by providing a clear basis for us making any future pass through applications, as discussed in chapter 16 of this regulatory proposal.
In this way, our regulatory baseline will enable us to:
• transition smoothly to the national regulatory framework
• recover the efficient costs of our known regulatory obligations, and
• avoid charging higher prices that incorporate the costs of regulatory changes that might not occur.

33 Regulatory Proposal What Power and Water has delivered
5. What Power and Water has delivered
NT NER Nil
RIN Nil
Key messages
• The Ministerial Direction means that the revenues that we have, and expect to, recover from NT electricity customers in the current regulatory period through our network prices are 17.5 per cent below what the UC assessed to be efficient.
• Between 2013-14 to 2016-17, typical network bills for residential, small business and large business customers increased by 21.25 per cent, 22.89 per cent and 23.66 per cent respectively (including the impact of inflation).
• Our reliability and customer service performance has shown a generally improving trend over the last four years, despite some variability between years.
• We have worked closely with the NT Government during the current regulatory period to:
– give effect to the structural separation of Power and Water from 1 July 2014, including by supporting some Jacana and TGen operations through temporary transitional service agreements, and
– transition from NT-specific to national regulatory instruments, systems and processes. We will continue this over the coming years as the NT Government implements further changes.
5.1 Our revenues
In April 2014, the UC issued its Final Determination for our current regulatory period, 1 July 2014 to 30 June 2019, for regulated network access services. This included the smoothed annual revenue requirements, and P0 / X-factors12 detailed in Table 5-1. The UC noted that:
The Commission’s Final Determination is based on an assessment of the efficient costs required to operate PWC’s electricity network over the next regulatory control period to meet specified standards of service and increasing electricity demands, together with an appropriate rate of return on the network assets. These principles are consistent with those applied to other network service
12 A negative P0 / X factor indicates an increase and a positive P0 / X factor indicates a decrease.

34 Regulatory Proposal What Power and Water has delivered
providers in other jurisdictions. The Commission has also considered the processes and procedures applied by the Australian Energy Regulator in the National Electricity Market.13
On 19 June 2014, the then Shareholding Minister issued a Ministerial Direction under section 8(4) of the Government Owned Corporations Act, which required us to adopt a lower revenue path than the UC Determination. This is being achieved through a lower return on equity and therefore lower dividends to the NT Government. The smoothed annual revenue requirements and P0 / X-factors provided for under the Ministerial Direction are detailed in Table 5-1. The Ministerial Direction reduces our revenue allowance in the UC’s Final Determination by 17.5 per cent, or $173.5 million (Nominal), over the current regulatory period.
Table 5-1 details our actual and estimated revenues for the current period. We estimate that our actual revenue will be:
• 16.3 per cent, or $161.6 million, lower than the UC’s Determination, and
• 1.4 per cent, or $11.9 million, higher than the Ministerial Direction.
Table 5-1 – SCS Allowed and Actual Revenues 2014-15 to 2017-18
$M, Nominal
2014-15 2015-16 2016-17 2017-18 2018-19 Total
UC Determination – Allowed
Smoothed revenue
$ 179.20 $ 196.86 $ 206.19 $ 205.06 $ 204.98 $ 992.29
P0 / X-factor
-29.78% -8.00% -3.00% 2.00% 2.00% N/A
Ministerial Direction – Allowed
Smoothed revenue
$ 148.72 $ 163.38 $ 166.14 $ 168.60 $ 171.97 $ 818.81
P0 / X-factor (%)
-7.71% -8.00% 0.00% 0.00% 0.00% N/A
Actual
Revenue $ 143.50 $ 165.42 $ 167.80 $ 176.10 $ 177.84 $ 830.67
The Ministerial Direction means that the revenues that we expect to recover from NT electricity customers through our network prices in the current
13 UC, 2014 Network Price Determination – Fact Sheet, April 2014 – available at
http://www.utilicom.nt.gov.au/AboutTheCommission/consultations/2014/Pages/default.aspx
35 Regulatory Proposal What Power and Water has delivered
period will be 17.5 per cent lower than the 2014 UC Network Price Determination.
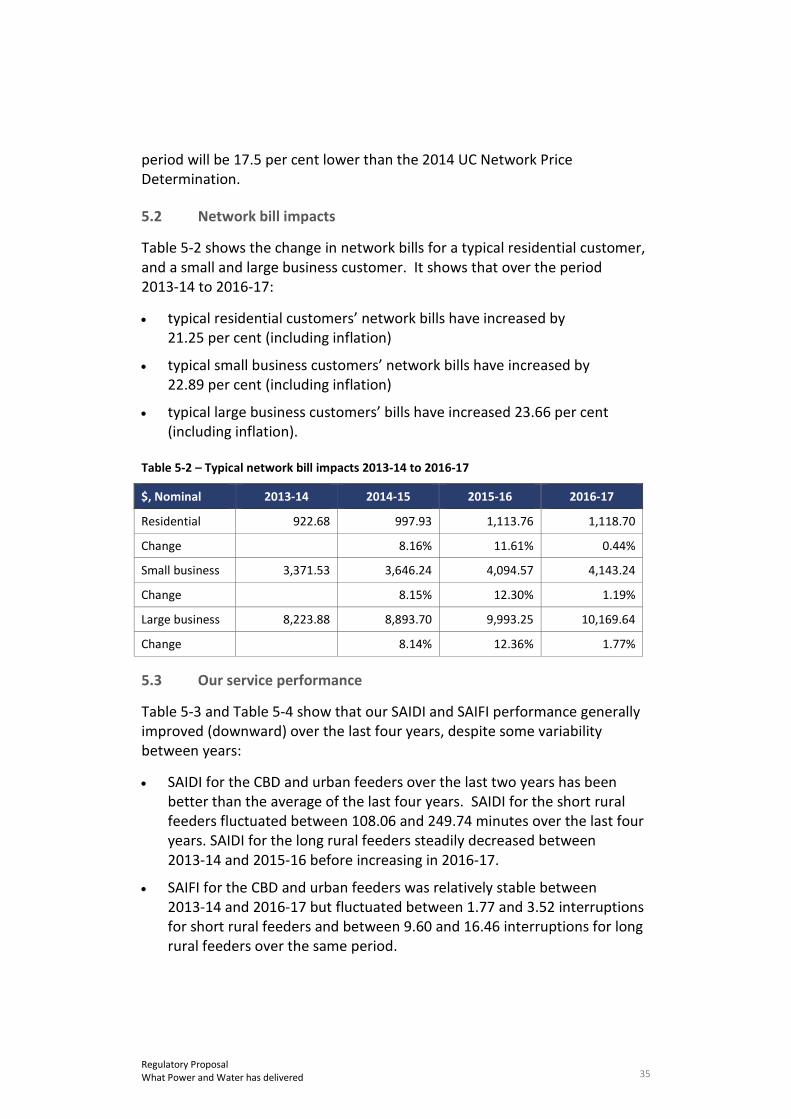
5.2 Network bill impacts
Table 5-2 shows the change in network bills for a typical residential customer, and a small and large business customer. It shows that over the period 2013-14 to 2016-17:
• typical residential customers’ network bills have increased by 21.25 per cent (including inflation)
• typical small business customers’ network bills have increased by 22.89 per cent (including inflation)
• typical large business customers’ bills have increased 23.66 per cent (including inflation).
Table 5-2 – Typical network bill impacts 2013-14 to 2016-17
$, Nominal 2013-14 2014-15 2015-16 2016-17
Residential 922.68 997.93 1,113.76 1,118.70
Change 8.16% 11.61% 0.44%
Small business 3,371.53 3,646.24 4,094.57 4,143.24
Change 8.15% 12.30% 1.19%
Large business 8,223.88 8,893.70 9,993.25 10,169.64
Change 8.14% 12.36% 1.77%
5.3 Our service performance
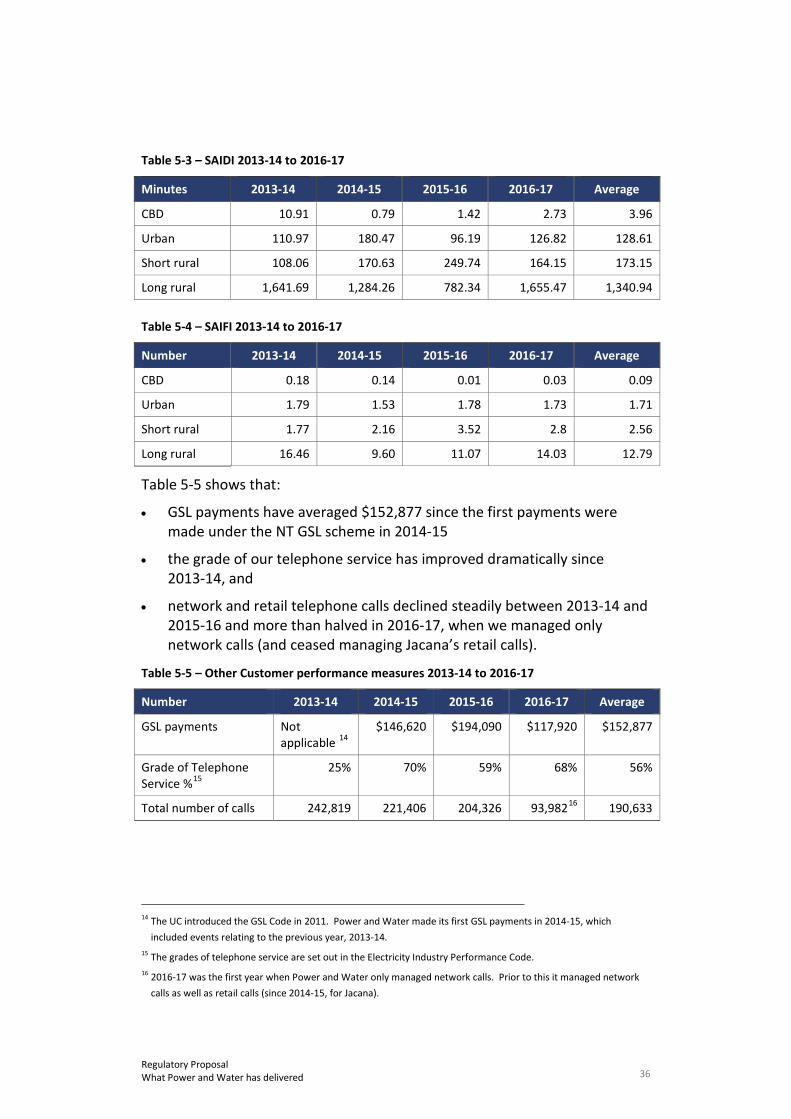
Table 5-3 and Table 5-4 show that our SAIDI and SAIFI performance generally improved (downward) over the last four years, despite some variability between years:
• SAIDI for the CBD and urban feeders over the last two years has been better than the average of the last four years. SAIDI for the short rural feeders fluctuated between 108.06 and 249.74 minutes over the last four years. SAIDI for the long rural feeders steadily decreased between 2013-14 and 2015-16 before increasing in 2016-17.
• SAIFI for the CBD and urban feeders was relatively stable between 2013-14 and 2016-17 but fluctuated between 1.77 and 3.52 interruptions for short rural feeders and between 9.60 and 16.46 interruptions for long rural feeders over the same period.
36 Regulatory Proposal What Power and Water has delivered
Table 5-3 – SAIDI 2013-14 to 2016-17
Minutes 2013-14 2014-15 2015-16 2016-17 Average
CBD 10.91 0.79 1.42 2.73 3.96
Urban 110.97 180.47 96.19 126.82 128.61
Short rural 108.06 170.63 249.74 164.15 173.15
Long rural 1,641.69 1,284.26 782.34 1,655.47 1,340.94
Table 5-4 – SAIFI 2013-14 to 2016-17
Number 2013-14 2014-15 2015-16 2016-17 Average
CBD 0.18 0.14 0.01 0.03 0.09
Urban 1.79 1.53 1.78 1.73 1.71
Short rural 1.77 2.16 3.52 2.8 2.56
Long rural 16.46 9.60 11.07 14.03 12.79
Table 5-5 shows that:
• GSL payments have averaged $152,877 since the first payments were made under the NT GSL scheme in 2014-15
• the grade of our telephone service has improved dramatically since 2013-14, and
• network and retail telephone calls declined steadily between 2013-14 and 2015-16 and more than halved in 2016-17, when we managed only network calls (and ceased managing Jacana’s retail calls).
Table 5-5 – Other Customer performance measures 2013-14 to 2016-17
Number 2013-14 2014-15 2015-16 2016-17 Average
GSL payments Not applicable 14
$146,620 $194,090 $117,920 $152,877
Grade of Telephone Service %15
25% 70% 59% 68% 56%
Total number of calls 242,819 221,406 204,326 93,98216 190,633
14 The UC introduced the GSL Code in 2011. Power and Water made its first GSL payments in 2014-15, which
included events relating to the previous year, 2013-14. 15 The grades of telephone service are set out in the Electricity Industry Performance Code. 16 2016-17 was the first year when Power and Water only managed network calls. Prior to this it managed network
calls as well as retail calls (since 2014-15, for Jacana).

37 Regulatory Proposal What Power and Water has delivered
5.4 Supporting the NT Government’s reform program
5.4.1 Structural separation
As discussed in chapter 3, on 1 July 2014 the NT Government structurally separated Power and Water into three separate government owned corporations: Jacana, an electricity retailer; TGen, a power generator; and Power and Water, which continued, amongst other things, to manage and operate the electricity networks.
These reforms sought to promote greater accountability, transparency and efficiency in the NT’s energy sector, as well as greater consistency and uniformity with how the energy sector is structured elsewhere in Australia.17
We have worked closely with the NT Government to give effect to this reform in the current regulatory period, including by supporting some Jacana and TGen operations through temporary transitional service agreements. The final stage will be complete once Jacana takes over the retail billing functions of its mass market customers, sometime in 2018.
5.4.2 Transition to new regulatory arrangements
As discussed in chapter 4, in 2014 the NT Government committed to progressively adopting the national framework for the regulation of electricity network businesses. From 1 July 2016 the NT NEL was applied as a law of the NT, with certain modifications set out in the adopting legislation.18 Under the NT NEL, the NT NER, with modifications and exclusions as set out in regulations, now have the force of law in the NT.19 The NT Government refers to the changes that took effect on:
• 1 July 2016, including the introduction of the NT NEL and NT NER, as “Package 1” of its NEM Transition, and
• 1 July 2017, including the introduction of Chapter 7A of the NT NER, as “Package 2A” of its NEM Transition.
The NT Government has foreshadowed further packages of changes from 1 July 2018 (Package 2B) and 1 July 2019 (Package 3).
17 NT Department of Treasury and Finance, Strategy for Northern Territory Utilities, 22 June 2016, page 4. 18 National Electricity (Northern Territory) (National Uniform Legislation) Act 2015, s 6. 19 NT NEL, s 9; National Electricity (Northern Territory) (National Uniform Legislation) (Modification) Regulations
2016, cl 5.

38 Regulatory Proposal What Power and Water has delivered
As a licensed DNSP in the NT, we are obliged under our licence conditions to comply with the provisions of the NT NEL and NT NER.
In parallel, the NT Government, the UC and ourselves (in our capacities as system operator and the DNSP) are making a complementary range of consequential and supporting changes to NT legislative, regulatory and related instruments.
We have worked closely with the NT Government during the current regulatory period to transition to the new regulatory arrangements. We will continue this over the coming years as the NT Government implements further changes.
39 Regulatory Proposal What stakeholders are saying
6. What stakeholders are saying
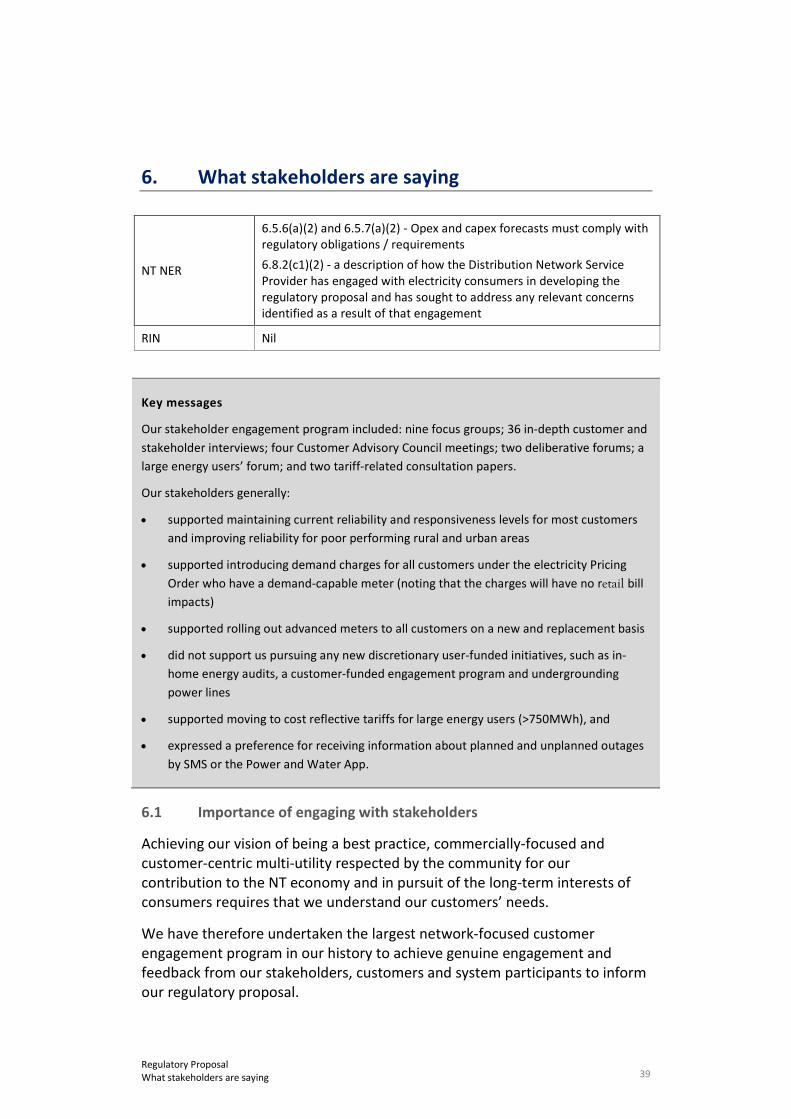
NT NER
6.5.6(a)(2) and 6.5.7(a)(2) - Opex and capex forecasts must comply with regulatory obligations / requirements 6.8.2(c1)(2) - a description of how the Distribution Network Service Provider has engaged with electricity consumers in developing the regulatory proposal and has sought to address any relevant concerns identified as a result of that engagement
RIN Nil
Key messages
Our stakeholder engagement program included: nine focus groups; 36 in-depth customer and stakeholder interviews; four Customer Advisory Council meetings; two deliberative forums; a large energy users’ forum; and two tariff-related consultation papers.
Our stakeholders generally:
• supported maintaining current reliability and responsiveness levels for most customers and improving reliability for poor performing rural and urban areas
• supported introducing demand charges for all customers under the electricity Pricing Order who have a demand-capable meter (noting that the charges will have no retail bill impacts)
• supported rolling out advanced meters to all customers on a new and replacement basis
• did not support us pursuing any new discretionary user-funded initiatives, such as in-home energy audits, a customer-funded engagement program and undergrounding power lines
• supported moving to cost reflective tariffs for large energy users (>750MWh), and
• expressed a preference for receiving information about planned and unplanned outages by SMS or the Power and Water App.
6.1 Importance of engaging with stakeholders
Achieving our vision of being a best practice, commercially-focused and customer-centric multi-utility respected by the community for our contribution to the NT economy and in pursuit of the long-term interests of consumers requires that we understand our customers’ needs.
We have therefore undertaken the largest network-focused customer engagement program in our history to achieve genuine engagement and feedback from our stakeholders, customers and system participants to inform our regulatory proposal.

40 Regulatory Proposal What stakeholders are saying
This chapter discusses how we engaged, what we heard and how we’re responding. Our “Engagement Overview” at Attachment 1.4 expands on this further.
6.2 Our engagement approach
We began our customer and stakeholder engagement program in February 2017. The engagement was designed to capture a wide variety of views and feedback from all sectors of the NT electricity market, including:
• residential and small to medium business (SME) customers that consume less than 750 MWh per annum and are therefore subject to the Electricity Pricing Order, which the Government uses to determine the retail electricity prices charged to these customers
• major energy users that consume more than 750 MWh per annum, and
• government and consumer representative bodies (including welfare agencies, peak organisational bodies, industry groups)
The design phase of the engagement program was undertaken in consultation with consulting firms Newgate Research and farrierswier. It drew on the AER’s and Consumer Challenge Panel’s (CCP) guidance, and remained flexible to adapt to customers’ and other stakeholder feedback. We designed the engagement to deliver on our strategic objectives, consider timing needs for our planning, and adopt fit-for-purpose engagement channels.20
6.3 What we did
6.3.1 Focus Groups
We began the program with nine focus groups across Darwin, Katherine, Tennant Creek and Alice Springs. In total, 73 residential and SME customers attended the focus groups.
20 Section 2 of Attachment 1.4 – “Engagement Overview”.
41 Regulatory Proposal What stakeholders are saying
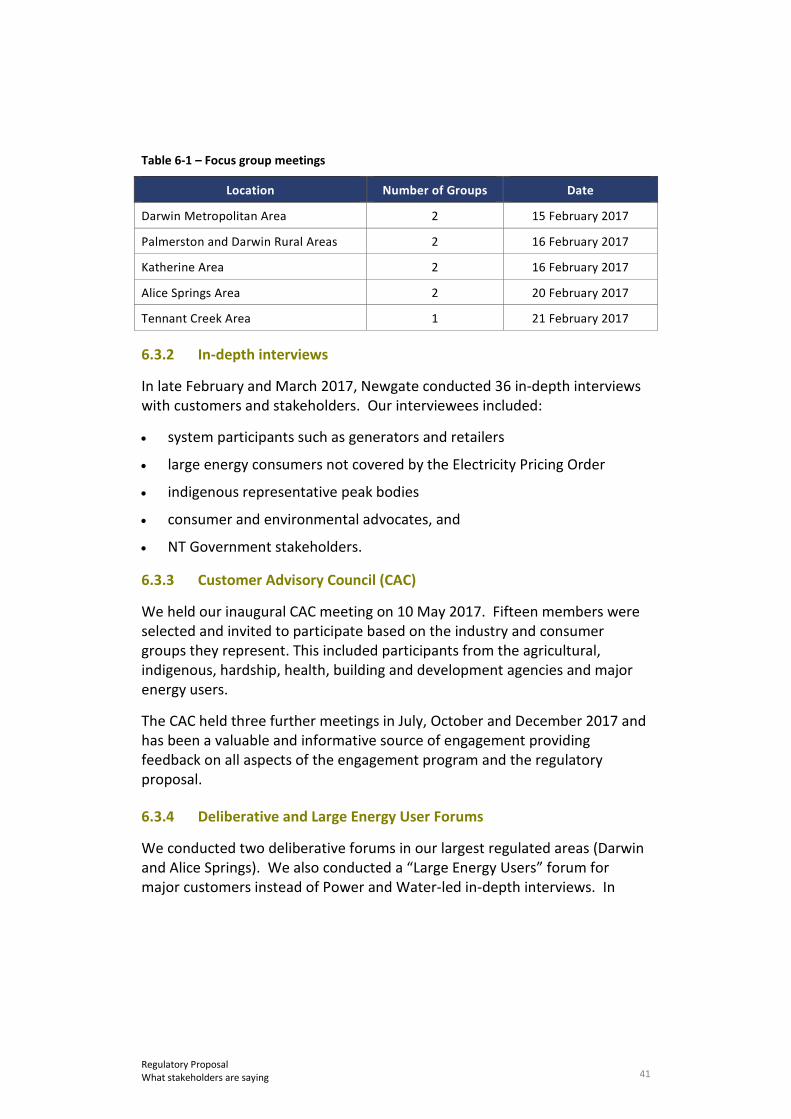
Table 6-1 – Focus group meetings
Location Number of Groups Date
Darwin Metropolitan Area 2 15 February 2017
Palmerston and Darwin Rural Areas 2 16 February 2017
Katherine Area 2 16 February 2017
Alice Springs Area 2 20 February 2017
Tennant Creek Area 1 21 February 2017
6.3.2 In-depth interviews
In late February and March 2017, Newgate conducted 36 in-depth interviews with customers and stakeholders. Our interviewees included:
• system participants such as generators and retailers
• large energy consumers not covered by the Electricity Pricing Order
• indigenous representative peak bodies
• consumer and environmental advocates, and
• NT Government stakeholders.
6.3.3 Customer Advisory Council (CAC)
We held our inaugural CAC meeting on 10 May 2017. Fifteen members were selected and invited to participate based on the industry and consumer groups they represent. This included participants from the agricultural, indigenous, hardship, health, building and development agencies and major energy users.
The CAC held three further meetings in July, October and December 2017 and has been a valuable and informative source of engagement providing feedback on all aspects of the engagement program and the regulatory proposal.
6.3.4 Deliberative and Large Energy User Forums
We conducted two deliberative forums in our largest regulated areas (Darwin and Alice Springs). We also conducted a “Large Energy Users” forum for major customers instead of Power and Water-led in-depth interviews. In
42 Regulatory Proposal What stakeholders are saying
total, 66 customers attended the residential and SME forums, and 17 major customers21 attended the large user forum.
6.4 Consultation papers
6.4.1 Pricing consultation with electricity industry stakeholders
We invited comment and feedback on our initial tariff strategy from retailers and generators, the UC and the Department of Treasury and Finance.
Our strategy paper was not distributed more widely as it was designed to gain an understanding of the views and opinions of the various system participants and the NT Government, so that we could further refine our proposed tariff structures, recognising that the Pricing Order protects most consumers in the NT.
We received one submission on the strategy paper and had three follow-up meetings with stakeholders who did not make formal submissions.
6.4.2 Public pricing consultation on draft pricing plans
In November 2017, we published a draft customer overview of our proposed TSS, after testing it with the CAC at our October meeting. This paper invited all consumers across the NT to provide feedback on our draft TSS overview. This paper was placed on our website and was sent directly to key stakeholders. We received one formal submission and had two follow-up meetings with stakeholders who did not make formal submissions.
6.5 What we heard and how we are responding
Throughout the engagement program, we focused on obtaining feedback on six broad categories: • reliability and responsiveness
• cost and charges
• metering
• customer funded initiatives
• large user pricing, and
• communication preferences.
Table 6-2 outlines our findings and responses.
21 Our 200 major customers account for 35% of total energy delivered. These 17 major customers account for
approximately 38% of total consumption within the > 750MWh per annum customer class.
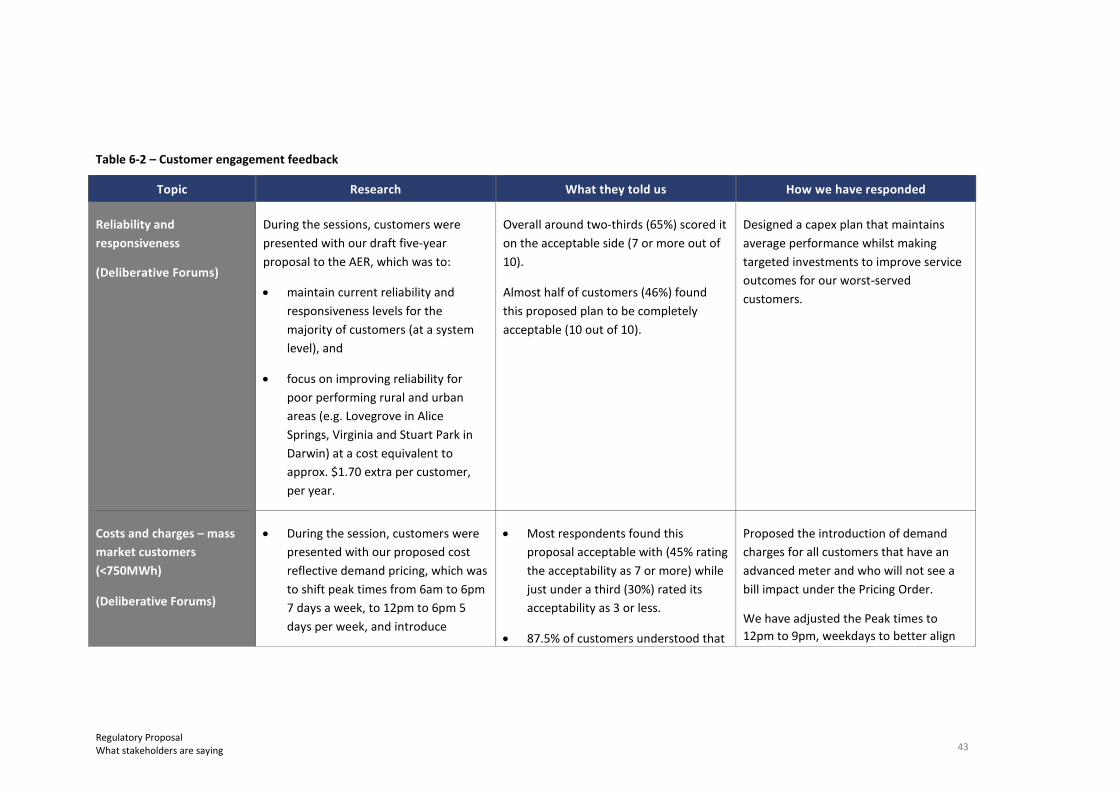
43 Regulatory Proposal What stakeholders are saying
Table 6-2 – Customer engagement feedback
Topic Research What they told us How we have responded
Reliability and responsiveness
(Deliberative Forums)
During the sessions, customers were presented with our draft five-year proposal to the AER, which was to:
• maintain current reliability and responsiveness levels for the majority of customers (at a system level), and
• focus on improving reliability for poor performing rural and urban areas (e.g. Lovegrove in Alice Springs, Virginia and Stuart Park in Darwin) at a cost equivalent to approx. $1.70 extra per customer, per year.
Overall around two-thirds (65%) scored it on the acceptable side (7 or more out of 10).
Almost half of customers (46%) found this proposed plan to be completely acceptable (10 out of 10).
Designed a capex plan that maintains average performance whilst making targeted investments to improve service outcomes for our worst-served customers.
Costs and charges – mass market customers (<750MWh)
(Deliberative Forums)
• During the session, customers were presented with our proposed cost reflective demand pricing, which was to shift peak times from 6am to 6pm 7 days a week, to 12pm to 6pm 5 days per week, and introduce
• Most respondents found this proposal acceptable with (45% rating the acceptability as 7 or more) while just under a third (30%) rated its acceptability as 3 or less.
• 87.5% of customers understood that
Proposed the introduction of demand charges for all customers that have an advanced meter and who will not see a bill impact under the Pricing Order.
We have adjusted the Peak times to 12pm to 9pm, weekdays to better align
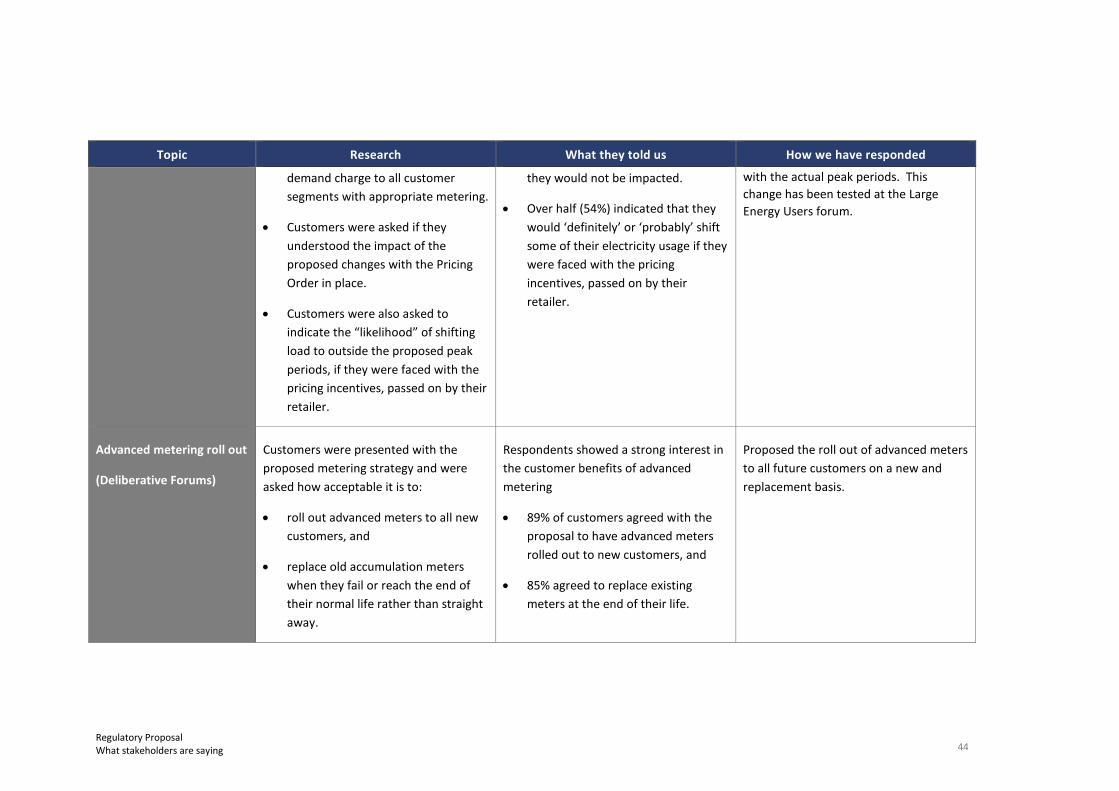
44 Regulatory Proposal What stakeholders are saying
Topic Research What they told us How we have responded
demand charge to all customer segments with appropriate metering.
• Customers were asked if they understood the impact of the proposed changes with the Pricing Order in place.
• Customers were also asked to indicate the “likelihood” of shifting load to outside the proposed peak periods, if they were faced with the pricing incentives, passed on by their retailer.
they would not be impacted.
• Over half (54%) indicated that they would ‘definitely’ or ‘probably’ shift some of their electricity usage if they were faced with the pricing incentives, passed on by their retailer.
with the actual peak periods. This change has been tested at the Large Energy Users forum.
Advanced metering roll out
(Deliberative Forums)
Customers were presented with the proposed metering strategy and were asked how acceptable it is to:
• roll out advanced meters to all new customers, and
• replace old accumulation meters when they fail or reach the end of their normal life rather than straight away.
Respondents showed a strong interest in the customer benefits of advanced metering
• 89% of customers agreed with the proposal to have advanced meters rolled out to new customers, and
• 85% agreed to replace existing meters at the end of their life.
Proposed the roll out of advanced meters to all future customers on a new and replacement basis.
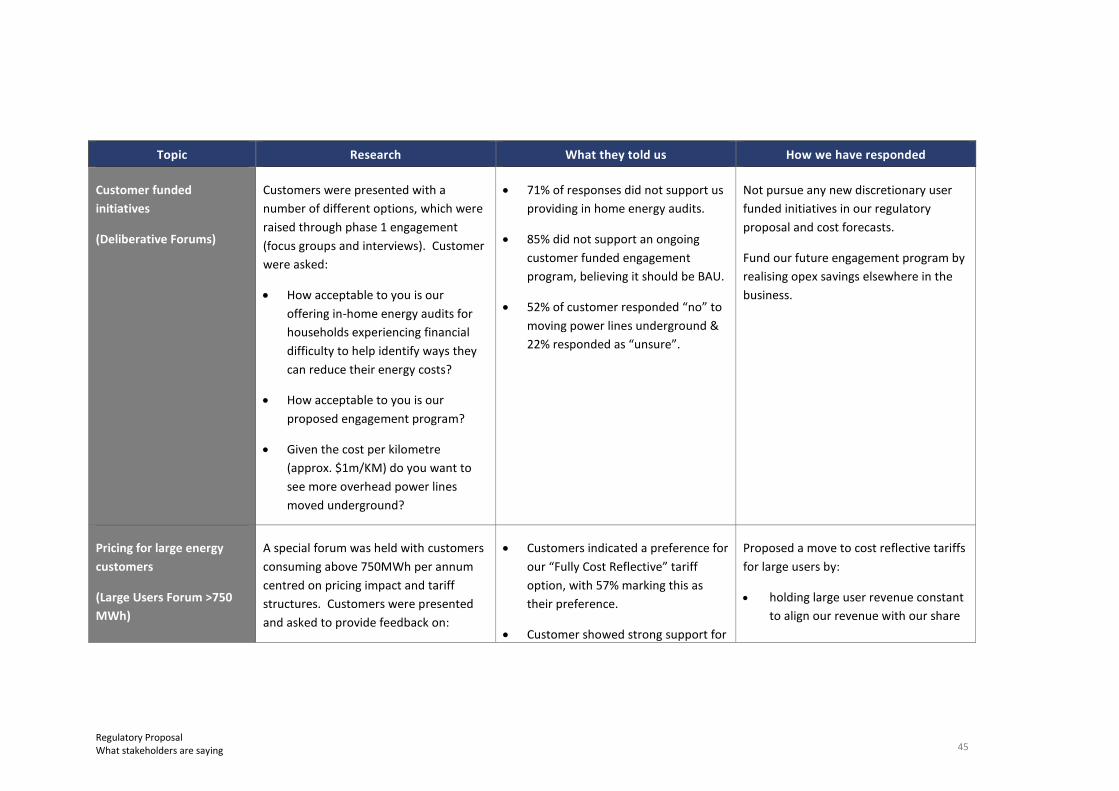
45 Regulatory Proposal What stakeholders are saying
Topic Research What they told us How we have responded
Customer funded initiatives
(Deliberative Forums)
Customers were presented with a number of different options, which were raised through phase 1 engagement (focus groups and interviews). Customer were asked:
• How acceptable to you is our offering in-home energy audits for households experiencing financial difficulty to help identify ways they can reduce their energy costs?
• How acceptable to you is our proposed engagement program?
• Given the cost per kilometre (approx. $1m/KM) do you want to see more overhead power lines moved underground?
• 71% of responses did not support us providing in home energy audits.
• 85% did not support an ongoing customer funded engagement program, believing it should be BAU.
• 52% of customer responded “no” to moving power lines underground & 22% responded as “unsure”.
Not pursue any new discretionary user funded initiatives in our regulatory proposal and cost forecasts.
Fund our future engagement program by realising opex savings elsewhere in the business.
Pricing for large energy customers
(Large Users Forum >750 MWh)
A special forum was held with customers consuming above 750MWh per annum centred on pricing impact and tariff structures. Customers were presented and asked to provide feedback on:
• Customers indicated a preference for our “Fully Cost Reflective” tariff option, with 57% marking this as their preference.
• Customer showed strong support for
Proposed a move to cost reflective tariffs for large users by:
• holding large user revenue constant to align our revenue with our share
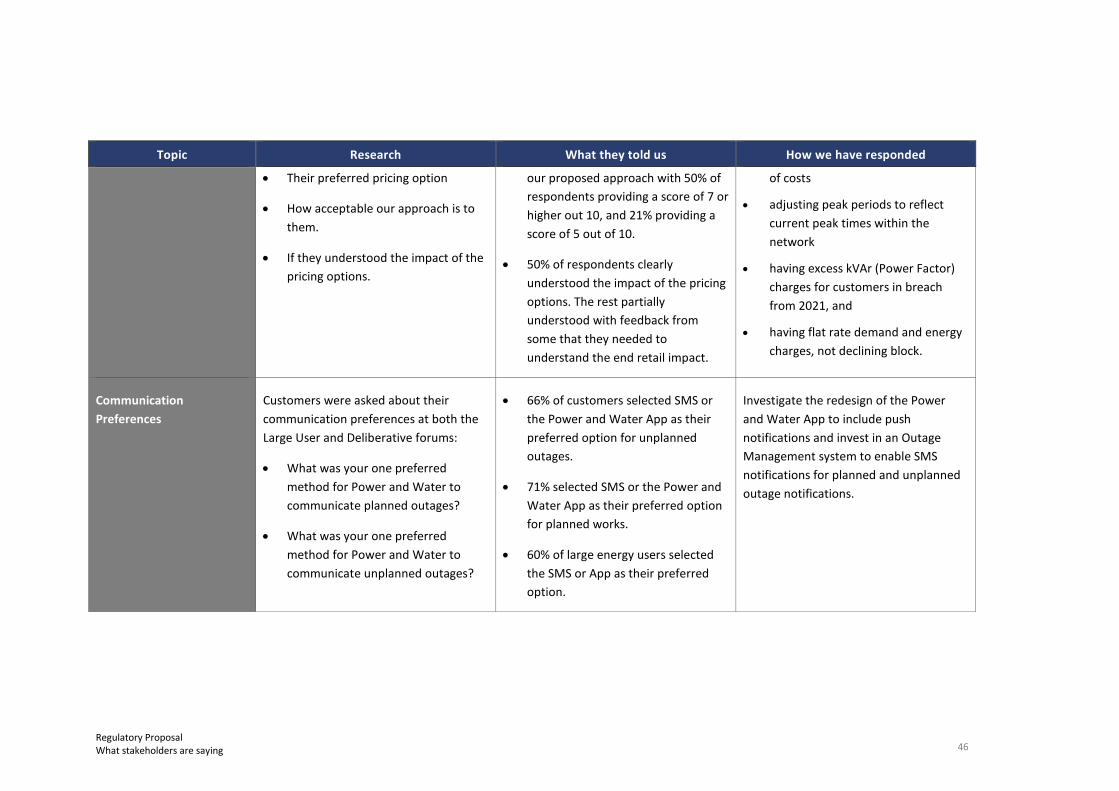
46 Regulatory Proposal What stakeholders are saying
Topic Research What they told us How we have responded
• Their preferred pricing option
• How acceptable our approach is to them.
• If they understood the impact of the pricing options.
our proposed approach with 50% of respondents providing a score of 7 or higher out 10, and 21% providing a score of 5 out of 10.
• 50% of respondents clearly understood the impact of the pricing options. The rest partially understood with feedback from some that they needed to understand the end retail impact.
of costs
• adjusting peak periods to reflect current peak times within the network
• having excess kVAr (Power Factor) charges for customers in breach from 2021, and
• having flat rate demand and energy charges, not declining block.
Communication Preferences
Customers were asked about their communication preferences at both the Large User and Deliberative forums:
• What was your one preferred method for Power and Water to communicate planned outages?
• What was your one preferred method for Power and Water to communicate unplanned outages?
• 66% of customers selected SMS or the Power and Water App as their preferred option for unplanned outages.
• 71% selected SMS or the Power and Water App as their preferred option for planned works.
• 60% of large energy users selected the SMS or App as their preferred option.
Investigate the redesign of the Power and Water App to include push notifications and invest in an Outage Management system to enable SMS notifications for planned and unplanned outage notifications.
47 Regulatory Proposal What Power and Water will deliver
7. What Power and Water will deliver
NT NER Nil
RIN Nil
Key messages
In the next regulatory period, we will:
• continue to focus on safety as our number one priority
• deliver lower average network bills
• continue to deliver operational efficiencies to minimise customer price impacts
• maintain reliable and responsive distribution services and improve reliability for poor performing rural and urban areas, and
• work with the NT Government to transition smoothly to the national regulatory framework.
7.1 Continue to focus on safety
The safety of our customers, community, staff and contractors remains our primary focus. Our expenditure plans in chapters 10 and 11 address our compliance obligations and include safety improvement measures.
Our strategy is to replicate safety success that has been achieved in other industries by further developing our safety culture. We have started by implementing our Health & Safety Strategy 2016-2020 and the WHS Culture Improvement Strategy 2016-2020.
7.2 Lower average prices and network bills
We understand the importance of electricity bills in NT household budgets and to NT businesses. Our regulatory proposal will deliver network bill savings (excluding the impact of inflation) for most customer categories:
• Small Households – 1.4 per cent or $16 reduction for a typical small residential customer consuming 8,500 kWh per year with an accumulation meter, or 2.1 per cent or $24 reduction if the customer has a smart meter. This customer class currently has retail price protection through the electricity Pricing Order, so our charges will not directly affect their retail electricity bill
48 Regulatory Proposal What Power and Water will deliver
• Large Household – 4.5 per cent or $82 reduction for a typical large residential customer consuming 15,000 kWh per year with an accumulation meter, or 16.2 per cent or $296 reduction if the customer has a smart meter. This customer class currently has retail price protection through the electricity Pricing Order, so our charges will not directly affect their retail electricity bill
• Small businesses – 4.9 per cent or $207 increase for a typical small business customer consuming 38,000 kWh per year with an accumulation meter, or 22.5 per cent or $959 reduction if the customer has a smart meter. This customer class currently has retail price protection through the electricity Pricing Order, so our charges will not directly affect their retail electricity bill
• Large business – 10.9 per cent or $9,758 reduction for a typical large business customer consuming 1,000,000 kWh per year.
7.3 Deliver on-going efficiency improvements
We are part-way through implementing a deliberate and sustainable program of transformation within our business.
Within the current regulatory period, we have met the challenge of the Ministerial Direction, which reduced our revenues by 17.5 per cent over the current regulatory period compared to the UC’s Final Determination – this is discussed further in section 5.1. In addition, we have included further planned efficiencies resulting from our business transformation program over the next regulatory period.
Our expenditure forecasts build on efficiencies that we have achieved and those that we plan to achieve over the next regulatory period.
7.4 Maintain reliable and responsive services
This regulatory proposal will enable us to continue to provide the reliable and responsive distribution services that our customers expect. It includes targeted investments across the three separate networks – including in new growth areas and in established areas where assets are ageing. Maintaining our asset condition is critically important to our customers’ long-term interests. We must efficiently replace and maintain our assets to provide safe and reliable services to our customers who depend on them for their residential, commercial and industrial needs.
This regulatory proposal also includes measures to improve metering and billing service outcomes, including by installing advanced meters with supporting ICT communications on a new and replacement basis.

49 Regulatory Proposal What Power and Water will deliver
We also propose investing in ICT systems to support improved customer interactions and the delivery of the services that our customers told us they value. This includes introducing new systems for: customer relationship management; meter data management; works management; and outage management.
7.5 Smooth transition to national regulatory framework
As discussed in chapter 4, the NT regulatory framework under which we operate is undergoing an unprecedented period of change. We are transitioning to compliance with this new framework.
Our regulatory proposal reflects our legislative and regulatory obligations as in force at 1 July 2017.22 We have detailed in chapter 4, and in Attachment 1.3, our understanding of the regulatory baseline upon which our forecasts are based.
There will be further changes to the NT regulatory framework before 1 July 2019 and we will continue to work with the NT Government to manage the transition and to understand implications for our customers and ourselves. We will provide further updates about the NT regulatory framework, including its implications for our expenditure forecasts, in our revised regulatory proposal.
We will manage any increased costs above the AER’s final distribution determination arising from any further regulatory changes after 1 July 2019 through pass through applications in the next regulatory period.
22 We have included in the regulatory baseline the new Electricity Industry Performance Code (Standards of Service
and Guaranteed Service Levels) that the Utilities Commission published on 25 October 2017. This updates, merges and replaces the Retail Supply Electricity Standards of Service Code and Guaranteed Service Level Code.
50 Regulatory Proposal Response to F&A paper
8. Response to F&A paper
NT NER
6.2.1 and 6.2.5 - Classification of services; 6.2.2 and 6.2.6 - Control Mechanisms; 6.8.1(b) - Contents of F&A paper; 6.8.2(c) - Elements of regulatory proposal; S6.1.3(3) to (5A) - Content of regulatory proposal for incentive schemes
RIN 1.1(d) and 2 - Service classification; 1.7 - Incentive schemes; 3 - Control mechanism
Key messages
We accept the AER’s proposed F&A paper in full, including its proposed:
• service classification
• control mechanisms for SCS and ACS
• application of the Efficiency Benefit Sharing Scheme (EBSS), the Capital Efficiency Sharing Scheme (CESS), the Demand Management Incentive Scheme (DMIS) and the Demand Management Innovation Allowance (DMIA) mechanism for SCS, and
• decision not to apply the Service Target Performance Incentive Scheme (STPIS), including the national Guaranteed Service Level (GSL) scheme, while the NT jurisdictional GSL scheme is in place.
We note the AER’s intention to apply:
• its expenditure forecast assessment guideline to assess our capex and opex forecasts for the next regulatory period, and
• forecast depreciation to determine the regulatory asset base (RAB) at the start of the subsequent regulatory period.
8.1 Service classification
The AER’s service classification determines which distribution services will be regulated by the AER.
In its F&A paper, the AER grouped our distribution services as follows for the next regulatory period:
• common distribution services
• ancillary services
• metering services
• connection services, and
• unregulated distribution services.
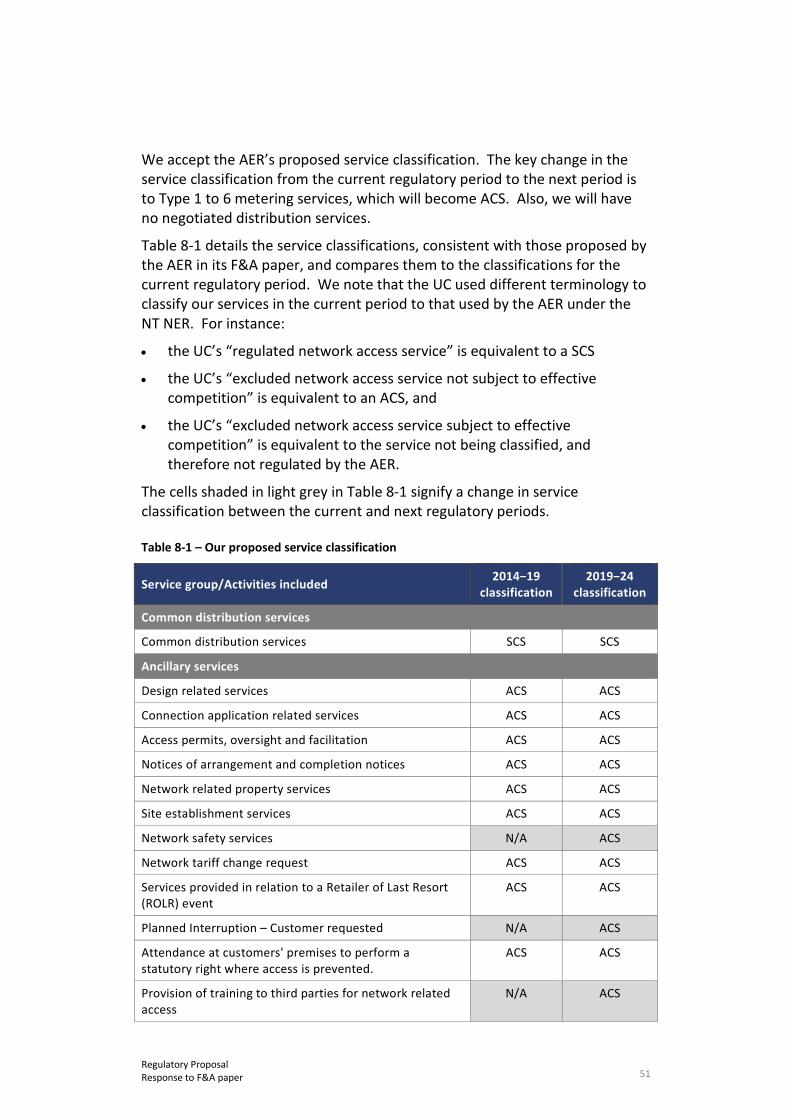
51 Regulatory Proposal Response to F&A paper
We accept the AER’s proposed service classification. The key change in the service classification from the current regulatory period to the next period is to Type 1 to 6 metering services, which will become ACS. Also, we will have no negotiated distribution services.
Table 8-1 details the service classifications, consistent with those proposed by the AER in its F&A paper, and compares them to the classifications for the current regulatory period. We note that the UC used different terminology to classify our services in the current period to that used by the AER under the NT NER. For instance:
• the UC’s “regulated network access service” is equivalent to a SCS
• the UC’s “excluded network access service not subject to effective competition” is equivalent to an ACS, and
• the UC’s “excluded network access service subject to effective competition” is equivalent to the service not being classified, and therefore not regulated by the AER.
The cells shaded in light grey in Table 8-1 signify a change in service classification between the current and next regulatory periods.
Table 8-1 – Our proposed service classification
Service group/Activities included 2014−19 classification
2019−24 classification
Common distribution services
Common distribution services SCS SCS
Ancillary services
Design related services ACS ACS
Connection application related services ACS ACS
Access permits, oversight and facilitation ACS ACS
Notices of arrangement and completion notices ACS ACS
Network related property services ACS ACS
Site establishment services ACS ACS
Network safety services N/A ACS
Network tariff change request ACS ACS
Services provided in relation to a Retailer of Last Resort (ROLR) event
ACS ACS
Planned Interruption – Customer requested N/A ACS
Attendance at customers' premises to perform a statutory right where access is prevented.
ACS ACS
Provision of training to third parties for network related access
N/A ACS
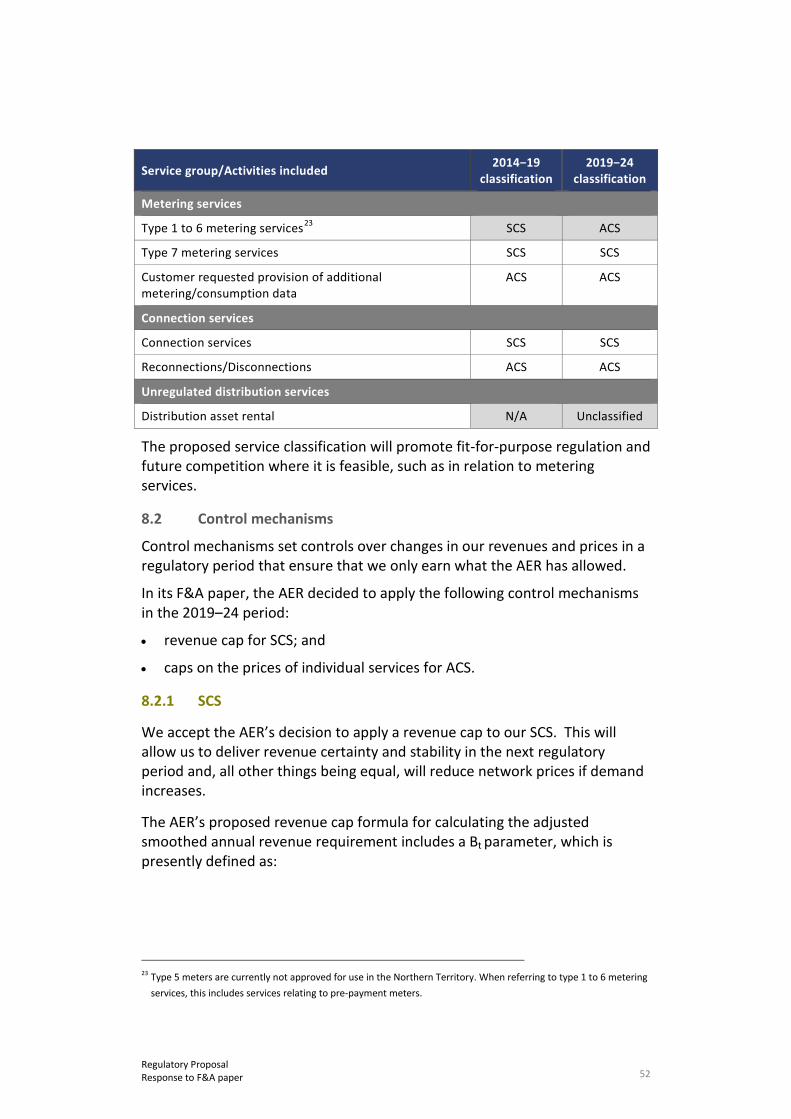
52 Regulatory Proposal Response to F&A paper
Service group/Activities included 2014−19 classification
2019−24 classification
Metering services
Type 1 to 6 metering services23 SCS ACS
Type 7 metering services SCS SCS
Customer requested provision of additional metering/consumption data
ACS ACS
Connection services
Connection services SCS SCS
Reconnections/Disconnections ACS ACS
Unregulated distribution services
Distribution asset rental N/A Unclassified
The proposed service classification will promote fit-for-purpose regulation and future competition where it is feasible, such as in relation to metering services.
8.2 Control mechanisms
Control mechanisms set controls over changes in our revenues and prices in a regulatory period that ensure that we only earn what the AER has allowed.
In its F&A paper, the AER decided to apply the following control mechanisms in the 2019–24 period:
• revenue cap for SCS; and
• caps on the prices of individual services for ACS.
8.2.1 SCS
We accept the AER’s decision to apply a revenue cap to our SCS. This will allow us to deliver revenue certainty and stability in the next regulatory period and, all other things being equal, will reduce network prices if demand increases.
The AER’s proposed revenue cap formula for calculating the adjusted smoothed annual revenue requirement includes a Bt parameter, which is presently defined as:
23 Type 5 meters are currently not approved for use in the Northern Territory. When referring to type 1 to 6 metering
services, this includes services relating to pre-payment meters.
53 Regulatory Proposal Response to F&A paper
the sum of annual adjustment factors in year t. Likely to incorporate but not limited to adjustments for the unders and overs account. To be decided in the distribution determination.’
The Bt parameter must properly account for under and over adjustments arising both:
• within the next regulatory period; and
• as a result of revenue increments or decrements caused by application of the current revenue cap at the end of the current regulatory period under the 2014 Network Price Determination, as modified by the Ministerial Direction.
Attachment 1.8 explains how we propose to adjust prices each year to comply with:
• the control mechanisms in accordance with clause 6.12.1(13), and
• reporting and compliance with designated pricing proposal changes in accordance with clause 6.12.1(19).
Attachment 1.8 also discusses the operation of the “unders” and “overs” mechanism under a revenue cap.
8.2.2 ACS
The AER has decided to apply price caps to our ACS in the next regulatory period. We accept this decision, but note:
• this is a change from the treatment of ACS in the current regulatory period, whereby clause 72(4) of the Electricity Networks (Third Party Access) Code 2015 requires us to provide ACS on fair and reasonable terms, and
• this is a change in the treatment of metering services, which are classified as regulated network access services (i.e. the equivalent of SCS) in the current regulatory period, and so are subject to a revenue cap.
We accept the AER’s approach to the formulae for giving effect to the price caps for:
• type 1–6 metering services
• ancillary fee based services, and
• ancillary quoted services.
8.3 Incentive schemes
We accept the AER’s proposal:
54 Regulatory Proposal Response to F&A paper
• to apply the EBSS, the CESS, the DMIS and DMIA mechanism to SCS in the next regulatory period, and
• not to apply the STPIS, including the GSL component of the national scheme while NT jurisdictional GSL scheme is in place.
These incentive schemes are discussed further in chapter 15.
8.4 Expenditure forecast assessment guideline
We note the AER’s intention to apply its expenditure forecast assessment guideline to assess our capex and opex forecasts for the next regulatory period. We have had regard to this guideline in preparing our capex and opex forecasts.
8.5 Regulatory depreciation to establish RAB for subsequent period
We note the AER’s intention to apply forecast depreciation to determine our RAB at the start of the subsequent regulatory period, commencing on 1 July 2024. Our proposed approach to determining the regulatory depreciation building block for the next regulatory period is set out in chapter 12.
55 Regulatory Proposal Demand forecasts
9. Demand forecasts
NT NER 6.5.6(a) - Opex forecasts meet or manage expected demand; 6.5.7(a) - Capex forecasts meet or manage expected demand
RIN 6.2(a)-(e), 12.9(b), 17 - Demand forecasts
Key messages
• We commissioned the AEMO to forecast demand for the next regulatory period and have accepted and applied its forecasts in this regulatory proposal.
• AEMO forecasts demand on our Darwin-Katherine network will be impacted by a reduction in economic activity following the completion of the construction phase of a major gas development project from late 2018 and the increased penetration of rooftop PV capacity, although new industrial and residential developments in and around Darwin will contribute to maximum demand growth at four of the zone substations.
• AEMO forecasts demand on our Alice Springs network will be impacted by negative population growth and the increased penetration of rooftop PV.
• AEMO forecasts demand on the Tennant Creek network will increase after 2018 due to additional loads supporting the Northern Gas Pipeline project.
9.1 Overview of forecasts for next regulatory period
We engaged AEMO to prepare four types of forecasts:
• regional maximum demand
• zone substation maximum demand
• energy consumption, and
• customer connections.
AEMO prepared systemwide forecasts, as well as forecasts for each of the three networks: Darwin-Katherine; Tennant Creek; and Alice Springs.24 Table 9-1 summarises AEMO’s system-wide forecasts for the next regulatory period.
24 Power and Water Corporation Maximum Demand, Energy Consumption and Connections Forecasts - 2017
implementation of forecasting procedure, September 2017
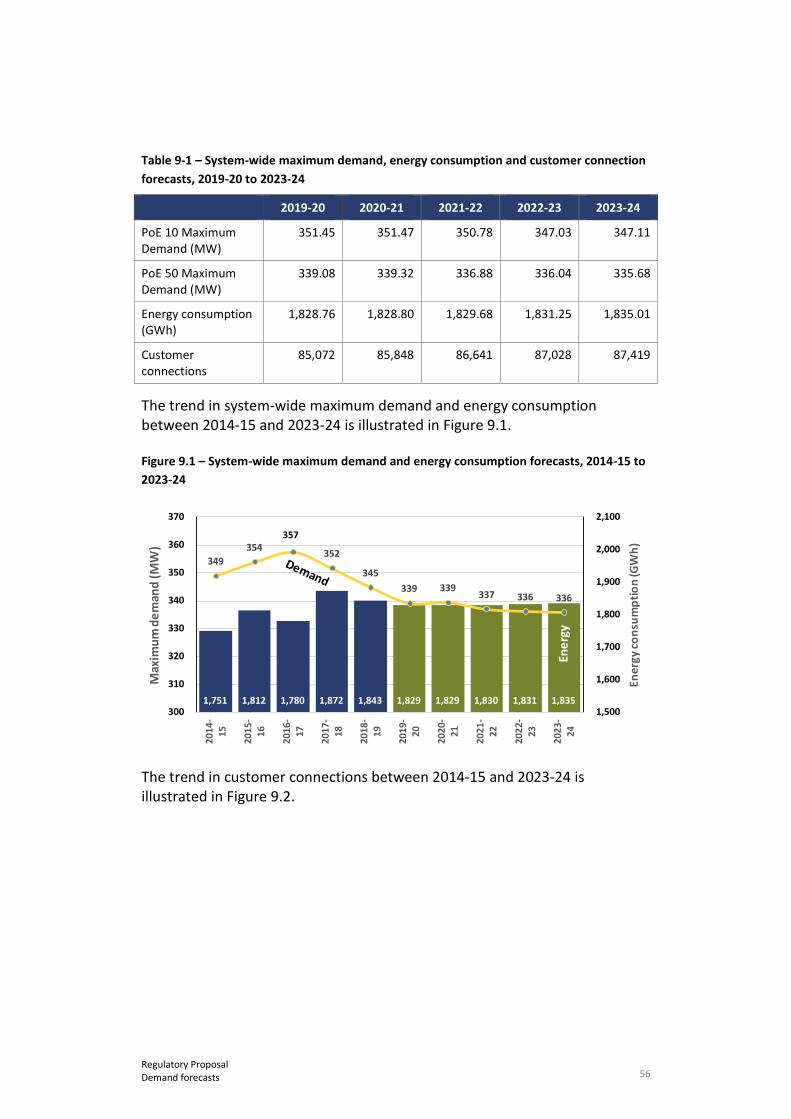
56 Regulatory Proposal Demand forecasts
Table 9-1 – System-wide maximum demand, energy consumption and customer connection forecasts, 2019-20 to 2023-24
2019-20 2020-21 2021-22 2022-23 2023-24
PoE 10 Maximum Demand (MW)
351.45 351.47 350.78 347.03 347.11
PoE 50 Maximum Demand (MW)
339.08 339.32 336.88 336.04 335.68
Energy consumption (GWh)
1,828.76 1,828.80 1,829.68 1,831.25 1,835.01
Customer connections
85,072 85,848 86,641 87,028 87,419
The trend in system-wide maximum demand and energy consumption between 2014-15 and 2023-24 is illustrated in Figure 9.1.
Figure 9.1 – System-wide maximum demand and energy consumption forecasts, 2014-15 to 2023-24
The trend in customer connections between 2014-15 and 2023-24 is illustrated in Figure 9.2.
1,751 1,812 1,780 1,872 1,843 1,829 1,829 1,830 1,831 1,835
349354
357
352
345339 339
337 336 336
1,500
1,600
1,700
1,800
1,900
2,000
2,100
300
310
320
330
340
350
360
370
2014
-15
2015
-16
2016
-17
2017
-18
2018
-19
2019
-20
2020
-21
2021
-22
2022
-23
2023
-24
Ener
gy co
nsum
ptio
n (G
Wh)
Max
imum
dem
and
(MW
)
Ener
gy
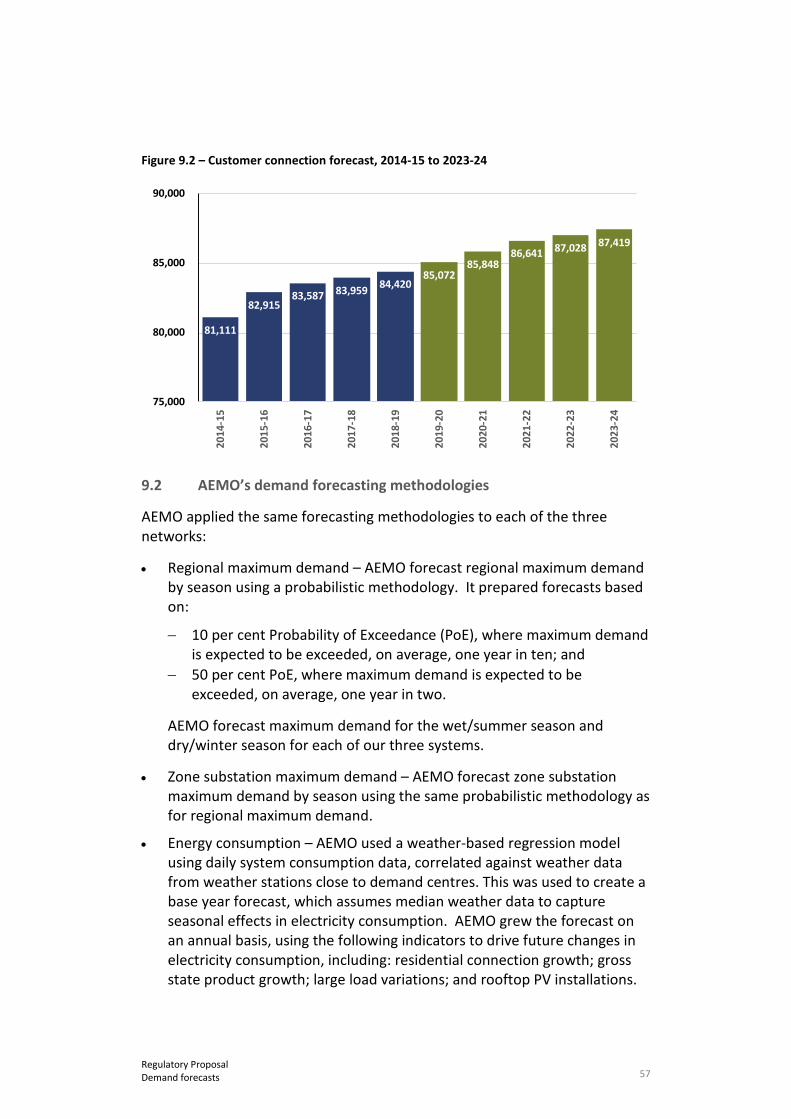
57 Regulatory Proposal Demand forecasts
Figure 9.2 – Customer connection forecast, 2014-15 to 2023-24
9.2 AEMO’s demand forecasting methodologies
AEMO applied the same forecasting methodologies to each of the three networks:
• Regional maximum demand – AEMO forecast regional maximum demand by season using a probabilistic methodology. It prepared forecasts based on:
− 10 per cent Probability of Exceedance (PoE), where maximum demand is expected to be exceeded, on average, one year in ten; and
− 50 per cent PoE, where maximum demand is expected to be exceeded, on average, one year in two.
AEMO forecast maximum demand for the wet/summer season and dry/winter season for each of our three systems.
• Zone substation maximum demand – AEMO forecast zone substation maximum demand by season using the same probabilistic methodology as for regional maximum demand.
• Energy consumption – AEMO used a weather-based regression model using daily system consumption data, correlated against weather data from weather stations close to demand centres. This was used to create a base year forecast, which assumes median weather data to capture seasonal effects in electricity consumption. AEMO grew the forecast on an annual basis, using the following indicators to drive future changes in electricity consumption, including: residential connection growth; gross state product growth; large load variations; and rooftop PV installations.
81,111
82,91583,587 83,959 84,420
85,07285,848
86,641 87,028 87,419
75,000
80,000
85,000
90,000
2014
-15
2015
-16
2016
-17
2017
-18
2018
-19
2019
-20
2020
-21
2021
-22
2022
-23
2023
-24
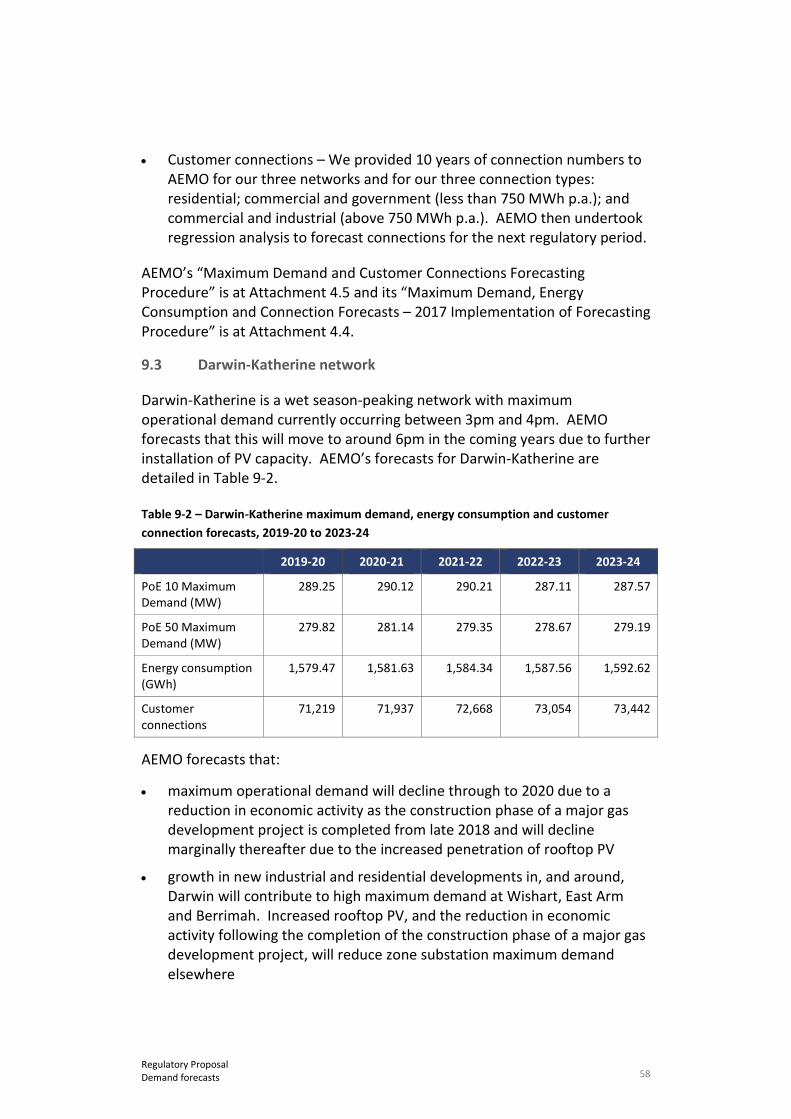
58 Regulatory Proposal Demand forecasts
• Customer connections – We provided 10 years of connection numbers to AEMO for our three networks and for our three connection types: residential; commercial and government (less than 750 MWh p.a.); and commercial and industrial (above 750 MWh p.a.). AEMO then undertook regression analysis to forecast connections for the next regulatory period.
AEMO’s “Maximum Demand and Customer Connections Forecasting Procedure” is at Attachment 4.5 and its “Maximum Demand, Energy Consumption and Connection Forecasts – 2017 Implementation of Forecasting Procedure” is at Attachment 4.4.
9.3 Darwin-Katherine network
Darwin-Katherine is a wet season-peaking network with maximum operational demand currently occurring between 3pm and 4pm. AEMO forecasts that this will move to around 6pm in the coming years due to further installation of PV capacity. AEMO’s forecasts for Darwin-Katherine are detailed in Table 9-2.
Table 9-2 – Darwin-Katherine maximum demand, energy consumption and customer connection forecasts, 2019-20 to 2023-24
2019-20 2020-21 2021-22 2022-23 2023-24
PoE 10 Maximum Demand (MW)
289.25 290.12 290.21 287.11 287.57
PoE 50 Maximum Demand (MW)
279.82 281.14 279.35 278.67 279.19
Energy consumption (GWh)
1,579.47 1,581.63 1,584.34 1,587.56 1,592.62
Customer connections
71,219 71,937 72,668 73,054 73,442
AEMO forecasts that:
• maximum operational demand will decline through to 2020 due to a reduction in economic activity as the construction phase of a major gas development project is completed from late 2018 and will decline marginally thereafter due to the increased penetration of rooftop PV
• growth in new industrial and residential developments in, and around, Darwin will contribute to high maximum demand at Wishart, East Arm and Berrimah. Increased rooftop PV, and the reduction in economic activity following the completion of the construction phase of a major gas development project, will reduce zone substation maximum demand elsewhere

59 Regulatory Proposal Demand forecasts
• annual consumption for Darwin–Katherine will decline in 2019–20 due to a reduction in industrial load (again attributable to the reduction in economic activity following the completion of the construction phase of a major gas development project) but will increase thereafter due to forecast population growth25, and
• customer connections will show good alignment with historical trends.26
9.4 Alice Springs network
Alice Springs is also a summer -peaking network with maximum operational demand currently occurring between 3pm and 4pm. AEMO forecasts that this will move to between 4pm and 5pm in the coming years due to further installation of PV capacity. Although it has both cooling and heating loads, Alice Springs’ winter peak is, on average, 25 per cent below the summer peak. AEMO’s forecasts for Alice Springs are detailed in Table 9-3.
Table 9-3 – Alice Springs maximum demand, energy consumption and customer connection forecasts, 2019-20 to 2023-24
2019-20 2020-21 2021-22 2022-23 2023-24
PoE 10 Maximum Demand (MW)
52.49 51.58 50.83 50.26 49.93
PoE 50 Maximum Demand (MW)
50.09 49.04 48.30 48.19 47.31
Energy consumption (GWh)
211.91 209.72 207.77 206.01 204.58
Customer connections
12,217 12,253 12,296 12,282 12,274
AEMO forecasts that negative population growth and increased penetration of rooftop PV at Alice Springs will result in:
• progressively declining maximum operational demand;
• declining zone substation growth rates; and
• declining annual consumption.
AEMO forecasts that customer connections will show good alignment with historical trends.27
25 AEMO sourced the population growth forecast from the NT 2017–18 Budget Paper. 26 Power and Water Corporation Maximum Demand, Energy Consumption and Connections Forecasts - 2017
implementation of forecasting procedure, September 2017, pages 5-11.
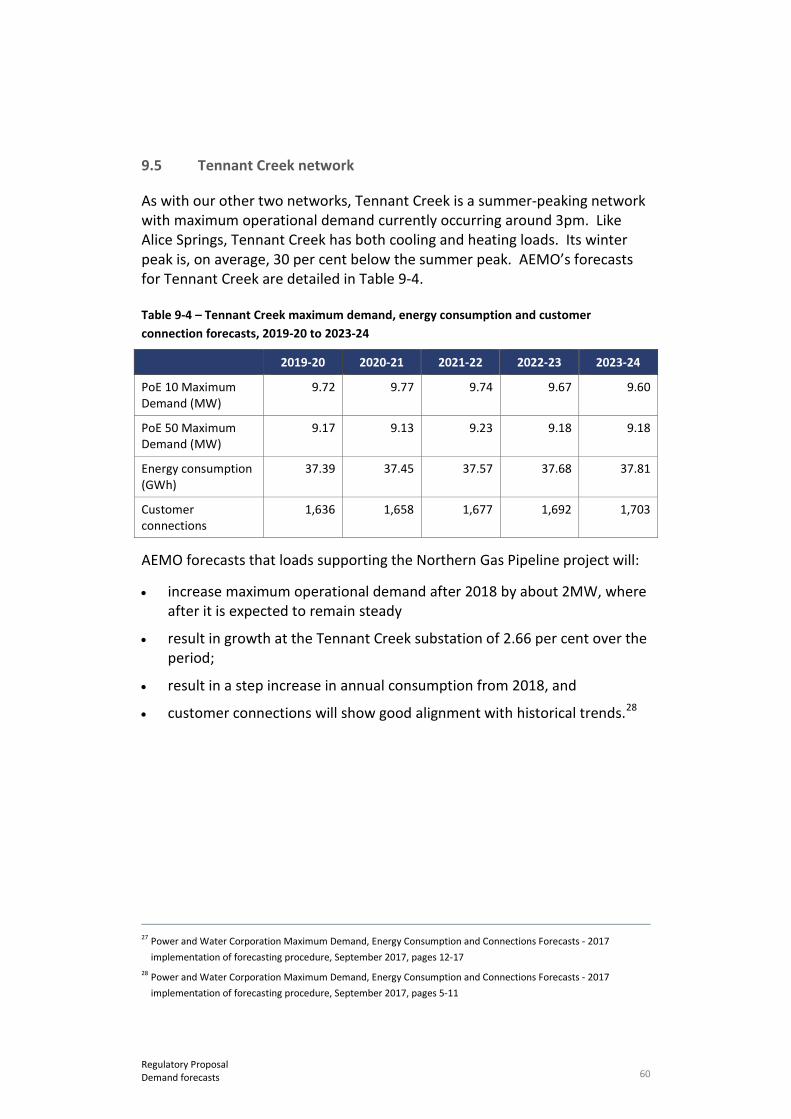
60 Regulatory Proposal Demand forecasts
9.5 Tennant Creek network
As with our other two networks, Tennant Creek is a summer-peaking network with maximum operational demand currently occurring around 3pm. Like Alice Springs, Tennant Creek has both cooling and heating loads. Its winter peak is, on average, 30 per cent below the summer peak. AEMO’s forecasts for Tennant Creek are detailed in Table 9-4.
Table 9-4 – Tennant Creek maximum demand, energy consumption and customer connection forecasts, 2019-20 to 2023-24
2019-20 2020-21 2021-22 2022-23 2023-24
PoE 10 Maximum Demand (MW)
9.72 9.77 9.74 9.67 9.60
PoE 50 Maximum Demand (MW)
9.17 9.13 9.23 9.18 9.18
Energy consumption (GWh)
37.39 37.45 37.57 37.68 37.81
Customer connections
1,636 1,658 1,677 1,692 1,703
AEMO forecasts that loads supporting the Northern Gas Pipeline project will:
• increase maximum operational demand after 2018 by about 2MW, where after it is expected to remain steady
• result in growth at the Tennant Creek substation of 2.66 per cent over the period;
• result in a step increase in annual consumption from 2018, and
• customer connections will show good alignment with historical trends.28
27 Power and Water Corporation Maximum Demand, Energy Consumption and Connections Forecasts - 2017
implementation of forecasting procedure, September 2017, pages 12-17 28 Power and Water Corporation Maximum Demand, Energy Consumption and Connections Forecasts - 2017
implementation of forecasting procedure, September 2017, pages 5-11

61 Regulatory Proposal Capex forecasts
10. Capex forecasts
NT NER 6.5.7 - Forecast capex; 6.7A and 6.8.2(c)(5A) - Connection policies; S6.1.1 - Information and matters re capex; S6.1.3(1) - Forecast capex and opex interactions
RIN 1.4(b) and 1.5 - Material assumptions; 4.1 - Justification of total capex; 4.2 - Capex model and methodology; 4.3 - Determining capex forecasts; 4.4 - Capex deliverability; 4.5 - Capex categories; 5 - Repex; 6 - Augex; 7 - Connections; 8 - Non-network alternatives; 9 - Forecast input price changes; 12.9(a) - Alignment of capex in RIN and regulatory proposal; 17.3(r)-(s) - Demand-related capex; 19 - Contingent projects
Key messages
• We are proposing an increase in net capex (excluding metering) for the next regulatory period to $383.0 million, compared with estimated net capex of $302.9 million in the current regulatory period.
• Just less than half of our net capex forecast (38.8 per cent) is for asset replacement, which is a significant decrease from the current period (57.9 per cent) due to improved asset management practices, and a more targeted approach to managing our highest risk assets. We have validated our Repex forecast using the AER’s Repex model.
• Peak load is declining overall, however growth is evident in some localized areas. We are proposing targeted Augex projects to meet our expected demand, as forecast by AEMO, including in the areas of Wishart, East Arm and Berrimah.
• Our Connections capex forecast is stable from the current regulatory period and reflects AEMO’s forecast connection volumes and historical connection unit rates. Our gifted assets’ forecast reflects current levels.
• Our ICT capex focuses on: responding to customer and stakeholder feedback to improve customer service outcomes; upgrading systems to support our network operations in line with industry standards; improving the accuracy and integrity of our core systems; refreshing applications and infrastructure in-line with industry practices; implementing tools to improve the reliability of enterprise data and reporting function capability.
• Our non-network other capex relates to fleet, buildings and property and tools and equipment, consistent with other networks, that are necessary to deliver customer outcomes. From 1 July 2019, we will start to capitalise leases in accordance with new Australian Accounting Standards.
• We have forecast our capitalised overheads using the base-step-trend approach applied to opex. We capitalise network and corporate overheads in proportion to the ratio of direct capex to total direct costs in the base year, as set out in our CAM.
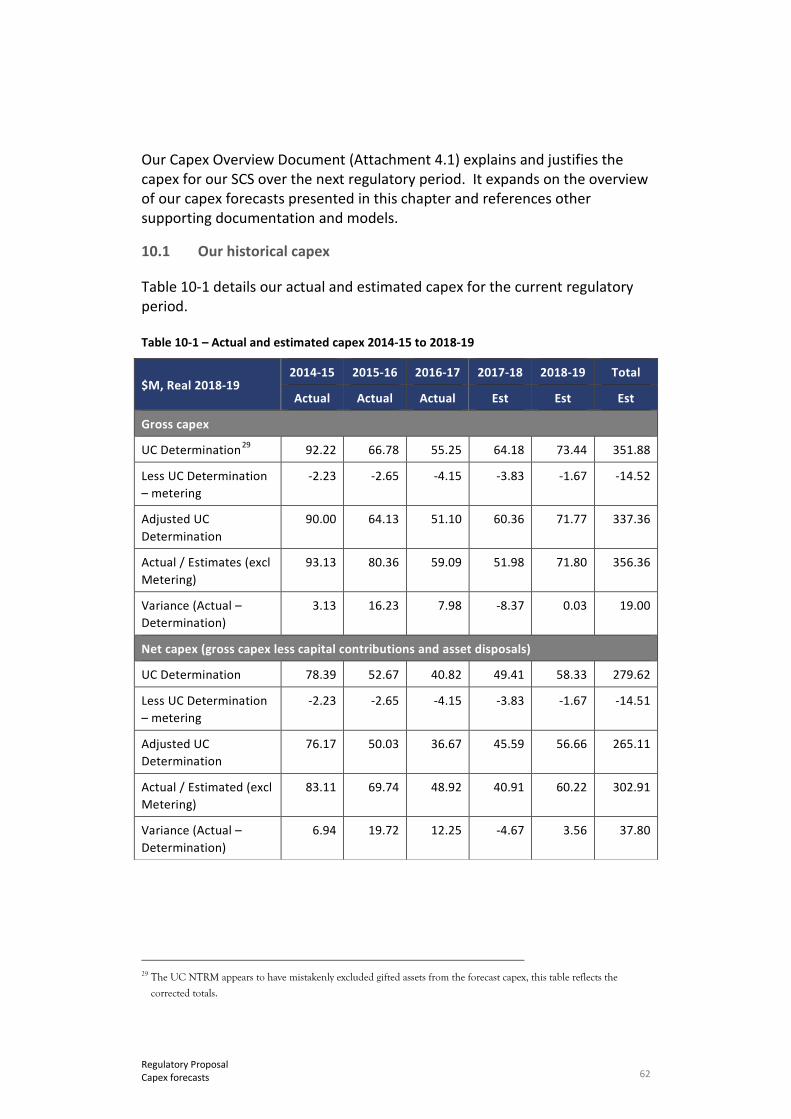
62 Regulatory Proposal Capex forecasts
Our Capex Overview Document (Attachment 4.1) explains and justifies the capex for our SCS over the next regulatory period. It expands on the overview of our capex forecasts presented in this chapter and references other supporting documentation and models.
10.1 Our historical capex
Table 10-1 details our actual and estimated capex for the current regulatory period.
Table 10-1 – Actual and estimated capex 2014-15 to 2018-19
$M, Real 2018-19 2014-15 2015-16 2016-17 2017-18 2018-19 Total
Actual Actual Actual Est Est Est
Gross capex
UC Determination29 92.22 66.78 55.25 64.18 73.44 351.88
Less UC Determination – metering
-2.23 -2.65 -4.15 -3.83 -1.67 -14.52
Adjusted UC Determination
90.00 64.13 51.10 60.36 71.77 337.36
Actual / Estimates (excl Metering)
93.13 80.36 59.09 51.98 71.80 356.36
Variance (Actual – Determination)
3.13 16.23 7.98 -8.37 0.03 19.00
Net capex (gross capex less capital contributions and asset disposals)
UC Determination 78.39 52.67 40.82 49.41 58.33 279.62
Less UC Determination – metering
-2.23 -2.65 -4.15 -3.83 -1.67 -14.51
Adjusted UC Determination
76.17 50.03 36.67 45.59 56.66 265.11
Actual / Estimated (excl Metering)
83.11 69.74 48.92 40.91 60.22 302.91
Variance (Actual – Determination)
6.94 19.72 12.25 -4.67 3.56 37.80
29 The UC NTRM appears to have mistakenly excluded gifted assets from the forecast capex, this table reflects the
corrected totals.
63 Regulatory Proposal Capex forecasts
We expect our net capex to be 6 per cent above the UC allowance for the period (excluding the impact of the transfer of corporate assets of $19.77 million). Our capex shows a generally decreasing year-on-year trend, although there is a step-up in 2018-19. This step-up is because, prior to 2018-19, the Power Networks’ business incurred an allocation of costs for the use of assets held at the corporate level. The value of the allocation was commensurate with the depreciation associated with these assets. These assets have now been acquired for regulatory purposes to the Power Networks’ business, which results in a $19.77 million (Real 2018-19) increase in 2018-19 – this is discussed further in section 12.2.2. The decreasing trend in the remainder of our capex reflects an efficient resourcing and delivery approach, whilst maintaining an acceptable corporate risk profile.
Our capex program has delivered:
• improved customer reliability and improved staff safety through the replacement of poor condition assets, including high risk oil filled switchgear at distribution and zone substations
• contributed to a reduced maintenance spend associated with the installation of modern equipment
• met the demand requirements of localised growth, especially in the Palmerston area, and
• improved system resilience to extreme events – this includes transmission line works at Elizabeth River and additional works at Hudson Creek zone substation, including primary system configuration, replacements and secondary system upgrades.
The areas of overspend against our capex allowance were contributed by:
• developing our understanding of our actual costs, where our recording systems did not provide a reliable estimate of our project costs and our cost management practices were not consistent, and
• maturing asset management and risk management practices.
We have implemented several improvements to address these issues, including by:
• improving the application of our capital investment framework, including establishing a project management office and strengthening project gating and governance framework
• strengthening our capability in financial and regulatory management, including by establishing a regulatory team dedicated to supporting the network

64 Regulatory Proposal Capex forecasts
• improving our cost management and accounting practices, including by developing our capability in our field crews to capture cost information from projects, and
• continuing to mature our asset management and risk management approach to assist us to understand and prioritise our response to emerging risks, as well as ensure positive customer outcomes.
10.2 Key capex assumptions
The key assumptions underpinning our capex forecasts are detailed in Table 10-2. Our Directors have certified the reasonableness of these key assumptions in accordance with clause S6.1.1(5) of the NT NER, as discussed in Chapter 24.
Table 10-2 – Key capex assumptions
Issue Assumption
1. Company structure and ownership arrangements
Our forecasts reflect Power and Water’s current company structure and ownership arrangements.
2. Regulatory obligations and requirements
Our forecasts are based on legislative and regulatory instruments applicable to Power and Water and as in force on 1 July 2017.30
3. Security of supply and network reliability
Our forecasts will maintain, but will not improve, system-wide security of supply and network reliability, consistent with clause 6.5.7 of the NT NER.
4. Service classification Our forecasts reflect the service classification in the AER’s F&A paper.
5. Maximum demand, customer and connection growth
Our forecasts are required to meet the maximum demand, customer and connection growth forecasts prepared by AEMO. As the independent market operator, AEMO’s forecasts are reasonable and credible.
6. Connections policy Our forecasts reflect Power and Water’s proposed new connections policy that complies with Chapter 5A of the NT NER.
7. Cost allocation and capitalisation
Our forecasts reflect the cost allocation method that has been submitted to the AER, which includes our approach to capitalisation.
30 We have included in the regulatory baseline the new Electricity Industry Performance Code (Standards of Service
and Guaranteed Service Levels) that the UC published on 25 October 2017. This updates, merges and replaces the Retail Supply Electricity Standards of Service Code and Guaranteed Service Level Code.
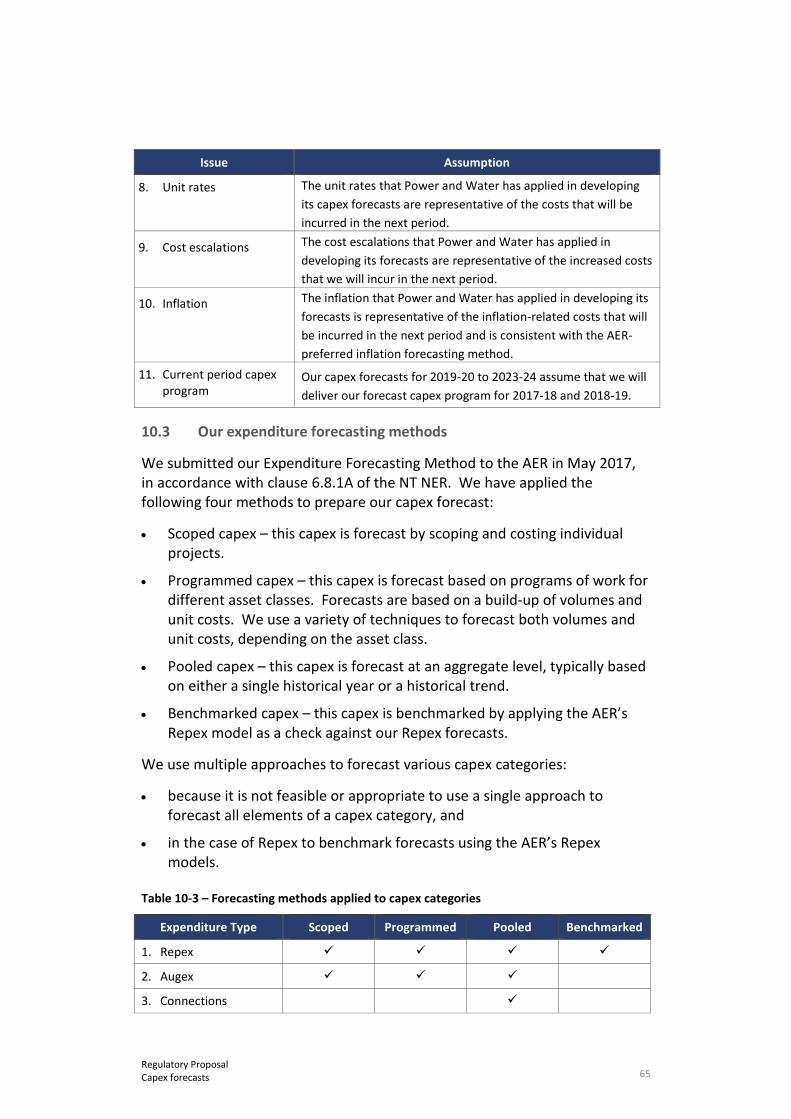
65 Regulatory Proposal Capex forecasts
Issue Assumption
8. Unit rates The unit rates that Power and Water has applied in developing its capex forecasts are representative of the costs that will be incurred in the next period.
9. Cost escalations The cost escalations that Power and Water has applied in developing its forecasts are representative of the increased costs that we will incur in the next period.
10. Inflation The inflation that Power and Water has applied in developing its forecasts is representative of the inflation-related costs that will be incurred in the next period and is consistent with the AER-preferred inflation forecasting method.
11. Current period capex program
Our capex forecasts for 2019-20 to 2023-24 assume that we will deliver our forecast capex program for 2017-18 and 2018-19.
10.3 Our expenditure forecasting methods
We submitted our Expenditure Forecasting Method to the AER in May 2017, in accordance with clause 6.8.1A of the NT NER. We have applied the following four methods to prepare our capex forecast:
• Scoped capex – this capex is forecast by scoping and costing individual projects.
• Programmed capex – this capex is forecast based on programs of work for different asset classes. Forecasts are based on a build-up of volumes and unit costs. We use a variety of techniques to forecast both volumes and unit costs, depending on the asset class.
• Pooled capex – this capex is forecast at an aggregate level, typically based on either a single historical year or a historical trend.
• Benchmarked capex – this capex is benchmarked by applying the AER’s Repex model as a check against our Repex forecasts.
We use multiple approaches to forecast various capex categories:
• because it is not feasible or appropriate to use a single approach to forecast all elements of a capex category, and
• in the case of Repex to benchmark forecasts using the AER’s Repex models.
Table 10-3 – Forecasting methods applied to capex categories
Expenditure Type Scoped Programmed Pooled Benchmarked
1. Repex
2. Augex
3. Connections
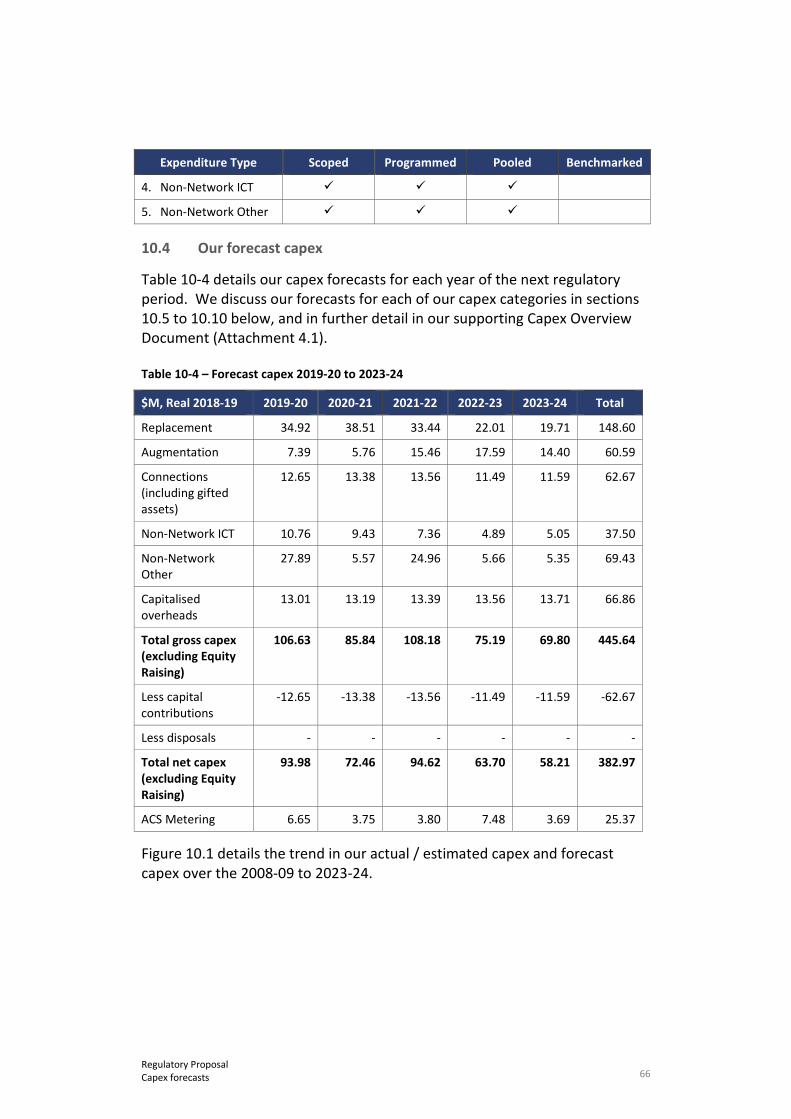
66 Regulatory Proposal Capex forecasts
Expenditure Type Scoped Programmed Pooled Benchmarked
4. Non-Network ICT
5. Non-Network Other
10.4 Our forecast capex
Table 10-4 details our capex forecasts for each year of the next regulatory period. We discuss our forecasts for each of our capex categories in sections 10.5 to 10.10 below, and in further detail in our supporting Capex Overview Document (Attachment 4.1).
Table 10-4 – Forecast capex 2019-20 to 2023-24
$M, Real 2018-19 2019-20 2020-21 2021-22 2022-23 2023-24 Total
Replacement 34.92 38.51 33.44 22.01 19.71 148.60
Augmentation 7.39 5.76 15.46 17.59 14.40 60.59
Connections (including gifted assets)
12.65 13.38 13.56 11.49 11.59 62.67
Non-Network ICT 10.76 9.43 7.36 4.89 5.05 37.50
Non-Network Other
27.89 5.57 24.96 5.66 5.35 69.43
Capitalised overheads
13.01 13.19 13.39 13.56 13.71 66.86
Total gross capex (excluding Equity Raising)
106.63 85.84 108.18 75.19 69.80 445.64
Less capital contributions
-12.65 -13.38 -13.56 -11.49 -11.59 -62.67
Less disposals - - - - - -
Total net capex (excluding Equity Raising)
93.98 72.46 94.62 63.70 58.21 382.97
ACS Metering 6.65 3.75 3.80 7.48 3.69 25.37
Figure 10.1 details the trend in our actual / estimated capex and forecast capex over the 2008-09 to 2023-24.
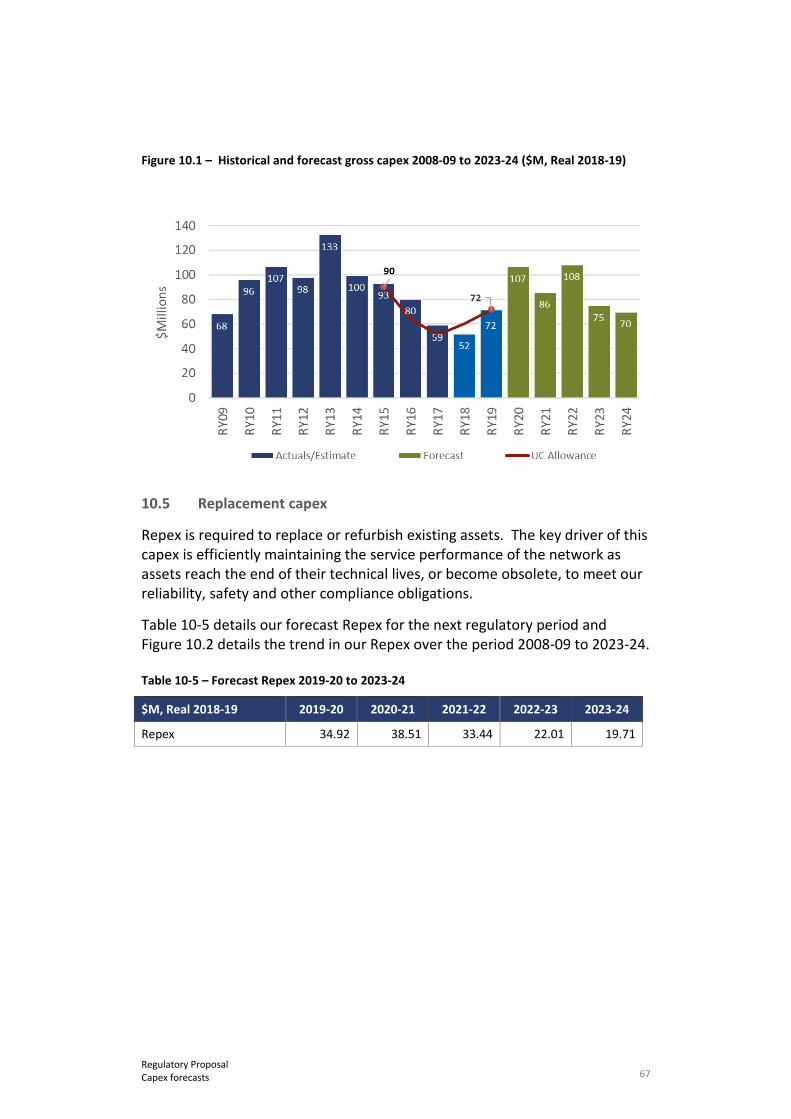
67 Regulatory Proposal Capex forecasts
Figure 10.1 – Historical and forecast gross capex 2008-09 to 2023-24 ($M, Real 2018-19)
10.5 Replacement capex
Repex is required to replace or refurbish existing assets. The key driver of this capex is efficiently maintaining the service performance of the network as assets reach the end of their technical lives, or become obsolete, to meet our reliability, safety and other compliance obligations.
Table 10-5 details our forecast Repex for the next regulatory period and Figure 10.2 details the trend in our Repex over the period 2008-09 to 2023-24.
Table 10-5 – Forecast Repex 2019-20 to 2023-24
$M, Real 2018-19 2019-20 2020-21 2021-22 2022-23 2023-24
Repex 34.92 38.51 33.44 22.01 19.71

68 Regulatory Proposal Capex forecasts
Figure 10.2 – Historical and forecast Repex 2008-09 to 2023-24 ($M, Real 2018-19)
Our Repex forecast comprises projects and programs driven by:
• Condition and risk – replacement projects and programs to address an identified condition, technical obsolescence or risk to safety and continuity of supply
• Compliance driven – replacement projects to meet the requirements of the Network Technical Code and Planning Criteria (Attachment 4.2), and
• Reliability and quality of supply – replacement projects that are required to meet a particular reliability and power quality obligation or technical standard, including in response to customer feedback.
Key repex projects include: replacing the Berrimah zone substation that is at the end of its serviceable life; high voltage cable replacement for safety reasons; replacing corroded poles in Alice Springs; and replacing multiple minor asset classes that fail in service or where inspection has identified condition failure.
Table 10-6 provides a breakdown of our Repex forecast for the next regulatory period by these three categories.
Table 10-6 – Breakdown of forecast Repex 2019-20 to 2023-24
$M, Real 2018-19 2019-20 2020-21 2021-22 2022-23 2023-24 Total
Condition and risk driven
31.84 36.11 31.79 21.20 18.88 139.82
Compliance driven 2.55 1.87 1.11 0.27 0.28 6.08
Reliability & quality 0.53 0.53 0.54 0.54 0.55 2.69
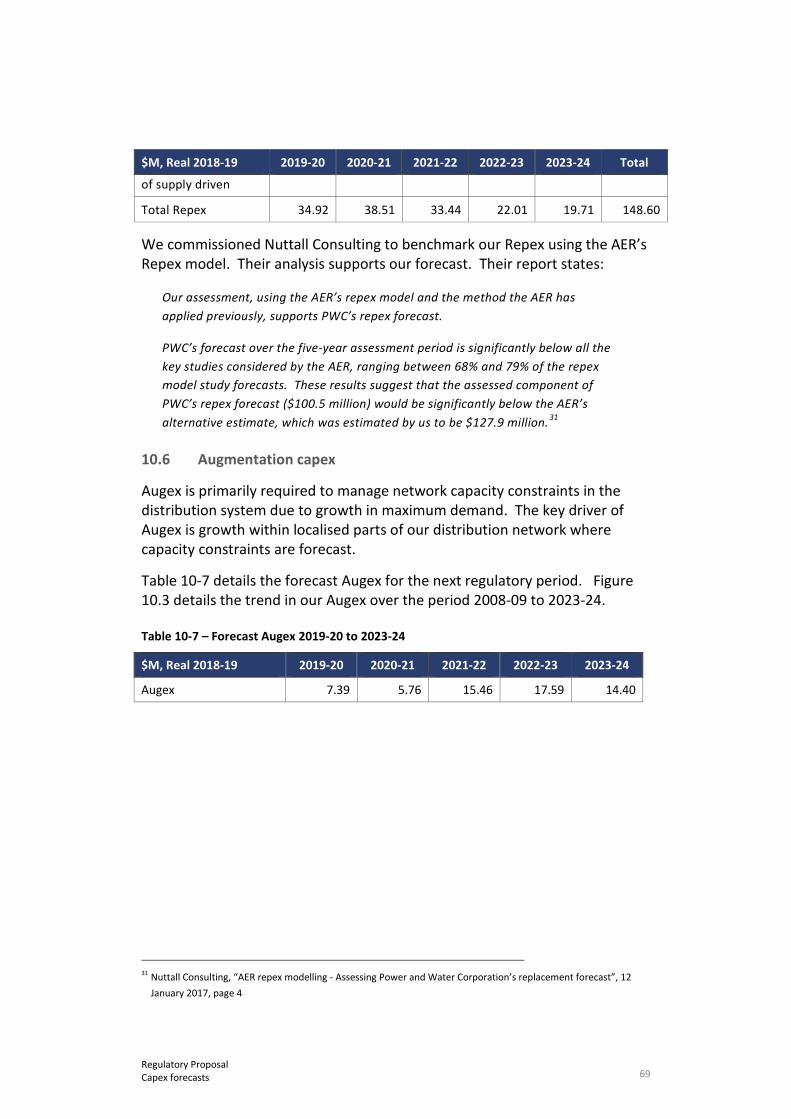
69 Regulatory Proposal Capex forecasts
$M, Real 2018-19 2019-20 2020-21 2021-22 2022-23 2023-24 Total
of supply driven
Total Repex 34.92 38.51 33.44 22.01 19.71 148.60
We commissioned Nuttall Consulting to benchmark our Repex using the AER’s Repex model. Their analysis supports our forecast. Their report states:
Our assessment, using the AER’s repex model and the method the AER has applied previously, supports PWC’s repex forecast.
PWC’s forecast over the five-year assessment period is significantly below all the key studies considered by the AER, ranging between 68% and 79% of the repex model study forecasts. These results suggest that the assessed component of PWC’s repex forecast ($100.5 million) would be significantly below the AER’s alternative estimate, which was estimated by us to be $127.9 million.31
10.6 Augmentation capex
Augex is primarily required to manage network capacity constraints in the distribution system due to growth in maximum demand. The key driver of Augex is growth within localised parts of our distribution network where capacity constraints are forecast.
Table 10-7 details the forecast Augex for the next regulatory period. Figure 10.3 details the trend in our Augex over the period 2008-09 to 2023-24.
Table 10-7 – Forecast Augex 2019-20 to 2023-24
$M, Real 2018-19 2019-20 2020-21 2021-22 2022-23 2023-24
Augex 7.39 5.76 15.46 17.59 14.40
31 Nuttall Consulting, “AER repex modelling - Assessing Power and Water Corporation’s replacement forecast”, 12
January 2017, page 4
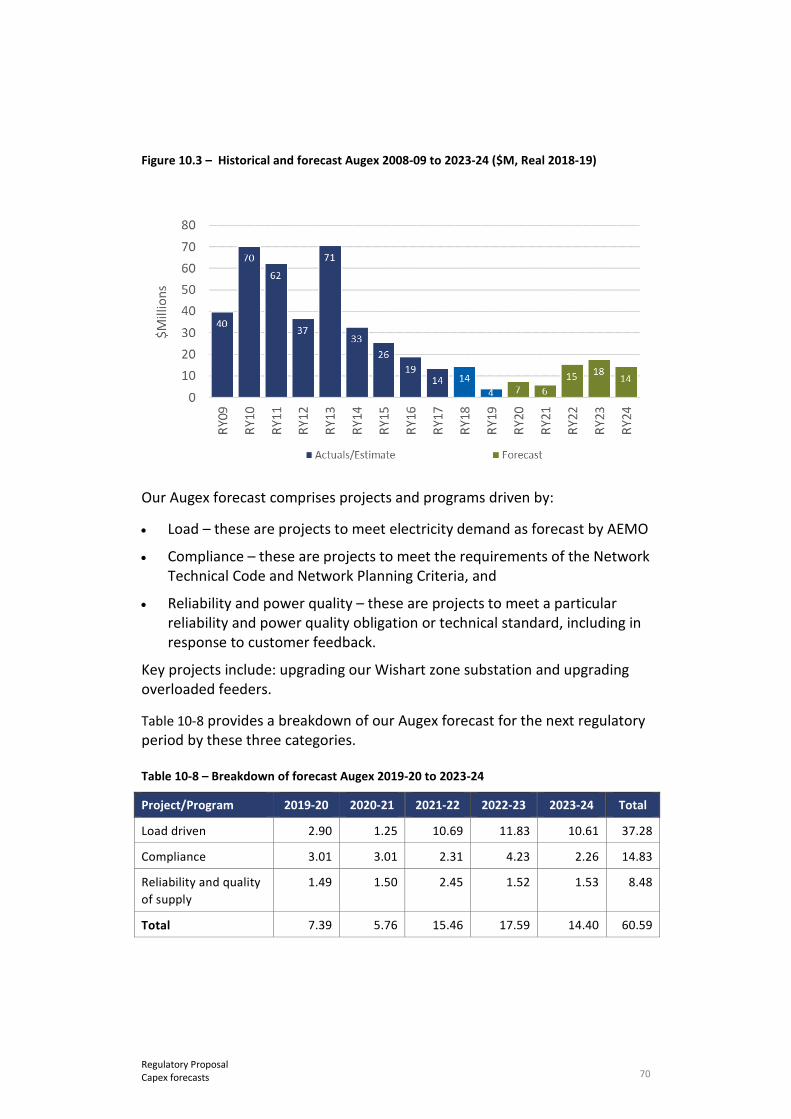
70 Regulatory Proposal Capex forecasts
Figure 10.3 – Historical and forecast Augex 2008-09 to 2023-24 ($M, Real 2018-19)
Our Augex forecast comprises projects and programs driven by:
• Load – these are projects to meet electricity demand as forecast by AEMO
• Compliance – these are projects to meet the requirements of the Network Technical Code and Network Planning Criteria, and
• Reliability and power quality – these are projects to meet a particular reliability and power quality obligation or technical standard, including in response to customer feedback.
Key projects include: upgrading our Wishart zone substation and upgrading overloaded feeders.
Table 10-8 provides a breakdown of our Augex forecast for the next regulatory period by these three categories.
Table 10-8 – Breakdown of forecast Augex 2019-20 to 2023-24
Project/Program 2019-20 2020-21 2021-22 2022-23 2023-24 Total
Load driven 2.90 1.25 10.69 11.83 10.61 37.28
Compliance 3.01 3.01 2.31 4.23 2.26 14.83
Reliability and quality of supply
1.49 1.50 2.45 1.52 1.53 8.48
Total 7.39 5.76 15.46 17.59 14.40 60.59
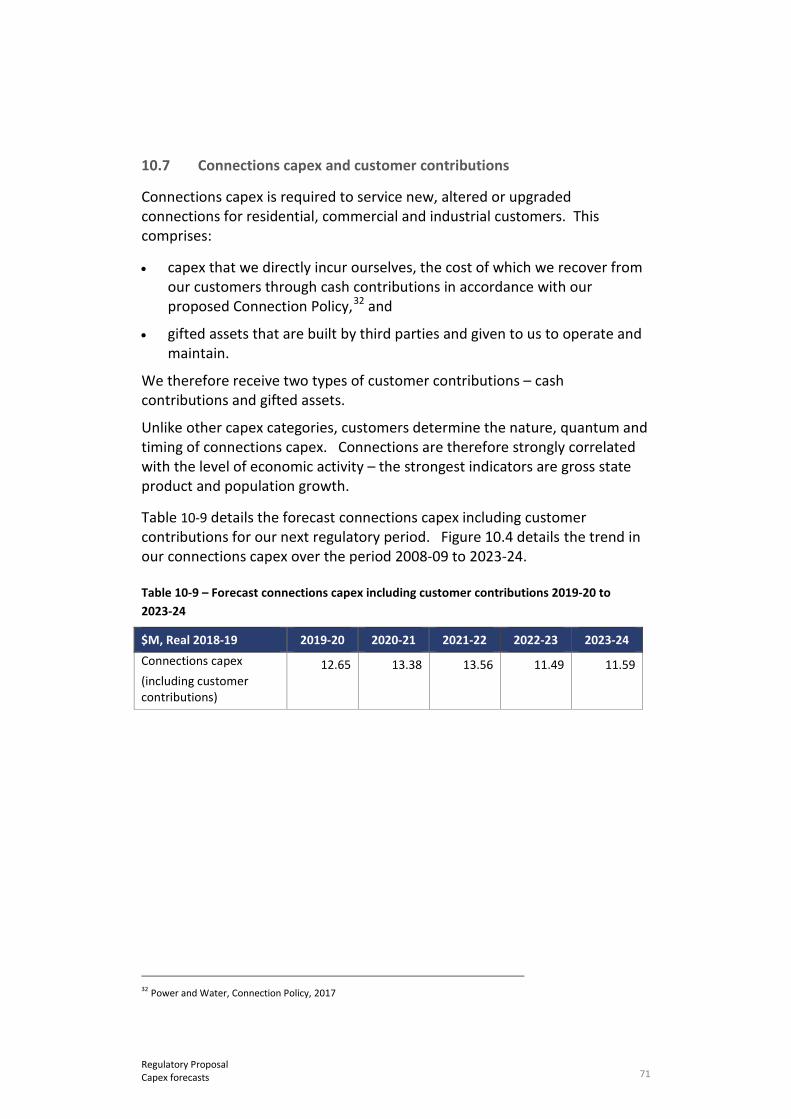
71 Regulatory Proposal Capex forecasts
10.7 Connections capex and customer contributions
Connections capex is required to service new, altered or upgraded connections for residential, commercial and industrial customers. This comprises:
• capex that we directly incur ourselves, the cost of which we recover from our customers through cash contributions in accordance with our proposed Connection Policy,32 and
• gifted assets that are built by third parties and given to us to operate and maintain.
We therefore receive two types of customer contributions – cash contributions and gifted assets.
Unlike other capex categories, customers determine the nature, quantum and timing of connections capex. Connections are therefore strongly correlated with the level of economic activity – the strongest indicators are gross state product and population growth.
Table 10-9 details the forecast connections capex including customer contributions for our next regulatory period. Figure 10.4 details the trend in our connections capex over the period 2008-09 to 2023-24.
Table 10-9 – Forecast connections capex including customer contributions 2019-20 to 2023-24
$M, Real 2018-19 2019-20 2020-21 2021-22 2022-23 2023-24 Connections capex (including customer contributions)
12.65 13.38 13.56 11.49 11.59
32 Power and Water, Connection Policy, 2017
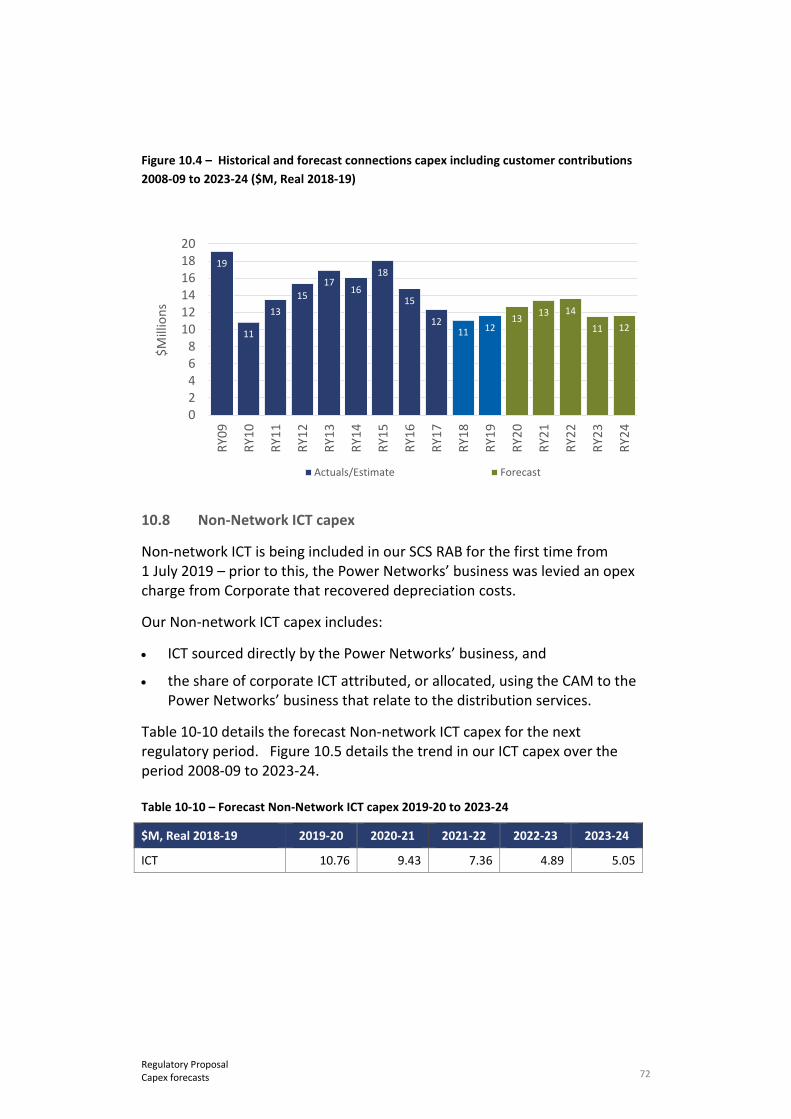
72 Regulatory Proposal Capex forecasts
Figure 10.4 – Historical and forecast connections capex including customer contributions 2008-09 to 2023-24 ($M, Real 2018-19)
10.8 Non-Network ICT capex
Non-network ICT is being included in our SCS RAB for the first time from 1 July 2019 – prior to this, the Power Networks’ business was levied an opex charge from Corporate that recovered depreciation costs.
Our Non-network ICT capex includes:
• ICT sourced directly by the Power Networks’ business, and
• the share of corporate ICT attributed, or allocated, using the CAM to the Power Networks’ business that relate to the distribution services.
Table 10-10 details the forecast Non-network ICT capex for the next regulatory period. Figure 10.5 details the trend in our ICT capex over the period 2008-09 to 2023-24.
Table 10-10 – Forecast Non-Network ICT capex 2019-20 to 2023-24
$M, Real 2018-19 2019-20 2020-21 2021-22 2022-23 2023-24
ICT 10.76 9.43 7.36 4.89 5.05
19
11
1315
1716
18
15
1211 12
13 13 14
11 12
02468
101214161820
RY09
RY10
RY11
RY12
RY13
RY14
RY15
RY16
RY17
RY18
RY19
RY20
RY21
RY22
RY23
RY24
$Mill
ions
Actuals/Estimate Forecast
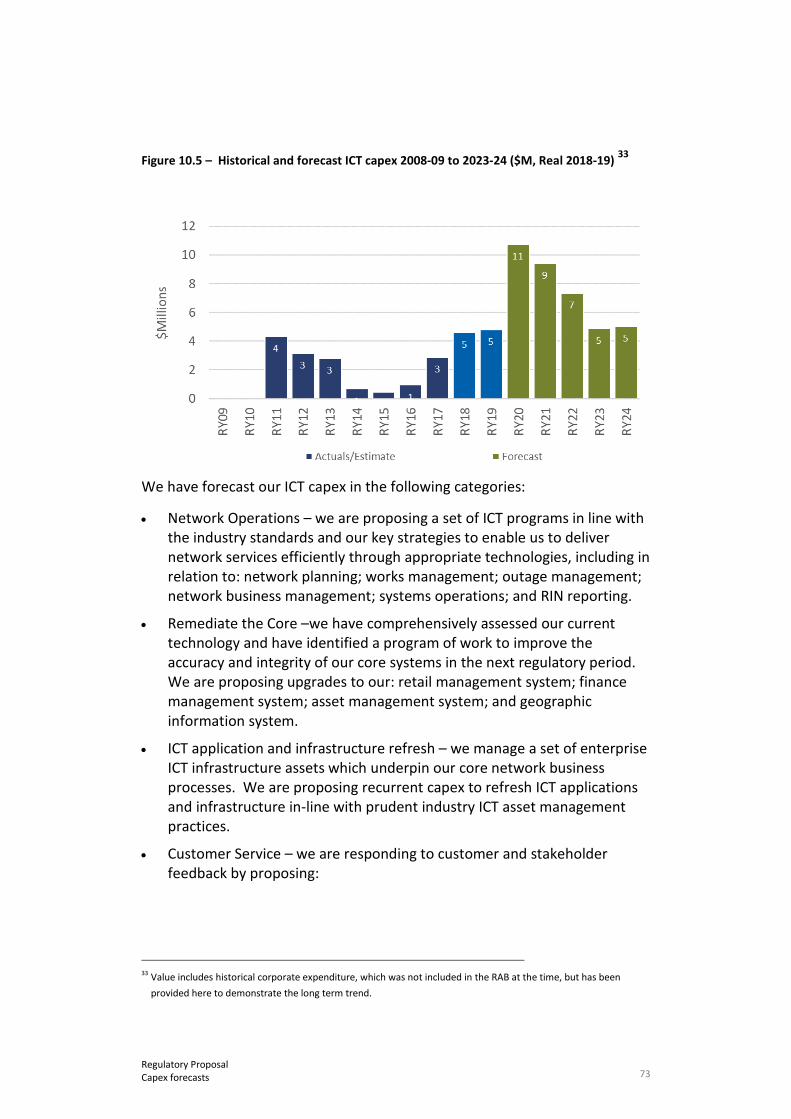
73 Regulatory Proposal Capex forecasts
Figure 10.5 – Historical and forecast ICT capex 2008-09 to 2023-24 ($M, Real 2018-19) 33
We have forecast our ICT capex in the following categories:
• Network Operations – we are proposing a set of ICT programs in line with the industry standards and our key strategies to enable us to deliver network services efficiently through appropriate technologies, including in relation to: network planning; works management; outage management; network business management; systems operations; and RIN reporting.
• Remediate the Core –we have comprehensively assessed our current technology and have identified a program of work to improve the accuracy and integrity of our core systems in the next regulatory period. We are proposing upgrades to our: retail management system; finance management system; asset management system; and geographic information system.
• ICT application and infrastructure refresh – we manage a set of enterprise ICT infrastructure assets which underpin our core network business processes. We are proposing recurrent capex to refresh ICT applications and infrastructure in-line with prudent industry ICT asset management practices.
• Customer Service – we are responding to customer and stakeholder feedback by proposing:
33 Value includes historical corporate expenditure, which was not included in the RAB at the time, but has been
provided here to demonstrate the long term trend.

74 Regulatory Proposal Capex forecasts
− a new Customer Relationship Management system to provide functionality to better manage electricity consumer expectations.
− a new Meter Data Management system to implement the system and processes required to comply with the NT-specific elements of Chapter 7A of the NT NER.
• Enterprise – we are proposing to implement a set of business intelligence data and reporting tools to improve the reliability of enterprise data and reporting function capability for the distribution network business.
Table 10-11 provides a breakdown of our Non-network ICT forecast for the next regulatory period by these categories.
Table 10-11 – Breakdown of forecast Non-network ICT capex 2019-20 to 2023-24 34
$M, Real 2018-19 2019-20 2020-21 2021-22 2022-23 2023-24 Total
ICT asset extensions
1.59 0.99 0.24 - - 2.82
ICT asset replacement
5.38 7.07 4.12 1.64 2.14 20.35
ICT capability growth
3.74 1.37 3.00 3.25 2.91 14.27
Total 10.72 9.43 7.36 4.89 5.05 37.44
10.9 Non-network other capex
The Non-network Other capex for the SCS includes fleet, buildings and property, tools and equipment and other minor capex:
• Fleet – This reflects operating lease arrangement with NT Fleet. Our capex forecast reflects the need to have reliable, well-maintained fleet for the safety, reliability, quality and security of the supply of our services.
• Property – This reflects existing leases and minor upgrades or fit-outs for administration and support buildings. Our capex is driven by whether our existing assets are best owned or leased and can accommodate our staff and contractors satisfactorily.
• Tools and equipment – Tools and equipment are essential to the safety, reliability, quality and security of the supply of our services. Our capex reflects business-as-usual capex in the current regulatory period.
34 Numbers do not reconcile exactly to the total ICT forecast shown above in Table 10-4 due to rounding.
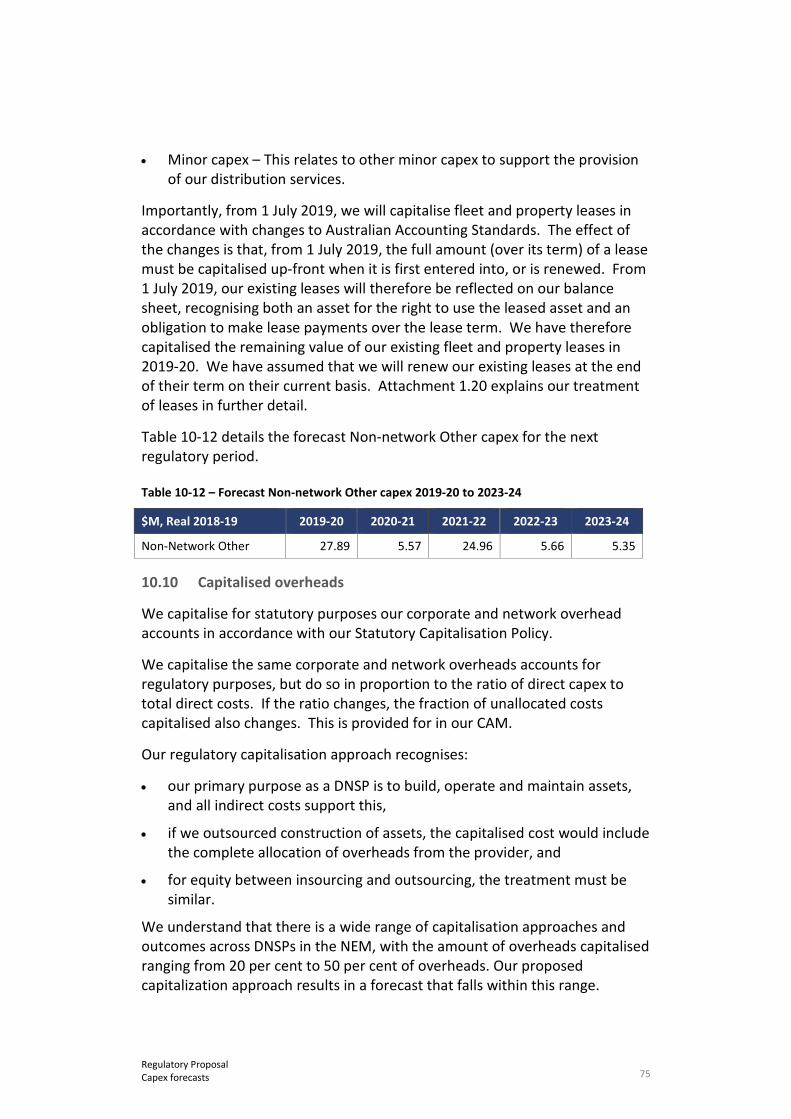
75 Regulatory Proposal Capex forecasts
• Minor capex – This relates to other minor capex to support the provision of our distribution services.
Importantly, from 1 July 2019, we will capitalise fleet and property leases in accordance with changes to Australian Accounting Standards. The effect of the changes is that, from 1 July 2019, the full amount (over its term) of a lease must be capitalised up-front when it is first entered into, or is renewed. From 1 July 2019, our existing leases will therefore be reflected on our balance sheet, recognising both an asset for the right to use the leased asset and an obligation to make lease payments over the lease term. We have therefore capitalised the remaining value of our existing fleet and property leases in 2019-20. We have assumed that we will renew our existing leases at the end of their term on their current basis. Attachment 1.20 explains our treatment of leases in further detail.
Table 10-12 details the forecast Non-network Other capex for the next regulatory period.
Table 10-12 – Forecast Non-network Other capex 2019-20 to 2023-24
$M, Real 2018-19 2019-20 2020-21 2021-22 2022-23 2023-24
Non-Network Other 27.89 5.57 24.96 5.66 5.35
10.10 Capitalised overheads
We capitalise for statutory purposes our corporate and network overhead accounts in accordance with our Statutory Capitalisation Policy.
We capitalise the same corporate and network overheads accounts for regulatory purposes, but do so in proportion to the ratio of direct capex to total direct costs. If the ratio changes, the fraction of unallocated costs capitalised also changes. This is provided for in our CAM.
Our regulatory capitalisation approach recognises:
• our primary purpose as a DNSP is to build, operate and maintain assets, and all indirect costs support this,
• if we outsourced construction of assets, the capitalised cost would include the complete allocation of overheads from the provider, and
• for equity between insourcing and outsourcing, the treatment must be similar.
We understand that there is a wide range of capitalisation approaches and outcomes across DNSPs in the NEM, with the amount of overheads capitalised ranging from 20 per cent to 50 per cent of overheads. Our proposed capitalization approach results in a forecast that falls within this range.
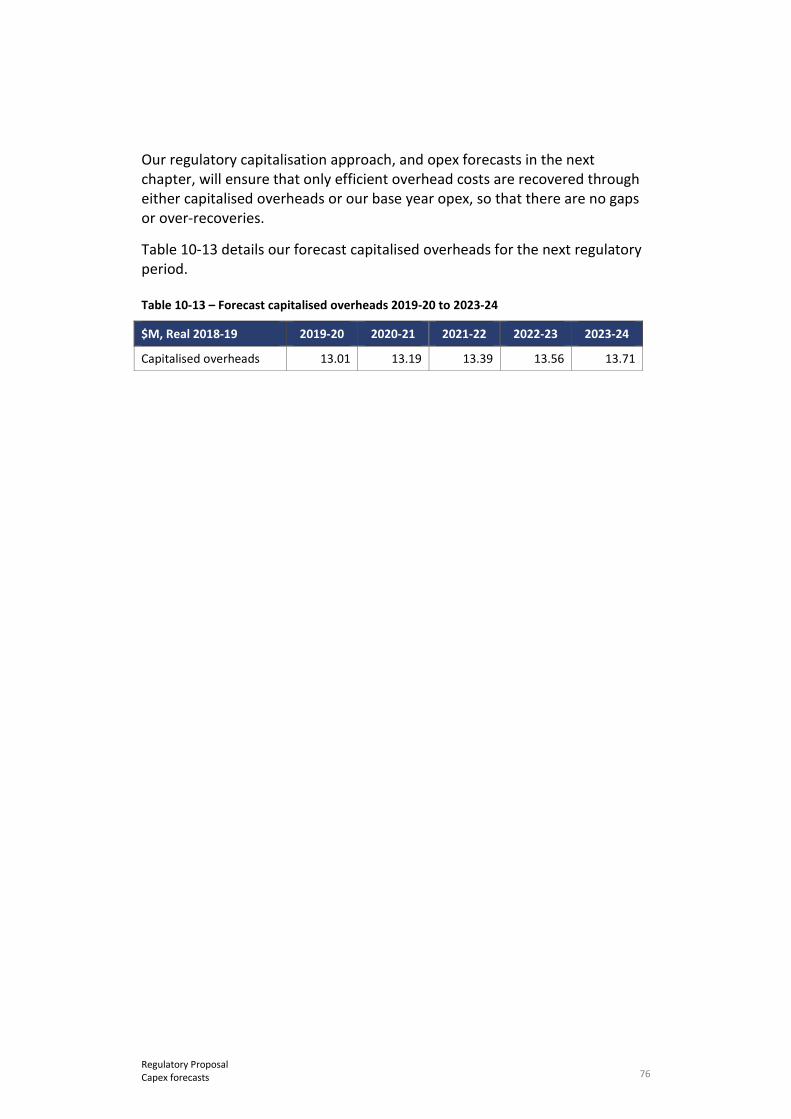
76 Regulatory Proposal Capex forecasts
Our regulatory capitalisation approach, and opex forecasts in the next chapter, will ensure that only efficient overhead costs are recovered through either capitalised overheads or our base year opex, so that there are no gaps or over-recoveries.
Table 10-13 details our forecast capitalised overheads for the next regulatory period.
Table 10-13 – Forecast capitalised overheads 2019-20 to 2023-24
$M, Real 2018-19 2019-20 2020-21 2021-22 2022-23 2023-24
Capitalised overheads 13.01 13.19 13.39 13.56 13.71

77 Regulatory Proposal Opex forecasts
11. Opex forecasts
NT NER 6.4.3(a)(7) - Building blocks include opex; 6.5.6 - Forecast opex; S6.1.2 - Information and matters re opex; S6.1.3(1) - Forecast capex and opex interactions
RIN 1.4(b) and 1.5 - Material assumptions; 9 - Forecast input price changes; 10 - Opex; 11 Step changes; 12.9(a) - Alignment of capex in RIN and regulatory proposal; 17.3(r)-(s) - Demand-related capex; 13.1 - Economic benchmarking
78 Regulatory Proposal Opex forecasts
Key messages
• We have achieved a significant opex underspend of $66.7 million in the current period relative to the UC allowance of $455.9 million, and undertook initiatives to help realise – and, in the end, outperform – the efficiencies built in to that allowance.
• We suggest that, when assessing our opex forecasts, the AER place greater emphasis on its other assessment/analytical tools set out in its Expenditure Forecast Assessment Guideline than economic benchmarking based on historical costs. This is because of shortcomings in our historical RIN data and our many unique external cost drivers that make it problematic to compare our expenditure with other DNSPs. While benchmarking can be a potentially useful tool to assist the AER assess opex forecasts, it should not be an end in itself.
• We have forecast opex for the next regulatory period using an approach consistent with the requirements in the NT NER and the guidance provided by the AER. We applied the AER’s preferred base-step-trend approach (BST), except for debt raising costs and GSLs, as proposed in our May 2017 Expenditure Forecasting Methodology.
• Our opex forecast will enable us to maintain current average safety and service levels, which reflect our customers’ feedback.
• Our forecast opex is $339.3 million including debt raising costs over the next regulatory period, which is around 12.8 per cent lower than our expected opex in the current regulatory period (see Figure 11.1 below).
• The decrease is primarily due to targeted reduction of $35.2 million, or 10 per cent, to our base year opex over the regulatory control period. These reductions recognise that we appear to have higher maintenance and network overhead expenditure than many networks. Although this is largely due to our unique circumstances (e.g. being the smallest network in the NEM), we recognise that there is room for improvement as we continue our drive to reduce costs over time.
11.1 Our forecast and historical opex
Our opex is the operating, maintenance and other non-capex that we incur to provide our distribution services to our customers.
This chapter explains and justifies the opex forecast for SCS for the next regulatory period. Our opex forecasts must comply with the NT NER requirements. Broadly, the NT NER requires us to submit an efficient opex forecast that is consistent with maintaining the quality, reliability and safety of the network and network services. These objectives are underpinned by the Electricity Industry Performance Code, Network Technical Code, the Network Planning Code, the System Control Technical Code and our customers’ reasonable expectations that we should maintain the safety and reliability of our distribution services.
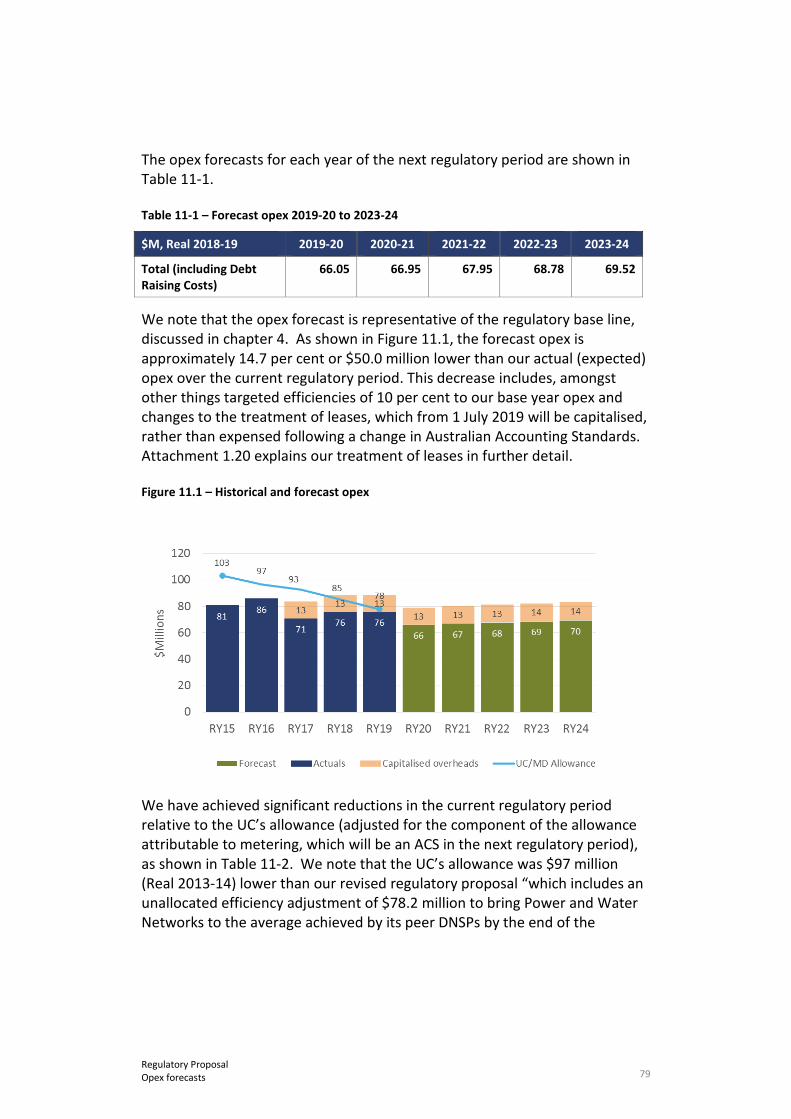
79 Regulatory Proposal Opex forecasts
The opex forecasts for each year of the next regulatory period are shown in Table 11-1.
Table 11-1 – Forecast opex 2019-20 to 2023-24
$M, Real 2018-19 2019-20 2020-21 2021-22 2022-23 2023-24
Total (including Debt Raising Costs)
66.05 66.95 67.95 68.78 69.52
We note that the opex forecast is representative of the regulatory base line, discussed in chapter 4. As shown in Figure 11.1, the forecast opex is approximately 14.7 per cent or $50.0 million lower than our actual (expected) opex over the current regulatory period. This decrease includes, amongst other things targeted efficiencies of 10 per cent to our base year opex and changes to the treatment of leases, which from 1 July 2019 will be capitalised, rather than expensed following a change in Australian Accounting Standards. Attachment 1.20 explains our treatment of leases in further detail.
Figure 11.1 – Historical and forecast opex
We have achieved significant reductions in the current regulatory period relative to the UC’s allowance (adjusted for the component of the allowance attributable to metering, which will be an ACS in the next regulatory period), as shown in Table 11-2. We note that the UC’s allowance was $97 million (Real 2013-14) lower than our revised regulatory proposal “which includes an unallocated efficiency adjustment of $78.2 million to bring Power and Water Networks to the average achieved by its peer DNSPs by the end of the

80 Regulatory Proposal Opex forecasts
2014-19 regulatory control period”35. This represented an 18.4 per cent reduction in our proposal, of which 80.6 per cent related to the unallocated efficiency adjustment.
Table 11-2 – Actual and estimated opex compared to UC Determination 2014-15 to 2018-19
$M, Real 2018-19 2014-15 2015-16 2016-17 2017-18 2018-19 Total
UC Determination (excluding Debt Raising)
106.37 99.63 95.77 88.04 80.22 470.04
Less UC Determination – metering (assuming 3% of total)
-3.19 -2.99 -2.87 -2.64 -2.41 -14.10
Adjusted UC Determination (excluding Debt Raising)
103.18 96.64 92.90 85.40 77.81 455.94
Actual / Estimated (excluding Debt Raising)
80.83 85.90 70.91 75.79 75.79 389.24
Variance (Actual – Determination)
-22.34 -10.74 -21.99 -9.60 -2.02 -66.70
Our lower opex in the current regulatory period mainly resulted from:
• a reduction in maintenance expenditure resulting from the optimisation of routine maintenance strategies across a range of asset classes;
• a reduction in network overheads resulting from an increase in labour recoveries as timesheeting improves; and
• a reduction in corporate overheads resulting from an increase in the capitalisation of corporate assets.
These reductions are further explored in Attachment 3.1.
11.2 Key opex assumptions
The key assumptions underpinning our opex forecasts are detailed in Table 11-3.
Table 11-3 – Key opex assumptions
Issue Assumption
1. Company structure Our opex forecasts reflect Power and Water’s current company
35 “UC, “2014 Network Price Determination – Final Determination – Part A – Statement of Reasons”, April 2014, page
10

81 Regulatory Proposal Opex forecasts
Issue Assumption and ownership arrangements
structure and ownership arrangements.
2. Regulatory obligations and requirements
Our opex forecasts are based on legislative and regulatory instruments applicable to Power and Water and as in force on 1 July 2017. 36
3. Network reliability Our opex forecasts will maintain, but will not improve, system-wide security of supply and network reliability, consistent with clause 6.5.7 of the NT NER.
4. Service classification Our opex forecasts reflect the service classification in the AER’s F&A paper.
5. Maximum demand, customer and connection growth
Our opex forecasts are required to meet the maximum demand, customer and connection growth forecasts prepared by AEMO. As the independent market operator AEMO forecasts are reasonable and credible.
6. Cost allocation and capitalisation
Our opex forecasts reflect the cost allocation method that has been submitted to the AER, which includes our approach to capitalisation.
7. Efficient opex base year
Our adjusted (including for efficiencies) 2016-17 opex provides a reasonable basis for our opex forecasts and is representative of our requirements to sustainably provide our services.
8. Cost escalations The cost escalations that we have applied in developing our opex forecasts are representative of the increased costs that we will incur in the next period.
9. Inflation The inflation that we have has applied in developing our opex forecasts is representative of the inflation-related costs that we will incur in the next period and is consistent with the AER-preferred inflation forecasting method.
Our Directors have certified the reasonableness of these key assumptions in accordance with clause S6.2.1(6) of the NER, as discussed in chapter 24 of this regulatory proposal.
11.3 Benchmarking
Under the NT NER, the AER must either accept or not accept our forecast opex (and capex) for the next regulatory period that is included in this regulatory
36 We have included in the regulatory baseline the new Electricity Industry Performance Code (Standards of Service
and Guaranteed Service Levels) that the UC published on 25 October 2017. This updates, merges and replaces the Retail Supply Electricity Standards of Service Code and Guaranteed Service Level Code.
82 Regulatory Proposal Opex forecasts
proposal. The AER must accept our forecast opex if it is satisfied that the forecast reasonably reflects the opex criteria in clause 6.5.6 of the NT NER.
The AER indicated in its F&A paper37 that it intends to have regard to the following assessment/analytical tools set out in the Expenditure Forecast Assessment (EFA) guideline in reviewing our opex forecasts:
• benchmarking (including broad economic techniques and more specific analysis of expenditure categories)
• methodology, governance and policy reviews
• predictive modelling and trend analysis, and
• cost benefit analysis and detailed project reviews.
The AER’s need to consider benchmarking arises from the opex factors, which include – among other things – the most recent annual benchmarking report and the benchmark opex that would be incurred by an efficient DNSP over the regulatory period. Our historical data for 2013-14 to 2016-17 is expected to be included for the first time in the AER’s 2018 benchmarking report. We note that care must be taken in relying on this historical data for benchmarking purposes because it has various shortcomings and distortions, including that:
• Not all the historical data now required by the AER in its RIN templates has been maintained in our ordinary course of business.
• The business has undergone multiple organisational changes over the period, including our structural separation – this is discussed in chapter 5.
• We are a multi-utility business with various and historically inter-twined customer and government-funding arrangements.
• Overlaying the complex funding arrangements are both regulated and unregulated elements of the business, where the requirement to separate data using this distinction has only become relevant with the recent adoption of the NT NER.
• Not all the data that the AER requires is available in the requested format.
As discussed in section 3.3, we have many unique external cost drivers compared with other DNSPs in the NEM, which increases our comparative opex. Applying the AER’s benchmarking model to our opex is likely to result in an opex outcome that is not practicable, even after taking account of the
37 AER, Framework and Approach, Power and Water Corporation (NT) 2019-20 to 2023-24, page 54.

83 Regulatory Proposal Opex forecasts
AER’s operating environment factors (OEFs)38. We note that in its recent review of Power and Water’s OEF’s for the AER, Sapere/Merz concluded39 that:
There is at present no recent econometric benchmarking of Power and Water’s core distribution service. Similarly, there is at present no RIN data. As a result it is not possible to quantify any OEFs that may be required to address systemic environmental operating variables affecting Power and Water.
Given that 2018 is the first year that we will be included in the AER’s econometric benchmarking and that we will not be providing our audited RIN data until 16 March 2018, we think that the AER should place greater emphasis on its other assessment/analytical tools set out in its Expenditure Forecast Assessment guideline when assessing our forecasts. We understand that AER intends to adopt this approach.
Further, whilst we accept that there is room for additional improvements in our efficiency, the level of the gap suggested by indicative econometric benchmarking modelling is not justifiable or sustainable. As discussed in section 11.4, we have proposed opex efficiencies over the current regulatory period of approximately 10 per cent, $35.2 million (Real 2018-19).
We consider that it would not be practical for the AER to try to use OEFs to adjust the benchmarks to recognise environmental factors. This is because the impact of the OEFs will overwhelm the process, and the cumulative error (uncertainty) band of the benchmarks and OEFs will make the results effectively meaningless. Setting the regulatory opex allowance based on benchmarking alone would therefore lead to outcomes that are not be in the best interests of consumers, and that are counter to the objective the AER is required to follow.
Nevertheless, we are keen to work with the AER and its consultants to improve our collective understanding of how our efficient costs compare with those of other DNSPs.
38 We understand that the AER adjusts its benchmarking analysis for OEFs to take account of the different drivers for
expenditure across DNSPs. We have considered factors that drive our expenditure forecasts in our “Opex Base Year Justification” – Attachment 3.1.
39 Sapere Research Group, Independent review of Operating Environment Factors used to adjust efficient operating expenditure for economic benchmarking, December 2017, page 62.
84 Regulatory Proposal Opex forecasts
11.4 Our opex forecasting approach
We have used a BST approach to forecast our opex for the next regulatory period, except for our debt raising costs and GSLs. This is consistent with the approach that we proposed in our Expenditure Forecasting Method that was submitted to the AER in May 2017 and the AER’s preferred approach for forecasting opex, as detailed in its Expenditure Forecast Assessment Guideline.
A BST approach involves forecasting opex at an aggregate level, rather than preparing individual forecasts for each category of opex. The BST approach involves the following stages:
• nominating a base year
• applying adjustments to achieve an efficient base year opex
• applying rate of change adjustments to the efficient base year opex for growth in:
– labour and non-labour prices
– output
– productivity, and
• applying step changes.
For our forecast debt raising costs, we applied the year-on-year benchmark method, as explained in section 13.5.1. This is because actual debt raising costs in our base year are not necessarily representative of future costs. In forecasting our debt raising costs, we assessed the incremental costs for each year of the regulatory period and added them to the output of the BST method.
We also forecast GSLs as a specific forecast, which means that we removed any GSL costs or adjustments from our base year opex and forecast these separately. Because of a change to the jurisdictional code that governs our GSL payments, we forecast an increase in these costs. We discuss this further in Attachment 3.2.
Our opex forecast for the next regulatory period is set out in Table 11-1. We are forecasting opex to decrease by $50.0 million, or 14. per cent, compared to the current regulatory period. Figure 11.2 illustrates the build-up of our opex forecast for the next regulatory period.
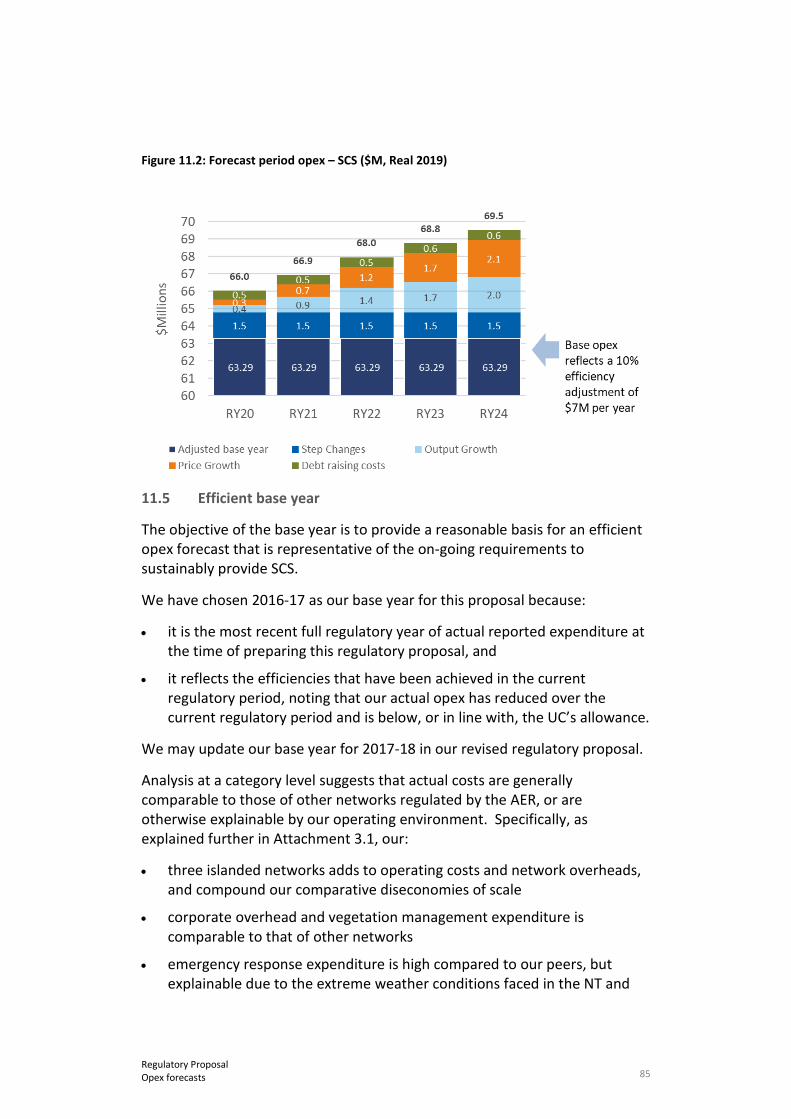
85 Regulatory Proposal Opex forecasts
Figure 11.2: Forecast period opex – SCS ($M, Real 2019)
11.5 Efficient base year
The objective of the base year is to provide a reasonable basis for an efficient opex forecast that is representative of the on-going requirements to sustainably provide SCS.
We have chosen 2016-17 as our base year for this proposal because:
• it is the most recent full regulatory year of actual reported expenditure at the time of preparing this regulatory proposal, and
• it reflects the efficiencies that have been achieved in the current regulatory period, noting that our actual opex has reduced over the current regulatory period and is below, or in line with, the UC’s allowance.
We may update our base year for 2017-18 in our revised regulatory proposal.
Analysis at a category level suggests that actual costs are generally comparable to those of other networks regulated by the AER, or are otherwise explainable by our operating environment. Specifically, as explained further in Attachment 3.1, our:
• three islanded networks adds to operating costs and network overheads, and compound our comparative diseconomies of scale
• corporate overhead and vegetation management expenditure is comparable to that of other networks
• emergency response expenditure is high compared to our peers, but explainable due to the extreme weather conditions faced in the NT and
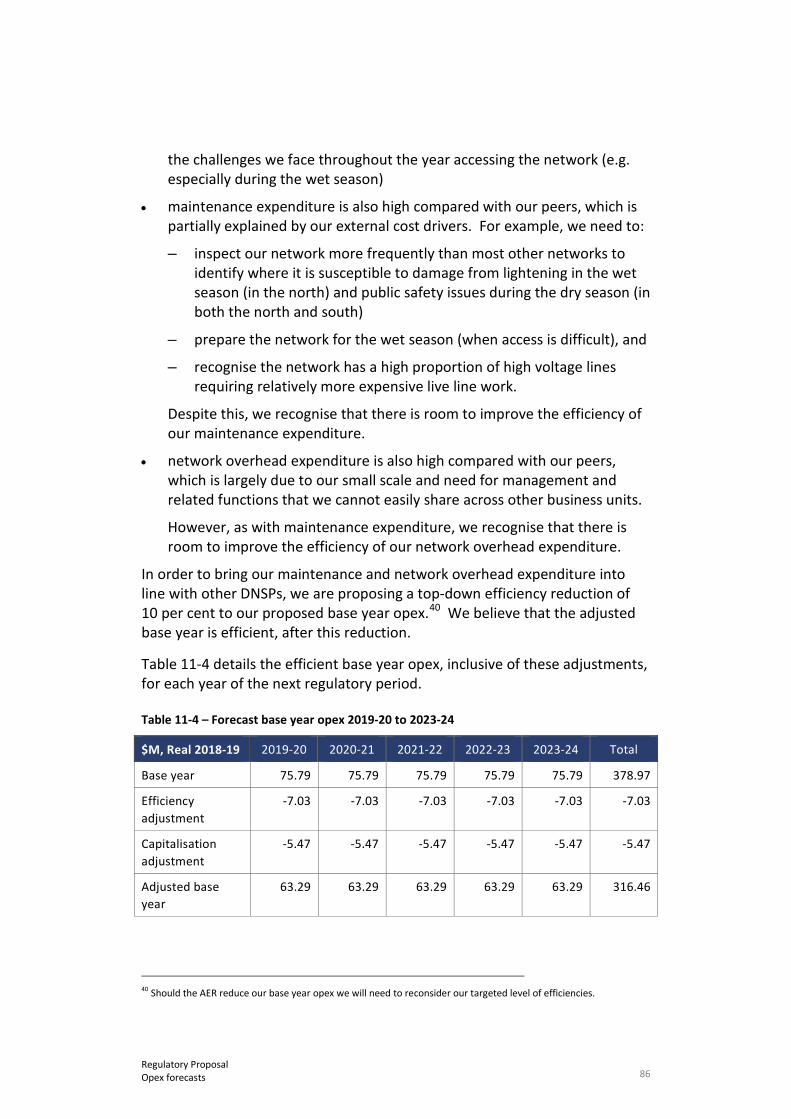
86 Regulatory Proposal Opex forecasts
the challenges we face throughout the year accessing the network (e.g. especially during the wet season)
• maintenance expenditure is also high compared with our peers, which is partially explained by our external cost drivers. For example, we need to:
– inspect our network more frequently than most other networks to identify where it is susceptible to damage from lightening in the wet season (in the north) and public safety issues during the dry season (in both the north and south)
– prepare the network for the wet season (when access is difficult), and
– recognise the network has a high proportion of high voltage lines requiring relatively more expensive live line work.
Despite this, we recognise that there is room to improve the efficiency of our maintenance expenditure.
• network overhead expenditure is also high compared with our peers, which is largely due to our small scale and need for management and related functions that we cannot easily share across other business units.
However, as with maintenance expenditure, we recognise that there is room to improve the efficiency of our network overhead expenditure.
In order to bring our maintenance and network overhead expenditure into line with other DNSPs, we are proposing a top-down efficiency reduction of 10 per cent to our proposed base year opex.40 We believe that the adjusted base year is efficient, after this reduction.
Table 11-4 details the efficient base year opex, inclusive of these adjustments, for each year of the next regulatory period.
Table 11-4 – Forecast base year opex 2019-20 to 2023-24
$M, Real 2018-19 2019-20 2020-21 2021-22 2022-23 2023-24 Total
Base year 75.79 75.79 75.79 75.79 75.79 378.97
Efficiency adjustment
-7.03 -7.03 -7.03 -7.03 -7.03 -7.03
Capitalisation adjustment
-5.47 -5.47 -5.47 -5.47 -5.47 -5.47
Adjusted base year
63.29 63.29 63.29 63.29 63.29 316.46
40 Should the AER reduce our base year opex we will need to reconsider our targeted level of efficiencies.

87 Regulatory Proposal Opex forecasts
Attachment 3.1 provides further details about our base year adjustments.
11.6 Step changes
The purpose of the step changes is to reflect efficient costs of new regulatory obligations that are not reflected in the efficient base year, but which are reflected in:
• our regulatory baseline
• new planning requirements, and
• recent changes to our GSL obligations.
The five new obligations that we must comply with are:
• National connections process – from 1 July 2019, we must comply with increased administrative requirements related to national connections created by the introduction of chapter 5A of the NT NER.
• Metering Compliance Type 7 – we must prepare and maintain a five-year rolling sampling plan for type 7 metering installations for the Northern and Southern Regions and assess against that plan.
• MDMS commissioning and early processing – from 1 July 2018, a Metering Data Management System (MDMS) is required to comply with the verification, substitution and estimation obligations imposed by Chapter 7A. These functions are required to deliver our SCS, including our billing functions.
• Planning resources – with the move to the national electricity framework, more work is required in network planning to comply with the NT NER and bring our practices in line with those commonly adopted by other DNSPs regulated by the AER. This requires a maturing of our planning function, which is currently small and relies on external support to manage peak requirements.
• GSL – on 25 October 2017, the UC updated the GSL Code and merged it into the Electricity Industry Performance (EIP) Code. Under the new EIP Code, a revised GSL scheme will operate from 2019-20 onwards, which will increase costs.
Attachment 3.2 provides more details of these new regulatory obligations and the estimated step change costs to meet them.
Table 11-5 details the forecast step changes for each year of the next regulatory period.
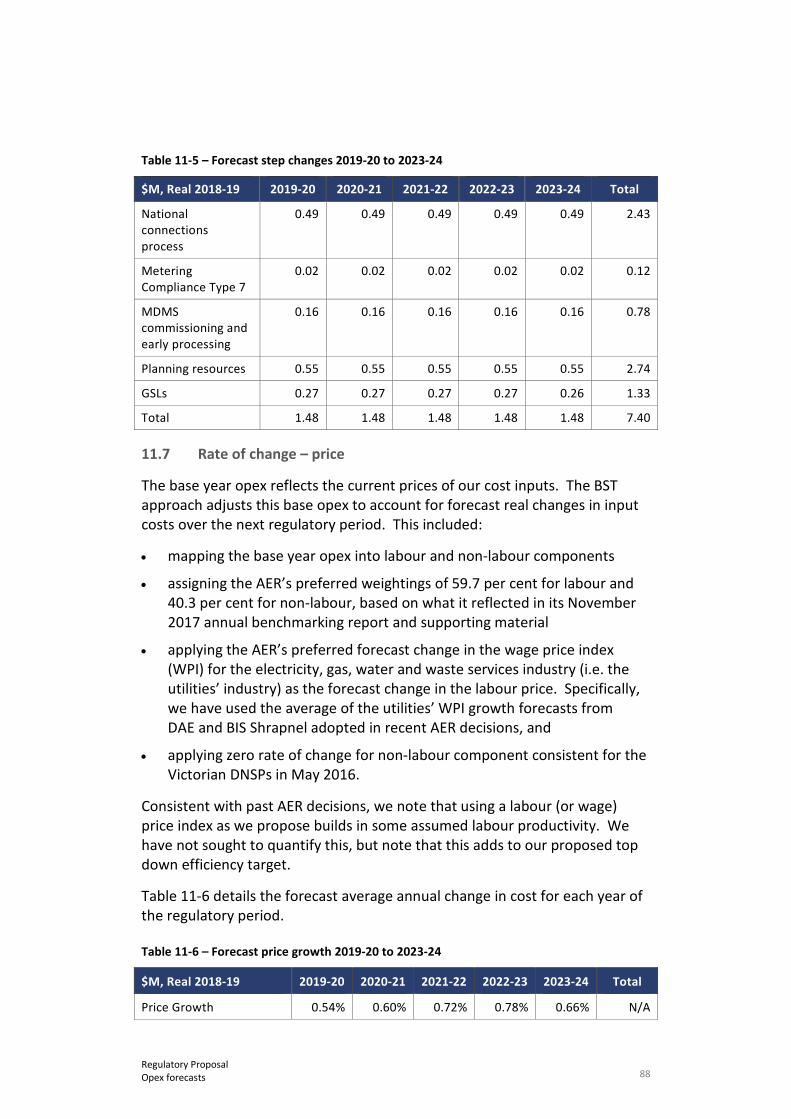
88 Regulatory Proposal Opex forecasts
Table 11-5 – Forecast step changes 2019-20 to 2023-24
$M, Real 2018-19 2019-20 2020-21 2021-22 2022-23 2023-24 Total
National connections process
0.49 0.49 0.49 0.49 0.49 2.43
Metering Compliance Type 7
0.02 0.02 0.02 0.02 0.02 0.12
MDMS commissioning and early processing
0.16 0.16 0.16 0.16 0.16 0.78
Planning resources 0.55 0.55 0.55 0.55 0.55 2.74
GSLs 0.27 0.27 0.27 0.27 0.26 1.33
Total 1.48 1.48 1.48 1.48 1.48 7.40
11.7 Rate of change – price
The base year opex reflects the current prices of our cost inputs. The BST approach adjusts this base opex to account for forecast real changes in input costs over the next regulatory period. This included:
• mapping the base year opex into labour and non-labour components
• assigning the AER’s preferred weightings of 59.7 per cent for labour and 40.3 per cent for non-labour, based on what it reflected in its November 2017 annual benchmarking report and supporting material
• applying the AER’s preferred forecast change in the wage price index (WPI) for the electricity, gas, water and waste services industry (i.e. the utilities’ industry) as the forecast change in the labour price. Specifically, we have used the average of the utilities’ WPI growth forecasts from DAE and BIS Shrapnel adopted in recent AER decisions, and
• applying zero rate of change for non-labour component consistent for the Victorian DNSPs in May 2016.
Consistent with past AER decisions, we note that using a labour (or wage) price index as we propose builds in some assumed labour productivity. We have not sought to quantify this, but note that this adds to our proposed top down efficiency target.
Table 11-6 details the forecast average annual change in cost for each year of the regulatory period.
Table 11-6 – Forecast price growth 2019-20 to 2023-24
$M, Real 2018-19 2019-20 2020-21 2021-22 2022-23 2023-24 Total
Price Growth 0.54% 0.60% 0.72% 0.78% 0.66% N/A
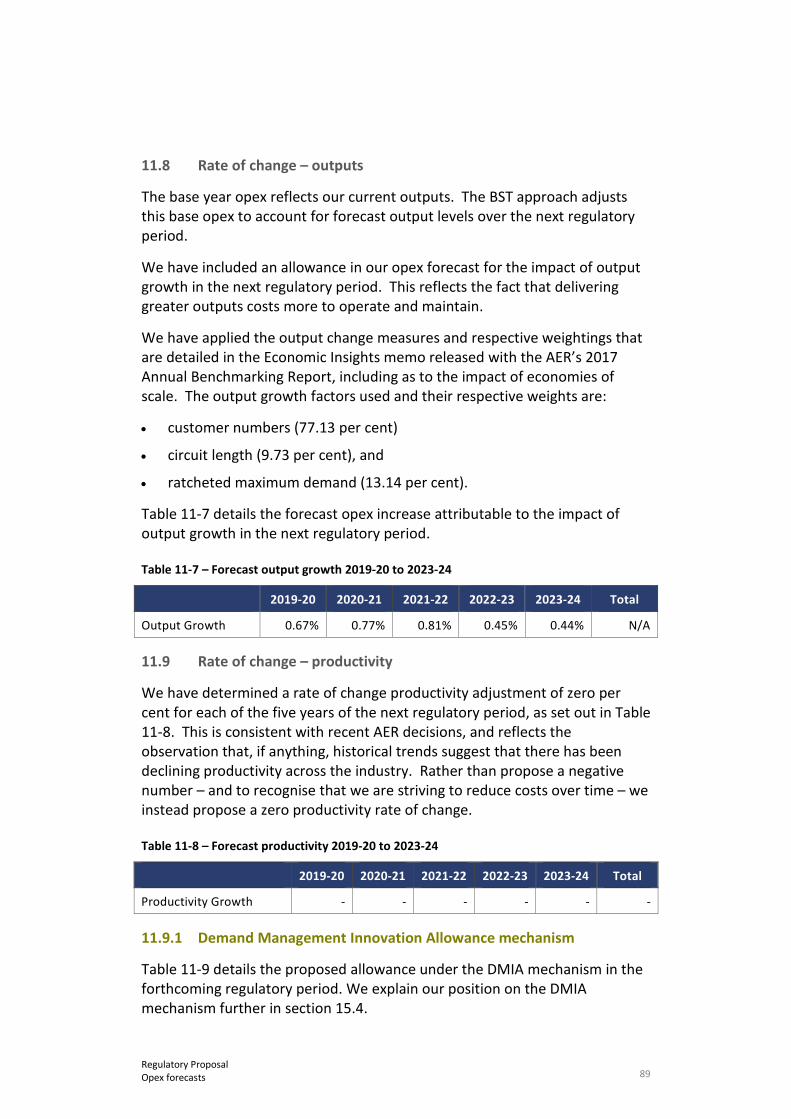
89 Regulatory Proposal Opex forecasts
11.8 Rate of change – outputs
The base year opex reflects our current outputs. The BST approach adjusts this base opex to account for forecast output levels over the next regulatory period.
We have included an allowance in our opex forecast for the impact of output growth in the next regulatory period. This reflects the fact that delivering greater outputs costs more to operate and maintain.
We have applied the output change measures and respective weightings that are detailed in the Economic Insights memo released with the AER’s 2017 Annual Benchmarking Report, including as to the impact of economies of scale. The output growth factors used and their respective weights are:
• customer numbers (77.13 per cent)
• circuit length (9.73 per cent), and
• ratcheted maximum demand (13.14 per cent).
Table 11-7 details the forecast opex increase attributable to the impact of output growth in the next regulatory period.
Table 11-7 – Forecast output growth 2019-20 to 2023-24
2019-20 2020-21 2021-22 2022-23 2023-24 Total
Output Growth 0.67% 0.77% 0.81% 0.45% 0.44% N/A
11.9 Rate of change – productivity
We have determined a rate of change productivity adjustment of zero per cent for each of the five years of the next regulatory period, as set out in Table 11-8. This is consistent with recent AER decisions, and reflects the observation that, if anything, historical trends suggest that there has been declining productivity across the industry. Rather than propose a negative number – and to recognise that we are striving to reduce costs over time – we instead propose a zero productivity rate of change.
Table 11-8 – Forecast productivity 2019-20 to 2023-24
2019-20 2020-21 2021-22 2022-23 2023-24 Total
Productivity Growth - - - - - -
11.9.1 Demand Management Innovation Allowance mechanism
Table 11-9 details the proposed allowance under the DMIA mechanism in the forthcoming regulatory period. We explain our position on the DMIA mechanism further in section 15.4.
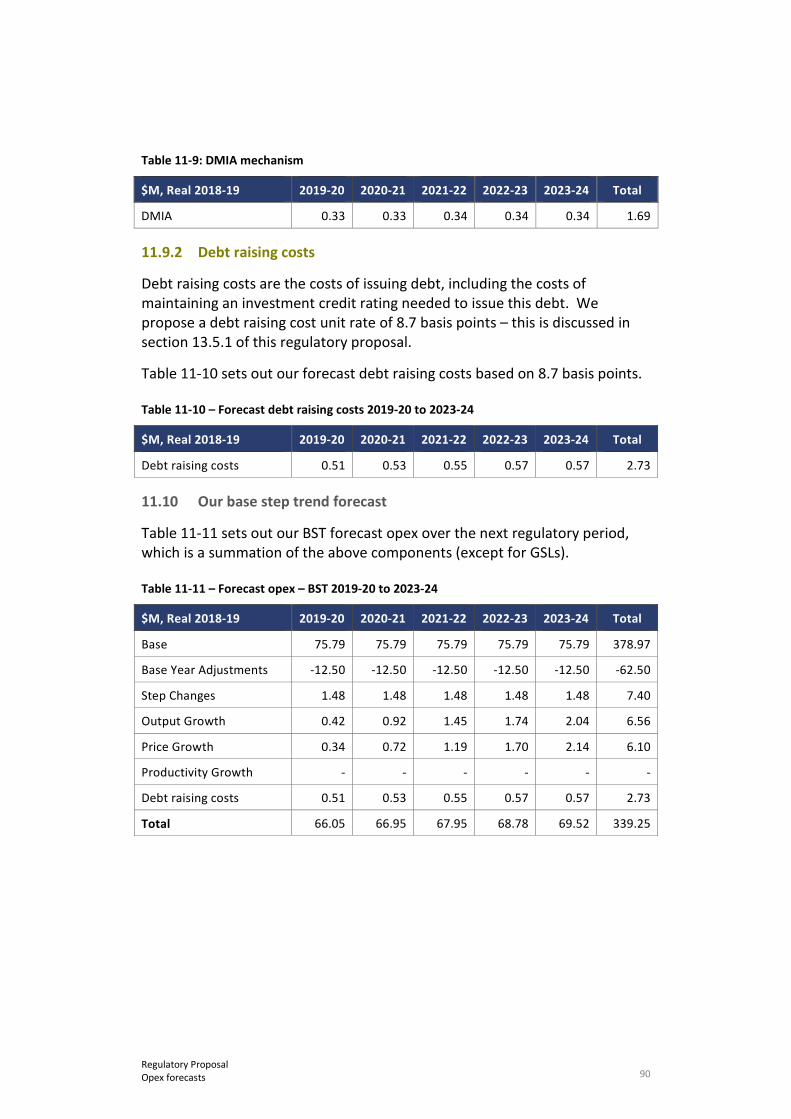
90 Regulatory Proposal Opex forecasts
Table 11-9: DMIA mechanism
$M, Real 2018-19 2019-20 2020-21 2021-22 2022-23 2023-24 Total
DMIA 0.33 0.33 0.34 0.34 0.34 1.69
11.9.2 Debt raising costs
Debt raising costs are the costs of issuing debt, including the costs of maintaining an investment credit rating needed to issue this debt. We propose a debt raising cost unit rate of 8.7 basis points – this is discussed in section 13.5.1 of this regulatory proposal.
Table 11-10 sets out our forecast debt raising costs based on 8.7 basis points.
Table 11-10 – Forecast debt raising costs 2019-20 to 2023-24
$M, Real 2018-19 2019-20 2020-21 2021-22 2022-23 2023-24 Total
Debt raising costs 0.51 0.53 0.55 0.57 0.57 2.73
11.10 Our base step trend forecast
Table 11-11 sets out our BST forecast opex over the next regulatory period, which is a summation of the above components (except for GSLs).
Table 11-11 – Forecast opex – BST 2019-20 to 2023-24
$M, Real 2018-19 2019-20 2020-21 2021-22 2022-23 2023-24 Total
Base 75.79 75.79 75.79 75.79 75.79 378.97
Base Year Adjustments -12.50 -12.50 -12.50 -12.50 -12.50 -62.50
Step Changes 1.48 1.48 1.48 1.48 1.48 7.40
Output Growth 0.42 0.92 1.45 1.74 2.04 6.56
Price Growth 0.34 0.72 1.19 1.70 2.14 6.10
Productivity Growth - - - - - -
Debt raising costs 0.51 0.53 0.55 0.57 0.57 2.73
Total 66.05 66.95 67.95 68.78 69.52 339.25
91 Regulatory Proposal Regulatory Asset Base and Depreciation
12. Regulatory Asset Base and Depreciation
NT NER
6.4.3(a)(1) and (3) - Building blocks include indexation of RAB and depreciation; 6.4.3(b)(1) to (3) Calculation of indexation of RAB and depreciation building blocks; 6.5.1(a) - Nature of RAB; 6.5.5 - Depreciation; S6.1.3(7) - Info and content re RAB calculation; S6.1.3(12) - Demonstration depreciation schedules conform with 6.5.5(b); S6.1.3(1) - Completed RFM; S.6.2.1 - Establishing opening RAB; S.6.2.3 - Roll forward of RAB; S.6.2.3A - Establishing opening RAB for 1st regulatory period
RIN 12.10 and 23 - RAB; 24 – Depreciation
Key messages
• The RAB reflects the value of capital that we have invested in our network to provide services, but have not yet recovered from our customers. It is used to determine the return that we can recover over future regulatory periods.
• We propose an opening SCS RAB as at 1 July 2019 of $973.50 million (real 2018-19), calculated using the AER’s roll-forward model and:
– reducing the value of the opening RAB detailed in the NT NER at 1 July 2014 by $67.69 million from $928.34 million to $860.65 million (Real 2013-14) to correct an error in the previous valuation relied on by the UC
– adding the written down value of corporate assets that are used to provide SCS as part of a proposal to move the cost of these assets from opex to capex, and
– amending the asset classes to better group assets with similar economic lives.
• We propose forecasting regulatory depreciation by applying real straight-line depreciation and the “year-on-year tracking” method, rather than the AER’s default weighted average remaining life method. This aligns the return of capital (i.e. depreciation) with the economic lives of our assets. These are generally earlier than those reflected in the AER’s default weighted average remaining life calculation.
• We also propose to use forecast depreciation to roll-forward the RAB at the start of the subsequent regulatory period, consistent with the AER’s F&A paper.
12.1 Overview
The value of the assets used in providing SCS is known as the RAB. This value represents the (as yet) unrecovered past capital investments made to provide SCS to our customers.
The value of the RAB changes over time. As we invest in new assets, this expenditure is added to the RAB. As our assets depreciate, this value is

92 Regulatory Proposal Regulatory Asset Base and Depreciation
subtracted from the RAB. As customers make capital contributions (including by gifting us assets) or we dispose of assets, these proceeds are subtracted (or excluded) from the RAB.
The RAB is used to determine both the return on capital and the return of capital (i.e. depreciation) to Power and Water over the next regulatory period:
• The return on capital covers the efficient cost of financing investment in the network and is calculated for each year of the next regulatory period by taking the opening RAB value and multiplying this by the proposed rate of return (see Chapter 13).
• The return of capital reflects the depreciation of the assets over the regulatory period – i.e. the decrease in their value due to usage and ageing. We have calculated this using the year-on-year tracking method, which has been accepted in recent AER decisions.41
To calculate the opening value of the SCS RAB for the next regulatory period, we used an approach consistent with the NT NER (clauses 6.5.1 and S6.2.3A) and the AER’s RAB roll-forward model. This involved:
• taking the opening RAB of $928.34 million (Real 2013-14) for the current regulatory period set by the UC (and detailed in the NT NER) and correcting it by $67.69 (Real 2013-14) million for an overstatement in the SKM valuation that underpinned it. We expect that this overstatement will be fixed in the NT NER before the AER makes its draft determination as part of the NT Government’s next package of legislative and regulatory changes
• adjusting this (corrected) value to take account of actual and expected capital expenditure over that period, as well as the depreciation of the assets over that period and several other factors, and
• splitting out ACS metering assets, which are captured in a separate RAB over the next regulatory period (see chapter 18).
We also amended the asset classes used by the UC to better capture assets with similar expected lives and to facilitate separating metering services into separate ACS over the next regulatory period.
The proposed opening value of the SCS RAB is set out in Table 12-1. More detail on the approach and the populated AER models is provided as Attachment 1.11, Attachment 12.11, Attachment 12.13 and Attachment 12.14, including the nominated depreciation schedule for SCS. The RAB for 41 For instance, see the recent AER determinations for the Victorian DNSPs in May 2016.
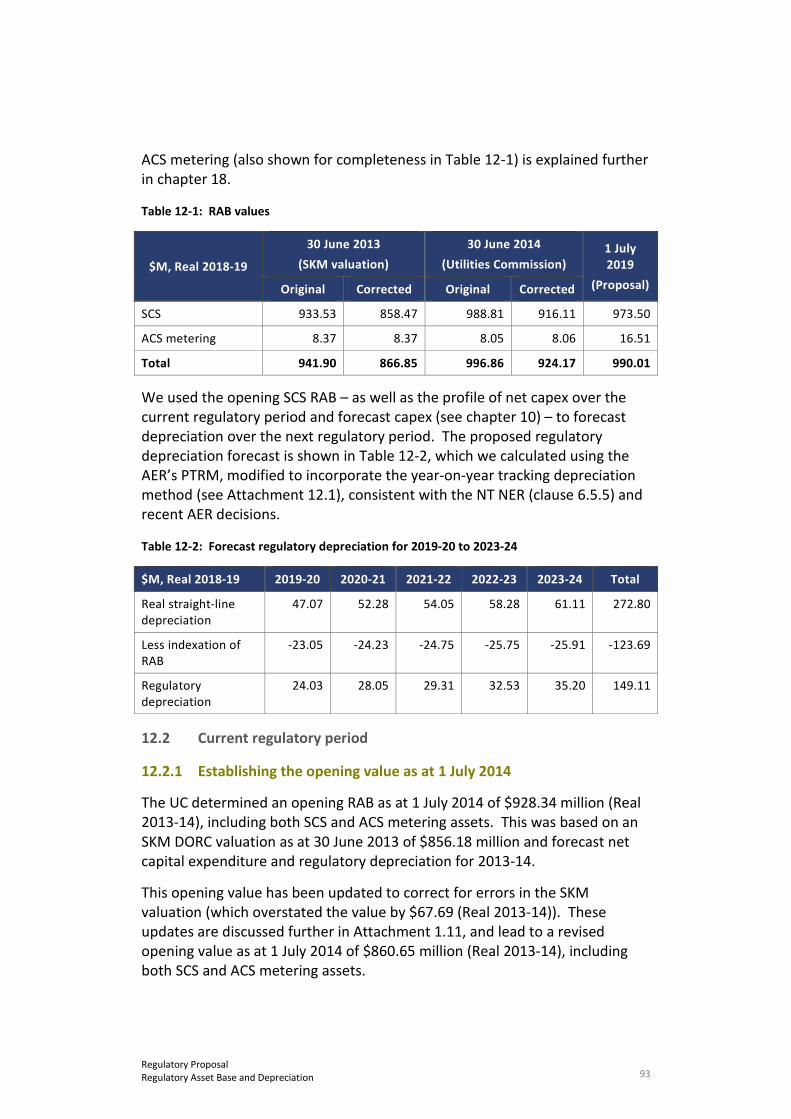
93 Regulatory Proposal Regulatory Asset Base and Depreciation
ACS metering (also shown for completeness in Table 12-1) is explained further in chapter 18.
Table 12-1: RAB values
$M, Real 2018-19
30 June 2013 (SKM valuation)
30 June 2014 (Utilities Commission)
1 July 2019
(Proposal) Original Corrected Original Corrected
SCS 933.53 858.47 988.81 916.11 973.50
ACS metering 8.37 8.37 8.05 8.06 16.51
Total 941.90 866.85 996.86 924.17 990.01
We used the opening SCS RAB – as well as the profile of net capex over the current regulatory period and forecast capex (see chapter 10) – to forecast depreciation over the next regulatory period. The proposed regulatory depreciation forecast is shown in Table 12-2, which we calculated using the AER’s PTRM, modified to incorporate the year-on-year tracking depreciation method (see Attachment 12.1), consistent with the NT NER (clause 6.5.5) and recent AER decisions.
Table 12-2: Forecast regulatory depreciation for 2019-20 to 2023-24
$M, Real 2018-19 2019-20 2020-21 2021-22 2022-23 2023-24 Total
Real straight-line depreciation
47.07 52.28 54.05 58.28 61.11 272.80
Less indexation of RAB
-23.05 -24.23 -24.75 -25.75 -25.91 -123.69
Regulatory depreciation
24.03 28.05 29.31 32.53 35.20 149.11
12.2 Current regulatory period
12.2.1 Establishing the opening value as at 1 July 2014
The UC determined an opening RAB as at 1 July 2014 of $928.34 million (Real 2013-14), including both SCS and ACS metering assets. This was based on an SKM DORC valuation as at 30 June 2013 of $856.18 million and forecast net capital expenditure and regulatory depreciation for 2013-14.
This opening value has been updated to correct for errors in the SKM valuation (which overstated the value by $67.69 (Real 2013-14)). These updates are discussed further in Attachment 1.11, and lead to a revised opening value as at 1 July 2014 of $860.65 million (Real 2013-14), including both SCS and ACS metering assets.
94 Regulatory Proposal Regulatory Asset Base and Depreciation
We also expanded the 14 asset classes used by the UC in to 20 asset classes, including:
• separating distribution switchgear from transmission terminal station and distribution main asset classes in to a single new asset class (distribution switchgear)
• separating low voltage services from the distribution main asset class in to its own new asset class (LV services)
• consolidating the transmission terminal station and zone substation asset classes in to a single asset class (substations) along with some other assets (noted below) and separate out relevant assets to the new protection, SCADA and communications asset classes
• separating out relevant assets from the distribution mains asset class in to the new substation and the existing transmission lines asset classes, and rename the residual distribution lines
• separating the secondary systems – control, communications & protection asset class in to assets that fall in to the new substations, protection, SCADA and communications asset classes
• splitting the metering asset class in to six asset classes more suited to modelling ACS metering (mechanical meters, electronic meters, metering communications, metering dedicated CTs and VTs, metering non-network other, and metering non-network IT and communications).
We mapped the existing assets to these new asset categories using the detailed SKM workbook that the UC used to establish the opening RAB. The descriptions in that workbook were sufficiently detailed so that we did not need to use approximations. The workbook, adjusted to reflect both the proposed mapping and the corrected valuation, is at Attachment 12.14. The same workbook, adjusted only for the corrected valuation, is at Attachment 12.23.
Table 12-3 describes the 20 asset classes (ignoring capitalised equity raising costs) and shows the opening value for each as at 1 July 2014, split between SCS and ACS metering. The standard and remaining lives for each asset class are included in the roll-forward model (at Attachment 12.11).

95 Regulatory Proposal Regulatory Asset Base and Depreciation
Table 12-3: Asset class descriptions and opening value as at 1 July 2014
$M, Real 2018-19
Value Description
SCS
Substations 319.80 Assets contained within zone, terminal or switching substation facilities. These are facilities which are typically defined by the presence of HV switchgear and Power Transformers. In Maximo these assets would be defined by the ZSS service. Assets also include capacitor banks, instrument transformers, auxiliary supplies, battery systems, cables and conductors, buildings, climate control, fire systems.
Distribution lines 243.35 Lines or cables emanating from a substation at distribution voltage level (11kV or 22kV), as well as LV lines and cables. Includes poles and pole tops, voltage regulators, Cable Tunnels and LV pillars. Excludes distribution substations, distribution switchgear and LV services.
Transmission lines
181.56 Lines or cables emanating from a substation at transmission (132kV) or sub-transmission (66kV) voltage levels. Includes poles, towers and pole tops.
LV services 0.21 LV service is the final cable or conductor dedicated to connecting a customer into the LV networks. This is usually a cable from a pillar to the customer's metering box, or a conductor from a nearby pole to a connection box mounted on the customer's roof. This includes the connection hardware such as Clamps and Overhead Service Protection Devices (fuses and circuit breakers).
Distribution substations
88.87 Distribution facilities which transform voltage from HV distribution levels (22kV or 11kV) to LV. This includes other associated assets such as LV switchgear, earthing, equipment enclosures, footings, locks, signage etc. Where the facility is indoors, this category includes costs associated with maintaining the room's fixtures and fittings including cable tunnels. HV switchgear is excluded - this is covered in the distribution switchgear category.
Distribution switchgear
16.22 Assets which perform switching at distribution voltage levels (22kV or 11kV). This includes switching facilities such as switching stations, ring main units (RMUs), modular switchgear, air-break switches, gas-break switches, reclosers, fusesavers, EDOs and links.
Protection 10.36 This category includes protection relays and protection panels (including auxiliary relays, test blocks and panel wiring) in substation facilities. Recloser protection components are excluded - these are considered part of the recloser device.
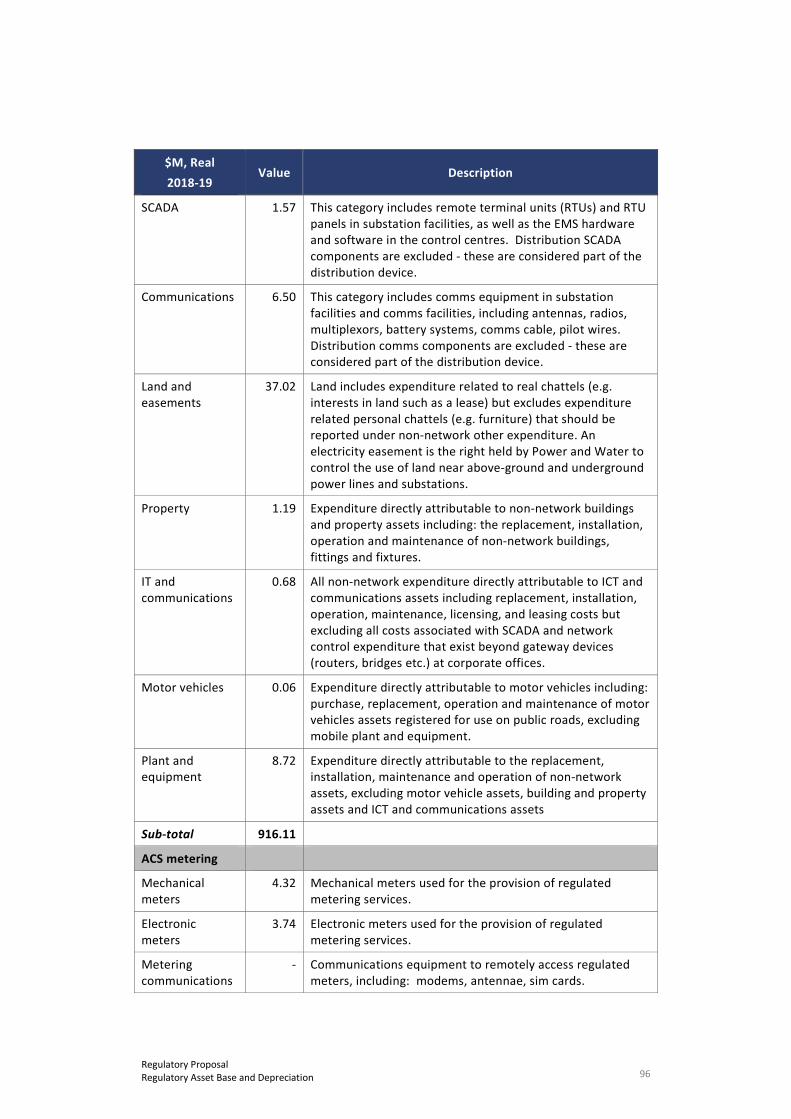
96 Regulatory Proposal Regulatory Asset Base and Depreciation
$M, Real 2018-19
Value Description
SCADA 1.57 This category includes remote terminal units (RTUs) and RTU panels in substation facilities, as well as the EMS hardware and software in the control centres. Distribution SCADA components are excluded - these are considered part of the distribution device.
Communications 6.50 This category includes comms equipment in substation facilities and comms facilities, including antennas, radios, multiplexors, battery systems, comms cable, pilot wires. Distribution comms components are excluded - these are considered part of the distribution device.
Land and easements
37.02 Land includes expenditure related to real chattels (e.g. interests in land such as a lease) but excludes expenditure related personal chattels (e.g. furniture) that should be reported under non-network other expenditure. An electricity easement is the right held by Power and Water to control the use of land near above-ground and underground power lines and substations.
Property 1.19 Expenditure directly attributable to non-network buildings and property assets including: the replacement, installation, operation and maintenance of non-network buildings, fittings and fixtures.
IT and communications
0.68 All non-network expenditure directly attributable to ICT and communications assets including replacement, installation, operation, maintenance, licensing, and leasing costs but excluding all costs associated with SCADA and network control expenditure that exist beyond gateway devices (routers, bridges etc.) at corporate offices.
Motor vehicles 0.06 Expenditure directly attributable to motor vehicles including: purchase, replacement, operation and maintenance of motor vehicles assets registered for use on public roads, excluding mobile plant and equipment.
Plant and equipment
8.72 Expenditure directly attributable to the replacement, installation, maintenance and operation of non-network assets, excluding motor vehicle assets, building and property assets and ICT and communications assets
Sub-total 916.11
ACS metering
Mechanical meters
4.32 Mechanical meters used for the provision of regulated metering services.
Electronic meters
3.74 Electronic meters used for the provision of regulated metering services.
Metering communications
- Communications equipment to remotely access regulated meters, including: modems, antennae, sim cards.
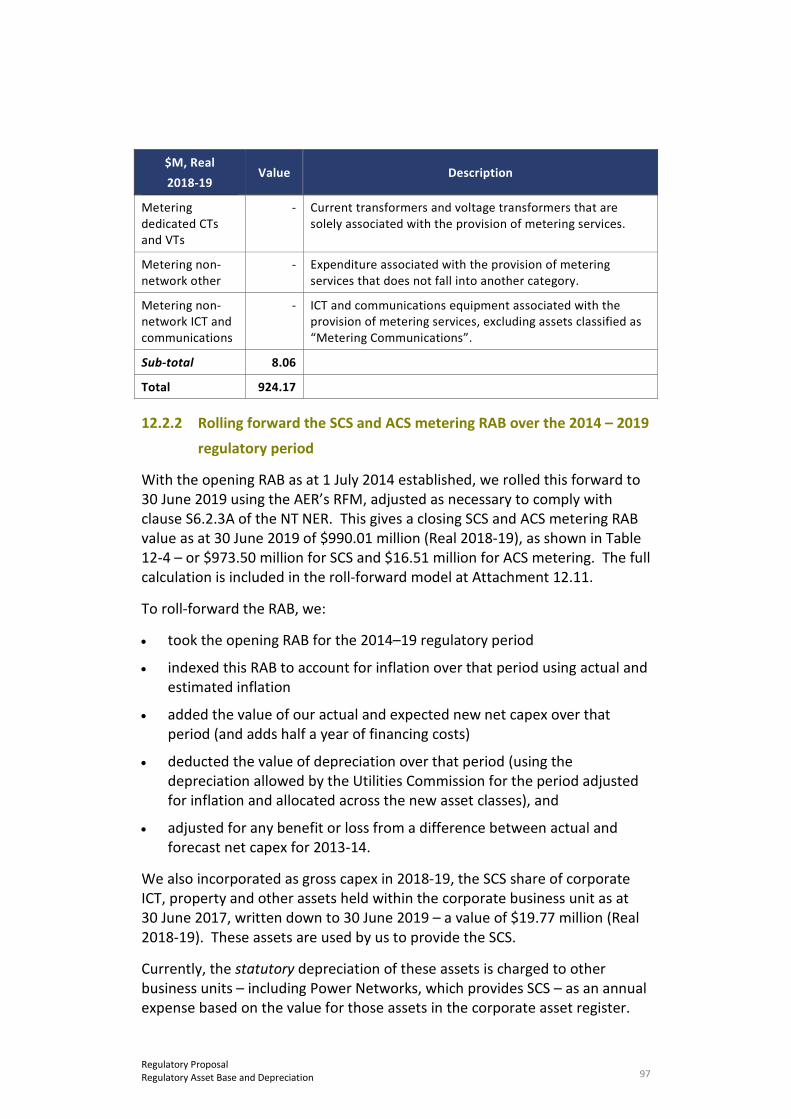
97 Regulatory Proposal Regulatory Asset Base and Depreciation
$M, Real 2018-19
Value Description
Metering dedicated CTs and VTs
- Current transformers and voltage transformers that are solely associated with the provision of metering services.
Metering non-network other
- Expenditure associated with the provision of metering services that does not fall into another category.
Metering non-network ICT and communications
- ICT and communications equipment associated with the provision of metering services, excluding assets classified as “Metering Communications”.
Sub-total 8.06
Total 924.17
12.2.2 Rolling forward the SCS and ACS metering RAB over the 2014 – 2019
regulatory period
With the opening RAB as at 1 July 2014 established, we rolled this forward to 30 June 2019 using the AER’s RFM, adjusted as necessary to comply with clause S6.2.3A of the NT NER. This gives a closing SCS and ACS metering RAB value as at 30 June 2019 of $990.01 million (Real 2018-19), as shown in Table 12-4 – or $973.50 million for SCS and $16.51 million for ACS metering. The full calculation is included in the roll-forward model at Attachment 12.11.
To roll-forward the RAB, we:
• took the opening RAB for the 2014–19 regulatory period
• indexed this RAB to account for inflation over that period using actual and estimated inflation
• added the value of our actual and expected new net capex over that period (and adds half a year of financing costs)
• deducted the value of depreciation over that period (using the depreciation allowed by the Utilities Commission for the period adjusted for inflation and allocated across the new asset classes), and
• adjusted for any benefit or loss from a difference between actual and forecast net capex for 2013-14.
We also incorporated as gross capex in 2018-19, the SCS share of corporate ICT, property and other assets held within the corporate business unit as at 30 June 2017, written down to 30 June 2019 – a value of $19.77 million (Real 2018-19). These assets are used by us to provide the SCS.
Currently, the statutory depreciation of these assets is charged to other business units – including Power Networks, which provides SCS – as an annual expense based on the value for those assets in the corporate asset register.
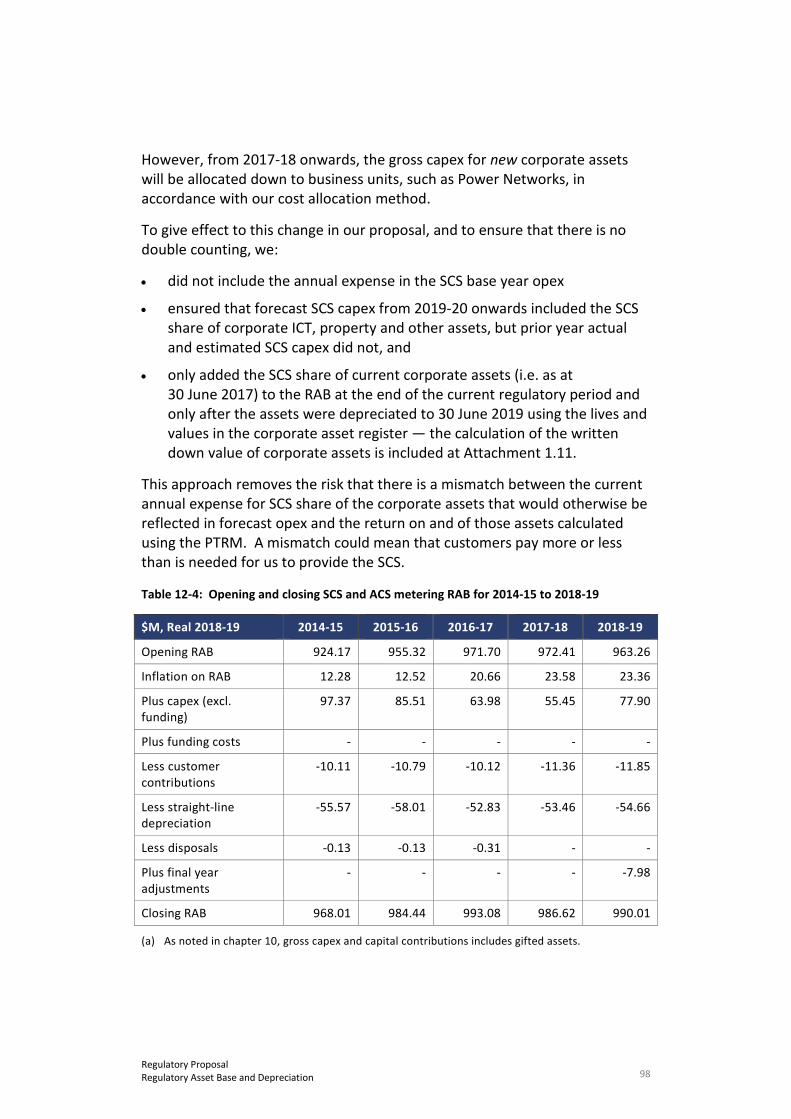
98 Regulatory Proposal Regulatory Asset Base and Depreciation
However, from 2017-18 onwards, the gross capex for new corporate assets will be allocated down to business units, such as Power Networks, in accordance with our cost allocation method.
To give effect to this change in our proposal, and to ensure that there is no double counting, we:
• did not include the annual expense in the SCS base year opex
• ensured that forecast SCS capex from 2019-20 onwards included the SCS share of corporate ICT, property and other assets, but prior year actual and estimated SCS capex did not, and
• only added the SCS share of current corporate assets (i.e. as at 30 June 2017) to the RAB at the end of the current regulatory period and only after the assets were depreciated to 30 June 2019 using the lives and values in the corporate asset register — the calculation of the written down value of corporate assets is included at Attachment 1.11.
This approach removes the risk that there is a mismatch between the current annual expense for SCS share of the corporate assets that would otherwise be reflected in forecast opex and the return on and of those assets calculated using the PTRM. A mismatch could mean that customers pay more or less than is needed for us to provide the SCS.
Table 12-4: Opening and closing SCS and ACS metering RAB for 2014-15 to 2018-19
$M, Real 2018-19 2014-15 2015-16 2016-17 2017-18 2018-19
Opening RAB 924.17 955.32 971.70 972.41 963.26
Inflation on RAB 12.28 12.52 20.66 23.58 23.36
Plus capex (excl. funding)
97.37 85.51 63.98 55.45 77.90
Plus funding costs - - - - -
Less customer contributions
-10.11 -10.79 -10.12 -11.36 -11.85
Less straight-line depreciation
-55.57 -58.01 -52.83 -53.46 -54.66
Less disposals -0.13 -0.13 -0.31 - -
Plus final year adjustments
- - - - -7.98
Closing RAB 968.01 984.44 993.08 986.62 990.01
(a) As noted in chapter 10, gross capex and capital contributions includes gifted assets.

99 Regulatory Proposal Regulatory Asset Base and Depreciation
12.3 Next regulatory period
12.3.1 Rolling forward the SCS RAB in next regulatory period
We used the approach in the AER’s PTRM to roll-forward the SCS RAB in the next regulatory period, which gives the proposed roll-forward shown in Table 12-5 below. Chapter 18 explains the roll-forward of the ACS metering RAB over that period.
In short, this approach:
• starts with the opening RAB for the next regulatory period
• indexes this RAB to account for inflation over that period using forecast inflation of 2.42% (see chapter 13 for further detail)
• adds the value of our forecast new net capex over the period (and adds half a year of financing costs), and
• deducts the value of real straight-line depreciation over the period:
– using the year-on-year tracking method to depreciate existing assets; and
– the same standard asset lives applied to roll-forward the RAB over the current period to depreciate new assets.
We have adopted the year-on-year tracking method because it better reflects the use of assets over their standard lives. The AER has considered – and ultimately adopted – this method in other recent decisions.42 For the same reasons considered in those decisions, we propose the year-on-year tracking method.
Under the year-on-year tracking method:
• assets in existence at 1 July 2014 are depreciated by asset class using real straight-line depreciation with remaining lives determined in the UC’s 2014 Network Price Determination adjusted for:
– forecast depreciation over the 2014–19 regulatory period, and
– the revised asset classes.
• net capex in each year of the current regulatory period is grouped by asset class and separately depreciated using real straight-line depreciation over their standard lives – again as determined in the UC’s 2014 Network
42 See, for instance, AER, CitiPower – Determination 2016–20, 26 May 2016, Attachment 5.
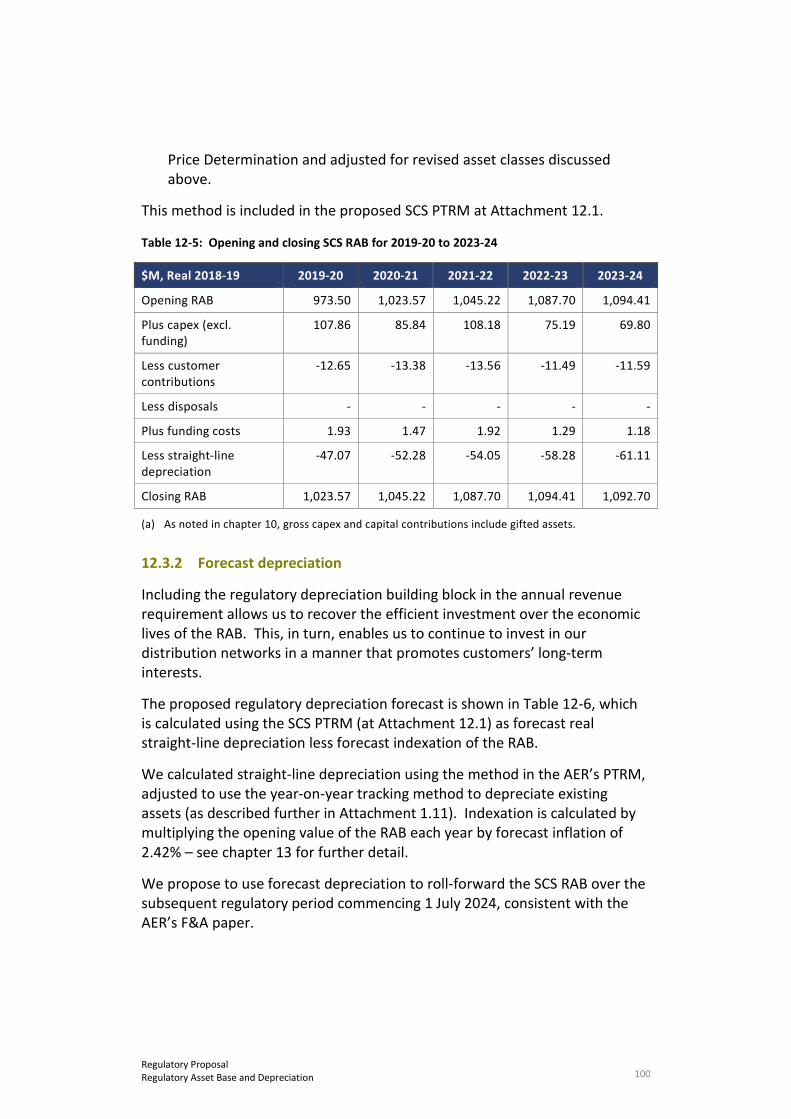
100 Regulatory Proposal Regulatory Asset Base and Depreciation
Price Determination and adjusted for revised asset classes discussed above.
This method is included in the proposed SCS PTRM at Attachment 12.1.
Table 12-5: Opening and closing SCS RAB for 2019-20 to 2023-24
$M, Real 2018-19 2019-20 2020-21 2021-22 2022-23 2023-24
Opening RAB 973.50 1,023.57 1,045.22 1,087.70 1,094.41
Plus capex (excl. funding)
107.86 85.84 108.18 75.19 69.80
Less customer contributions
-12.65 -13.38 -13.56 -11.49 -11.59
Less disposals - - - - -
Plus funding costs 1.93 1.47 1.92 1.29 1.18
Less straight-line depreciation
-47.07 -52.28 -54.05 -58.28 -61.11
Closing RAB 1,023.57 1,045.22 1,087.70 1,094.41 1,092.70
(a) As noted in chapter 10, gross capex and capital contributions include gifted assets.
12.3.2 Forecast depreciation
Including the regulatory depreciation building block in the annual revenue requirement allows us to recover the efficient investment over the economic lives of the RAB. This, in turn, enables us to continue to invest in our distribution networks in a manner that promotes customers’ long-term interests.
The proposed regulatory depreciation forecast is shown in Table 12-6, which is calculated using the SCS PTRM (at Attachment 12.1) as forecast real straight-line depreciation less forecast indexation of the RAB.
We calculated straight-line depreciation using the method in the AER’s PTRM, adjusted to use the year-on-year tracking method to depreciate existing assets (as described further in Attachment 1.11). Indexation is calculated by multiplying the opening value of the RAB each year by forecast inflation of 2.42% – see chapter 13 for further detail.
We propose to use forecast depreciation to roll-forward the SCS RAB over the subsequent regulatory period commencing 1 July 2024, consistent with the AER’s F&A paper.
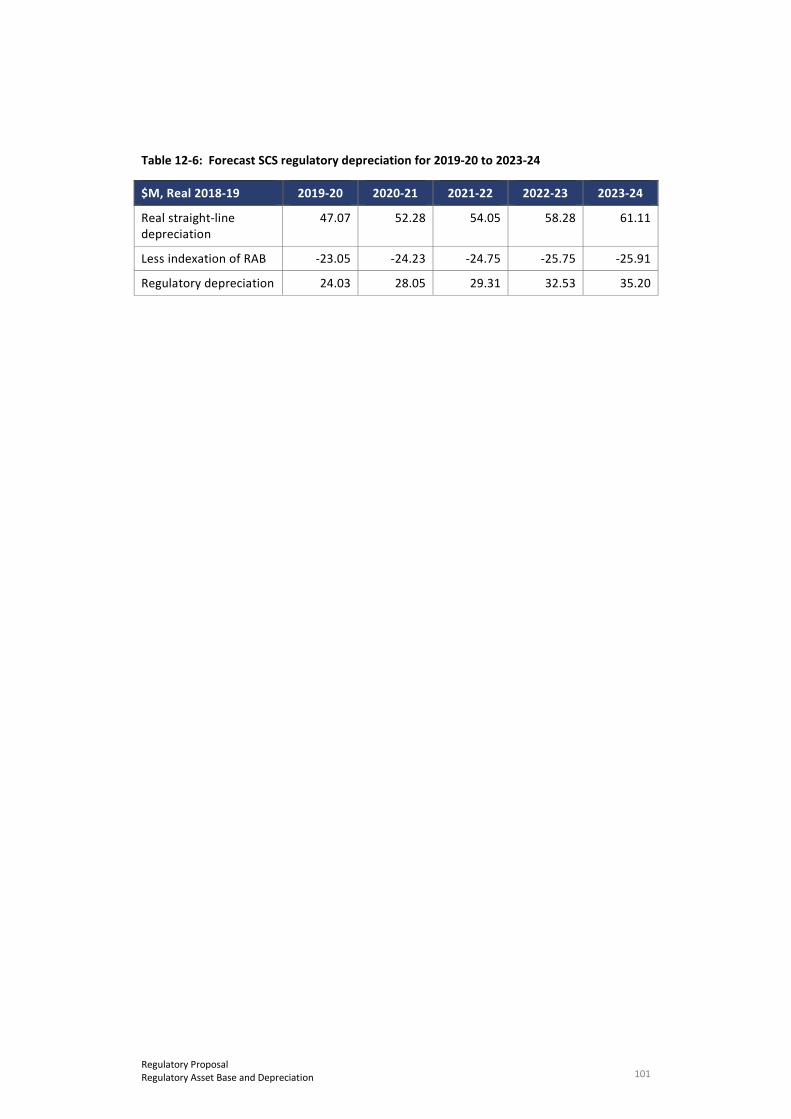
101 Regulatory Proposal Regulatory Asset Base and Depreciation
Table 12-6: Forecast SCS regulatory depreciation for 2019-20 to 2023-24
$M, Real 2018-19 2019-20 2020-21 2021-22 2022-23 2023-24
Real straight-line depreciation
47.07 52.28 54.05 58.28 61.11
Less indexation of RAB -23.05 -24.23 -24.75 -25.75 -25.91
Regulatory depreciation 24.03 28.05 29.31 32.53 35.20

102 Regulatory Proposal Rate of return, inflation and debt and equity raising costs
13. Rate of return, inflation and debt and equity raising costs
NT NER
6.4.3(a)(2) - Building blocks include return on capital; 6.4.3(b)(2) - Calculation of return on capital building block; 6.5.2 - Return on capital; S6.1.3(9), (9A) and (9B) - Calculation of return on equity/ debt and allowed rate of return, reasons for any departure from Rate of Return Guidelines, and formula for calculation; value of imputation credits
RIN Nil
Key messages
• We need to be able to earn a fair rate of return of capital to continue investing in the network in a manner that best promotes customers’ long-term interests
• We propose a rate of return of 6.62% for first year of the 2019–24 regulatory period. We determined this value using the values and approaches set out in the 2013 Rate of Return Guideline, except for the return on debt where we propose using the trailing average return on debt immediately without transition.
• The trailing average approach reduces the amount the return on debt allowance will vary over time, resulting in less price variation for electricity consumers.
• This departure is justified because both our current tariffs and our actual debt financing costs already reflect a trailing average approach – and so no transition is required. Unlike other network service providers regulated by the AER, our current tariffs are not based on an on-the-day return on debt allowance and instead were based on a rate of return set by the Minister, which is much closer to a trailing average return on debt once combined with the return on debt allowance for the previous regulatory period. In these circumstances, it would not make sense to assume the on-the-day approach as the starting point for a transition, and it would be unfair to the business as it would compensate us at less than what is efficient.
• We recognise that the AER is currently reviewing its preferred approaches to estimating the rate of return – including on return on debt transition – as part of its consultation on its 2018 Rate of Return Guideline review (expected in December 2018) and in remaking decisions for the ACT and NSW gas and electricity distribution networks. The outcomes from these reviews may require us to reconsider our proposed approaches.
• We also propose adopting the AER’s preferred approaches to estimating forecast inflation, and debt and equity raising costs.
13.1 Overview
The rate of return is a key input used to calculate the return on capital allowance – which is the largest building block in our proposed annual

103 Regulatory Proposal Rate of return, inflation and debt and equity raising costs
revenue requirements. The rate of return represents the costs of funding investments in the network through borrowings from debt markets and investments from equity holders.
This chapter explains and justifies the proposed rate of return, inflation and debt and equity raising costs for the next regulatory period, which must comply with the NT NER requirements. Broadly, the NT NER require us to propose a benchmark rate of return that reflects the funding costs of a benchmark efficient entity that provides distribution, including metering, services to customers over that period. The NT NER also require us only to propose expenditure, such as debt or equity raising costs, that is consistent with the objectives and criteria discussed in chapters 10 and 11 on capex and opex respectively.
The proposed rate of return, inflation and gamma parameters are shown in Table 13-1. These are calculated or captured in the rate of return model and included at Attachment 12.10 of this regulatory proposal. The gamma input is considered further in chapter 14 as an input to our proposed allowance for the cost of corporate income tax.
Table 13-1: Proposed rate of return, inflation and debt and equity raising cost parameters
Value
Return on equity 7.00%
Return on debt 6.37%
Inflation 2.42%
Leverage 60.00%
Gamma 40.00%
Corporate tax rate 30.00%
Nominal vanilla WACC 6.62%
Note: the returns on equity and debt are calculated using bond yields observed during a placeholder averaging period of 1 – 30 June 2017. We propose that these returns are updated using the averaging periods set out in confidential Attachment 1.9.
The proposed rate of return contributes to forecast return on capital of $337.79 million over the 2019–24 regulatory period, which – when combined with our proposed corporate tax allowance for the same period – is approximately 0.2 per cent or $0.7 million lower than the allowance set by the UC for the current regulatory period. The proposed return on capital building block is shown in Table 13-2.
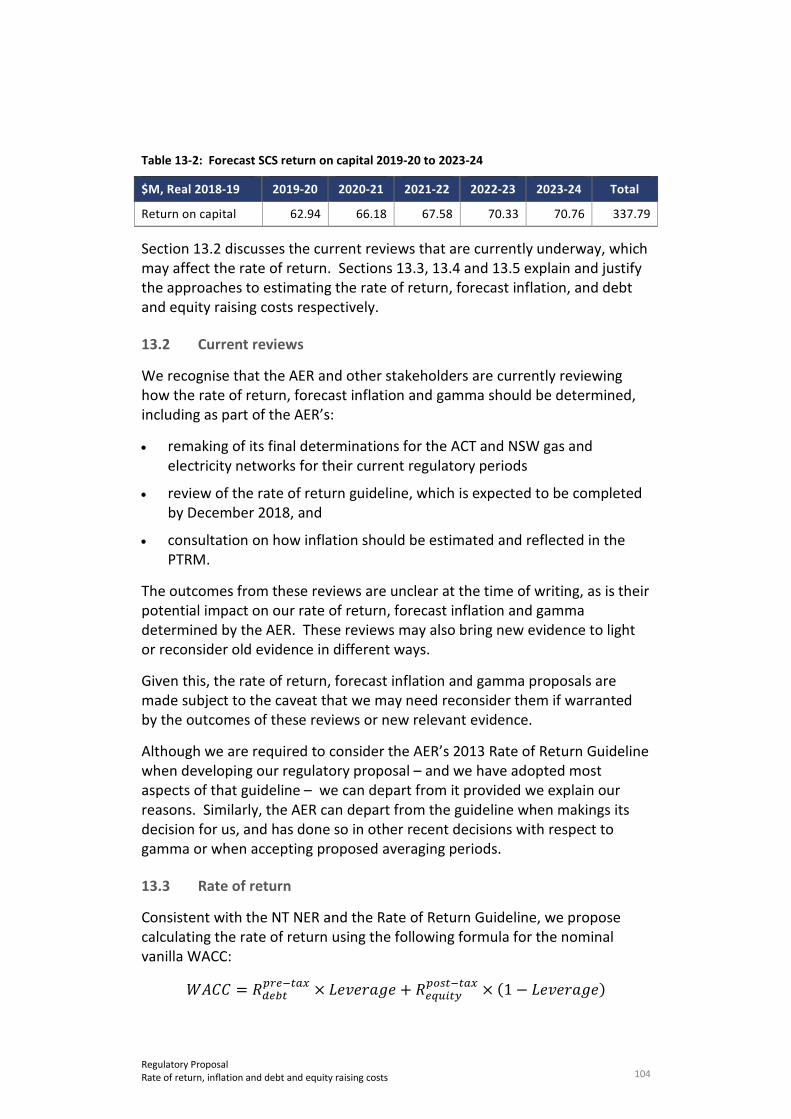
104 Regulatory Proposal Rate of return, inflation and debt and equity raising costs
Table 13-2: Forecast SCS return on capital 2019-20 to 2023-24
$M, Real 2018-19 2019-20 2020-21 2021-22 2022-23 2023-24 Total
Return on capital 62.94 66.18 67.58 70.33 70.76 337.79
Section 13.2 discusses the current reviews that are currently underway, which may affect the rate of return. Sections 13.3, 13.4 and 13.5 explain and justify the approaches to estimating the rate of return, forecast inflation, and debt and equity raising costs respectively.
13.2 Current reviews
We recognise that the AER and other stakeholders are currently reviewing how the rate of return, forecast inflation and gamma should be determined, including as part of the AER’s:
• remaking of its final determinations for the ACT and NSW gas and electricity networks for their current regulatory periods
• review of the rate of return guideline, which is expected to be completed by December 2018, and
• consultation on how inflation should be estimated and reflected in the PTRM.
The outcomes from these reviews are unclear at the time of writing, as is their potential impact on our rate of return, forecast inflation and gamma determined by the AER. These reviews may also bring new evidence to light or reconsider old evidence in different ways.
Given this, the rate of return, forecast inflation and gamma proposals are made subject to the caveat that we may need reconsider them if warranted by the outcomes of these reviews or new relevant evidence.
Although we are required to consider the AER’s 2013 Rate of Return Guideline when developing our regulatory proposal – and we have adopted most aspects of that guideline – we can depart from it provided we explain our reasons. Similarly, the AER can depart from the guideline when makings its decision for us, and has done so in other recent decisions with respect to gamma or when accepting proposed averaging periods.
13.3 Rate of return
Consistent with the NT NER and the Rate of Return Guideline, we propose calculating the rate of return using the following formula for the nominal vanilla WACC:
𝑊𝑊𝑊𝑊𝑊𝑊𝑊𝑊 = 𝑅𝑅𝑑𝑑𝑑𝑑𝑑𝑑𝑑𝑑𝑝𝑝𝑝𝑝𝑑𝑑−𝑑𝑑𝑡𝑡𝑡𝑡 × 𝐿𝐿𝐿𝐿𝐿𝐿𝐿𝐿𝐿𝐿𝐿𝐿𝐿𝐿𝐿𝐿 + 𝑅𝑅𝑑𝑑𝑒𝑒𝑒𝑒𝑒𝑒𝑑𝑑𝑒𝑒
𝑝𝑝𝑝𝑝𝑝𝑝𝑑𝑑−𝑑𝑑𝑡𝑡𝑡𝑡 × (1 − 𝐿𝐿𝐿𝐿𝐿𝐿𝐿𝐿𝐿𝐿𝐿𝐿𝐿𝐿𝐿𝐿)

105 Regulatory Proposal Rate of return, inflation and debt and equity raising costs
Where:
• 𝑅𝑅𝑑𝑑𝑑𝑑𝑑𝑑𝑑𝑑𝑝𝑝𝑝𝑝𝑑𝑑−𝑑𝑑𝑡𝑡𝑡𝑡 is the pre-tax nominal return on debt
• 𝑅𝑅𝑑𝑑𝑒𝑒𝑒𝑒𝑒𝑒𝑑𝑑𝑒𝑒𝑝𝑝𝑝𝑝𝑝𝑝𝑑𝑑−𝑑𝑑𝑡𝑡𝑡𝑡 is the post-tax nominal return on equity, and
• 𝐿𝐿𝐿𝐿𝐿𝐿𝐿𝐿𝐿𝐿𝐿𝐿𝐿𝐿𝐿𝐿 is the share of capital funded by debt.
This formula is a change from that used by the UC to set the rate of return for the current regulatory period, which was calculated using a pre-tax nominal WACC. The change from a pre-tax formula to a post-tax formula means that the tax component of the return on capital building block is split out in to a separate corporate income tax building block, as reflected in the AER’s PTRM. We discuss the tax building block in chapter 14, including the corporate tax (30%) and gamma (40%) parameters that are used to calculate it.
To apply the nominal vanilla WACC formula above, we propose adopting leverage of 60%, consistent with the Rate of Return Guideline, and returns of equity and debt of 7.00% and 6.37% respectively, as explained and justified in the next two subsections. Inserting these parameters in to the formula gives a rate of return of 6.62%, as calculated in the proposed PTRM for SCS at Attachment 12.1 to this regulatory proposal.
13.3.1 Return on equity
Consistent with the Rate of Return Guideline, we propose to estimate the post-tax return on equity using the Sharpe-Lintner Capital Asset Pricing Model, with an equity beta of 0.7, a market risk premium of 6.5%, and a risk-free rate estimated using the yields on Commonwealth Government Securities observed during a 20-business day averaging period and interpolated to a ten-year maturity. We also propose to round the return on equity estimate to the nearest ten basis points.
Applying this approach to our placeholder averaging period, we estimate a return on equity of 7.00%. This is calculated in our rate of return model included as Attachment 12.10 to this regulatory proposal.
13.3.2 Return on debt
Consistent with the Rate of Return Guideline, we propose to estimate the pre-tax return on debt:
• using fair value yields for corporate bonds published by Bloomberg and the Reserve Bank of Australia (RBA) and a trailing average approach
• assuming a BBB+ credit rating and a ten-year term to maturity, and
• updating it annually throughout the next regulatory period using the averaging periods proposed in confidential attachment 1.9.
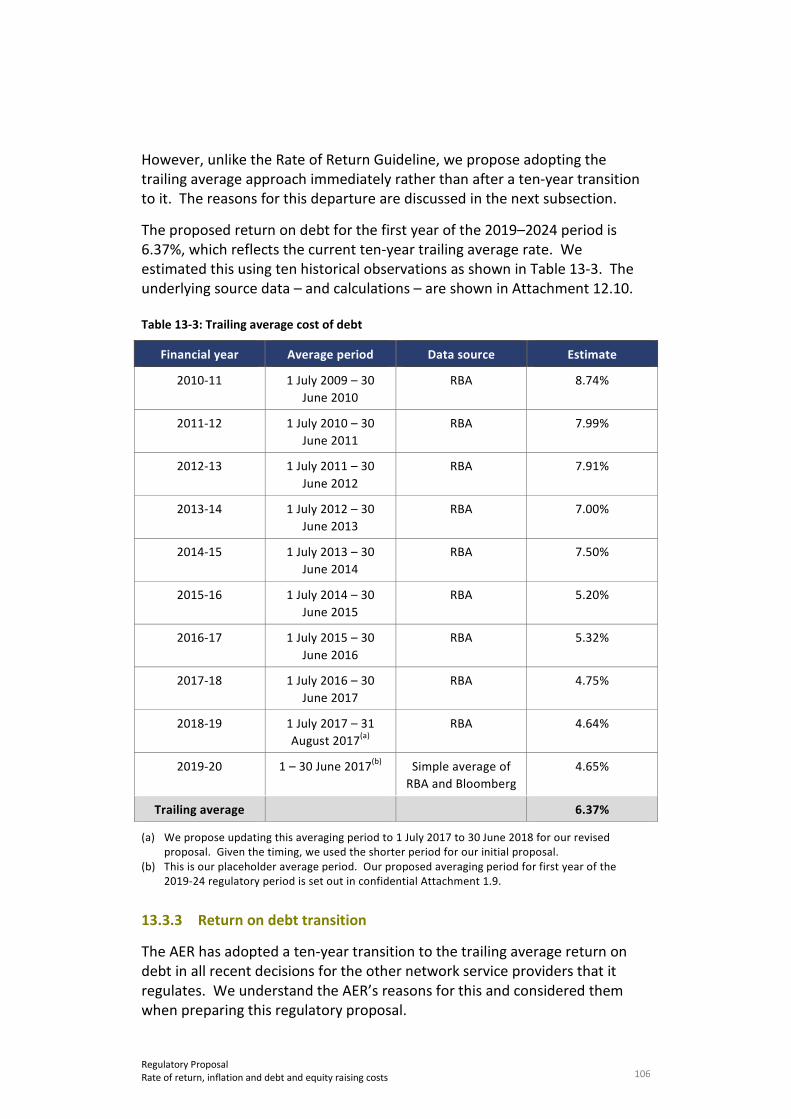
106 Regulatory Proposal Rate of return, inflation and debt and equity raising costs
However, unlike the Rate of Return Guideline, we propose adopting the trailing average approach immediately rather than after a ten-year transition to it. The reasons for this departure are discussed in the next subsection.
The proposed return on debt for the first year of the 2019–2024 period is 6.37%, which reflects the current ten-year trailing average rate. We estimated this using ten historical observations as shown in Table 13-3. The underlying source data – and calculations – are shown in Attachment 12.10.
Table 13-3: Trailing average cost of debt
Financial year Average period Data source Estimate
2010-11 1 July 2009 – 30 June 2010
RBA 8.74%
2011-12 1 July 2010 – 30 June 2011
RBA 7.99%
2012-13 1 July 2011 – 30 June 2012
RBA 7.91%
2013-14 1 July 2012 – 30 June 2013
RBA 7.00%
2014-15 1 July 2013 – 30 June 2014
RBA 7.50%
2015-16 1 July 2014 – 30 June 2015
RBA 5.20%
2016-17 1 July 2015 – 30 June 2016
RBA 5.32%
2017-18 1 July 2016 – 30 June 2017
RBA 4.75%
2018-19 1 July 2017 – 31 August 2017(a)
RBA 4.64%
2019-20 1 – 30 June 2017(b) Simple average of RBA and Bloomberg
4.65%
Trailing average 6.37%
(a) We propose updating this averaging period to 1 July 2017 to 30 June 2018 for our revised proposal. Given the timing, we used the shorter period for our initial proposal.
(b) This is our placeholder average period. Our proposed averaging period for first year of the 2019-24 regulatory period is set out in confidential Attachment 1.9.
13.3.3 Return on debt transition
The AER has adopted a ten-year transition to the trailing average return on debt in all recent decisions for the other network service providers that it regulates. We understand the AER’s reasons for this and considered them when preparing this regulatory proposal.
107 Regulatory Proposal Rate of return, inflation and debt and equity raising costs
We agree that a trailing average approach best serves the long-term interests of consumers. We also accept that a DNSP should not receive a windfall gain when adopting that approach – and consumers should not be asked to (effectively) pay twice for the same high period in the interest rate cycle.
However, in our circumstances, we consider that adopting the trailing average approach immediately would not provide a windfall gain because unlike all other service providers regulated by the AER that we are aware of:
• the allowed return on debt reflected in our current tariffs (~4.21%) is significantly below an on-the-day rate – and when averaged with the UC determined return on debt for the prior period (8.51%) gives a value (6.36%) that is consistent with the 10-year trailing average that we propose (6.37%), and
• adopting a trailing average approach would not include rates observed during the peak of the Global Financial Crisis over 2008 and early 2009 – as the averaging period used to apply that approach need only stretch back to July 2009.
We also consider that adopting a trailing average is consistent with the NT NER and past AER decisions.
We explain our rationale further in Attachment 1.10.
13.3.4 Updating the return on debt
Under the trailing average approach, the return on debt will need to be updated in each year of the regulatory control period. We propose to update the return on debt in accordance with the following formula (in accordance with the Rate of Return Guidelines):
𝑘𝑘𝑘𝑘𝑡𝑡+1 =1
10�𝑅𝑅𝑡𝑡−10+𝑑𝑑𝑡𝑡+𝑑𝑑10
𝑑𝑑=1
where:
• 𝑘𝑘𝑘𝑘𝑑𝑑+1 refers to the allowed return on debt for regulatory year 𝑥𝑥 + 1
• 𝑅𝑅𝑡𝑡−10+𝑑𝑑𝑡𝑡+𝑑𝑑 refers to the estimated rate of return on debt that was entered into in year (x-10+t) and matures in year (x+t) (in the formula above all debt has a ten-year term); and
• weights of 1/10 apply to each element of the trailing average.
As for the first year, the prevailing return on debt in all subsequent years will be estimated based on the AER’s preferred estimation procedure, as explained above.
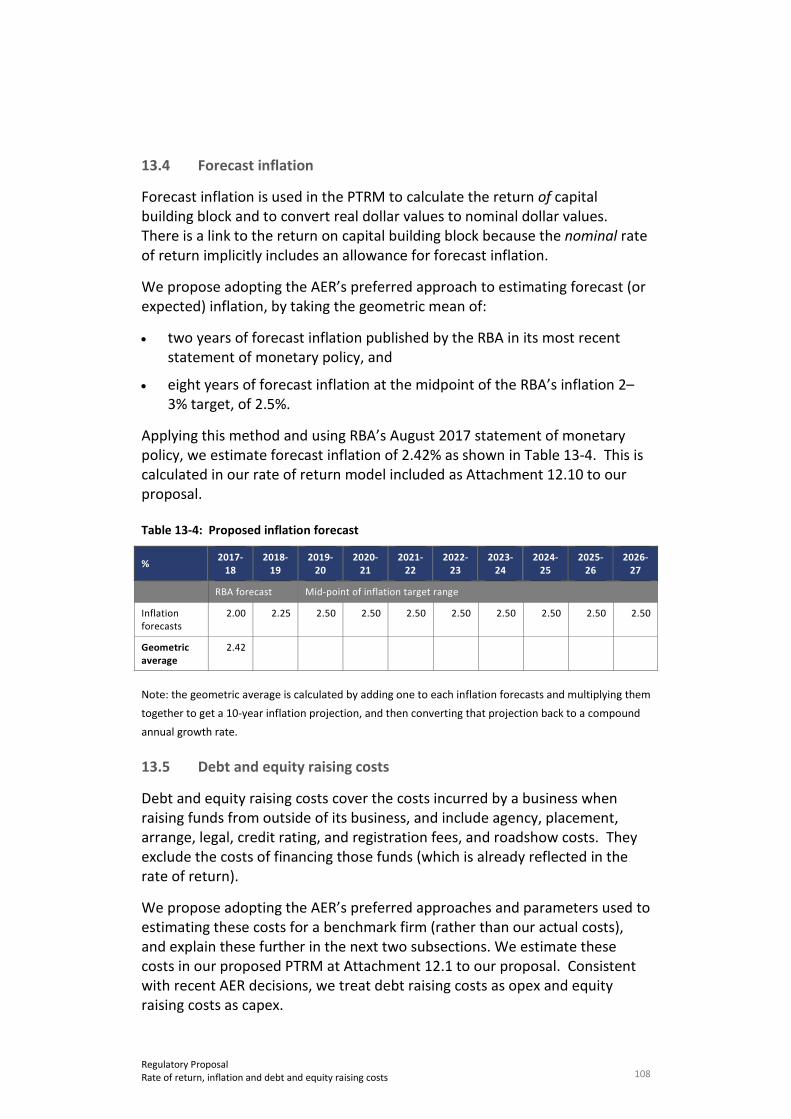
108 Regulatory Proposal Rate of return, inflation and debt and equity raising costs
13.4 Forecast inflation
Forecast inflation is used in the PTRM to calculate the return of capital building block and to convert real dollar values to nominal dollar values. There is a link to the return on capital building block because the nominal rate of return implicitly includes an allowance for forecast inflation.
We propose adopting the AER’s preferred approach to estimating forecast (or expected) inflation, by taking the geometric mean of:
• two years of forecast inflation published by the RBA in its most recent statement of monetary policy, and
• eight years of forecast inflation at the midpoint of the RBA’s inflation 2–3% target, of 2.5%.
Applying this method and using RBA’s August 2017 statement of monetary policy, we estimate forecast inflation of 2.42% as shown in Table 13-4. This is calculated in our rate of return model included as Attachment 12.10 to our proposal.
Table 13-4: Proposed inflation forecast
% 2017-18
2018-19
2019-20
2020-21
2021-22
2022-23
2023-24
2024-25
2025-26
2026-27
RBA forecast Mid-point of inflation target range
Inflation forecasts
2.00 2.25 2.50 2.50 2.50 2.50 2.50 2.50 2.50 2.50
Geometric average
2.42
Note: the geometric average is calculated by adding one to each inflation forecasts and multiplying them together to get a 10-year inflation projection, and then converting that projection back to a compound annual growth rate.
13.5 Debt and equity raising costs
Debt and equity raising costs cover the costs incurred by a business when raising funds from outside of its business, and include agency, placement, arrange, legal, credit rating, and registration fees, and roadshow costs. They exclude the costs of financing those funds (which is already reflected in the rate of return).
We propose adopting the AER’s preferred approaches and parameters used to estimating these costs for a benchmark firm (rather than our actual costs), and explain these further in the next two subsections. We estimate these costs in our proposed PTRM at Attachment 12.1 to our proposal. Consistent with recent AER decisions, we treat debt raising costs as opex and equity raising costs as capex.
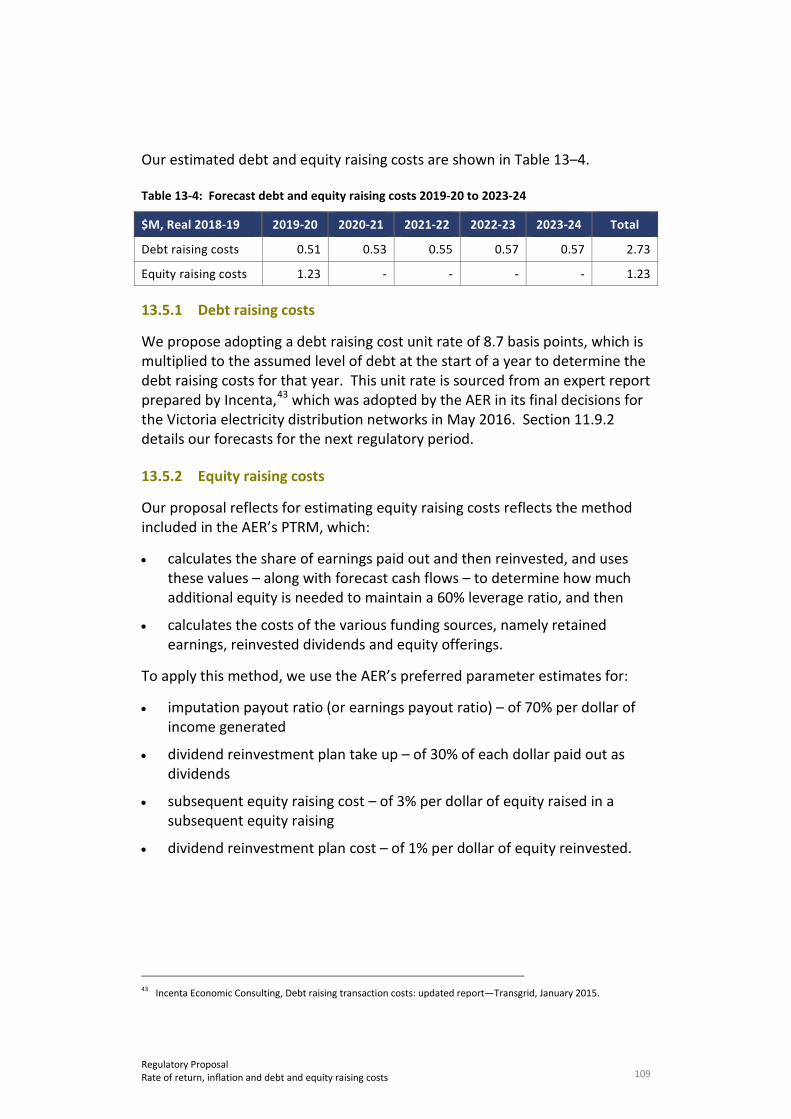
109 Regulatory Proposal Rate of return, inflation and debt and equity raising costs
Our estimated debt and equity raising costs are shown in Table 13–4.
Table 13-4: Forecast debt and equity raising costs 2019-20 to 2023-24
$M, Real 2018-19 2019-20 2020-21 2021-22 2022-23 2023-24 Total
Debt raising costs 0.51 0.53 0.55 0.57 0.57 2.73
Equity raising costs 1.23 - - - - 1.23
13.5.1 Debt raising costs
We propose adopting a debt raising cost unit rate of 8.7 basis points, which is multiplied to the assumed level of debt at the start of a year to determine the debt raising costs for that year. This unit rate is sourced from an expert report prepared by Incenta,43 which was adopted by the AER in its final decisions for the Victoria electricity distribution networks in May 2016. Section 11.9.2 details our forecasts for the next regulatory period.
13.5.2 Equity raising costs
Our proposal reflects for estimating equity raising costs reflects the method included in the AER’s PTRM, which:
• calculates the share of earnings paid out and then reinvested, and uses these values – along with forecast cash flows – to determine how much additional equity is needed to maintain a 60% leverage ratio, and then
• calculates the costs of the various funding sources, namely retained earnings, reinvested dividends and equity offerings.
To apply this method, we use the AER’s preferred parameter estimates for:
• imputation payout ratio (or earnings payout ratio) – of 70% per dollar of income generated
• dividend reinvestment plan take up – of 30% of each dollar paid out as dividends
• subsequent equity raising cost – of 3% per dollar of equity raised in a subsequent equity raising
• dividend reinvestment plan cost – of 1% per dollar of equity reinvested.
43 Incenta Economic Consulting, Debt raising transaction costs: updated report—Transgrid, January 2015.
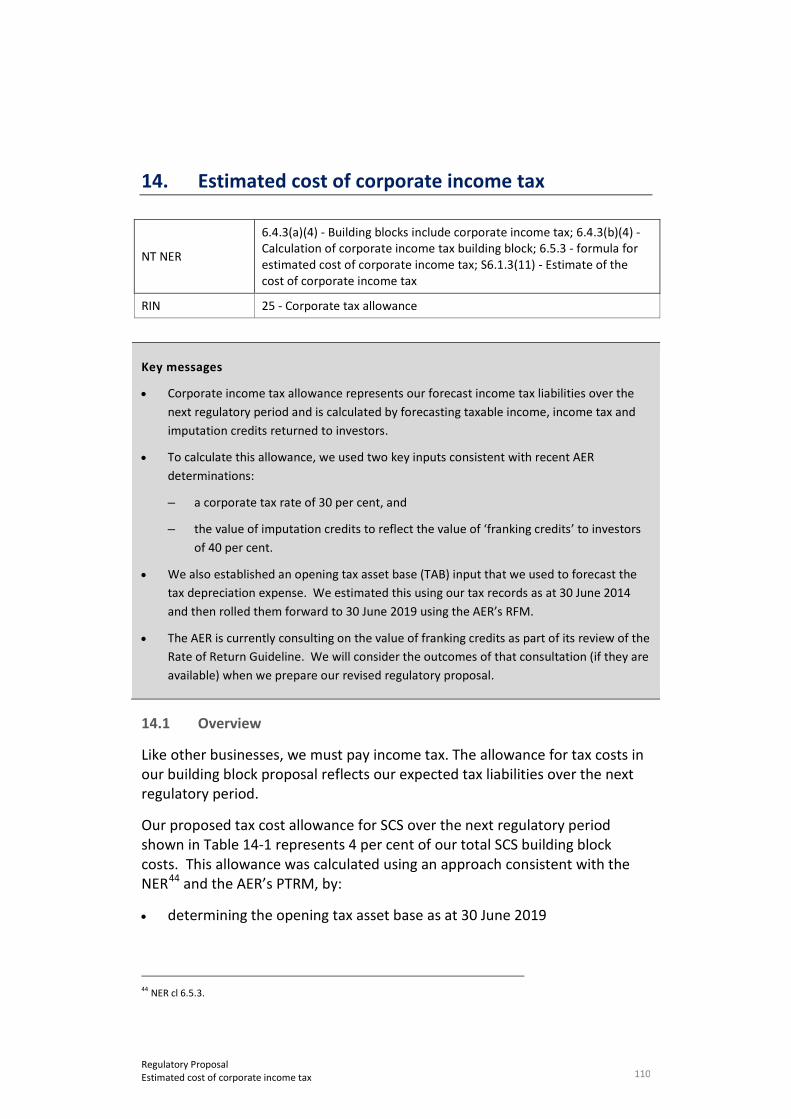
110 Regulatory Proposal Estimated cost of corporate income tax
14. Estimated cost of corporate income tax
NT NER
6.4.3(a)(4) - Building blocks include corporate income tax; 6.4.3(b)(4) - Calculation of corporate income tax building block; 6.5.3 - formula for estimated cost of corporate income tax; S6.1.3(11) - Estimate of the cost of corporate income tax
RIN 25 - Corporate tax allowance
Key messages
• Corporate income tax allowance represents our forecast income tax liabilities over the next regulatory period and is calculated by forecasting taxable income, income tax and imputation credits returned to investors.
• To calculate this allowance, we used two key inputs consistent with recent AER determinations:
– a corporate tax rate of 30 per cent, and
– the value of imputation credits to reflect the value of ‘franking credits’ to investors of 40 per cent.
• We also established an opening tax asset base (TAB) input that we used to forecast the tax depreciation expense. We estimated this using our tax records as at 30 June 2014 and then rolled them forward to 30 June 2019 using the AER’s RFM.
• The AER is currently consulting on the value of franking credits as part of its review of the Rate of Return Guideline. We will consider the outcomes of that consultation (if they are available) when we prepare our revised regulatory proposal.
14.1 Overview
Like other businesses, we must pay income tax. The allowance for tax costs in our building block proposal reflects our expected tax liabilities over the next regulatory period.
Our proposed tax cost allowance for SCS over the next regulatory period shown in Table 14-1 represents 4 per cent of our total SCS building block costs. This allowance was calculated using an approach consistent with the NER44 and the AER’s PTRM, by:
• determining the opening tax asset base as at 30 June 2019 44 NER cl 6.5.3.

111 Regulatory Proposal Estimated cost of corporate income tax
• rolling forward the tax base over the next regulatory period using forecast gross capex, asset disposals and tax depreciation
• forecasting taxable income as forecast revenue less forecast expenses, including tax depreciation
• multiplying forecast taxable income by the legislated income tax rate of 30 per cent to determine forecast taxable income, and
• reducing forecast taxable income by 40 per cent to reflect the assumed value recovered by equity investors through imputation or franking credits.45
The estimated cost of corporate income tax is calculated in the Analysis sheet of the proposed PTRM for SCS, at Attachment 12.1.
Table 14-1 – Forecast estimated cost of corporate income tax 2019-20 to 2023-24
$M, Real 2018-19 2019-20 2020-21 2021-22 2022-23 2023-24 Total
Estimated cost of corporate income tax
8.01 7.53 6.85 6.23 6.30 34.93
14.2 Forecast tax paid
14.2.1 Tax paid
The PTRM calculation of tax paid is designed to replicate the standard calculation applied by the ATO when determining tax liabilities for businesses, where:
• taxable revenue is calculated based on forecast revenue from the return on and of capital, opex and revenue adjustments building blocks and capital contributions
• taxable expenses are calculated based on forecast tax depreciation (see next section), interest expense (i.e. return on debt component of the rate of return building block), and opex (i.e. the opex building block)
• taxable income is calculated as the difference between taxable revenue and expenses, and
45 The AER has adopted an assumed value of 40% in its most recent determinations, which is a departure from the
2013 rate of return guideline. For the reasons outlined in recent AER determinations, such as that for the Victorian DNSPs in May 2016, we also depart from that guideline. We also note that the AER is currently reviewing its approach to determining the value of imputation credits as part of its consultation on the 2018 rate of return guideline. We reserve the right to reconsider our position on the value of imputation credits as new evidence or positions come to light through that consultation.
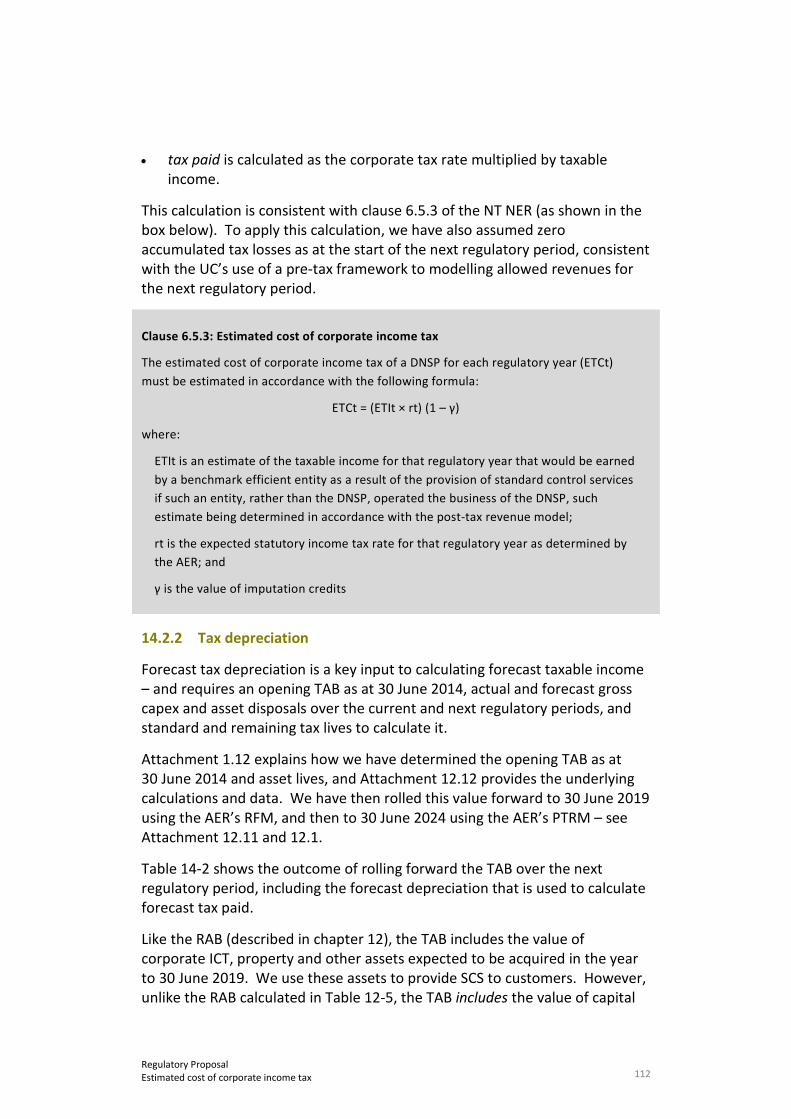
112 Regulatory Proposal Estimated cost of corporate income tax
• tax paid is calculated as the corporate tax rate multiplied by taxable income.
This calculation is consistent with clause 6.5.3 of the NT NER (as shown in the box below). To apply this calculation, we have also assumed zero accumulated tax losses as at the start of the next regulatory period, consistent with the UC’s use of a pre-tax framework to modelling allowed revenues for the next regulatory period.
Clause 6.5.3: Estimated cost of corporate income tax
The estimated cost of corporate income tax of a DNSP for each regulatory year (ETCt) must be estimated in accordance with the following formula:
ETCt = (ETIt × rt) (1 – γ)
where:
ETIt is an estimate of the taxable income for that regulatory year that would be earned by a benchmark efficient entity as a result of the provision of standard control services if such an entity, rather than the DNSP, operated the business of the DNSP, such estimate being determined in accordance with the post-tax revenue model;
rt is the expected statutory income tax rate for that regulatory year as determined by the AER; and
γ is the value of imputation credits
14.2.2 Tax depreciation
Forecast tax depreciation is a key input to calculating forecast taxable income – and requires an opening TAB as at 30 June 2014, actual and forecast gross capex and asset disposals over the current and next regulatory periods, and standard and remaining tax lives to calculate it.
Attachment 1.12 explains how we have determined the opening TAB as at 30 June 2014 and asset lives, and Attachment 12.12 provides the underlying calculations and data. We have then rolled this value forward to 30 June 2019 using the AER’s RFM, and then to 30 June 2024 using the AER’s PTRM – see Attachment 12.11 and 12.1.
Table 14-2 shows the outcome of rolling forward the TAB over the next regulatory period, including the forecast depreciation that is used to calculate forecast tax paid.
Like the RAB (described in chapter 12), the TAB includes the value of corporate ICT, property and other assets expected to be acquired in the year to 30 June 2019. We use these assets to provide SCS to customers. However, unlike the RAB calculated in Table 12-5, the TAB includes the value of capital
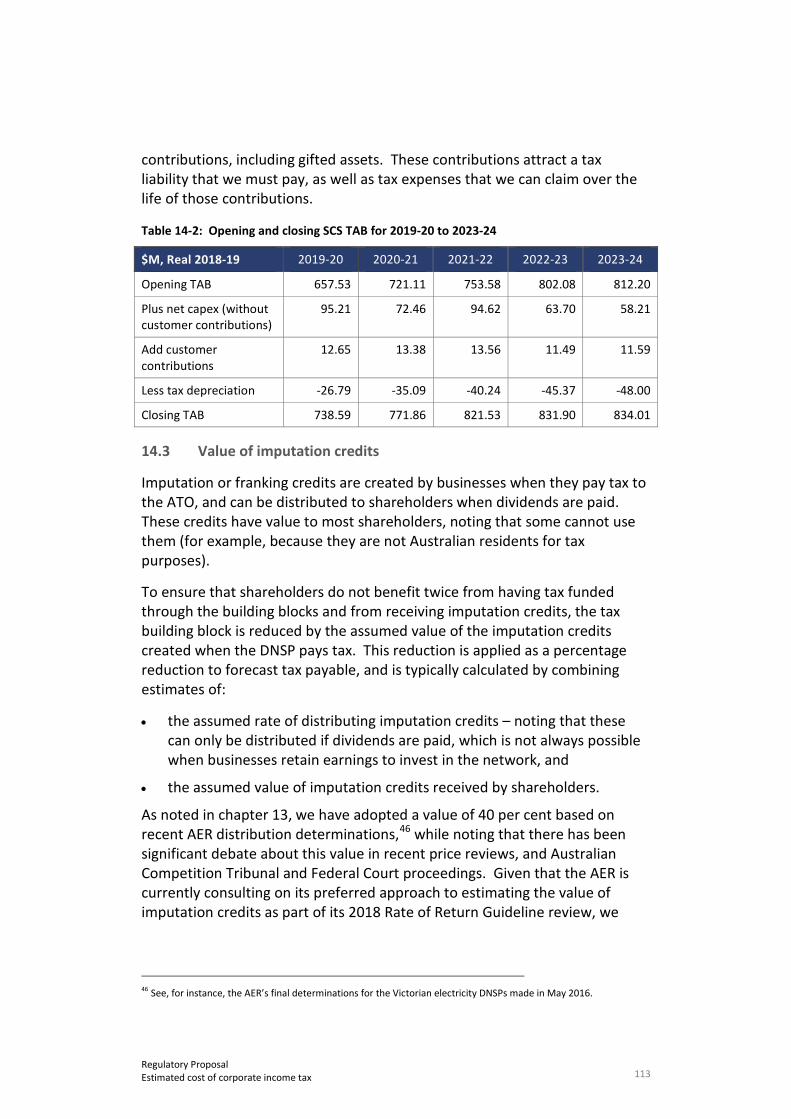
113 Regulatory Proposal Estimated cost of corporate income tax
contributions, including gifted assets. These contributions attract a tax liability that we must pay, as well as tax expenses that we can claim over the life of those contributions.
Table 14-2: Opening and closing SCS TAB for 2019-20 to 2023-24
$M, Real 2018-19 2019-20 2020-21 2021-22 2022-23 2023-24
Opening TAB 657.53 721.11 753.58 802.08 812.20
Plus net capex (without customer contributions)
95.21 72.46 94.62 63.70 58.21
Add customer contributions
12.65 13.38 13.56 11.49 11.59
Less tax depreciation -26.79 -35.09 -40.24 -45.37 -48.00
Closing TAB 738.59 771.86 821.53 831.90 834.01
14.3 Value of imputation credits
Imputation or franking credits are created by businesses when they pay tax to the ATO, and can be distributed to shareholders when dividends are paid. These credits have value to most shareholders, noting that some cannot use them (for example, because they are not Australian residents for tax purposes).
To ensure that shareholders do not benefit twice from having tax funded through the building blocks and from receiving imputation credits, the tax building block is reduced by the assumed value of the imputation credits created when the DNSP pays tax. This reduction is applied as a percentage reduction to forecast tax payable, and is typically calculated by combining estimates of:
• the assumed rate of distributing imputation credits – noting that these can only be distributed if dividends are paid, which is not always possible when businesses retain earnings to invest in the network, and
• the assumed value of imputation credits received by shareholders.
As noted in chapter 13, we have adopted a value of 40 per cent based on recent AER distribution determinations,46 while noting that there has been significant debate about this value in recent price reviews, and Australian Competition Tribunal and Federal Court proceedings. Given that the AER is currently consulting on its preferred approach to estimating the value of imputation credits as part of its 2018 Rate of Return Guideline review, we
46 See, for instance, the AER’s final determinations for the Victorian electricity DNSPs made in May 2016.

114 Regulatory Proposal Estimated cost of corporate income tax
reserve the right to reconsider this proposal if new evidence or other material comes to light during that consultation.

115 Regulatory Proposal Incentive schemes
15. Incentive schemes
NT NER
6.4.3(a)(5) - Building blocks include revenue increments or decrements due to incentive schemes; 6.4.3(b)(5) - Calculation of incentive scheme building block; 6.4.3(b)(5A) - carried forward from 2014 NT Network Determination; 6.5.8 - EBSS; 6.5.8A - CESS; 6.6.2 - STPIS; 6.6.3 - DMIS; 6.6.3A - DMIA Mechanism; S6.1.3(3) to (5A) - Describe how propose that the incentive schemes will apply
RIN 1.7 - incentive schemes; 18 - STPIS
Key messages
We accept the AER’s proposal in its F&A paper:
• to apply the EBSS and CESS
• not to apply the STPIS, including the GSL component of the national scheme while NT jurisdictional GSL scheme is in place.
• to apply the DMIS and DMIA mechanism.
15.1 Efficiency Benefit Sharing Scheme
We do not currently operate under an EBSS, or an equivalent scheme, because the UC decided not to apply one for the current regulatory period.
The AER released a new version of its national EBSS in November 2013 as part of its Better Regulation Reform program. This is the version of the EBSS that applied to other participating jurisdictions on 1 July 2016 and, for the purposes of clause 6.5.8(da) of the NT NER, is the version of the EBSS that is taken to:
• be the EBSS in force in the NT, and
• have been developed and published by the AER on 1 July 2016.
The AER indicates in the explanatory statement accompanying its EBSS that:
• its preference is to apply the revealed cost BST forecasting approach to assess DNSPs’ opex, and
• it considers that applying the EBSS in combination with the BST approach mitigates the risks of a DNSP:
116 Regulatory Proposal Incentive schemes
− increasing its opex in its base year, and − not reducing its recurrent opex as a regulatory period progresses.47
In its F&A paper, the AER indicated that it expects to apply the EBSS in our next regulatory period and that it “will decide if and how we will apply it in our determination”48.
As discussed in Chapter 11, we have used a revealed cost BST approach to forecast opex. We have used our 2016-17 opex (adjusted for efficiencies) as the base year opex, although we expect to update this for our 2017-18 actual opex when we submit our revised regulatory proposal.
We accept the application of the AER’s national EBSS in the next regulatory period and recognise that it provides a continuous incentive to pursue efficiency improvements across the period. We:
• propose a carryover period of six years, being the five years of the next regulatory period, plus one year – this is consistent with clause 1.3.1 of the EBSS and what is understood to be the AER’s practice for other DNSPs
• accept the incremental efficiency gains in the first regulatory year of the next period being calculated in accordance with clause 1.3.2 of the EBSS
• accept the incremental efficiency gains in the second regulatory year of the next period being calculated in accordance with clause 1.3.3 of the EBSS
• accept the incremental efficiency gains in the final regulatory year of the next period being calculated in accordance with clause 1.3.4 of the EBSS, and
• accept adjusting forecast or actual opex when calculating carryover amounts in accordance with clause 1.4 of the EBSS.
15.2 Capital expenditure sharing scheme
We do not currently operate under a CESS, or equivalent scheme, because the UC decided not to apply one for the current regulatory period.
The AER released its first version of the national CESS in November 2013 as part of its Better Regulation Reform program. This is the version of the CESS that applied to other participating jurisdictions on 1 July 2016 and, for the
47 AER, Efficiency Benefit Sharing Scheme – Explanatory Statement, November 2013, page 6 48 AER, Framework and Approach, Power and Water Corporation (NT) 2019-20 to 2023-24, page 46
117 Regulatory Proposal Incentive schemes
purposes of clause 6.5.8A(ea) of the NT NER, is the version of the CESS that is taken to:
• be the CESS in force in the NT, and
• have been developed and published by the AER on 1 July 2016.
In its F&A paper, the AER indicated that it intends to apply the CESS in the next regulatory period.
We accept the application of the AER’s national CESS in the next regulatory period and recognise that it provides us with financial rewards if our capex becomes more efficient and financial penalties if we become less efficient. Under the CESS, we would retain 30 per cent of the financing benefit or cost of any underspend or overspend amount, while consumers would retain the remaining 70 per cent.
We note that Transgrid has been engaging with the AER as part of its 2018-19 to 2022-23 regulatory determination process about proposed refinements and clarifications to Version 1 of the AER’s CESS. We reserve the right to reconsider this proposal if the AER amends the CESS through that (or any other) review.
15.3 Service target performance incentive scheme
The AER released a new version of its national STPIS in November 2013 as part of its Better Regulation Reform program. The STPIS contains two mechanisms:
• the service standards factor (s-factor) adjustment to the annual revenue allowance for SCS, which provides rewards (or penalises) for improved (or diminished) service compared to predetermined targets, and
• a GSL component composed of direct payments to customers49 experiencing service below a predetermined level.
This is the version of the STPIS that applied to other participating jurisdictions on 1 July 2016 and, for the purposes of clause 6.5.8(da) of the NT NER, is the version of the STPIS that is taken to:
• be the STPIS in force in the NT, and
• have been developed and published by the AER on 1 July 2016.
49 Except where a jurisdictional electricity GSL requirement applies.
118 Regulatory Proposal Incentive schemes
At the time of submitting this proposal the AER was consulting on further changes to the STPIS.
We do not currently operate under an s-factor adjustment, or equivalent arrangement, because the UC decided not to apply one for the current regulatory period. However, we have a jurisdictional GSL scheme in the NT under the EIP Code.
We accept the AER’s proposal in its F&A paper not to apply an s-factor adjustment due to the unavailability of relevant historical reliability data. However, we note the AER’s intention to collect data during the next regulatory period to establish suitable targets for the subsequent regulatory period.
We also accept the AER’s proposal in its F&A paper not to apply the national GSL scheme while the NT jurisdictional GSL Scheme is in place. We will continue to apply the NT GSL scheme in the next regulatory period and are committed, through our capex and opex program, to providing the service performance that new and existing customers want and are willing to pay for. As discussed in section 11.6, we have included a step change in our opex proposal for the new GSL arrangements under the EIP Code.
15.4 DMIS and DMIA mechanism
We do not currently operate under a DMIS or DMIA mechanism, or similar arrangement, because the UC decided not to apply them in the current regulatory period.
The AER noted in its F&A paper that it was developing a new DMIS and DMIA mechanism that would apply to all jurisdictions in the NEM. It published the new DMIS and DMIA mechanism in December 2017.
The DMIS contains three elements:
• a cost uplift, which provides an incentive of up to 50 per cent of our expected demand management costs associated with efficient demand management projects
• a net benefit constraint, which exists to ensure that the size of the incentive will not outweigh the value (or net benefit) of the demand management project. We are required to estimate the net benefit of projects under the incentive scheme using the regulatory investment test for large projects and a simpler cost–benefit analysis for small projects, and
• an overall incentive constraint, which will limit the total incentive that can be received in any one year to 1.0 per cent of maximum allowable revenue for that year.
119 Regulatory Proposal Incentive schemes
We must report on our projects to the AER in order to receive the incentive, including information on how demand management will be used to deliver value to consumers.
The DMIA mechanism comprises:
• a fixed allowance of $200,000 (real $2017), plus 0.075 per cent of our allowed revenue requirement, which would be provided ex ante in five allotments. We would recover this amount from customers throughout the regulatory period. Should the allowance not be spent, we will calculate a carryover amount to be recovered as a negative pass-through in the next regulatory period
• project eligibility requirements, which focus on projects that are innovative and have the potential to reduce long-term network costs, and
• compliance reporting requirements, which would require us to submit an annual report to the AER that sets out the amount of allowance claimed, along with specifics of each project funded by the allowance.
We accept the AER’s proposal in its F&A paper to apply a DMIS and DMIA mechanism in the next regulatory control period.
120 Regulatory Proposal Pass through events
16. Pass through events
NT NER 6.5.10 and 6.6.1(a1)(5) - Nominated pass through events; 6.6.1(a1)(1)-(4) - Prescribed pass through events
RIN Nil
Key messages
• We are largely proposing pass through events and definitions previously accepted by the AER for other DNSPs, although we are proposing a clarification to the terrorism event to ensure that the threat of cyber security is explicitly covered.
• We are nominating: an insurance cap event; an insurer’s credit risk event; a terrorism event; a natural disaster event; and a NT transitional regulatory change event from 1 July 2019.
• For the purposes of subregulation10A(3)(a) in Part 4 of the National Electricity (Northern Territory) (National Uniform Legislation) (Modification) Regulations, we assume that published but inoperative provisions in the NT NER will not meet the definition of an obligation or requirement “in an Act or instrument that was enacted or made on or before 1 July 2017 (even if the obligation or requirement commences after 1 July 2017)”, unless the commencement date and rule content are certain.
The NT NER contemplates several mechanisms for adjusting the AER’s building block determination after it has been made. One such mechanism is for pass through events. These are specific, pre-defined events that are unpredictable in nature, beyond our control and, if they occur, would involve us incurring high costs. The pass through mechanism provides a means for recovering the efficient costs of these events that we would not otherwise be able to recover.
16.1 Prescribed pass through events
The NT NER prescribe the following pass through events:
• a “local event”, which relates to an insolvent retailer failing to pay us for our services before the NERL applies in the NT50
• a “NT transitional regulatory change event”, which relates to changes in our regulatory obligations or requirements between 1 July 2017 and 30 June 201951
50 See clause 6.6.1(a1)(1AA) of the NT NER and regulation 10 of the National Electricity (Northern Territory) (National
Uniform Legislation) (Modification) Regulations.
121 Regulatory Proposal Pass through events
• a “regulatory change event”, which relates to changes in our regulatory obligations or requirements during the next regulatory period52
• a “service standard event”, which relates to a legislated or administrative act or decision that changes the nature of, service standards for, or requirement to provide, our services in the next regulatory period53
• a “tax change event”, which relates to a change in a tax or the imposition of a new, or removal of an existing, tax in the next regulatory period54, and
• a “retailer insolvency event”, which relates to an insolvent retailer failing to pay us for our services after the NERL applies in the NT.55
16.2 Nominated pass through events
The NT NER also allows us to nominate additional pass through events56 having regard for “nominated pass through event considerations”57.
We propose the following nominated pass through events for the next regulatory period:
• insurance cap event
• insurer’s credit risk event
• terrorism event
• natural disaster event, and
• NT transitional regulatory change event from 1 July 2019.
Each of the proposed events accords with the nominated pass through event considerations in the NT NER because:
• the nominated events are not already covered by one of the prescribed pass through events
• the nominated events are clearly identified, albeit that there is uncertainty about their nature, likelihood and timing
51 See clause 6.6.1(a1)(1AB) of the NT NER and regulation 10A of the National Electricity (Northern Territory)
(National Uniform Legislation) (Modification) Regulations. 52 See clause 6.6.1(a1)(1) of the NT NER and the definition in Chapter 10 of the NT NER. 53 See clause 6.6.1(a1)(2) of the NT NER and the definition in Chapter 10 of the NT NER. 54 See clause 6.6.1(a1)(3) of the NT NER and the definition in Chapter 10 of the NT NER. 55 See clause 6.6.1(a1)(4) of the NT NER and the definition in Chapter 10 of the NT NER. 56 See clause 6.5.10(a) and clause 6.6.1(a1)(5) of the NT NER and the definition in Chapter 10 of the NT NER. 57 See the definition in Chapter 10 of the NT NER.
122 Regulatory Proposal Pass through events
• we cannot reasonably prevent the nominated events from occurring or substantially mitigate the cost impact of the events, as each is effectively uncontrollable
• we cannot insure against the nominated events on reasonable economic terms, and
• we cannot self-insure the nominated events as it is not possible to calculate the self-insurance premium and the potential cost would have a significant impact on our ability to provide distribution services.
As discussed in section 16.8, we propose that these nominated pass through events apply to both SCS and ACS in the next regulatory period.
16.3 Insurer’s credit risk event
We insure our business with large, reputable insurers. However, in the unlikely event that an insurer becomes insolvent, we could face significant financial exposure. This risk is not controllable and cannot readily be mitigated. We therefore propose to treat it as a cost pass through.
We propose the following definition for this event, which the AER has accepted for other DNSPs:
An insurer credit risk event occurs if: An insurer of Power and Water Corporation becomes insolvent, and as a result, in respect of an existing or potential insurance claim for a risk that was insured by the insolvent insurer, Power and Water Corporation: (a) is subject to a higher or lower claim limit or a higher or lower deductible than would
have otherwise applied under the insolvent insurer’s policy; or (b) incurs additional costs associated with funding an insurance claim, which would
otherwise have been covered by the insolvent insurer.
16.4 Insurance cap event
Our insurance policies have limits. While in some cases we could secure insurance above these limits, it can be extremely expensive to do so. This insurance cap event means that customers would not bear the cost of excessive insurance premiums and only bear costs should an event occur.
We propose the following definition for this event, which the AER has accepted for other DNSPs:
An insurance cap event occurs if: (a) Power and Water Corporation makes a claim or claims and receives the benefit of a
payment or payments under a relevant insurance policy; (b) Power and Water Corporation incurs costs beyond the policy limit; and (c) the costs beyond the policy limit increase the costs to Power and Water Corporation in
providing direct control services. For this Insurance Cap Event:
123 Regulatory Proposal Pass through events
(d) a relevant insurance policy is an insurance policy held during the 2019-24 regulatory control period or a previous regulatory control period in which Power and Water Corporation was regulated; and
(e) Power and Water Corporation will be deemed to have made a claim on a relevant insurance policy if the claim is made by a related party of Power and Water Corporation in relation to any aspect of the Network or Power and Water Corporation's business.
16.5 Terrorism event
We cannot forecast either the occurrence or likely cost impact of any future terrorism event although, at the time of submitting this regulatory proposal, the national terrorism threat level is “probable”. A pass through mechanism is therefore an appropriate regulatory mechanism to address the impact of a “probable”, but inherently uncertain, event.
We propose the following definition for this event, which the AER has accepted for other DNSPs (with the exception of the reference to cyber threat, which has been added for clarity to ensure that it is covered):
Terrorism event means an act (including, but not limited to, the use of force or violence or the threat of force or violence such as a cyber threat that Power and Water Corporation has been unable to insure against on reasonable economic terms) of any person or group of persons (whether acting alone or on behalf of or in connection with any organisation or government), which: (a) from its nature or context is done for, or in connection with, political, religious,
ideological, ethnic or similar purposes or reasons (including the intention to influence or intimidate any government and/or put the public, or any section of the public, in fear), and
(b) increases the costs to Power and Water Corporation in providing direct control services.
16.6 Natural disaster event
We cannot forecast the occurrence or likely cost impact of any future natural disaster event, although we know with certainty that our northern region will experience an annual tropical cyclone (wet) season between October and April that will typically bring winds in excess of 100 kilometres per hour.
We propose the following definition for this event, which the AER has accepted for other DNSPs:
Natural disaster event means any natural disaster including but not limited to cyclone, fire, flood or earthquake that occurs during the 2019-20 to 2023-24 regulatory control period that increases the costs to Power and Water Corporation in providing direct control services, provided the fire, flood or other event was not a consequence of the acts or omissions of the service provider.
16.7 NT transitional regulatory change event from 1 July 2019
As identified in chapter 4, the NT’s effective transition from NT-based, to national, regulatory instruments, systems and processes is a complex and
124 Regulatory Proposal Pass through events
time-consuming task. It is reasonable to expect the finalisation of detailed arrangements to continue beyond 1 July 2019. This may well involve many detailed regulatory changes, including some to provisions that have been published at 1 July 2017, but are expressed as having no effect until a trigger occurs (such as adoption of the NERL in the NT), or as being subject to review as part of the phased transition.
Such changes would not be adequately addressed as “regulatory change events”.58 It would be inefficient to deal with them individually, given the anticipated number, magnitude and frequency of changes. Moreover, individual changes considered in isolation may not meet the materiality threshold for regulatory change events.
We note that in the current regulatory period, Regulation 10A of the National Electricity (Northern Territory) (National Uniform Legislation) (Modification) Regulations has provided for a NT regulatory change event which: 59
• applies to the sum of the changes in relevant obligations that occur between 1 July 2017 and 30 June 2019 if those changes, taken as a sum: 60
– substantially affect the manner in which a Network Service Provider provides direct control services, and
– result in a material increase or material decrease in the costs of providing those services.
• applies to changes in regulatory obligations or requirements that ‘affect’, rather than ‘materially affect’ the provision of network services that are subject of a distribution determination.
Based on experience to date, it is now reasonable to conclude that transitional arrangements and associated obligations will continue to evolve beyond 1 July 2019 into the next regulatory period, such that an additional nominated pass through event, based on the provisions in Regulation 10A described above, is warranted.
We therefore propose the following definition for an NT transitional regulatory change event from 1 July 2019:
NT transitional regulatory change event from 1 July 2019 means the sum of the changes in relevant obligations that are associated with the transition from Northern Territory to
58 See clause 6.6.1(a1)(1) of the NT NER and the definition in Chapter 10 of the NT NER. 59 See the definition of ‘relevant obligation’ in Regulation 10A(3). 60 See Regulation 10A(1), also the definition of ‘relevant obligation’ in 10A(3), as modified by 10A(5).
125 Regulatory Proposal Pass through events
national electricity regulation, and that occur between 1 July 2019 and 30 June 2024 if those changes, taken as a sum: (a) substantially affect the manner in which Power and Water Corporation provides
direct control services; and (b) result in a material increase or material decrease in the costs of providing those
services, that is incurred, or likely to be incurred, in any regulatory year of the 1st regulatory control period exceeds 1% of the annual revenue requirement for that regulatory year.
For the purpose of this definition, relevant obligation means a regulatory obligation or requirement, other than an obligation or requirement: (c) arising from any repeal, amendment, variation or modification to the National
Electricity Law, National Electricity Regulations or National Electricity Rules except as made by or under the National Electricity (Northern Territory) (National Uniform) Legislation Act; or
(d) that the AER has considered or accounted for in a distribution determination for the 1st regulatory control period.
We would notify the AER as soon as practicable after an individual change first occurs that may be amendable to summing and a subsequent application for pass through under this category. However, no pass through application would be made unless or until the criteria in (a) and (b) of the definition above are met.
16.8 Application to SCS and ACS
We propose that the pass through provisions for defined and nominated pass through events apply to both SCS and ACS, on the basis that the pass through provisions in the NT NER apply to direct control services, which includes both SCS and ACS. This is consistent with the AER’s decision for other DNSPs, where it has defined pass through events for direct control services.
Applying pass through provisions to both SCS and ACS will promote section 7(A)(2) of the NT NEL, which provides that we should be given a reasonable opportunity to be able to recover at least the efficient costs the operator incurs in providing direct control services and complying with regulatory obligations or requirements.
126 Regulatory Proposal Annual revenue requirements, X-factors for SCS
17. Annual revenue requirements, X-factors for SCS
NT NER
6.3.1 - General building block proposal requirements; 6.4.3(a)(4) - Building blocks to calculate annual revenue requirement; 6.4.3(b) - Calculation of building blocks; 6.4.4 - Shared assets; 6.5.9 - X-factor; S6.1.3(1) - Completed PTRM; S6.1.3(6) - Calculation of revenues or prices for control mechanism
RIN 12.2, 12.9(c), 20 - Revenue
Key messages
• Our proposed ‘smoothed’ revenue requirement (or maximum allowed revenues) and X-factors for SCS, which include a reduction in our revenues and average prices in 2018, minimise any adverse impacts of the proposed changes in price components and reflect our customers’ feedback.
• In developing our proposed revenues and X-factors for SCS, we complied with all relevant NT NER requirements, including using a building block approach and the AER’s PTRM. We also considered changes occurring in our energy market and our customers’ priorities and preferences.
• Our proposed ‘unsmoothed’ total revenue requirement for SCS for the next regulatory period, for the five years 1 July 2019 to 30 June 2024, is $927.49 million (Nominal). This amount reflects the efficient costs of providing our SCS and meeting the safety and service levels our customers expect and value, while prudently balancing cost and price pressures in future regulatory periods.
• This regulatory proposal also provides for significantly lower opex on SCS than we expect to incur in the current regulatory period, which helps lead to lower required revenue per customer and average prices over the next regulatory period.
The NT NER require that we propose the ‘X-factors’ that determine the average change in our network revenue for SCS in each year of the next regulatory period. The X-factors should reflect the average annual changes in our revenue (on top of changes in the CPI) necessary to invest in, operate and maintain the network efficiently, and earn a reasonable return on the investment in this network the next regulatory period.
Table 17-1 shows the forecast building blocks and smoothed revenue for the next regulatory period for our SCS. Total revenue of $927.94 million (Nominal) over that period compares to $992.29 million (Nominal) allowed by the UC or $818.81 million (Nominal) directed by the Minister over the current regulatory period.
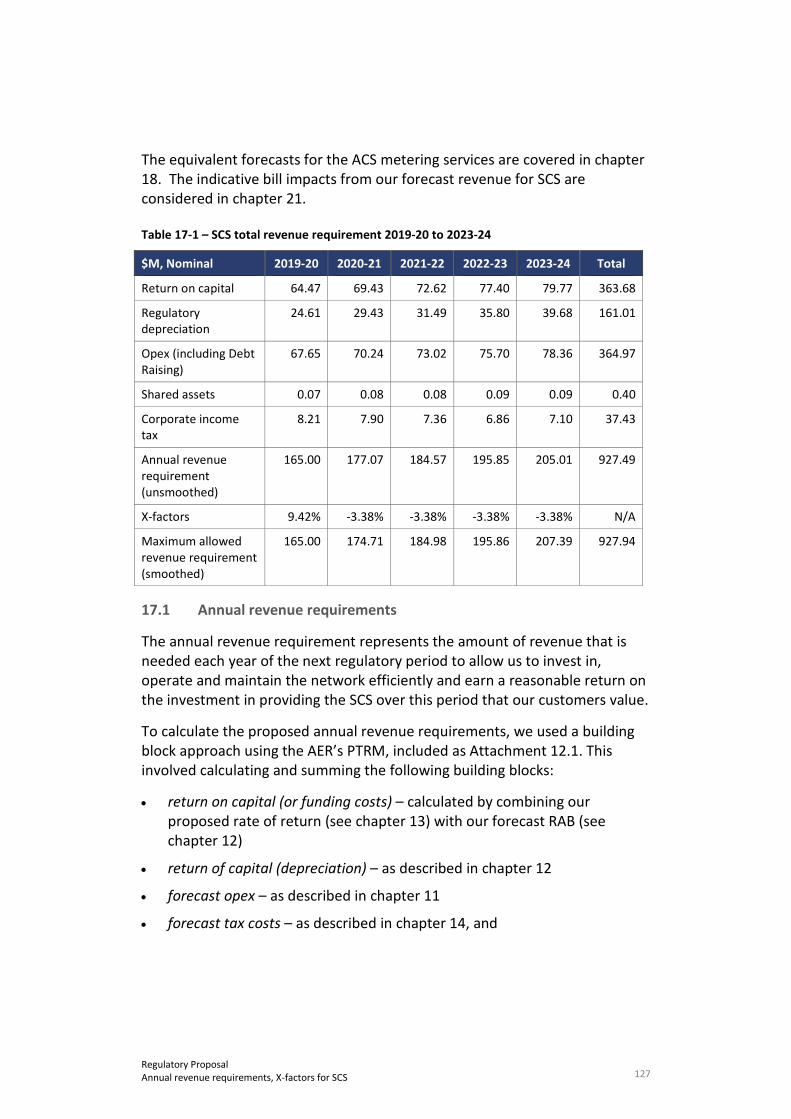
127 Regulatory Proposal Annual revenue requirements, X-factors for SCS
The equivalent forecasts for the ACS metering services are covered in chapter 18. The indicative bill impacts from our forecast revenue for SCS are considered in chapter 21.
Table 17-1 – SCS total revenue requirement 2019-20 to 2023-24
$M, Nominal 2019-20 2020-21 2021-22 2022-23 2023-24 Total
Return on capital 64.47 69.43 72.62 77.40 79.77 363.68
Regulatory depreciation
24.61 29.43 31.49 35.80 39.68 161.01
Opex (including Debt Raising)
67.65 70.24 73.02 75.70 78.36 364.97
Shared assets 0.07 0.08 0.08 0.09 0.09 0.40
Corporate income tax
8.21 7.90 7.36 6.86 7.10 37.43
Annual revenue requirement (unsmoothed)
165.00 177.07 184.57 195.85 205.01 927.49
X-factors 9.42% -3.38% -3.38% -3.38% -3.38% N/A
Maximum allowed revenue requirement (smoothed)
165.00 174.71 184.98 195.86 207.39 927.94
17.1 Annual revenue requirements
The annual revenue requirement represents the amount of revenue that is needed each year of the next regulatory period to allow us to invest in, operate and maintain the network efficiently and earn a reasonable return on the investment in providing the SCS over this period that our customers value.
To calculate the proposed annual revenue requirements, we used a building block approach using the AER’s PTRM, included as Attachment 12.1. This involved calculating and summing the following building blocks:
• return on capital (or funding costs) – calculated by combining our proposed rate of return (see chapter 13) with our forecast RAB (see chapter 12)
• return of capital (depreciation) – as described in chapter 12
• forecast opex – as described in chapter 11
• forecast tax costs – as described in chapter 14, and
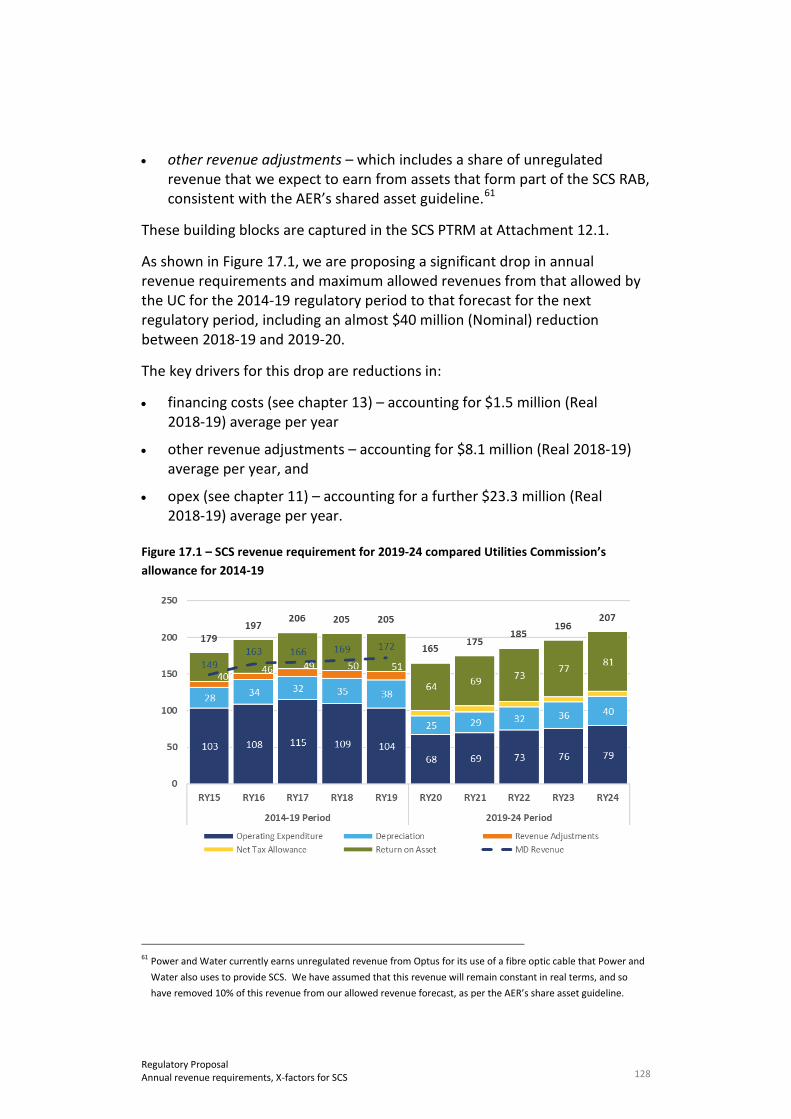
128 Regulatory Proposal Annual revenue requirements, X-factors for SCS
• other revenue adjustments – which includes a share of unregulated revenue that we expect to earn from assets that form part of the SCS RAB, consistent with the AER’s shared asset guideline.61
These building blocks are captured in the SCS PTRM at Attachment 12.1.
As shown in Figure 17.1, we are proposing a significant drop in annual revenue requirements and maximum allowed revenues from that allowed by the UC for the 2014-19 regulatory period to that forecast for the next regulatory period, including an almost $40 million (Nominal) reduction between 2018-19 and 2019-20.
The key drivers for this drop are reductions in:
• financing costs (see chapter 13) – accounting for $1.5 million (Real 2018-19) average per year
• other revenue adjustments – accounting for $8.1 million (Real 2018-19) average per year, and
• opex (see chapter 11) – accounting for a further $23.3 million (Real 2018-19) average per year.
Figure 17.1 – SCS revenue requirement for 2019-24 compared Utilities Commission’s allowance for 2014-19
61 Power and Water currently earns unregulated revenue from Optus for its use of a fibre optic cable that Power and
Water also uses to provide SCS. We have assumed that this revenue will remain constant in real terms, and so have removed 10% of this revenue from our allowed revenue forecast, as per the AER’s share asset guideline.
129 Regulatory Proposal Annual revenue requirements, X-factors for SCS
17.2 Maximum allowed revenue and X-factors
We ‘smoothed’ our proposed annual revenue requirements to derive the proposed maximum allowed revenue for each year of the next regulatory period using the AER’s default revenue smoothing methodology, which is consistent with clause 6.5.9 of the NT NER and the AER’s PTRM. This entails setting the smoothed MAR for the first year of the next regulatory period equal to the annual revenue requirement (ARR) for that year (sometimes referred to as P0). Next, we applied a single (constant) X-factor to all remaining years of the next regulatory control period so that the NPV of smoothed revenues is equal to the NPV of unsmoothed ARR.
We ensured the maximum allowed revenues are equal to the annual revenue requirements in net present value terms by solving for revenue X-factors that seek to smooth out volatility, while seeking to minimise adverse customer impacts.
The proposed maximum allowed revenues and X-factors for our SCS are shown in Table 17-1.
Importantly, the proposed X-factors do not necessarily determine the actual movements in our individual network tariffs or actual customer bill outcomes because:
• the X-factors apply to maximum allowed revenues in aggregate under the revenue cap, not to individual tariffs – which will be affected by changes as outlined in the proposed TSS (at Attachment 2.1)
• the X-factors can update each year to account for annual changes in the return on debt, and
• customers’ bills depend on their specific circumstances, including the tariff that they are on and how much of electricity they consume (and when).
Chapter 21 further consider the indicative bill impacts from the proposed maximum allowed revenues and X-factors.

130 Regulatory Proposal Metering services
18. Metering services
NT NER Nil
RIN 15 - Metering
Key messages
• We agree with the AER’s classification of Type 1 to 6 metering services and customer requested provision of additional metering/consumption data (together referred to as metering services) as ACS and to them being subject to a price cap control mechanism.
• We also agree to Type 7 metering services being classified as SCS and to them being subject to a revenue cap control mechanism. These are covered in the total revenue requirement for SCS.
• Our new and replacement smart meter policy position proposes the installation of advanced meters with supporting ICT communications. This position means that we can implement our tariff strategy set out in the TSS and meet customers’ future information needs, encouraging customers to efficiently use energy and the network over the long-term. Further, the new and replacement smart meter policy position is consistent with the general move to competitive metering services elsewhere in the NEM.
• We propose that prices for ACS metering not increase in 2019-20 and then increase by 6.89 per cent in each of the remaining years of the next regulatory period.
18.1 ACS metering service classification
As set out in chapter 8 of this regulatory proposal, we agree with the AER’s position in its F&A paper to classify Type 1 to 6 metering services and customer requested provision of additional metering/consumption data (together metering services) as ACS, and to apply a price cap control mechanism to these services.
18.2 Our new and replacement smart meter policy position
Our new and replacement smart meter policy position is a significant driver of our ACS metering services costs. It sets out what meters we plan to use when replacing or installing new meter connections over the next regulatory period, and the services that we expect to be delivered by those meters.
We have arrived at our new and replacement smart meter policy position on the basis of:
• our cost benefit analysis (CBA) that:
131 Regulatory Proposal Metering services
– has identified what will provide the least cost option to our customers, and
– meets the AER’s expectations of the evidence required to justify our preferred position (only two clear material benefits to our customers have been considered)
• our understanding of our customers’ preferences, revealed through our engagement process, and
• our understanding of non-quantifiable benefits that may be derived by us and the broader community (generators, retailers, and customers).
These matters are examined in detail in our ACS Metering Overview at Attachment 9.1.
Our assessment is that the transition to smart meters is inevitable and the decision is not if, but rather when the transition should be made.
Whilst our CBA suggests that the least cost option is to base our new and replacement smart meter policy position on advanced capable meters (with manual reading), this option assumes that the meters will not be communications enabled in the foreseeable future. This is unlikely to provide the optimal long-term solution for our customers. It is also inconsistent with the direction of the NEM, our customers’ preferences and our tariff reform strategy.
Other benefits which we and other parties (retailers, generators, and customers) may realise are conservatively estimated at $6.1 to $15.4 million. Further, our customers strongly support our new and replacement smart meter policy position being based on advanced meters.
Therefore, our new and replacement smart meter policy position is to install advanced meters immediately supported by the necessary ICT communications to give effect to remote reading and remote re-energisation and de-energisation. Our capex and opex forecasts have been developed on this basis.
18.3 Building block revenue
We have adopted a building block approach to determining the annual revenue requirements for ACS metering services, consistent with that applied to determining SCS annual revenue requirements. We also used the AER’s RFM and PTRM to prepare our ACS metering total revenue requirement forecast, and adopted the same approaches to forecasting opex, rate of return, regulatory depreciation and corporate income tax building blocks as was used for the SCS.
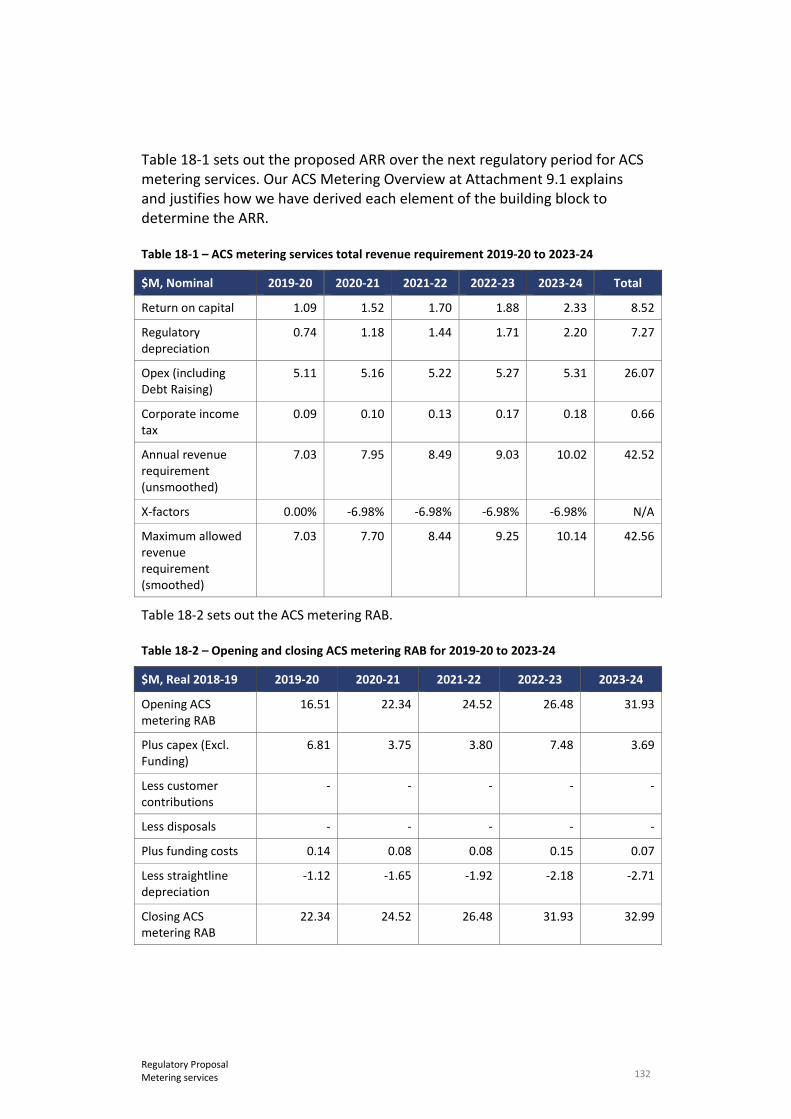
132 Regulatory Proposal Metering services
Table 18-1 sets out the proposed ARR over the next regulatory period for ACS metering services. Our ACS Metering Overview at Attachment 9.1 explains and justifies how we have derived each element of the building block to determine the ARR.
Table 18-1 – ACS metering services total revenue requirement 2019-20 to 2023-24
$M, Nominal 2019-20 2020-21 2021-22 2022-23 2023-24 Total
Return on capital 1.09 1.52 1.70 1.88 2.33 8.52
Regulatory depreciation
0.74 1.18 1.44 1.71 2.20 7.27
Opex (including Debt Raising)
5.11 5.16 5.22 5.27 5.31 26.07
Corporate income tax
0.09 0.10 0.13 0.17 0.18 0.66
Annual revenue requirement (unsmoothed)
7.03 7.95 8.49 9.03 10.02 42.52
X-factors 0.00% -6.98% -6.98% -6.98% -6.98% N/A
Maximum allowed revenue requirement (smoothed)
7.03 7.70 8.44 9.25 10.14 42.56
Table 18-2 sets out the ACS metering RAB.
Table 18-2 – Opening and closing ACS metering RAB for 2019-20 to 2023-24
$M, Real 2018-19 2019-20 2020-21 2021-22 2022-23 2023-24
Opening ACS metering RAB
16.51 22.34 24.52 26.48 31.93
Plus capex (Excl. Funding)
6.81 3.75 3.80 7.48 3.69
Less customer contributions
- - - - -
Less disposals - - - - -
Plus funding costs 0.14 0.08 0.08 0.15 0.07
Less straightline depreciation
-1.12 -1.65 -1.92 -2.18 -2.71
Closing ACS metering RAB
22.34 24.52 26.48 31.93 32.99

133 Regulatory Proposal Metering services
18.4 X Factor
We propose a P0 of 0 per cent for 2019-20 and X-factors of 6.98 per cent for the remaining years of the next regulatory period.
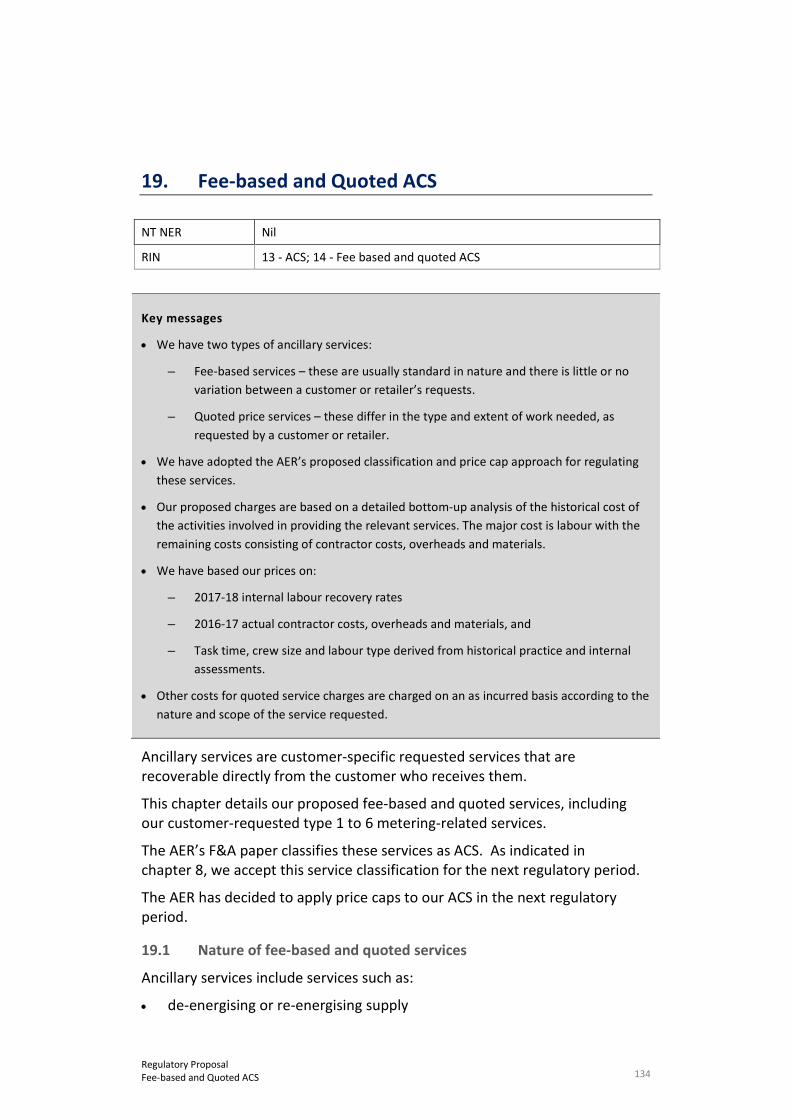
134 Regulatory Proposal Fee-based and Quoted ACS
19. Fee-based and Quoted ACS
NT NER Nil
RIN 13 - ACS; 14 - Fee based and quoted ACS
Key messages
• We have two types of ancillary services:
– Fee-based services – these are usually standard in nature and there is little or no variation between a customer or retailer’s requests.
– Quoted price services – these differ in the type and extent of work needed, as requested by a customer or retailer.
• We have adopted the AER’s proposed classification and price cap approach for regulating these services.
• Our proposed charges are based on a detailed bottom-up analysis of the historical cost of the activities involved in providing the relevant services. The major cost is labour with the remaining costs consisting of contractor costs, overheads and materials.
• We have based our prices on:
– 2017-18 internal labour recovery rates
– 2016-17 actual contractor costs, overheads and materials, and
– Task time, crew size and labour type derived from historical practice and internal assessments.
• Other costs for quoted service charges are charged on an as incurred basis according to the nature and scope of the service requested.
Ancillary services are customer-specific requested services that are recoverable directly from the customer who receives them.
This chapter details our proposed fee-based and quoted services, including our customer-requested type 1 to 6 metering-related services.
The AER’s F&A paper classifies these services as ACS. As indicated in chapter 8, we accept this service classification for the next regulatory period.
The AER has decided to apply price caps to our ACS in the next regulatory period.
19.1 Nature of fee-based and quoted services
Ancillary services include services such as:
• de-energising or re-energising supply
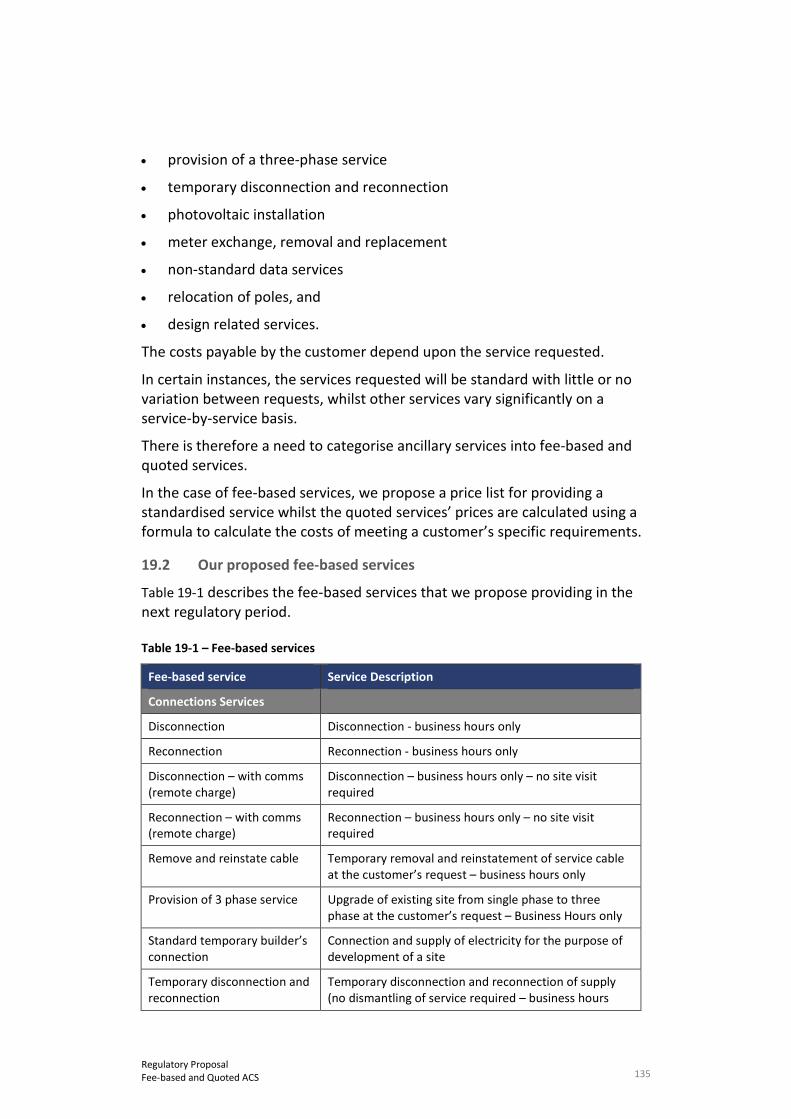
135 Regulatory Proposal Fee-based and Quoted ACS
• provision of a three-phase service
• temporary disconnection and reconnection
• photovoltaic installation
• meter exchange, removal and replacement
• non-standard data services
• relocation of poles, and
• design related services.
The costs payable by the customer depend upon the service requested.
In certain instances, the services requested will be standard with little or no variation between requests, whilst other services vary significantly on a service-by-service basis.
There is therefore a need to categorise ancillary services into fee-based and quoted services.
In the case of fee-based services, we propose a price list for providing a standardised service whilst the quoted services’ prices are calculated using a formula to calculate the costs of meeting a customer’s specific requirements.
19.2 Our proposed fee-based services
Table 19-1 describes the fee-based services that we propose providing in the next regulatory period.
Table 19-1 – Fee-based services
Fee-based service Service Description
Connections Services
Disconnection Disconnection - business hours only
Reconnection Reconnection - business hours only
Disconnection – with comms (remote charge)
Disconnection – business hours only – no site visit required
Reconnection – with comms (remote charge)
Reconnection – business hours only – no site visit required
Remove and reinstate cable Temporary removal and reinstatement of service cable at the customer’s request – business hours only
Provision of 3 phase service Upgrade of existing site from single phase to three phase at the customer’s request – Business Hours only
Standard temporary builder’s connection
Connection and supply of electricity for the purpose of development of a site
Temporary disconnection and reconnection
Temporary disconnection and reconnection of supply (no dismantling of service required – business hours
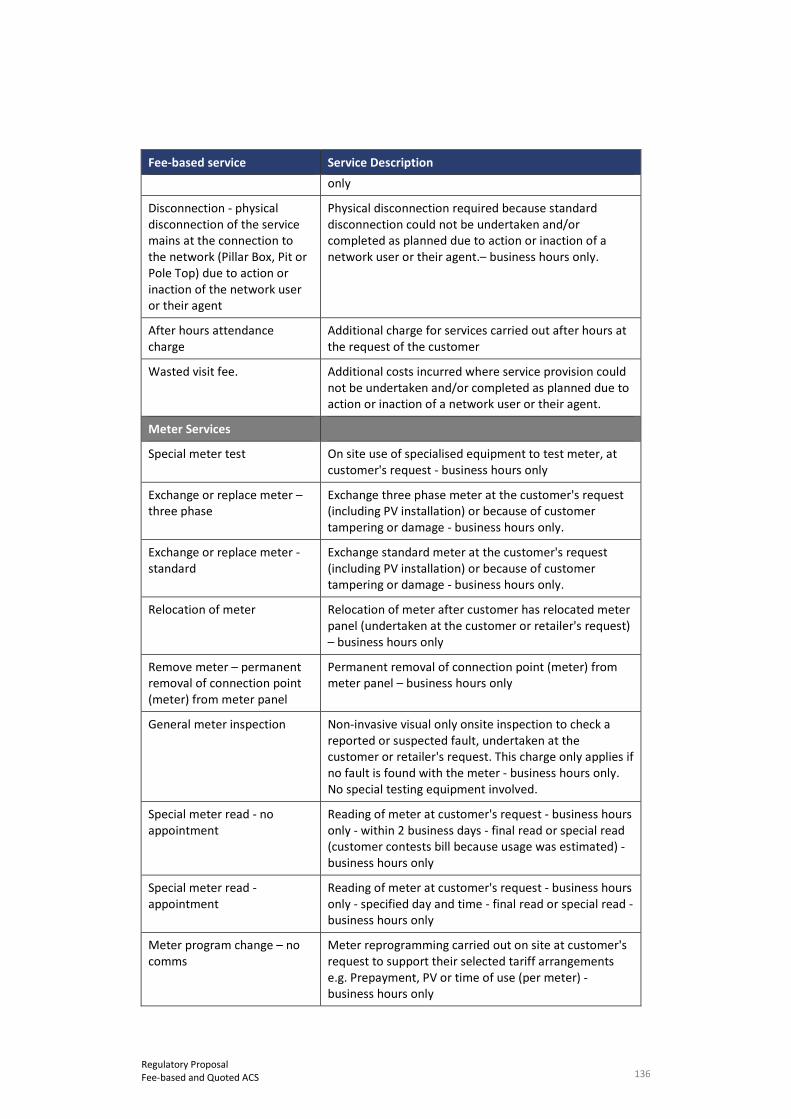
136 Regulatory Proposal Fee-based and Quoted ACS
Fee-based service Service Description only
Disconnection - physical disconnection of the service mains at the connection to the network (Pillar Box, Pit or Pole Top) due to action or inaction of the network user or their agent
Physical disconnection required because standard disconnection could not be undertaken and/or completed as planned due to action or inaction of a network user or their agent.– business hours only.
After hours attendance charge
Additional charge for services carried out after hours at the request of the customer
Wasted visit fee. Additional costs incurred where service provision could not be undertaken and/or completed as planned due to action or inaction of a network user or their agent.
Meter Services
Special meter test On site use of specialised equipment to test meter, at customer's request - business hours only
Exchange or replace meter – three phase
Exchange three phase meter at the customer's request (including PV installation) or because of customer tampering or damage - business hours only.
Exchange or replace meter - standard
Exchange standard meter at the customer's request (including PV installation) or because of customer tampering or damage - business hours only.
Relocation of meter Relocation of meter after customer has relocated meter panel (undertaken at the customer or retailer's request) – business hours only
Remove meter – permanent removal of connection point (meter) from meter panel
Permanent removal of connection point (meter) from meter panel – business hours only
General meter inspection Non-invasive visual only onsite inspection to check a reported or suspected fault, undertaken at the customer or retailer's request. This charge only applies if no fault is found with the meter - business hours only. No special testing equipment involved.
Special meter read - no appointment
Reading of meter at customer's request - business hours only - within 2 business days - final read or special read (customer contests bill because usage was estimated) - business hours only
Special meter read - appointment
Reading of meter at customer's request - business hours only - specified day and time - final read or special read - business hours only
Meter program change – no comms
Meter reprogramming carried out on site at customer's request to support their selected tariff arrangements e.g. Prepayment, PV or time of use (per meter) - business hours only
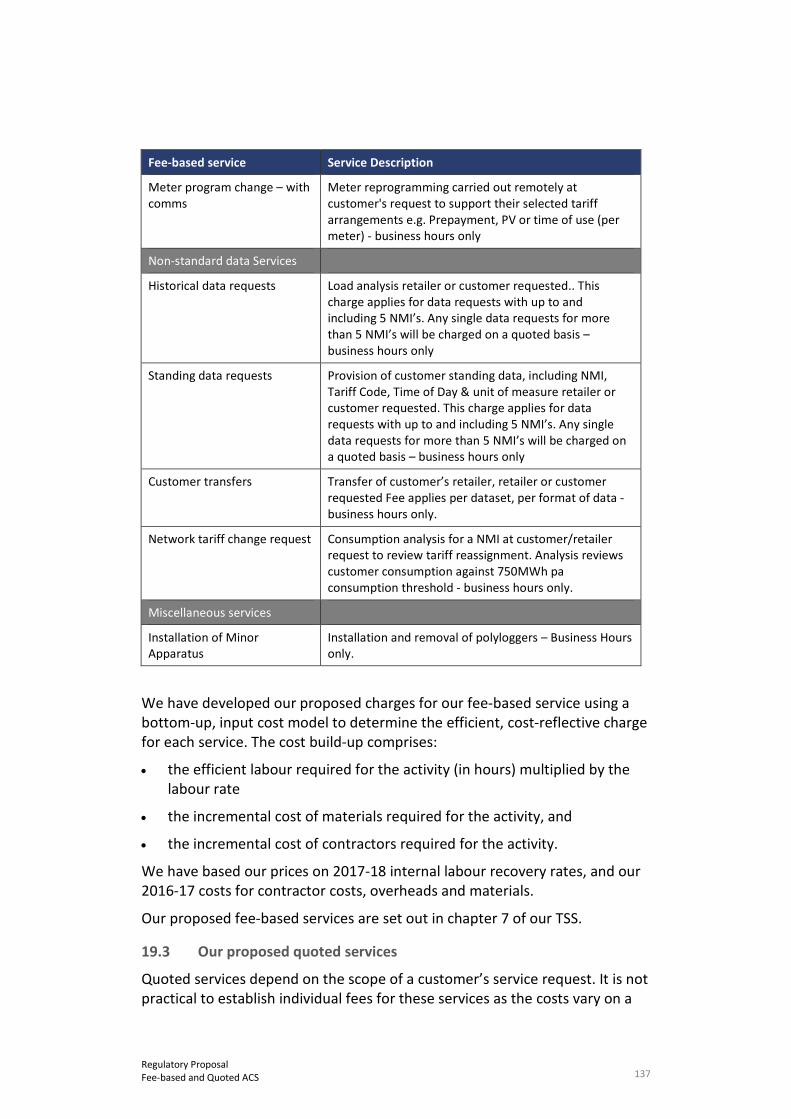
137 Regulatory Proposal Fee-based and Quoted ACS
Fee-based service Service Description
Meter program change – with comms
Meter reprogramming carried out remotely at customer's request to support their selected tariff arrangements e.g. Prepayment, PV or time of use (per meter) - business hours only
Non-standard data Services
Historical data requests Load analysis retailer or customer requested.. This charge applies for data requests with up to and including 5 NMI’s. Any single data requests for more than 5 NMI’s will be charged on a quoted basis – business hours only
Standing data requests Provision of customer standing data, including NMI, Tariff Code, Time of Day & unit of measure retailer or customer requested. This charge applies for data requests with up to and including 5 NMI’s. Any single data requests for more than 5 NMI’s will be charged on a quoted basis – business hours only
Customer transfers Transfer of customer’s retailer, retailer or customer requested Fee applies per dataset, per format of data - business hours only.
Network tariff change request Consumption analysis for a NMI at customer/retailer request to review tariff reassignment. Analysis reviews customer consumption against 750MWh pa consumption threshold - business hours only.
Miscellaneous services
Installation of Minor Apparatus
Installation and removal of polyloggers – Business Hours only.
We have developed our proposed charges for our fee-based service using a bottom-up, input cost model to determine the efficient, cost-reflective charge for each service. The cost build-up comprises:
• the efficient labour required for the activity (in hours) multiplied by the labour rate
• the incremental cost of materials required for the activity, and
• the incremental cost of contractors required for the activity.
We have based our prices on 2017-18 internal labour recovery rates, and our 2016-17 costs for contractor costs, overheads and materials.
Our proposed fee-based services are set out in chapter 7 of our TSS.
19.3 Our proposed quoted services
Quoted services depend on the scope of a customer’s service request. It is not practical to establish individual fees for these services as the costs vary on a
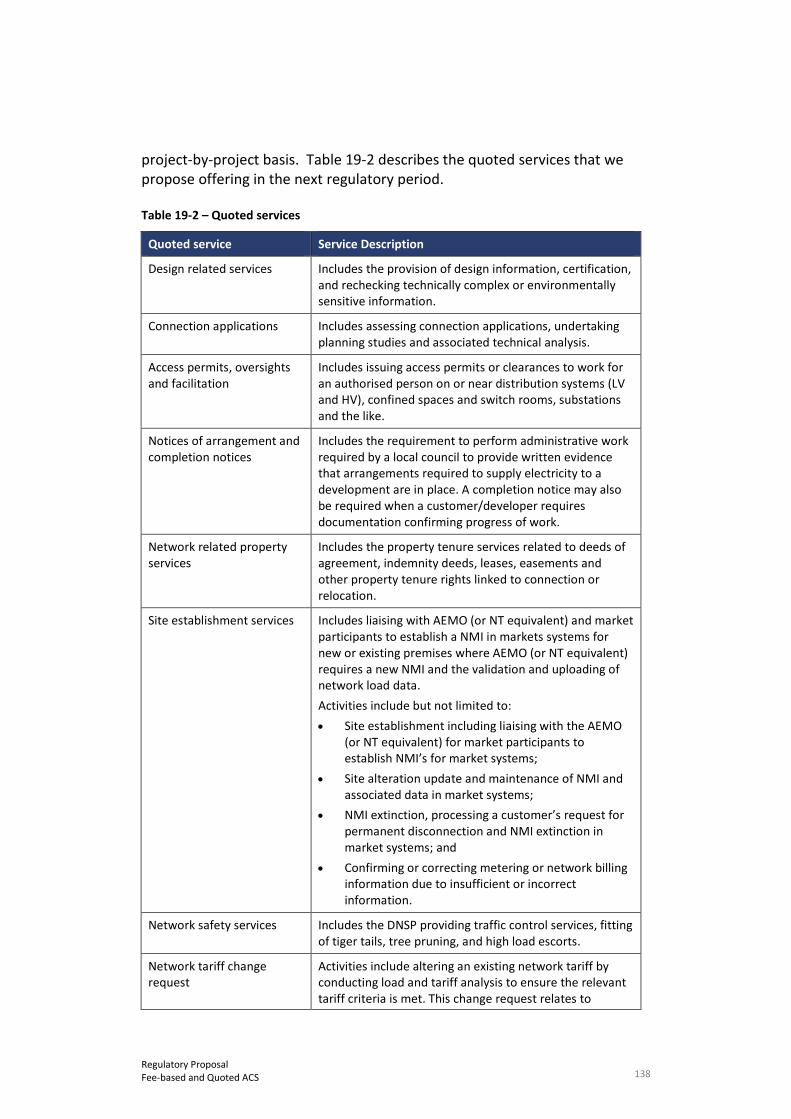
138 Regulatory Proposal Fee-based and Quoted ACS
project-by-project basis. Table 19-2 describes the quoted services that we propose offering in the next regulatory period.
Table 19-2 – Quoted services
Quoted service Service Description
Design related services Includes the provision of design information, certification, and rechecking technically complex or environmentally sensitive information.
Connection applications Includes assessing connection applications, undertaking planning studies and associated technical analysis.
Access permits, oversights and facilitation
Includes issuing access permits or clearances to work for an authorised person on or near distribution systems (LV and HV), confined spaces and switch rooms, substations and the like.
Notices of arrangement and completion notices
Includes the requirement to perform administrative work required by a local council to provide written evidence that arrangements required to supply electricity to a development are in place. A completion notice may also be required when a customer/developer requires documentation confirming progress of work.
Network related property services
Includes the property tenure services related to deeds of agreement, indemnity deeds, leases, easements and other property tenure rights linked to connection or relocation.
Site establishment services Includes liaising with AEMO (or NT equivalent) and market participants to establish a NMI in markets systems for new or existing premises where AEMO (or NT equivalent) requires a new NMI and the validation and uploading of network load data. Activities include but not limited to: • Site establishment including liaising with the AEMO
(or NT equivalent) for market participants to establish NMI’s for market systems;
• Site alteration update and maintenance of NMI and associated data in market systems;
• NMI extinction, processing a customer’s request for permanent disconnection and NMI extinction in market systems; and
• Confirming or correcting metering or network billing information due to insufficient or incorrect information.
Network safety services Includes the DNSP providing traffic control services, fitting of tiger tails, tree pruning, and high load escorts.
Network tariff change request
Activities include altering an existing network tariff by conducting load and tariff analysis to ensure the relevant tariff criteria is met. This change request relates to
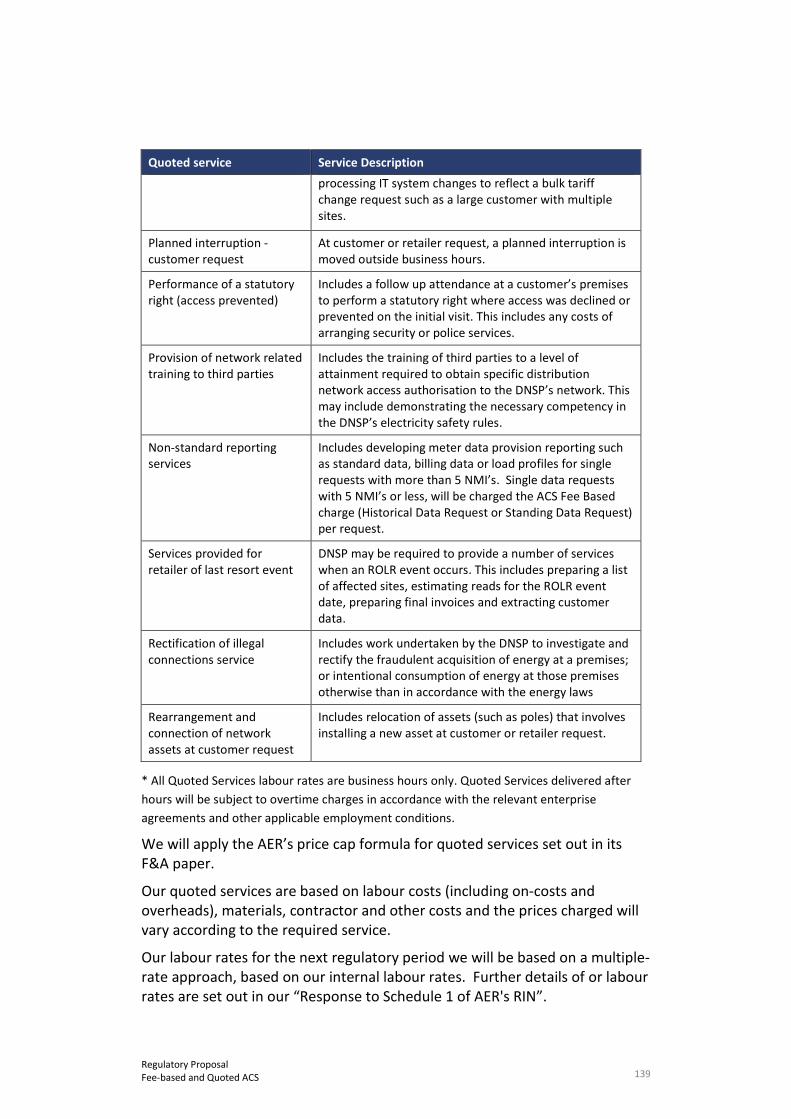
139 Regulatory Proposal Fee-based and Quoted ACS
Quoted service Service Description processing IT system changes to reflect a bulk tariff change request such as a large customer with multiple sites.
Planned interruption - customer request
At customer or retailer request, a planned interruption is moved outside business hours.
Performance of a statutory right (access prevented)
Includes a follow up attendance at a customer’s premises to perform a statutory right where access was declined or prevented on the initial visit. This includes any costs of arranging security or police services.
Provision of network related training to third parties
Includes the training of third parties to a level of attainment required to obtain specific distribution network access authorisation to the DNSP’s network. This may include demonstrating the necessary competency in the DNSP’s electricity safety rules.
Non-standard reporting services
Includes developing meter data provision reporting such as standard data, billing data or load profiles for single requests with more than 5 NMI’s. Single data requests with 5 NMI’s or less, will be charged the ACS Fee Based charge (Historical Data Request or Standing Data Request) per request.
Services provided for retailer of last resort event
DNSP may be required to provide a number of services when an ROLR event occurs. This includes preparing a list of affected sites, estimating reads for the ROLR event date, preparing final invoices and extracting customer data.
Rectification of illegal connections service
Includes work undertaken by the DNSP to investigate and rectify the fraudulent acquisition of energy at a premises; or intentional consumption of energy at those premises otherwise than in accordance with the energy laws
Rearrangement and connection of network assets at customer request
Includes relocation of assets (such as poles) that involves installing a new asset at customer or retailer request.
* All Quoted Services labour rates are business hours only. Quoted Services delivered after hours will be subject to overtime charges in accordance with the relevant enterprise agreements and other applicable employment conditions.
We will apply the AER’s price cap formula for quoted services set out in its F&A paper.
Our quoted services are based on labour costs (including on-costs and overheads), materials, contractor and other costs and the prices charged will vary according to the required service.
Our labour rates for the next regulatory period we will be based on a multiple-rate approach, based on our internal labour rates. Further details of or labour rates are set out in our “Response to Schedule 1 of AER's RIN”.

140 Regulatory Proposal Public lighting
20. Public lighting
NT NER Nil
RIN 16 - Public lighting
We do not have any regulated public lighting services.
141 Regulatory Proposal Indicative prices and bill impacts
21. Indicative prices and bill impacts
NT NER 6.3.1 - general building block proposal requirements
RIN 21 - Indicative impact on annual electricity bills
Key messages
• A reduction in our annual revenue requirements has enabled us to rebalance our tariffs to ensure all customer categories are paying their fair share, without needing to increase the revenue collected from any category.
• We have removed historical tariff structures that may have provided perverse incentives to our customers to consume more at those times when the network is utilised most.
• We are projecting a significant reduction in revenue recovered from residential and small business electricity customers. Our regulatory proposal will deliver network bill savings (excluding the impact of inflation) for most customer categories.
• Residential and SME customers that consume less than 750 MWh per annum will continue to receive the protections provided by the NT Government’s Pricing Order. However, we can introduce network tariff structures that most reflect our costs and will provide the Government and retailers with better information for them to make their policy decisions.
This chapter details:
• indicative prices that we expect will recover revenues equal to, in net present value terms, the unsmoothed annual revenue requirements for the SCS and ACS metering services, as detailed in Chapters 17 and 18, and
• the indicative movements between 2018-19 to 2019-20 in the network component of typical customers’ bills.
Our Indicative Pricing Schedule provides further details about prices and the TSS explains and justifies them, in accordance with the requirements of Chapter 6 of the NT NER.
Our objectives are to:
• ensure tariffs reflect our efficient costs, by increasing their cost reflectivity
• help customers to make informed decisions by incentivising them to make changes in their demand if it is economically efficient to do so, by charging higher prices when they consume at peak times, and
• apply tariffs that can adapt to emerging technologies.
Accordingly, consistent with the feedback that we received from customers through our engagement process, we propose to:
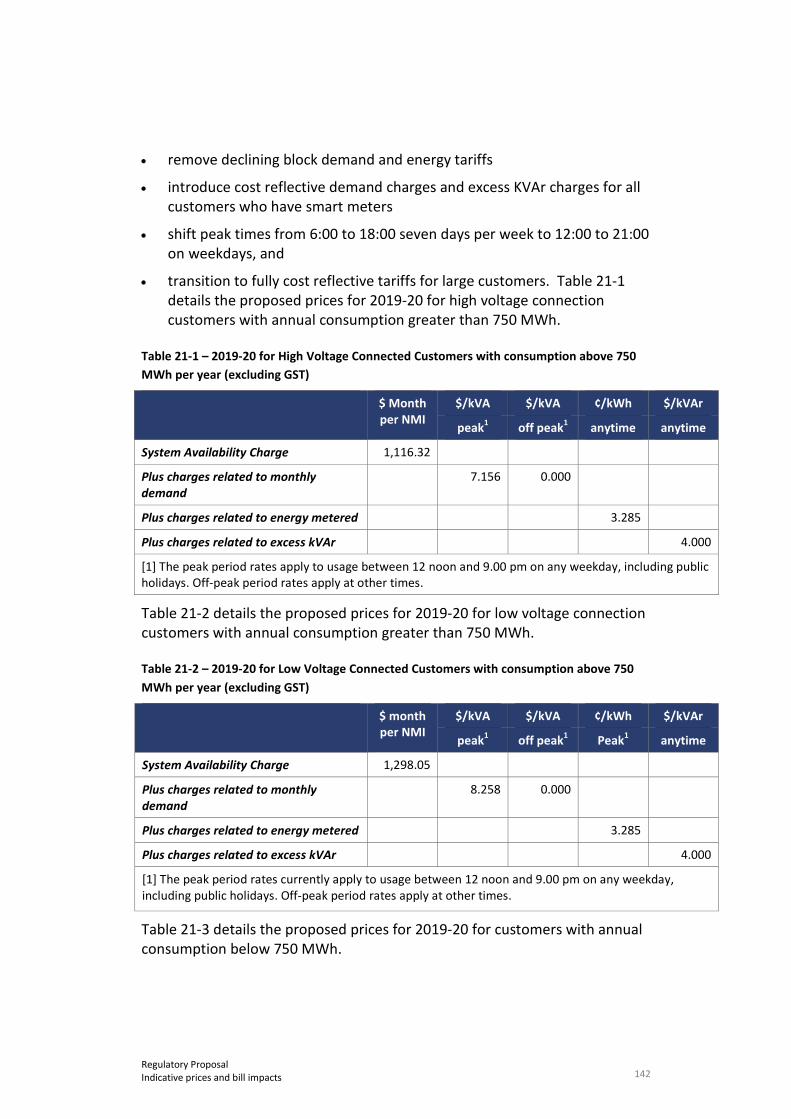
142 Regulatory Proposal Indicative prices and bill impacts
• remove declining block demand and energy tariffs
• introduce cost reflective demand charges and excess KVAr charges for all customers who have smart meters
• shift peak times from 6:00 to 18:00 seven days per week to 12:00 to 21:00 on weekdays, and
• transition to fully cost reflective tariffs for large customers. Table 21-1 details the proposed prices for 2019-20 for high voltage connection customers with annual consumption greater than 750 MWh.
Table 21-1 – 2019-20 for High Voltage Connected Customers with consumption above 750 MWh per year (excluding GST)
$ Month per NMI
$/kVA $/kVA ¢/kWh $/kVAr
peak1 off peak1 anytime anytime
System Availability Charge 1,116.32
Plus charges related to monthly demand
7.156 0.000
Plus charges related to energy metered 3.285
Plus charges related to excess kVAr 4.000
[1] The peak period rates apply to usage between 12 noon and 9.00 pm on any weekday, including public holidays. Off-peak period rates apply at other times.
Table 21-2 details the proposed prices for 2019-20 for low voltage connection customers with annual consumption greater than 750 MWh.
Table 21-2 – 2019-20 for Low Voltage Connected Customers with consumption above 750 MWh per year (excluding GST)
$ month per NMI
$/kVA $/kVA ¢/kWh $/kVAr
peak1 off peak1 Peak1 anytime
System Availability Charge 1,298.05
Plus charges related to monthly demand
8.258 0.000
Plus charges related to energy metered 3.285
Plus charges related to excess kVAr 4.000
[1] The peak period rates currently apply to usage between 12 noon and 9.00 pm on any weekday, including public holidays. Off-peak period rates apply at other times.
Table 21-3 details the proposed prices for 2019-20 for customers with annual consumption below 750 MWh.
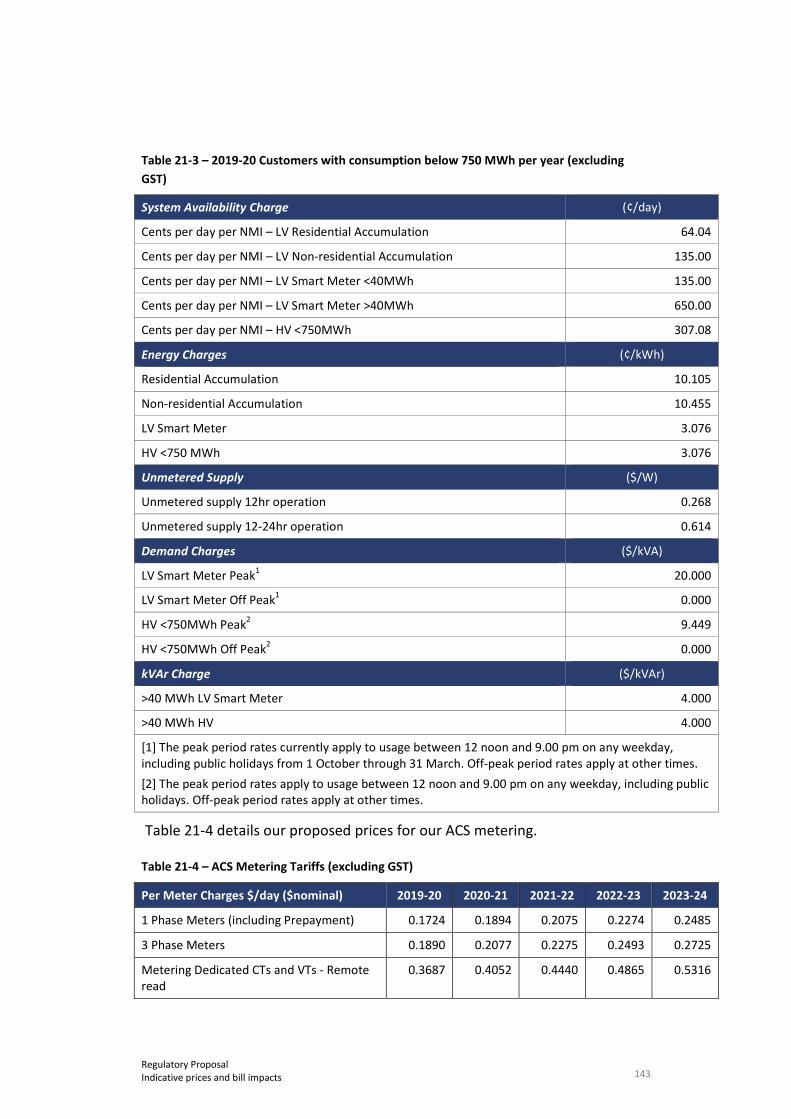
143 Regulatory Proposal Indicative prices and bill impacts
Table 21-3 – 2019-20 Customers with consumption below 750 MWh per year (excluding GST)
System Availability Charge (¢/day)
Cents per day per NMI – LV Residential Accumulation 64.04
Cents per day per NMI – LV Non-residential Accumulation 135.00
Cents per day per NMI – LV Smart Meter <40MWh 135.00
Cents per day per NMI – LV Smart Meter >40MWh 650.00
Cents per day per NMI – HV <750MWh 307.08
Energy Charges (¢/kWh)
Residential Accumulation 10.105
Non-residential Accumulation 10.455
LV Smart Meter 3.076
HV <750 MWh 3.076
Unmetered Supply ($/W)
Unmetered supply 12hr operation 0.268
Unmetered supply 12-24hr operation 0.614
Demand Charges ($/kVA)
LV Smart Meter Peak1 20.000
LV Smart Meter Off Peak1 0.000
HV <750MWh Peak2 9.449
HV <750MWh Off Peak2 0.000
kVAr Charge ($/kVAr)
>40 MWh LV Smart Meter 4.000
>40 MWh HV 4.000
[1] The peak period rates currently apply to usage between 12 noon and 9.00 pm on any weekday, including public holidays from 1 October through 31 March. Off-peak period rates apply at other times. [2] The peak period rates apply to usage between 12 noon and 9.00 pm on any weekday, including public holidays. Off-peak period rates apply at other times.
Table 21-4 details our proposed prices for our ACS metering.
Table 21-4 – ACS Metering Tariffs (excluding GST)
Per Meter Charges $/day ($nominal) 2019-20 2020-21 2021-22 2022-23 2023-24
1 Phase Meters (including Prepayment) 0.1724 0.1894 0.2075 0.2274 0.2485
3 Phase Meters 0.1890 0.2077 0.2275 0.2493 0.2725
Metering Dedicated CTs and VTs - Remote read
0.3687 0.4052 0.4440 0.4865 0.5316
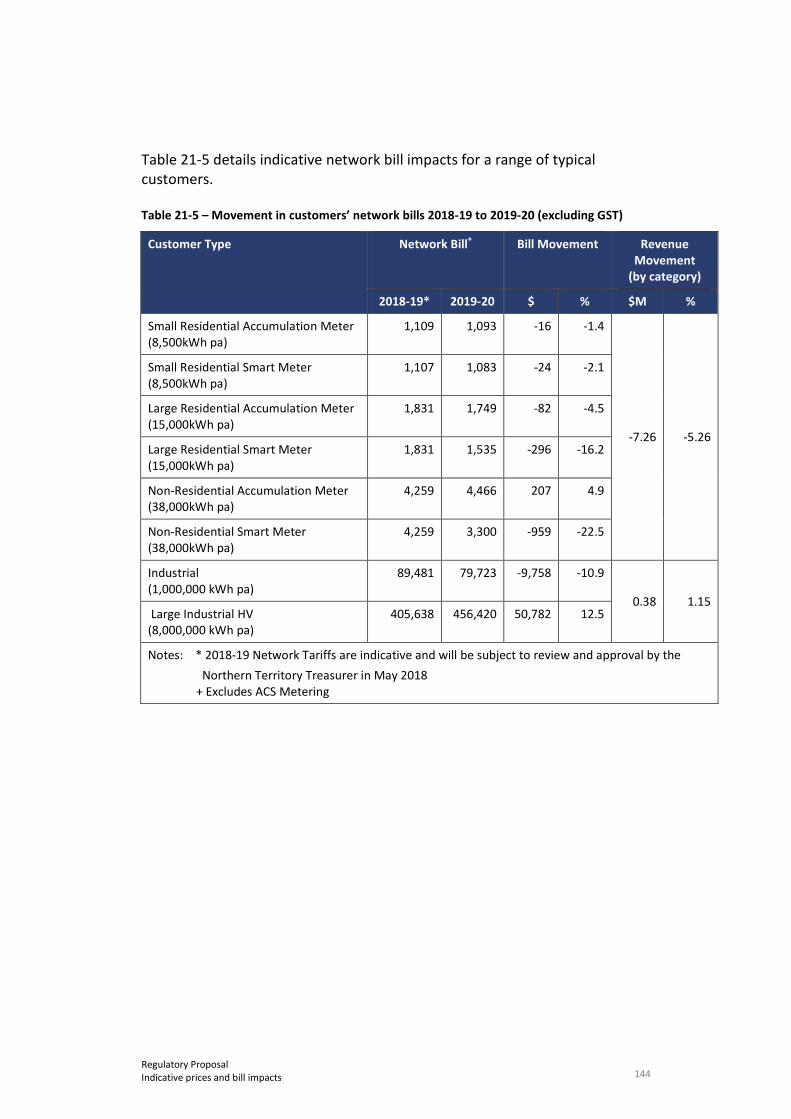
144 Regulatory Proposal Indicative prices and bill impacts
Table 21-5 details indicative network bill impacts for a range of typical customers.
Table 21-5 – Movement in customers’ network bills 2018-19 to 2019-20 (excluding GST)
Customer Type Network Bill+ Bill Movement Revenue Movement
(by category)
2018-19* 2019-20 $ % $M %
Small Residential Accumulation Meter (8,500kWh pa)
1,109 1,093 -16 -1.4
-7.26 -5.26
Small Residential Smart Meter (8,500kWh pa)
1,107 1,083 -24 -2.1
Large Residential Accumulation Meter (15,000kWh pa)
1,831 1,749 -82 -4.5
Large Residential Smart Meter (15,000kWh pa)
1,831 1,535 -296 -16.2
Non-Residential Accumulation Meter
(38,000kWh pa) 4,259 4,466 207 4.9
Non-Residential Smart Meter
(38,000kWh pa) 4,259 3,300 -959 -22.5
Industrial (1,000,000 kWh pa)
89,481 79,723 -9,758 -10.9
0.38 1.15 Large Industrial HV (8,000,000 kWh pa)
405,638 456,420 50,782 12.5
Notes: * 2018-19 Network Tariffs are indicative and will be subject to review and approval by the Northern Territory Treasurer in May 2018 + Excludes ACS Metering
145 Regulatory Proposal Negotiating Framework
22. Negotiating Framework
NT NER
6.7.1 - Negotiated distribution service principles; 6.7.2 - Determining terms and conditions; 6.7.3 - Negotiating Framework determination; 6.7.5 - Requirements for negotiating framework; 6.8.2(c)(5) - Proposed negotiating framework; 6.22.1 - Dispute resolution
RIN
Key messages
• We support the AER’s decision not to classify any distribution services as negotiated distribution services, as outlined in its F&A paper.
• Notwithstanding the classification decision, we understand that we must still submit a negotiating framework to the AER with this regulatory proposal, which meets the requirements of clause 6.7.5 of the NT NER.
• We expect that the AER will determine negotiated distribution service criteria as part of its distribution determination.
The NT NER provides for negotiated distribution services,62 being services which require a less prescriptive regulatory approach where all DNSPs and customers have sufficient market power to be able to negotiate prices according to a framework established by the rules, with the AER available to arbitrate if necessary. The costs associated with negotiated distribution services are recovered through negotiated fees, directly from the customer requesting the service and not through revenue earned from distribution use of system tariffs.
The AER’s F&A paper did not propose classifying any of our distribution services as negotiated distribution services.63 We support this approach, which is reflected in the proposed service classification in chapter 8 of this regulatory proposal.
Notwithstanding the classification decision, we interpret clause 6.7.5 of the NT NER as requiring us to submit a document – a negotiating framework – to the AER with this regulatory proposal. It must set out:
62 Defined in Chapter 10 of the NT NER as, “A distribution service that is a negotiated network service within the
meaning of section 2C of the Law”. 63 See the AER’s position set out in section 1.1, and its reasons set out in section 1.3.3, of the F&A.
146 Regulatory Proposal Negotiating Framework
• the procedure that we would follow during negotiations with an applicant who wishes to receive a negotiated distribution service, and
• the terms and conditions of access,
if required for any future provision of such services.
We have therefore submitted with this regulatory proposal a negotiating framework at Attachment 1.7, which meets the requirements of clause 6.7.5 of the NT NER, and will apply the negotiated distribution service principles set out in clause 6.7.1 of the NT NER. The proposed negotiating framework draws on equivalent documents recently approved by the AER for other DNSPs.
The proposed negotiating framework includes conservative timeframes when compared with those of other DNSPs operating under the NER. This approach reflects:
• Different rules – Some timeframes established in the NER do not apply under the current NT NER.
• Regulatory uncertainty – Some relevant clauses of the NT NER may, if or when operational, affect the timeframes for negotiated distribution services. Notably:
− Chapter 5 Network Connection, rules 5.0, 5.0A commence on 1 July 2019, but rules 5.1 through to 5.9 (including rules 5.3 and 5.3A for establishing or modifying connections) are flagged for revisiting as part of the NT’s phased transition to the national framework.
− Chapter 5A Electricity Connection for Retail Customers, Part F Connection Contracts will commence on 1 July 2019, but clause 5A.F.4 Negotiated connection offers (including a reference to 65 days for making a negotiated connection offer) is flagged for revisiting as part of the NT’s phased transition to the national framework.
• Priority of rules – The negotiating framework provides that the NT NER is to prevail in the event of any inconsistency with the provisions of the negotiating framework. Hence, any future changes to the NT NER that affect negotiating timeframes will apply automatically to negotiations under the proposed negotiating framework.
• Transition - The introduction of negotiated distribution services will be new for the NT and Power and Water, requiring business processes, systems and resources to meet our customers’ needs. As we gain experience, efficiency and timelines will improve.
In accordance with clauses 6.7.4 and 6.12.1(16) of the NT NER, we expect that the AER will determine negotiated distribution service criteria as part of its Distribution Determination that give effect to and are consistent with the negotiated distribution service principles in clause 6.7.1 of the NT NER.
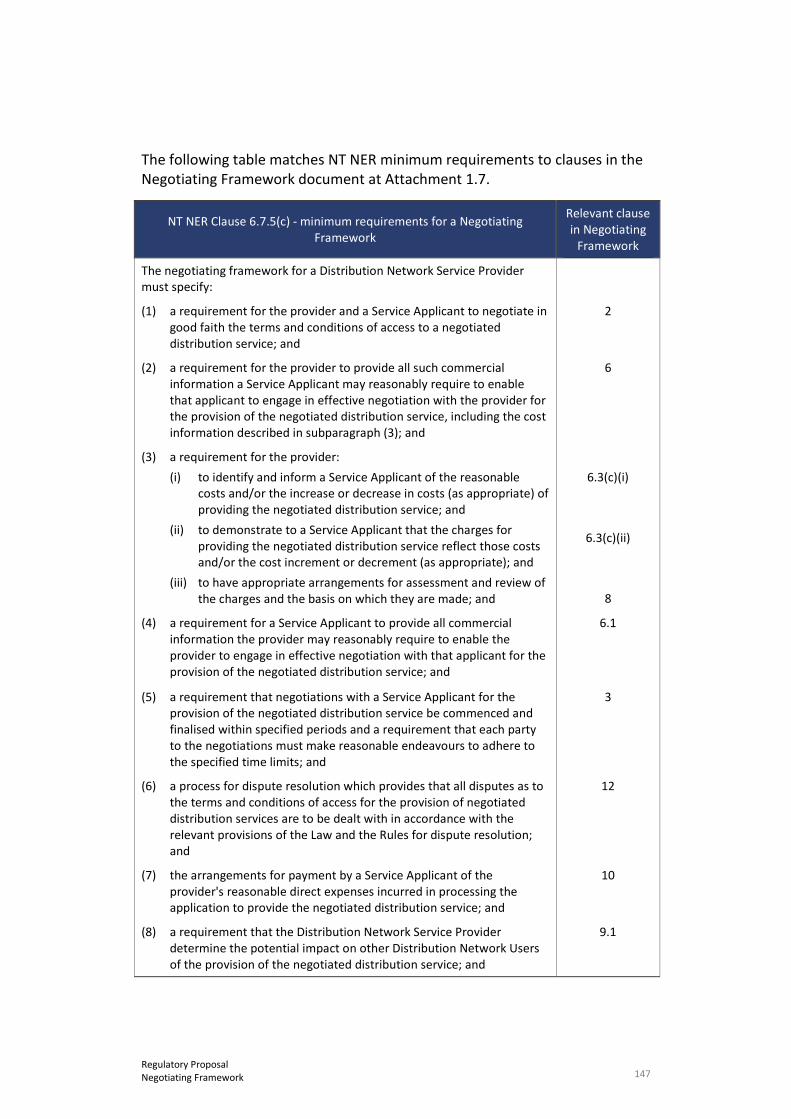
147 Regulatory Proposal Negotiating Framework
The following table matches NT NER minimum requirements to clauses in the Negotiating Framework document at Attachment 1.7.
NT NER Clause 6.7.5(c) - minimum requirements for a Negotiating Framework
Relevant clause in Negotiating
Framework
The negotiating framework for a Distribution Network Service Provider must specify:
(1) a requirement for the provider and a Service Applicant to negotiate in good faith the terms and conditions of access to a negotiated distribution service; and
2
(2) a requirement for the provider to provide all such commercial information a Service Applicant may reasonably require to enable that applicant to engage in effective negotiation with the provider for the provision of the negotiated distribution service, including the cost information described in subparagraph (3); and
6
(3) a requirement for the provider: (i) to identify and inform a Service Applicant of the reasonable
costs and/or the increase or decrease in costs (as appropriate) of providing the negotiated distribution service; and
(ii) to demonstrate to a Service Applicant that the charges for providing the negotiated distribution service reflect those costs and/or the cost increment or decrement (as appropriate); and
(iii) to have appropriate arrangements for assessment and review of the charges and the basis on which they are made; and
6.3(c)(i)
6.3(c)(ii)
8
(4) a requirement for a Service Applicant to provide all commercial information the provider may reasonably require to enable the provider to engage in effective negotiation with that applicant for the provision of the negotiated distribution service; and
6.1
(5) a requirement that negotiations with a Service Applicant for the provision of the negotiated distribution service be commenced and finalised within specified periods and a requirement that each party to the negotiations must make reasonable endeavours to adhere to the specified time limits; and
3
(6) a process for dispute resolution which provides that all disputes as to the terms and conditions of access for the provision of negotiated distribution services are to be dealt with in accordance with the relevant provisions of the Law and the Rules for dispute resolution; and
12
(7) the arrangements for payment by a Service Applicant of the provider's reasonable direct expenses incurred in processing the application to provide the negotiated distribution service; and
10
(8) a requirement that the Distribution Network Service Provider determine the potential impact on other Distribution Network Users of the provision of the negotiated distribution service; and
9.1
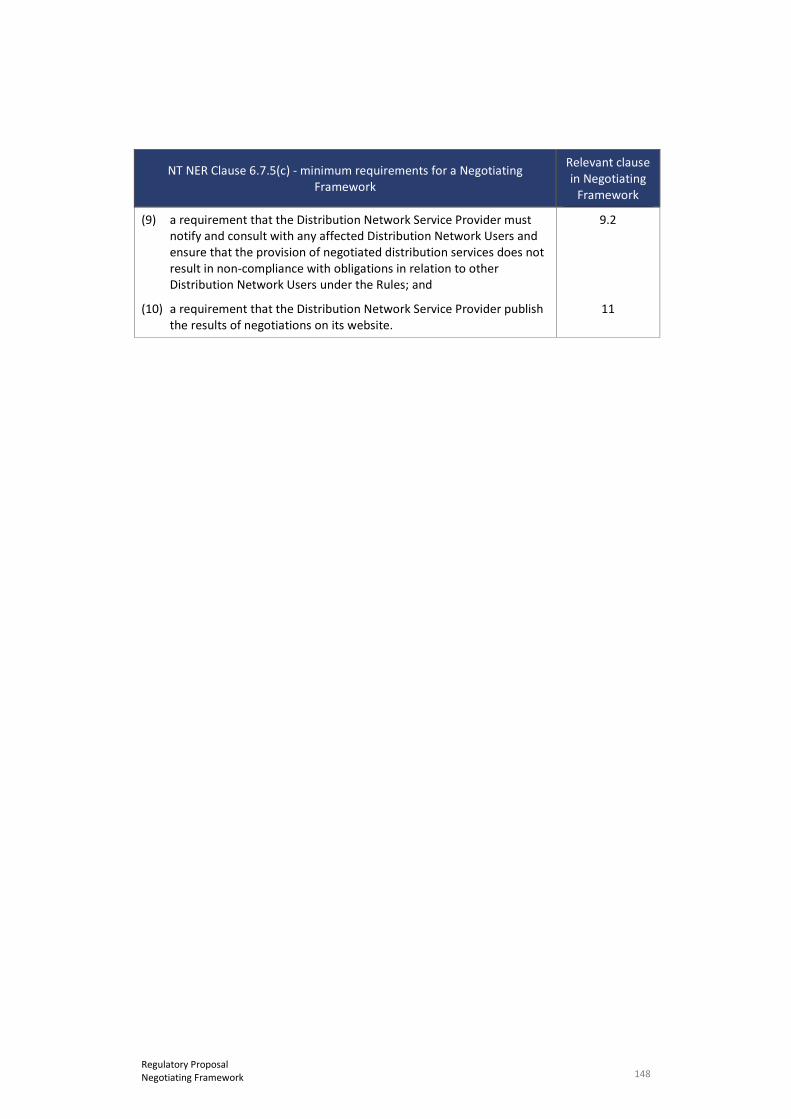
148 Regulatory Proposal Negotiating Framework
NT NER Clause 6.7.5(c) - minimum requirements for a Negotiating Framework
Relevant clause in Negotiating
Framework
(9) a requirement that the Distribution Network Service Provider must notify and consult with any affected Distribution Network Users and ensure that the provision of negotiated distribution services does not result in non-compliance with obligations in relation to other Distribution Network Users under the Rules; and
9.2
(10) a requirement that the Distribution Network Service Provider publish the results of negotiations on its website.
11

149 Regulatory Proposal Confidentiality
23. Confidentiality
NT NER 6.8.2(c)(6) - Identify any confidential parts of regulatory proposal; 6.14A - Distribution Confidentiality Guidelines
RIN 32 - Confidential information
Key messages
• We have addressed the requirements of the AER’s Confidentiality Guideline for the matters for which we are claiming confidentiality.
In accordance with clause 6.14 of the NT NER and the AER’s Confidentiality Guideline, we have completed a confidentiality template at Attachment 1.14 of this regulatory proposal that details the matters for which we are claiming confidentiality.
150 Regulatory Proposal Certifications
24. Certifications
NT NER Nil
RIN 33 - Attestation relating to merits review and other non-judicial review
Key messages
• Our directors have provided a certification statement for our key assumptions for capex and opex.
• Our Chief Executive Officer will make a statutory declaration attesting to the information provided in our response to the AER’s RIN.
24.1 Certification statement
Schedules 6.1.1(5) and 6.1.2(6) of the NT NER require our directors to certify the key assumptions that underlie our capex and opex forecasts. Our key assumptions for:
• capex are set out in section 11.2, and
• opex are set out in section 11.2.
The certification statement is provided as Attachment 1.5 to this regulatory proposal.
24.2 Statutory declaration by Chief Executive Officer
The AER’s RIN requires an officer of Power and Water to make a statutory declaration attesting to the information provided in response to that notice.
The statutory declaration made by our Chief Executive Officer is provided as Attachment 1.5 to this regulatory proposal.
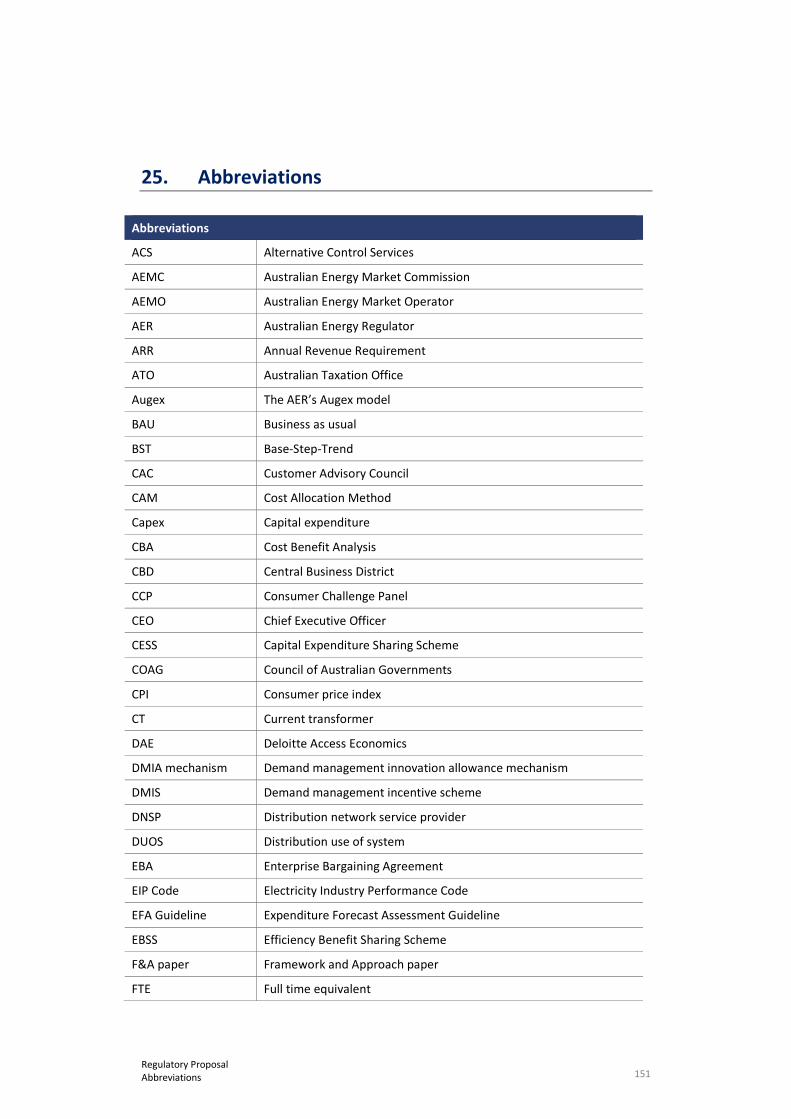
151 Regulatory Proposal Abbreviations
25. Abbreviations
Abbreviations
ACS Alternative Control Services
AEMC Australian Energy Market Commission
AEMO Australian Energy Market Operator
AER Australian Energy Regulator
ARR Annual Revenue Requirement
ATO Australian Taxation Office
Augex The AER’s Augex model
BAU Business as usual
BST Base-Step-Trend
CAC Customer Advisory Council
CAM Cost Allocation Method
Capex Capital expenditure
CBA Cost Benefit Analysis
CBD Central Business District
CCP Consumer Challenge Panel
CEO Chief Executive Officer
CESS Capital Expenditure Sharing Scheme
COAG Council of Australian Governments
CPI Consumer price index
CT Current transformer
DAE Deloitte Access Economics
DMIA mechanism Demand management innovation allowance mechanism
DMIS Demand management incentive scheme
DNSP Distribution network service provider
DUOS Distribution use of system
EBA Enterprise Bargaining Agreement
EIP Code Electricity Industry Performance Code
EFA Guideline Expenditure Forecast Assessment Guideline
EBSS Efficiency Benefit Sharing Scheme
F&A paper Framework and Approach paper
FTE Full time equivalent
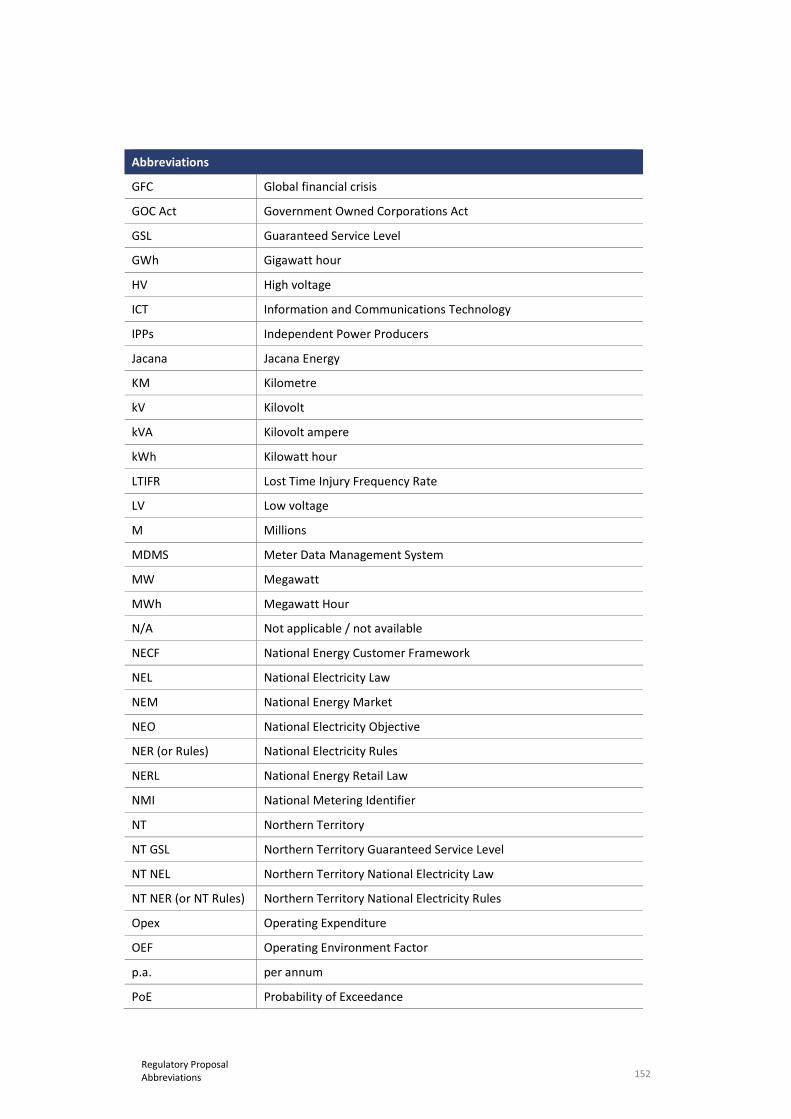
152 Regulatory Proposal Abbreviations
Abbreviations
GFC Global financial crisis
GOC Act Government Owned Corporations Act
GSL Guaranteed Service Level
GWh Gigawatt hour
HV High voltage
ICT Information and Communications Technology
IPPs Independent Power Producers
Jacana Jacana Energy
KM Kilometre
kV Kilovolt
kVA Kilovolt ampere
kWh Kilowatt hour
LTIFR Lost Time Injury Frequency Rate
LV Low voltage
M Millions
MDMS Meter Data Management System
MW Megawatt
MWh Megawatt Hour
N/A Not applicable / not available
NECF National Energy Customer Framework
NEL National Electricity Law
NEM National Energy Market
NEO National Electricity Objective
NER (or Rules) National Electricity Rules
NERL National Energy Retail Law
NMI National Metering Identifier
NT Northern Territory
NT GSL Northern Territory Guaranteed Service Level
NT NEL Northern Territory National Electricity Law
NT NER (or NT Rules) Northern Territory National Electricity Rules
Opex Operating Expenditure
OEF Operating Environment Factor
p.a. per annum
PoE Probability of Exceedance
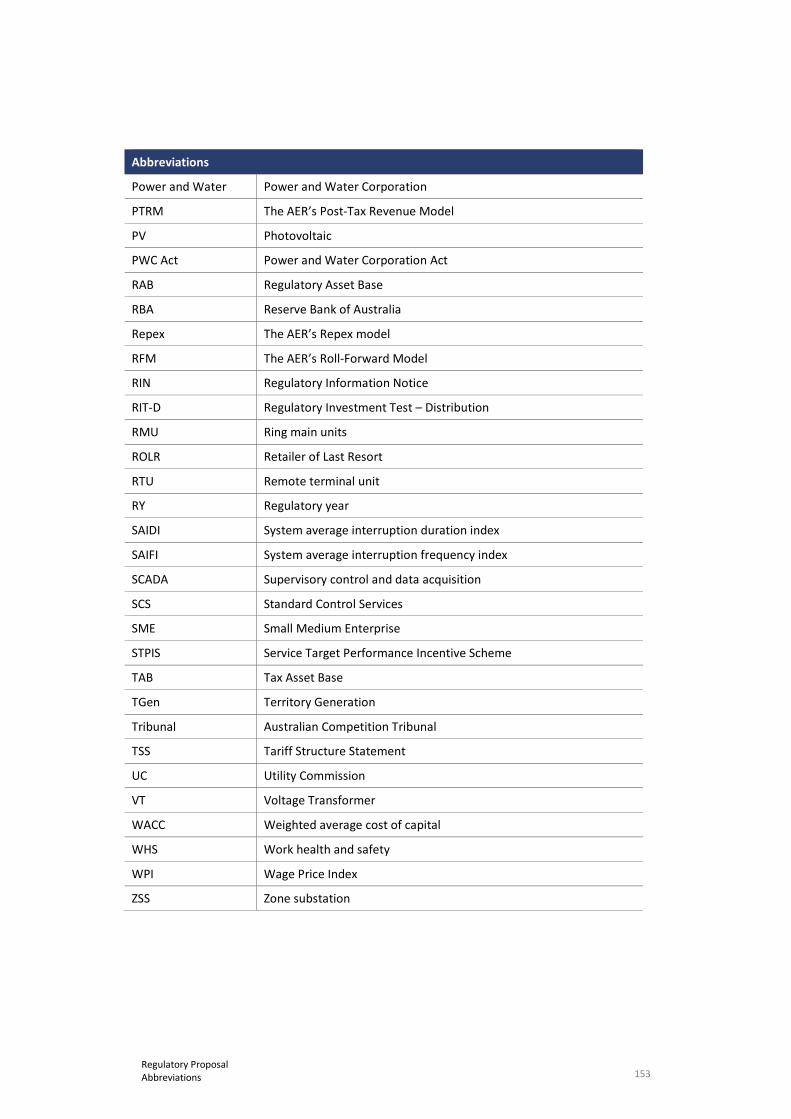
153 Regulatory Proposal Abbreviations
Abbreviations
Power and Water Power and Water Corporation
PTRM The AER’s Post-Tax Revenue Model
PV Photovoltaic
PWC Act Power and Water Corporation Act
RAB Regulatory Asset Base
RBA Reserve Bank of Australia
Repex The AER’s Repex model
RFM The AER’s Roll-Forward Model
RIN Regulatory Information Notice
RIT-D Regulatory Investment Test – Distribution
RMU Ring main units
ROLR Retailer of Last Resort
RTU Remote terminal unit
RY Regulatory year
SAIDI System average interruption duration index
SAIFI System average interruption frequency index
SCADA Supervisory control and data acquisition
SCS Standard Control Services
SME Small Medium Enterprise
STPIS Service Target Performance Incentive Scheme
TAB Tax Asset Base
TGen Territory Generation
Tribunal Australian Competition Tribunal
TSS Tariff Structure Statement
UC Utility Commission
VT Voltage Transformer
WACC Weighted average cost of capital
WHS Work health and safety
WPI Wage Price Index
ZSS Zone substation