Embed Size (px)
Citation preview
REPORT Open Access
Regulatory link mapping between organismsRachita Sharma*, Patricia A Evans, Virendrakumar C Bhavsar
From The 4th International Conference on Computational Systems Biology (ISB 2010)Suzhou, P. R. China. 9-11 September 2010
Abstract
Background: Identification of gene regulatory networks is useful in understanding gene regulation in anyorganism. Some regulatory network information has already been determined experimentally for model organisms,but much less has been identified for non-model organisms, and the limited amount of gene expression dataavailable for non-model organisms makes inference of regulatory networks difficult.
Results: This paper proposes a method to determine the regulatory links that can be mapped from a model to anon-model organism. Mapping a regulatory network involves mapping the transcription factors and target genesfrom one genome to another. In the proposed method, Basic Local Alignment Search Tool (BLAST) andInterProScan are used to map the transcription factors, whereas BLAST along with transcription factor binding sitemotifs and the GALF-P tool are used to map the target genes. Experiments are performed to map the regulatorynetwork data of S. cerevisiae to A. thaliana and analyze the results. Since limited information is available about generegulatory network links, gene expression data is used to analyze results. A set of rules are defined on the geneexpression experiments to identify the predicted regulatory links that are well supported.
Conclusions: Combining transcription factors mapped using BLAST and subfamily classification, together withtarget genes mapped using BLAST and binding site motifs, produced the best regulatory link predictions. Morethan two-thirds of these predicted regulatory links that were analyzed using gene expression data have beenverified as correctly mapped regulatory links in the target genome.
BackgroundA transcriptional gene regulatory network [1] representsa collection of regulatory elements, which are targetgenes and transcription factors, interacting with eachother in a cell to regulate the rate of transcription ofgenes in the network. A regulatory relationship in agene regulatory network consists of a transcription fac-tor, a target gene, and the type of regulatory relationshipbetween the regulatory elements, either positive ornegative.These regulatory relationships in a network can help
answer current biological questions, such as the identifi-cation of genes and proteins related to various diseases,and are useful in novel drug design and development[2]. These regulatory relationships can also be useful in
understanding the differences in gene regulationbetween different organisms. Since it is critical to studyhow genes are involved in regulation, or the way theyare themselves regulated by other genes, the determina-tion of gene regulatory networks is extremely importantfor understanding gene regulation by identifying thesegenes and their relationships.Significant time and resources are required for the
experimental determination of these gene regulatorynetworks. Experimental techniques such as gene-knock-out experiments [3] are extremely time-consuming andin many cases inadequate to identify a regulatory net-work for an organism at the genome level. The amountof genetic information available for newly sequencedgenomes is increasing exponentially, and therefore it isessential to develop methods to bridge the gap and inferregulatory networks for these new genomes. Severalcomputational models have been used to represent generegulatory pathways for model organisms using gene
* Correspondence: [email protected] of Computer Science, University of New Brunswick, Fredericton, NBE3B5A3, CanadaFull list of author information is available at the end of the article
Sharma et al. BMC Systems Biology 2011, 5(Suppl 1):S4http://www.biomedcentral.com/1752-0509/5/S1/S4
© 2011 Sharma et al; licensee BioMed Central Ltd. This is an open access article distributed under the terms of the Creative CommonsAttribution License (http://creativecommons.org/licenses/by/2.0), which permits unrestricted use, distribution, and reproduction inany medium, provided the original work is properly cited.
expression data, and some models incorporate additionalavailable biological knowledge. These models includeBoolean Networks [4,5], Bayesian Networks [6-8], Dif-ferential equation models [9] and Hybrid Petri Nets[10]. Recently, many techniques have started incorporat-ing additional data, such as protein-protein interactiondata, protein-DNA interaction data, and binding sitedata, along with the gene expression data to get moreaccurate gene regulatory networks. Additionally, manymethods are now focusing on using time-course beha-vior of gene expression along with available biologicalknowledge. Some of the above techniques have beendiscussed in a comparative review [11,12] of determina-tion of gene regulatory networks. The above mentionedtechniques cannot be used for most non-model organ-isms due to data sparseness.Some methods, as discussed in [11], are building on
gene expression techniques by integrating a variety ofdifferent information sources in order to improve theirresults. Recent work [13] has pushed the uses of thesemethods further, using expression-based network infer-ence for multiple related organisms and pattern discov-ery techniques to find transcription binding site motifs.This type of extension of regulatory network predictionis very useful to explore organisms for which a signifi-cant amount of data is available. However, to use anorganism as a model, once this exploration is done, weneed to be able to determine how much of its informa-tion can be transferred to related organisms aboutwhich we may know very little. These aforementionedmethods, which infer regulatory networks either entirelyor primarily from gene expression data, work well withthe large amounts of gene expression data that are read-ily available for model organisms, or for other popularorganisms. Model organisms are investigated thoroughlyby biologists, by virtue of being simpler and easy tomanipulate and having short life cycles. Some otherorganisms are more complex, but are similar to modelorganisms in their popularity, leading to significantquantities of data being available for them as well. Theinformation from these model organisms can be mappedto newly sequenced organisms about which less isknown, referred to as non-model organisms. These non-model organisms in many cases have very limited dataavailable, which prevents the success of the previouslydiscussed methods for inferring regulatory relationshipsand other information.There have been two methods developed, P-MAP [14]
and another one used in KEGG [15], that use a regula-tory network of a model organism to infer a regulatorynetwork for a non-model organism. However, thesemethods are limited in their usability for mapping regu-latory pathways. The mapping in P-MAP, taken as aconstrained minimum spanning tree problem, is based
on keeping overall sequence similarity between mappedgene pairs and preserving the co-regulated gene struc-tures in the predicted pathway. The P-MAP algorithm isalso limited in that it does not predict the direction andtype of regulatory relationships between the genes. InKEGG [15], organism specific pathways are constructedbased on ortholog identifier assignments in the GENESdatabase. It relies on previously determined informationabout homologous genes, and it does not consider anyother data.This paper determines the amount of gene regulatory
information that can be mapped from a model organism(source genome) to a non-model organism (target gen-ome), based only on gene and promotor sequences andtranscription factor binding site motifs. The use of geneexpression data for testing also suggests how it could beincorporated into the technique to improve results whilestill not requiring large quantities of experimental data.This technique is thus useable for a variety of differentorganisms for which there is insufficient data to inferregulation using gene expression data. Due to theextreme differences between the minimal amount ofdata used in this method and the large quantities ofdata, particularly expression data, that are used by othertechniques, it is not appropriate to directly compare theresults. Identification of regulatory information for anon-model organism will help the biologists investigateany new organism at the genome level and provideinformation about the common regulatory relationshipsbetween the two genomes. The method in this paperinvolves mapping the transcription factors (TFs), targetgenes (TGs) and their regulatory relationships from onegenome to another. Gene expression data available forthe target genome is used in this paper to evaluate theresults due to insufficient reliable regulatory networkinformation being available for testing. A set of rules isestablished to use the information from the gene expres-sion experiments to analyze the regulatory relationshipspredicted for the target genome.In the proposed method, any model organism with an
available experimentally confirmed regulatory networkand transcription factor binding site (TFBS) motif infor-mation can be used as the source genome. However, amodel organism closer to the target genome is prefer-able, since evolutionarily closer organisms will tend tohave more similar regulatory relationships. The targetgenome can be any non-model organism with availablenucleotide sequence data. For experimentation and test-ing purposes S. cerevisiae and A. thaliana have beenused in this paper as source and target genomes, respec-tively. S. cerevisiae is a model organism with all therequired information required for a source genome. A.thaliana, not being a non-model organism, is used asthe target genome for experimentation purposes only, so
Sharma et al. BMC Systems Biology 2011, 5(Suppl 1):S4http://www.biomedcentral.com/1752-0509/5/S1/S4
Page 2 of 12
that the gene expression data available for A. thalianacan be used for analysis and verification of the mappedregulatory relationships determined using the proposedmethod. A. thaliana is also a suitable test organism toinvestigate regulatory inference for plants, for whichthere are far fewer well-investigated examples and thusare likely targets of the technique presented in thispaper. While closer organisms are preferred, S. cerevi-siae and A. thaliana are used as the source and targetgenomes since there is no suitable pair of organismsthat are evolutionarily close that have both sufficientregulatory network and gene expression informationavailable for verification. This non-ideal situation cannevertheless be common for many non-model organ-isms, due to the limited availability of well-investigatedmodel organisms, and the results in this paper thusidentify the proportion of regulatory relationships thatcan be mapped from an evolutionarily distant modelorganism.The mapping of TFs between genomes based on evo-
lutionary distance has been investigated in our pre-vious work using bacterial genomes [16]. Weconsidered 14 bacterial genomes, and for each of them,based on the ROC curve analysis, we determined thebest e-value threshold for BLAST [17] and the bestmodel organism to use, between Bacillus subtilis andE. coli, to map regulatory information. The resultswere evaluated based on sensitivity, PPV and ReceiverOperating Characteristic (ROC) curve to determine thebest combination to use for every target bacterial gen-ome used. The PPV ratio (accuracy) and sensitivity ishigh for suitable e-value thresholds. The sensitivitydecreases for lower e-value thresholds, whereas theaccuracy decreases with increase in e-value thresholds.Therefore, the best e-value thresholds provide a goodbalance between losing the true TFs and predictingmore non-factors. The best e-value thresholds deter-mined for all examined bacterial genomes and bothsource organisms were either the same or very close toeach other. Therefore, it is likely that the best e-valuedetermined may also work well for TF mappingbetween other set of genomes. A key finding was thatusing the correct e-value threshold was just as, and insome cases more, important than using the closermodel organism; this result provides a foundation forthis exploration of methods to map regulatory linksusing more distantly related organisms.
MethodsTranscription factor mappingMapping TFs from one genome to another involvesfinding similar protein sequences in the target genomeperforming similar functions. The sequence alignment
tool BLAST [17] and the functional similarity tool Inter-ProScan [18] are used for TF mapping, which is the firststep in regulatory link mapping.Similar regions in the gene sequences tend to indicate
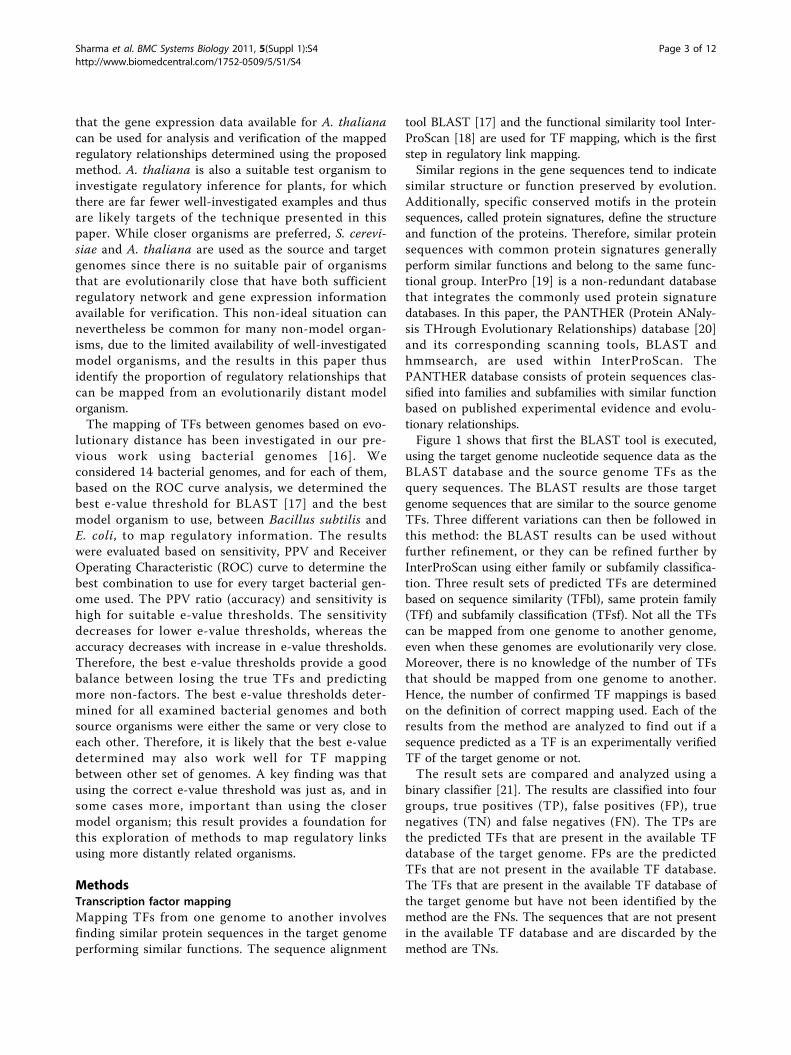
similar structure or function preserved by evolution.Additionally, specific conserved motifs in the proteinsequences, called protein signatures, define the structureand function of the proteins. Therefore, similar proteinsequences with common protein signatures generallyperform similar functions and belong to the same func-tional group. InterPro [19] is a non-redundant databasethat integrates the commonly used protein signaturedatabases. In this paper, the PANTHER (Protein ANaly-sis THrough Evolutionary Relationships) database [20]and its corresponding scanning tools, BLAST andhmmsearch, are used within InterProScan. ThePANTHER database consists of protein sequences clas-sified into families and subfamilies with similar functionbased on published experimental evidence and evolu-tionary relationships.Figure 1 shows that first the BLAST tool is executed,
using the target genome nucleotide sequence data as theBLAST database and the source genome TFs as thequery sequences. The BLAST results are those targetgenome sequences that are similar to the source genomeTFs. Three different variations can then be followed inthis method: the BLAST results can be used withoutfurther refinement, or they can be refined further byInterProScan using either family or subfamily classifica-tion. Three result sets of predicted TFs are determinedbased on sequence similarity (TFbl), same protein family(TFf) and subfamily classification (TFsf). Not all the TFscan be mapped from one genome to another genome,even when these genomes are evolutionarily very close.Moreover, there is no knowledge of the number of TFsthat should be mapped from one genome to another.Hence, the number of confirmed TF mappings is basedon the definition of correct mapping used. Each of theresults from the method are analyzed to find out if asequence predicted as a TF is an experimentally verifiedTF of the target genome or not.The result sets are compared and analyzed using a
binary classifier [21]. The results are classified into fourgroups, true positives (TP), false positives (FP), truenegatives (TN) and false negatives (FN). The TPs arethe predicted TFs that are present in the available TFdatabase of the target genome. FPs are the predictedTFs that are not present in the available TF database.The TFs that are present in the available TF database ofthe target genome but have not been identified by themethod are the FNs. The sequences that are not presentin the available TF database and are discarded by themethod are TNs.
Sharma et al. BMC Systems Biology 2011, 5(Suppl 1):S4http://www.biomedcentral.com/1752-0509/5/S1/S4
Page 3 of 12
Target gene mappingMapping TGs from one genome to another, for a parti-cular TF in a regulatory network, involves finding simi-lar TGs in the target genome. These similar TGs shouldhave the same function as the source genome TGs.Similar function is important in order to have the sametype of regulatory relationship in the target genome asthe regulatory relationship being mapped from in thesource genome. Since TGs may or may not produceproteins, they cannot be grouped based on similar pro-tein signatures, but the BLAST tool can be used to findhighly similar nucleotide sequences that will tend tohave similar function.Additionally, being part of the gene regulation process,
the TF of a regulatory link binds to the binding sitecontaining the TF binding site (TFBS) motif, which isgenerally located upstream of the TG sequence [22].The TFs look for specific motifs (patterns) in the bind-ing site regions of the TGs based on the type and familyof the TF. Different TFs have different sets of TFBSmotifs that they look for in order to regulate their TGs.Hence, the TG being regulated by a certain TF in thesource genome will tend to have one of the specific
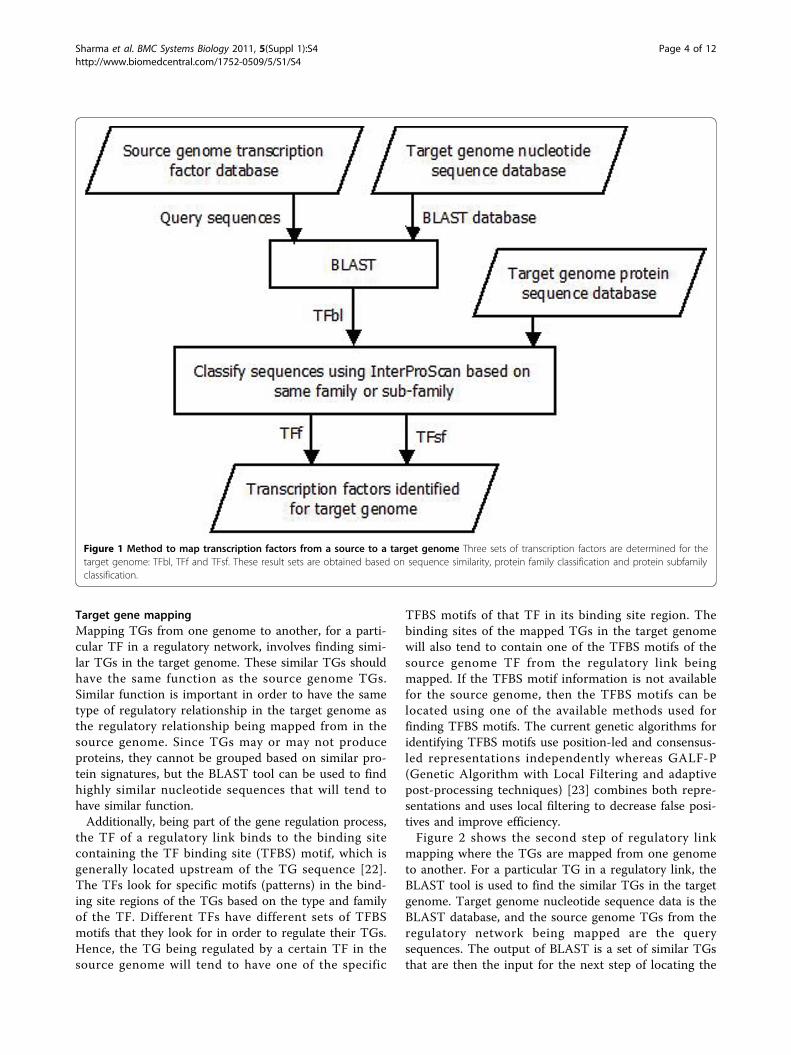
TFBS motifs of that TF in its binding site region. Thebinding sites of the mapped TGs in the target genomewill also tend to contain one of the TFBS motifs of thesource genome TF from the regulatory link beingmapped. If the TFBS motif information is not availablefor the source genome, then the TFBS motifs can belocated using one of the available methods used forfinding TFBS motifs. The current genetic algorithms foridentifying TFBS motifs use position-led and consensus-led representations independently whereas GALF-P(Genetic Algorithm with Local Filtering and adaptivepost-processing techniques) [23] combines both repre-sentations and uses local filtering to decrease false posi-tives and improve efficiency.Figure 2 shows the second step of regulatory link
mapping where the TGs are mapped from one genometo another. For a particular TG in a regulatory link, theBLAST tool is used to find the similar TGs in the targetgenome. Target genome nucleotide sequence data is theBLAST database, and the source genome TGs from theregulatory network being mapped are the querysequences. The output of BLAST is a set of similar TGsthat are then the input for the next step of locating the
Figure 1 Method to map transcription factors from a source to a target genome Three sets of transcription factors are determined for thetarget genome: TFbl, TFf and TFsf. These result sets are obtained based on sequence similarity, protein family classification and protein subfamilyclassification.
Sharma et al. BMC Systems Biology 2011, 5(Suppl 1):S4http://www.biomedcentral.com/1752-0509/5/S1/S4
Page 4 of 12
binding sites. The binding site motif locator searches forthe TFBS motifs of the source genome TF in the similarTG sequences found in the target genome. Finally, thegenes that are similar (found using BLAST) and havethe right TFBS motifs (found using the Binding sitemotif locator) are determined to be the predicted TGsfor the target genome. This set of predicted TGs aretermed TGblbs. TGs are also identified using only theBLAST tool, the first step in this TG mapping method,producing set TGbl. Another set of predicted TGsnamed TGbs is determined by only searching the TFBSmotifs, the second step in this method. The promotersequence data of the target genome is searched with theTFBS motifs to obtain the predicted TGs in set TGpr.The final set TGgalf of predicted TGs is determined byusing the GALF-P tool to identify the TFBS motifs, fol-lowed by searching for these motifs in the target gen-ome promoter sequence database.The result sets are evaluated by comparing the
mapped TGs with the available binding site data for A.thaliana to determine the number of mapped TGs pre-dicted as the correct TGs in the target genome. A bin-ary classifier is used to analyze these results in the sameway as the mapped TFs are analyzed in the previoussubsection.
Mapped regulatory elements integrationThe final step of mapping a regulatory network from thesource genome is to integrate the mapped regulatoryelements to obtain the regulatory links of the target gen-ome. It is crucial to find out if the predicted TG in thetarget genome is correctly linked to the right TF by thelink mapped from the source genome.Two regulatory links from two different genomes tend
to be similar if the two TFs from these links bind to thesame motifs in the TGs, implying that these TFs mightregulate the TGs in a similar way. Hence, the TFBSmotif of the TF present in the TG of the source genomeshould also be present in the TG of the target genome.In this final step of regulatory network mapping shownin Figure 3, for every link in the source genome regula-tory network, the corresponding predicted TFs arelocated among the mapped TFs identified in the firststep of network mapping. The TFBS motifs of thesource genome TF are searched in its TG. The TFBSmotifs that are present in the source genome TG arethen searched in the corresponding mapped TG nucleo-tide sequences of the target genome. Finally, these TFsand the TGs, which contain the specific TFBS motifs,are combined to obtain the target genome regulatorylinks.
Figure 2 Method to map target genes from a source to a target genome Five sets of target genes are identified for the target genome:TGbl, TGbs, TGblbs, TGpr and TGgalf. These sets are determined based on sequence similarity, searching TFBS motifs and sequence similaritycombined with locating TFBS motifs.
Sharma et al. BMC Systems Biology 2011, 5(Suppl 1):S4http://www.biomedcentral.com/1752-0509/5/S1/S4
Page 5 of 12
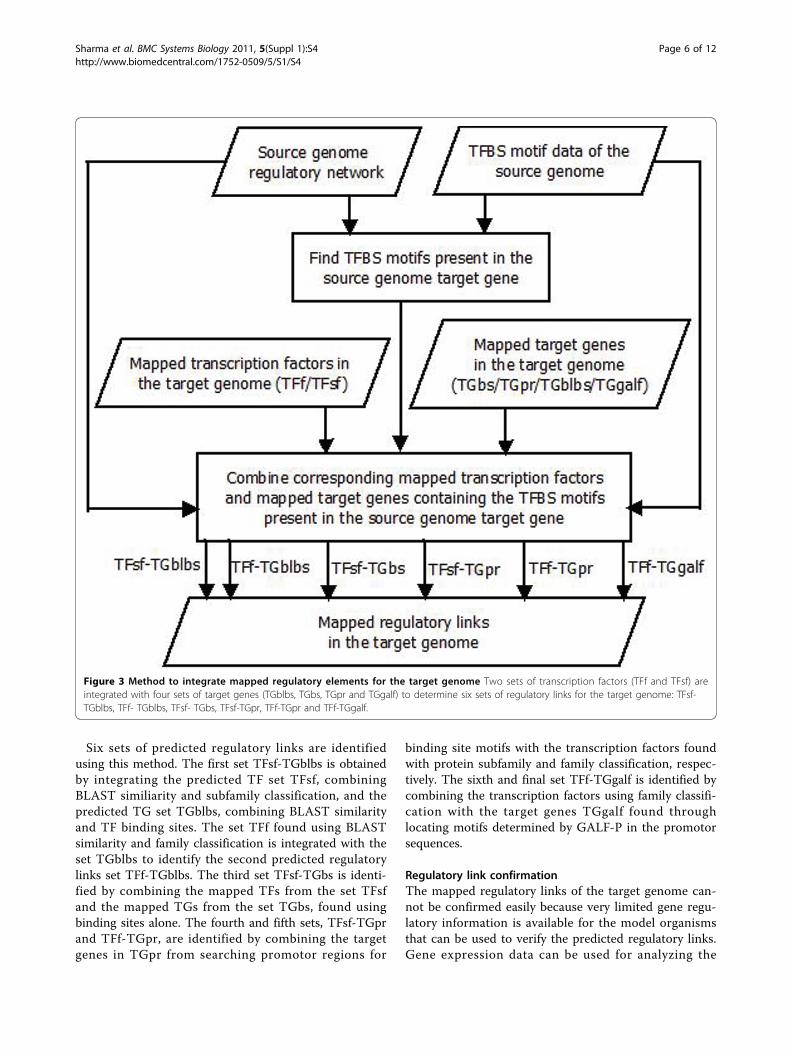
Six sets of predicted regulatory links are identifiedusing this method. The first set TFsf-TGblbs is obtainedby integrating the predicted TF set TFsf, combiningBLAST similiarity and subfamily classification, and thepredicted TG set TGblbs, combining BLAST similarityand TF binding sites. The set TFf found using BLASTsimilarity and family classification is integrated with theset TGblbs to identify the second predicted regulatorylinks set TFf-TGblbs. The third set TFsf-TGbs is identi-fied by combining the mapped TFs from the set TFsfand the mapped TGs from the set TGbs, found usingbinding sites alone. The fourth and fifth sets, TFsf-TGprand TFf-TGpr, are identified by combining the targetgenes in TGpr from searching promotor regions for
binding site motifs with the transcription factors foundwith protein subfamily and family classification, respec-tively. The sixth and final set TFf-TGgalf is identified bycombining the transcription factors using family classifi-cation with the target genes TGgalf found throughlocating motifs determined by GALF-P in the promotorsequences.
Regulatory link confirmationThe mapped regulatory links of the target genome can-not be confirmed easily because very limited gene regu-latory information is available for the model organismsthat can be used to verify the predicted regulatory links.Gene expression data can be used for analyzing the
Figure 3 Method to integrate mapped regulatory elements for the target genome Two sets of transcription factors (TFf and TFsf) areintegrated with four sets of target genes (TGblbs, TGbs, TGpr and TGgalf) to determine six sets of regulatory links for the target genome: TFsf-TGblbs, TFf- TGblbs, TFsf- TGbs, TFsf-TGpr, TFf-TGpr and TFf-TGgalf.
Sharma et al. BMC Systems Biology 2011, 5(Suppl 1):S4http://www.biomedcentral.com/1752-0509/5/S1/S4
Page 6 of 12
mapped regulatory links of the target genome and isavailable for verification.Gene expression data contains expression levels of
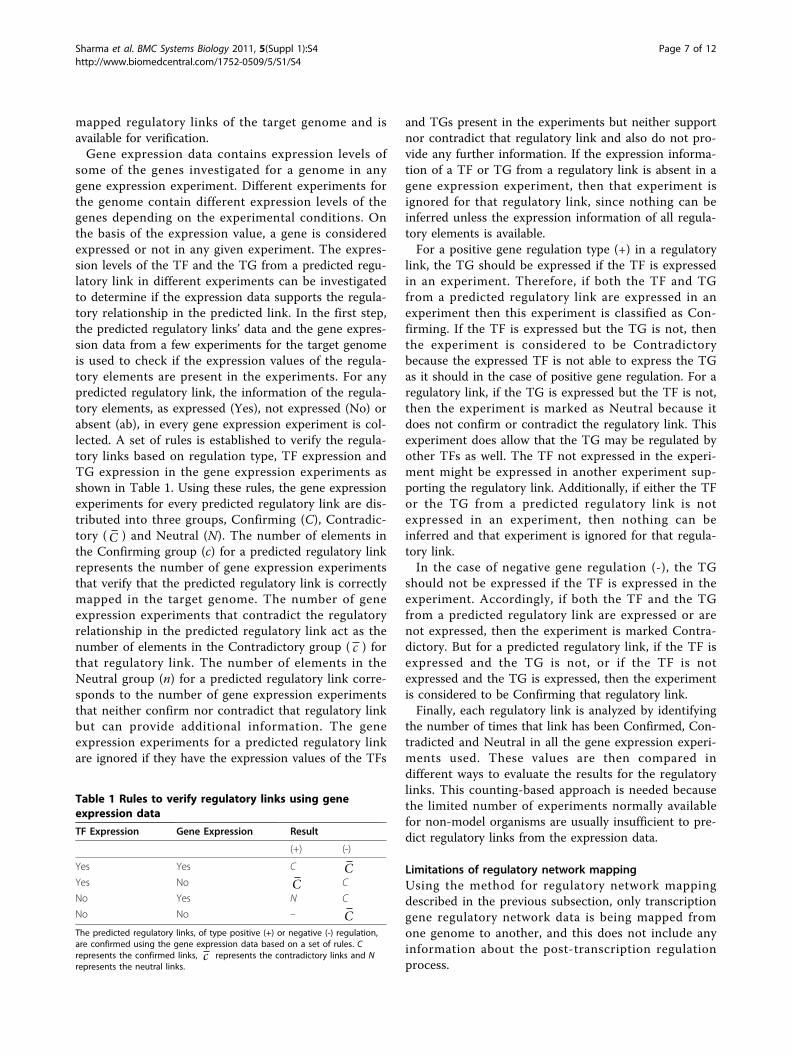
some of the genes investigated for a genome in anygene expression experiment. Different experiments forthe genome contain different expression levels of thegenes depending on the experimental conditions. Onthe basis of the expression value, a gene is consideredexpressed or not in any given experiment. The expres-sion levels of the TF and the TG from a predicted regu-latory link in different experiments can be investigatedto determine if the expression data supports the regula-tory relationship in the predicted link. In the first step,the predicted regulatory links’ data and the gene expres-sion data from a few experiments for the target genomeis used to check if the expression values of the regula-tory elements are present in the experiments. For anypredicted regulatory link, the information of the regula-tory elements, as expressed (Yes), not expressed (No) orabsent (ab), in every gene expression experiment is col-lected. A set of rules is established to verify the regula-tory links based on regulation type, TF expression andTG expression in the gene expression experiments asshown in Table 1. Using these rules, the gene expressionexperiments for every predicted regulatory link are dis-tributed into three groups, Confirming (C), Contradic-tory (C ) and Neutral (N). The number of elements inthe Confirming group (c) for a predicted regulatory linkrepresents the number of gene expression experimentsthat verify that the predicted regulatory link is correctlymapped in the target genome. The number of geneexpression experiments that contradict the regulatoryrelationship in the predicted regulatory link act as thenumber of elements in the Contradictory group ( c ) forthat regulatory link. The number of elements in theNeutral group (n) for a predicted regulatory link corre-sponds to the number of gene expression experimentsthat neither confirm nor contradict that regulatory linkbut can provide additional information. The geneexpression experiments for a predicted regulatory linkare ignored if they have the expression values of the TFs
and TGs present in the experiments but neither supportnor contradict that regulatory link and also do not pro-vide any further information. If the expression informa-tion of a TF or TG from a regulatory link is absent in agene expression experiment, then that experiment isignored for that regulatory link, since nothing can beinferred unless the expression information of all regula-tory elements is available.For a positive gene regulation type (+) in a regulatory
link, the TG should be expressed if the TF is expressedin an experiment. Therefore, if both the TF and TGfrom a predicted regulatory link are expressed in anexperiment then this experiment is classified as Con-firming. If the TF is expressed but the TG is not, thenthe experiment is considered to be Contradictorybecause the expressed TF is not able to express the TGas it should in the case of positive gene regulation. For aregulatory link, if the TG is expressed but the TF is not,then the experiment is marked as Neutral because itdoes not confirm or contradict the regulatory link. Thisexperiment does allow that the TG may be regulated byother TFs as well. The TF not expressed in the experi-ment might be expressed in another experiment sup-porting the regulatory link. Additionally, if either the TFor the TG from a predicted regulatory link is notexpressed in an experiment, then nothing can beinferred and that experiment is ignored for that regula-tory link.In the case of negative gene regulation (-), the TG
should not be expressed if the TF is expressed in theexperiment. Accordingly, if both the TF and the TGfrom a predicted regulatory link are expressed or arenot expressed, then the experiment is marked Contra-dictory. But for a predicted regulatory link, if the TF isexpressed and the TG is not, or if the TF is notexpressed and the TG is expressed, then the experimentis considered to be Confirming that regulatory link.Finally, each regulatory link is analyzed by identifying
the number of times that link has been Confirmed, Con-tradicted and Neutral in all the gene expression experi-ments used. These values are then compared indifferent ways to evaluate the results for the regulatorylinks. This counting-based approach is needed becausethe limited number of experiments normally availablefor non-model organisms are usually insufficient to pre-dict regulatory links from the expression data.
Limitations of regulatory network mappingUsing the method for regulatory network mappingdescribed in the previous subsection, only transcriptiongene regulatory network data is being mapped fromone genome to another, and this does not include anyinformation about the post-transcription regulationprocess.
Table 1 Rules to verify regulatory links using geneexpression data
TF Expression Gene Expression Result
(+) (-)
Yes Yes C CYes No C C
No Yes N C
No No – CThe predicted regulatory links, of type positive (+) or negative (-) regulation,are confirmed using the gene expression data based on a set of rules. Crepresents the confirmed links, c represents the contradictory links and Nrepresents the neutral links.
Sharma et al. BMC Systems Biology 2011, 5(Suppl 1):S4http://www.biomedcentral.com/1752-0509/5/S1/S4
Page 7 of 12
It is important to understand how many regulatorylinks are conserved over different genomes since there isno distinct definition of these. Many regulatory linksfrom the source genome cannot be mapped to the targetgenome for various reasons. Firstly, both the TF and theTG in a regulatory link might not have similar TFs andTGs at all in the source genome, depending on how dif-ferent the genomes are. Secondly, many similar TFs orTGs present in the source genome might not have theircorresponding similar TFs or TGs present in the targetgenome. Thirdly, TFBS motifs need not be conservedwell among genomes due to changes in the sequencesover time. Fourthly, not all source genome TGs containthe TFBS motifs of their regulator (TF) in the availableregulatory network used for mapping.Additionally, some binding sites are present in the
nucleotide sequences but are not involved in the regula-tion of genes in certain conditions by being inactive[23]. These binding sites can be inactive due to theoccupancy of nucleosomes hindering the binding of theTF to the binding site in any genome. About 75 to 90percent of the DNA in a genome is bundled up innucleosomes. The unwrapped DNA stretching betweentwo neighboring nucleosomes is called linker DNA.Hence, binding sites present on the linker DNA are lar-gely the active binding sites available to interact withthe proteins to form protein complexes.It has been estimated in a research study [24] that
there might be 0 to 200 possible TGs for a TF in S. cer-evisiae, though approximately only 3 percent of the TGswill have their binding sites bind to these TFs of S. cere-visiae. Similar density of binding between TGs and TFsis also found in higher eukaryotes. This suggests thatgene expression data can only support the three percentof the possible regulatory relationships that actuallyexist at a certain time. Some binding sites may not evenbe involved in the gene regulation process and have nochange in their gene expression values in two differenttreatments. These binding sites might be conditionalrelying on the presence or absence of other TFs.It is also shown [24] that binding patterns for some
TFs are dynamic and change under different environ-mental conditions. Also, all the predicted regulatorylinks may not necessarily be the direct links in the targetgenome [24], and so the TGs can be regulated indirectlyby the TFs based on the feedforward loop motif con-cept. In feedforward motifs, one TF regulates anotherTF, and they both regulate a TG, though the regulationbetween the first TF and the TG is at least partly anindirect regulation. It is extremely difficult to predictindirect regulatory links without using substantial geneexpression data, and so far only limited informationabout the direct regulatory links is available for themodel organisms.
All the above facts show that gene regulatory net-works are very complex networks and it is extremelydifficult to integrate all the different factors mentionedearlier to determine regulatory networks, even for amodel organism.
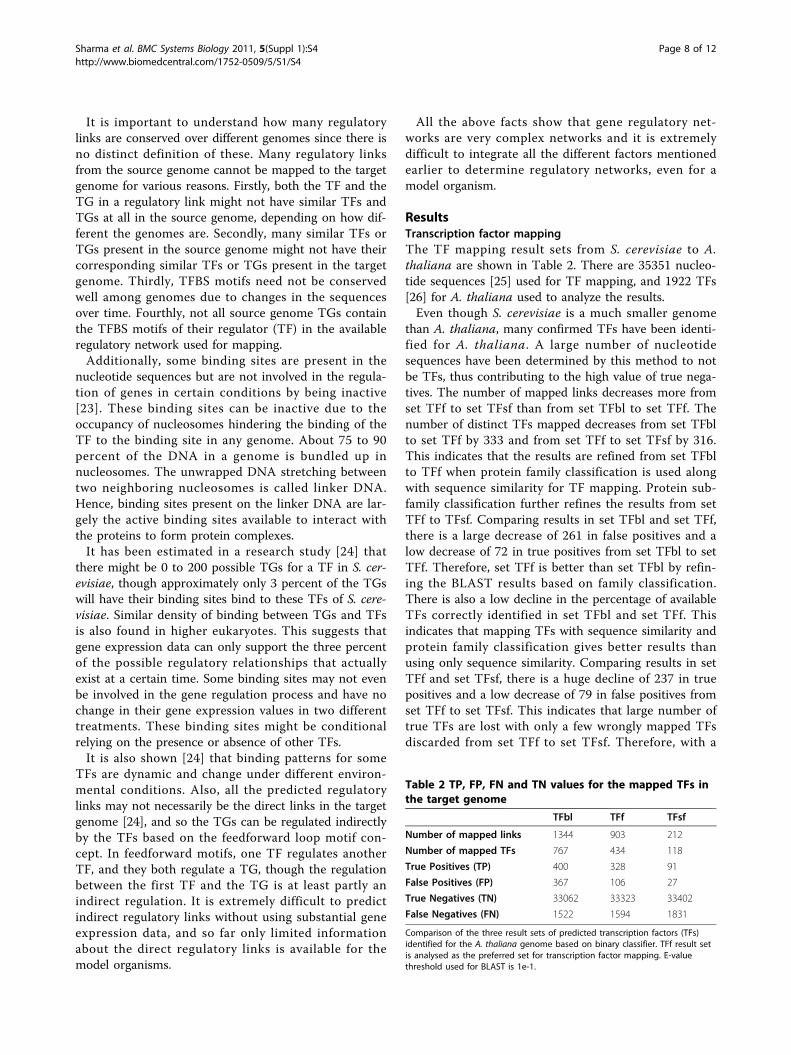
ResultsTranscription factor mappingThe TF mapping result sets from S. cerevisiae to A.thaliana are shown in Table 2. There are 35351 nucleo-tide sequences [25] used for TF mapping, and 1922 TFs[26] for A. thaliana used to analyze the results.Even though S. cerevisiae is a much smaller genome
than A. thaliana, many confirmed TFs have been identi-fied for A. thaliana. A large number of nucleotidesequences have been determined by this method to notbe TFs, thus contributing to the high value of true nega-tives. The number of mapped links decreases more fromset TFf to set TFsf than from set TFbl to set TFf. Thenumber of distinct TFs mapped decreases from set TFblto set TFf by 333 and from set TFf to set TFsf by 316.This indicates that the results are refined from set TFblto TFf when protein family classification is used alongwith sequence similarity for TF mapping. Protein sub-family classification further refines the results from setTFf to TFsf. Comparing results in set TFbl and set TFf,there is a large decrease of 261 in false positives and alow decrease of 72 in true positives from set TFbl to setTFf. Therefore, set TFf is better than set TFbl by refin-ing the BLAST results based on family classification.There is also a low decline in the percentage of availableTFs correctly identified in set TFbl and set TFf. Thisindicates that mapping TFs with sequence similarity andprotein family classification gives better results thanusing only sequence similarity. Comparing results in setTFf and set TFsf, there is a huge decline of 237 in truepositives and a low decrease of 79 in false positives fromset TFf to set TFsf. This indicates that large number oftrue TFs are lost with only a few wrongly mapped TFsdiscarded from set TFf to set TFsf. Therefore, with a
Table 2 TP, FP, FN and TN values for the mapped TFs inthe target genome
TFbl TFf TFsf
Number of mapped links 1344 903 212
Number of mapped TFs 767 434 118
True Positives (TP) 400 328 91
False Positives (FP) 367 106 27
True Negatives (TN) 33062 33323 33402
False Negatives (FN) 1522 1594 1831
Comparison of the three result sets of predicted transcription factors (TFs)identified for the A. thaliana genome based on binary classifier. TFf result setis analysed as the preferred set for transcription factor mapping. E-valuethreshold used for BLAST is 1e-1.
Sharma et al. BMC Systems Biology 2011, 5(Suppl 1):S4http://www.biomedcentral.com/1752-0509/5/S1/S4
Page 8 of 12
huge decline in true positives and in the percentage ofavailable TFs correctly predicted, and a low decrease infalse positives, set TFf has better results than set TFsf.This suggests that the refined results in set TFsf that areobtained using protein subfamily classification are notbetter than the results in set TFf based on proteinfamily classification. True negatives in all the mappedTF sets are very high because most of the sequencesthat are not TFs have very low similarity to the TFsequences.
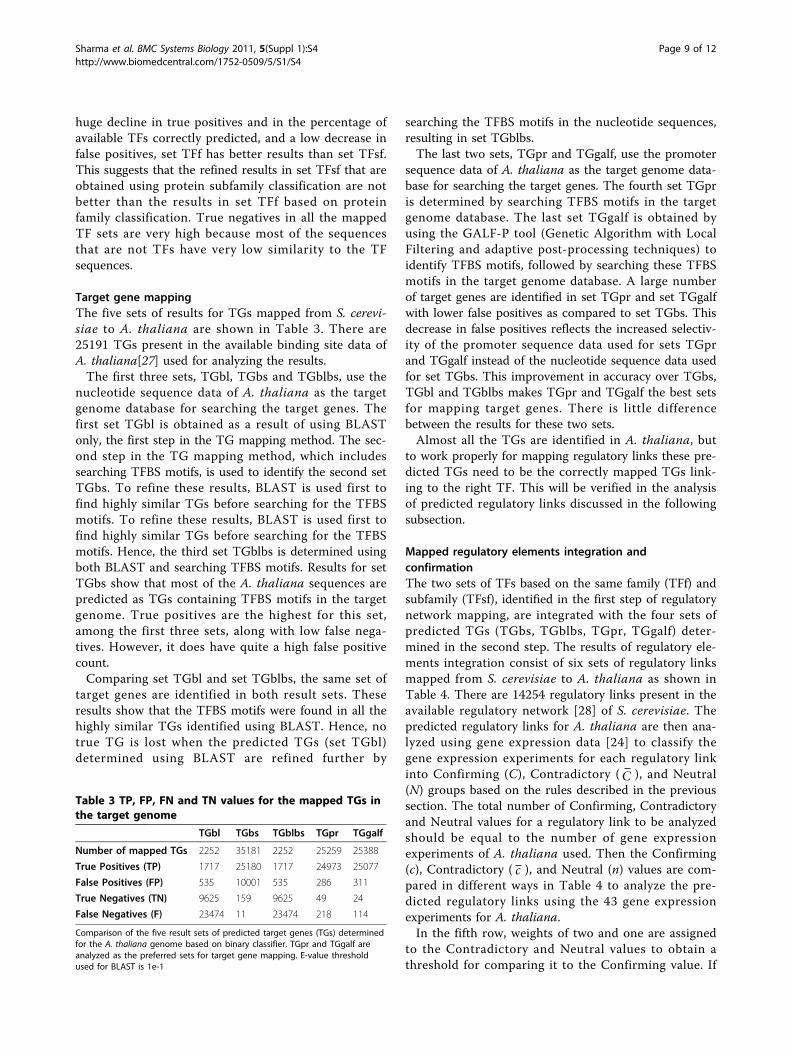
Target gene mappingThe five sets of results for TGs mapped from S. cerevi-siae to A. thaliana are shown in Table 3. There are25191 TGs present in the available binding site data ofA. thaliana[27] used for analyzing the results.The first three sets, TGbl, TGbs and TGblbs, use the
nucleotide sequence data of A. thaliana as the targetgenome database for searching the target genes. Thefirst set TGbl is obtained as a result of using BLASTonly, the first step in the TG mapping method. The sec-ond step in the TG mapping method, which includessearching TFBS motifs, is used to identify the second setTGbs. To refine these results, BLAST is used first tofind highly similar TGs before searching for the TFBSmotifs. To refine these results, BLAST is used first tofind highly similar TGs before searching for the TFBSmotifs. Hence, the third set TGblbs is determined usingboth BLAST and searching TFBS motifs. Results for setTGbs show that most of the A. thaliana sequences arepredicted as TGs containing TFBS motifs in the targetgenome. True positives are the highest for this set,among the first three sets, along with low false nega-tives. However, it does have quite a high false positivecount.Comparing set TGbl and set TGblbs, the same set of
target genes are identified in both result sets. Theseresults show that the TFBS motifs were found in all thehighly similar TGs identified using BLAST. Hence, notrue TG is lost when the predicted TGs (set TGbl)determined using BLAST are refined further by
searching the TFBS motifs in the nucleotide sequences,resulting in set TGblbs.The last two sets, TGpr and TGgalf, use the promoter
sequence data of A. thaliana as the target genome data-base for searching the target genes. The fourth set TGpris determined by searching TFBS motifs in the targetgenome database. The last set TGgalf is obtained byusing the GALF-P tool (Genetic Algorithm with LocalFiltering and adaptive post-processing techniques) toidentify TFBS motifs, followed by searching these TFBSmotifs in the target genome database. A large numberof target genes are identified in set TGpr and set TGgalfwith lower false positives as compared to set TGbs. Thisdecrease in false positives reflects the increased selectiv-ity of the promoter sequence data used for sets TGprand TGgalf instead of the nucleotide sequence data usedfor set TGbs. This improvement in accuracy over TGbs,TGbl and TGblbs makes TGpr and TGgalf the best setsfor mapping target genes. There is little differencebetween the results for these two sets.Almost all the TGs are identified in A. thaliana, but
to work properly for mapping regulatory links these pre-dicted TGs need to be the correctly mapped TGs link-ing to the right TF. This will be verified in the analysisof predicted regulatory links discussed in the followingsubsection.
Mapped regulatory elements integration andconfirmationThe two sets of TFs based on the same family (TFf) andsubfamily (TFsf), identified in the first step of regulatorynetwork mapping, are integrated with the four sets ofpredicted TGs (TGbs, TGblbs, TGpr, TGgalf) deter-mined in the second step. The results of regulatory ele-ments integration consist of six sets of regulatory linksmapped from S. cerevisiae to A. thaliana as shown inTable 4. There are 14254 regulatory links present in theavailable regulatory network [28] of S. cerevisiae. Thepredicted regulatory links for A. thaliana are then ana-lyzed using gene expression data [24] to classify thegene expression experiments for each regulatory linkinto Confirming (C), Contradictory (C ), and Neutral(N) groups based on the rules described in the previoussection. The total number of Confirming, Contradictoryand Neutral values for a regulatory link to be analyzedshould be equal to the number of gene expressionexperiments of A. thaliana used. Then the Confirming(c), Contradictory ( c ), and Neutral (n) values are com-pared in different ways in Table 4 to analyze the pre-dicted regulatory links using the 43 gene expressionexperiments for A. thaliana.In the fifth row, weights of two and one are assigned
to the Contradictory and Neutral values to obtain athreshold for comparing it to the Confirming value. If
Table 3 TP, FP, FN and TN values for the mapped TGs inthe target genome
TGbl TGbs TGblbs TGpr TGgalf
Number of mapped TGs 2252 35181 2252 25259 25388
True Positives (TP) 1717 25180 1717 24973 25077
False Positives (FP) 535 10001 535 286 311
True Negatives (TN) 9625 159 9625 49 24
False Negatives (F) 23474 11 23474 218 114
Comparison of the five result sets of predicted target genes (TGs) determinedfor the A. thaliana genome based on binary classifier. TGpr and TGgalf areanalyzed as the preferred sets for target gene mapping. E-value thresholdused for BLAST is 1e-1
Sharma et al. BMC Systems Biology 2011, 5(Suppl 1):S4http://www.biomedcentral.com/1752-0509/5/S1/S4
Page 9 of 12
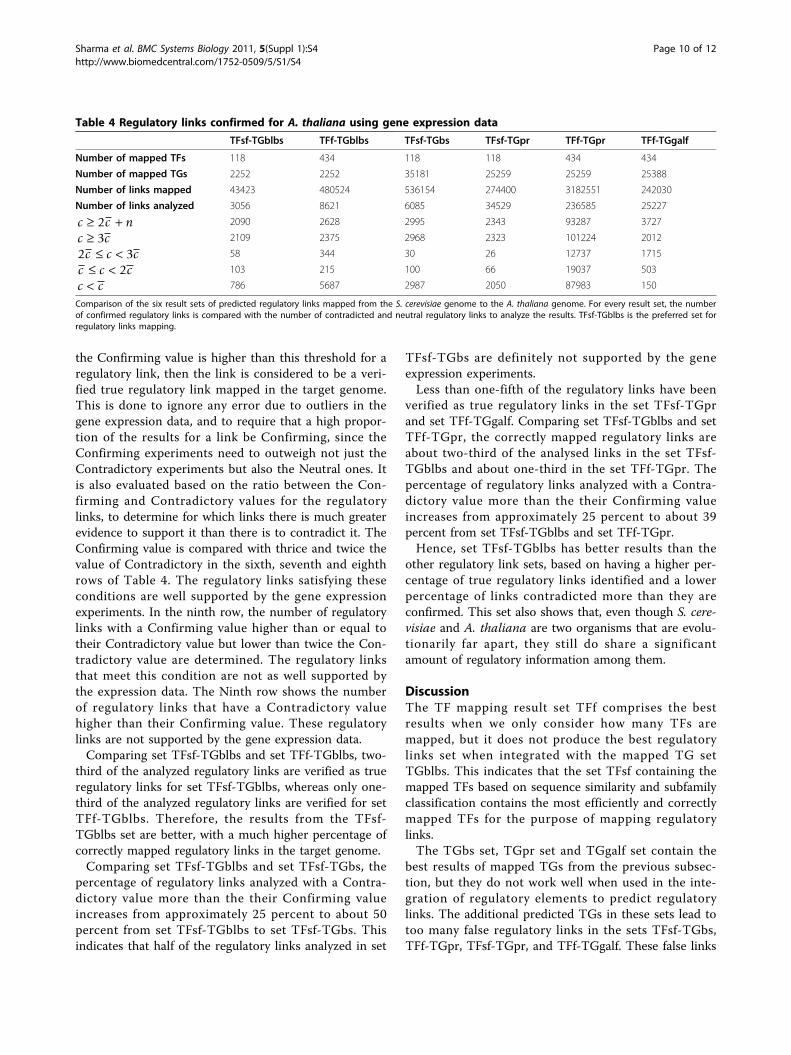
the Confirming value is higher than this threshold for aregulatory link, then the link is considered to be a veri-fied true regulatory link mapped in the target genome.This is done to ignore any error due to outliers in thegene expression data, and to require that a high propor-tion of the results for a link be Confirming, since theConfirming experiments need to outweigh not just theContradictory experiments but also the Neutral ones. Itis also evaluated based on the ratio between the Con-firming and Contradictory values for the regulatorylinks, to determine for which links there is much greaterevidence to support it than there is to contradict it. TheConfirming value is compared with thrice and twice thevalue of Contradictory in the sixth, seventh and eighthrows of Table 4. The regulatory links satisfying theseconditions are well supported by the gene expressionexperiments. In the ninth row, the number of regulatorylinks with a Confirming value higher than or equal totheir Contradictory value but lower than twice the Con-tradictory value are determined. The regulatory linksthat meet this condition are not as well supported bythe expression data. The Ninth row shows the numberof regulatory links that have a Contradictory valuehigher than their Confirming value. These regulatorylinks are not supported by the gene expression data.Comparing set TFsf-TGblbs and set TFf-TGblbs, two-
third of the analyzed regulatory links are verified as trueregulatory links for set TFsf-TGblbs, whereas only one-third of the analyzed regulatory links are verified for setTFf-TGblbs. Therefore, the results from the TFsf-TGblbs set are better, with a much higher percentage ofcorrectly mapped regulatory links in the target genome.Comparing set TFsf-TGblbs and set TFsf-TGbs, the
percentage of regulatory links analyzed with a Contra-dictory value more than the their Confirming valueincreases from approximately 25 percent to about 50percent from set TFsf-TGblbs to set TFsf-TGbs. Thisindicates that half of the regulatory links analyzed in set
TFsf-TGbs are definitely not supported by the geneexpression experiments.Less than one-fifth of the regulatory links have been
verified as true regulatory links in the set TFsf-TGprand set TFf-TGgalf. Comparing set TFsf-TGblbs and setTFf-TGpr, the correctly mapped regulatory links areabout two-third of the analysed links in the set TFsf-TGblbs and about one-third in the set TFf-TGpr. Thepercentage of regulatory links analyzed with a Contra-dictory value more than the their Confirming valueincreases from approximately 25 percent to about 39percent from set TFsf-TGblbs and set TFf-TGpr.Hence, set TFsf-TGblbs has better results than the
other regulatory link sets, based on having a higher per-centage of true regulatory links identified and a lowerpercentage of links contradicted more than they areconfirmed. This set also shows that, even though S. cere-visiae and A. thaliana are two organisms that are evolu-tionarily far apart, they still do share a significantamount of regulatory information among them.
DiscussionThe TF mapping result set TFf comprises the bestresults when we only consider how many TFs aremapped, but it does not produce the best regulatorylinks set when integrated with the mapped TG setTGblbs. This indicates that the set TFsf containing themapped TFs based on sequence similarity and subfamilyclassification contains the most efficiently and correctlymapped TFs for the purpose of mapping regulatorylinks.The TGbs set, TGpr set and TGgalf set contain the
best results of mapped TGs from the previous subsec-tion, but they do not work well when used in the inte-gration of regulatory elements to predict regulatorylinks. The additional predicted TGs in these sets lead totoo many false regulatory links in the sets TFsf-TGbs,TFf-TGpr, TFsf-TGpr, and TFf-TGgalf. These false links
Table 4 Regulatory links confirmed for A. thaliana using gene expression data
TFsf-TGblbs TFf-TGblbs TFsf-TGbs TFsf-TGpr TFf-TGpr TFf-TGgalf
Number of mapped TFs 118 434 118 118 434 434
Number of mapped TGs 2252 2252 35181 25259 25259 25388
Number of links mapped 43423 480524 536154 274400 3182551 242030
Number of links analyzed 3056 8621 6085 34529 236585 25227
c c n≥ +2 2090 2628 2995 2343 93287 3727
c c≥ 3 2109 2375 2968 2323 101224 2012
2 3c c c≤ < 58 344 30 26 12737 1715
c c c≤ < 2 103 215 100 66 19037 503
c c< 786 5687 2987 2050 87983 150
Comparison of the six result sets of predicted regulatory links mapped from the S. cerevisiae genome to the A. thaliana genome. For every result set, the numberof confirmed regulatory links is compared with the number of contradicted and neutral regulatory links to analyze the results. TFsf-TGblbs is the preferred set forregulatory links mapping.
Sharma et al. BMC Systems Biology 2011, 5(Suppl 1):S4http://www.biomedcentral.com/1752-0509/5/S1/S4
Page 10 of 12
indicate that many of the true TGs identified for the tar-get genome in set TGbs, set TGpr and set TGgalf are,however, not the correctly mapped TGs linked to theright TF in their corresponding regulatory link resultsets. All the predicted TGs do contain the TFBS motifsfor some TF but these TGs need to correspond to thecorrect TF, identifying the right regulatory link in thetarget genome. These results suggest that, in order to beused to map regulatory links, the TGs identified in thetarget genome using TFBS motifs also need to be similarin sequence to the source genome TGs, as identified inset TGblbs. Therefore, the result of other possible sets,TFf-TFbs and TFsf-TGgalf, are not included in thispaper as their sets of regulatory elements are alreadydetermined to lead to many false positives when inte-grated to produce a predicted regulatory link.
ConclusionsA three step approach has been proposed to map a reg-ulatory network from a model organism to a non-modelorganism. This includes mapping the transcription fac-tors and the target genes separately and then integratingthese regulatory elements to identify the regulatory rela-tionships for the target genome. Rules are established toevaluate the predicted regulatory links using geneexpression data from the target genome.Results are obtained in the transcription factor map-
ping step based on three techniques, using BLAST,using BLAST with protein family classification andusing BLAST with protein subfamily classification.Results show that the technique based on sequencesimilarity and protein family classification maps tran-scription factors most efficiently from S. cerevisiae to A.thaliana; therefore, it is the preferred method for gen-eral transcription factor mapping.There are five techniques used for target gene map-
ping, based on sequence similarity, TFBS motifs, andsequence similarity along with TFBS motifs. Using threemethods, most of the target genes are identified cor-rectly for A. thaliana by searching TFBS motifs only.These methods have better results with many more truepositives than using only sequence similarity and thanusing sequence similarity with TFBS motifs. The sameset of target genes is predicted using sequence similarityand using sequence similarity along with TFBS motifs.Therefore, the methods using TFBS motifs only are thepreferred method for general target gene mapping.Among these three methods, the two methods using thetarget genome promoter sequence database for search-ing TFBS motifs are better with much lower falsepositives.Six sets of regulatory links are obtained in the regula-
tory elements integration step. The first set combinesthe mapped transcription factors based on sequence
similarity and protein family classification with the tar-get genes based on sequence similarity and seachingTFBS motifs in the nucleotide sequence database. Thesecond set combines the mapped transcription factorsbased on sequence similarity and protein subfamily clas-sification with the target genes based on sequence simi-larity and seaching TFBS motifs in the nucleotidesequence database. The mapped transcription factorsbased on sequence similarity and protein family classifi-cation are integrated with the target genes based onseaching TFBS motifs in the nucleotide sequence data-base in the third set. The fourth set combines themapped transcription factors based on sequence similar-ity and protein subfamily classification with the targetgenes based on searching TFBS in the promotersequence database. The mapped transcription factorsbased on sequence similarity and protein family classifi-cation are integrated with the target genes based onseaching TFBS motifs in the promoter sequence data-base in the fifth set. The sixth set combines the mappedtranscription factors based on sequence similarity andprotein family classification with the target genes basedon identifying and then searching TFBS motifs in thepromoter sequence database. In the results, the largeamount of target genes identified using the preferredmethod for target gene mapping produce many falseregulatory links, since, while they are target genes, theyare not linked to the correct transcription factor.Additionally, the transcription factors from the pre-
ferred method of transcription factor mapping also con-tribute to many false regulatory links when used in theregulatory elements integration step.Hence, the predicted regulatory links obtained by inte-
grating the mapped transcription factors based onsequence similarity and protein sub-family classificationand mapped target genes based on sequence similarityand TFBS motifs contain the most regulatory links forthe target genome that are verified by the gene expres-sion data. This implies that more correctly mapped tar-get genes that link to the right transcription factor aredetermined by using BLAST along with the TFBSmotifs. Also, the correctly mapped transcription factorsare obtained using the method based on sequence simi-larity and protein sub-family classification. This suggeststhat regulatory relationships are conserved between dif-ferent genomes and can be mapped between them.Therefore, for a newly sequenced organism, a relatedmodel organism can be used to determine some regula-tory information for the lesser explored organism, avoid-ing the need to complete significant expressionexperiments for the target organism.The use of TFBS information in finding target genes,
while showing the best final results, does cause someerrors. Even when the target genes contain the
Sharma et al. BMC Systems Biology 2011, 5(Suppl 1):S4http://www.biomedcentral.com/1752-0509/5/S1/S4
Page 11 of 12
regulatory motifs of certain transcription factors, thesegenes may not be regulated by these transcription fac-tors at all. This is because, only a very small percentageof binding sites are available to bind to interact with thetranscription factors, as mentioned earlier in the limita-tion of regulatory networks section. False positives inour results could then be reduced by integrating infor-mation about the active binding sites in the targetgenes. Considering alternative sources of TFBS informa-tion could also decrease the false negatives, as we dis-covered that the lack of an instance of the appropriatebinding site motif did not always correlate to lack ofregulation in the source genome.More biological and regulatory information can also
be integrated further into the regulatory network map-ping method as more data becomes available for non-model organisms. Experimental data, such as geneexpression, time series, or flow cytometry data, can beused to filter predicted links, even if this data includesonly a small number of experiments. Furthermore, addi-tional information about gene regulation at differentstages of gene expression can be incorporated as well.
AcknowledgementsThis work was supported in part by the Canada Potato Genome Project(Genome Canada and Atlantic Innovation Fund), the New BrunswickInnovation Foundation, and the Natural Sciences and Engineering ResearchCouncil of Canada (through Discovery Grants 204923 to P.A. Evans and 0089to V.C. Bhavsar). This work has used high-performance computing facilities ofthe Atlantic Computational Excellence Network (ACEnet). An initialcondensed version of this paper appeared at the 4th InternationalConference on Computational Systems Biology (ISB 2010) [29].This article has been published as part of BMC Systems Biology Volume 5Supplement 1, 2011: Selected articles from the 4th International Conferenceon Computational Systems Biology (ISB 2010). The full contents of thesupplement are available online at http://www.biomedcentral.com/1752-0509/5?issue=S1.
Authors’ contributionsRS designed and carried out the experiments, and drafted the paper. PAEwas responsible for directing the experiments and contributed to thediscussion of the method and results. Both PAE and VCB supervised thework and assisted in polishing the final paper.
Competing interestsThe authors declare that they have no competing interests.
Published: 20 June 2011
References1. Lewin B: Genes VII. NewYork: Oxford University Press; 2000.2. Villard J: Transcription regulation and human diseases. Swiss Medical
Weekly 2004, 134:571-579.3. Xie Y, Chen X, Wagner TE: A ribozyme-mediated, gene ‘‘knockdown’’
strategy for the identification of gene function in zebrafish. InProceedings of the National Academy of Sciences of the USA 1997,94(25):13777-13781.
4. Liang S, Fuhrman S, Somogyi R: Reveal, a general reverse engineeringalgorithm for inference of genetic network architectures. Proceedings ofthe third Pacific Symposium on Biocomputing 1998, 18-29.
5. Akutsu T, Miyano S, Kuhara S: Identification of genetic networks from asmall number of gene expression patterns under the boolean network
model. Proceedings of the fourth Pacific Symposium on Biocomputing 1999,17-28.
6. Imoto S, Higuchi T, Goto T, Tashiro K, Kuhara S, Miyano S: Combiningmicroarrays and biological knowledge for estimating gene networks viaBayesian Networks. Journal of Bioinformatics and Computational Biology2004, 2(1):77-98.
7. Almasri E, Larsen P, Chen G, Dai Y: Incorporating literature knowledge inBayesian network for inferring gene networks with gene expressiondata. Bioinformatics Research and Applications 2008, 4983:184-195.
8. Liua G, Fenga W, Wanga H, Liua L, Zhou C: Reconstruction of GeneRegulatory Networks Based on Two-Stage Bayesian Network StructureLearning Algorithm. Journal of Bionic Engineering 2009, 6(1):86-92.
9. De Hoon MJL, Imoto S, Miyano S: Inferring gene regulatory networksfrom time-ordered gene expression data using differential equations.Proceedings of the fifth International Conference on Discovery Science 2002,267:-274.
10. Matsuno H, Doi A, Nagasaki M, Miyano S: Hybrid petri net representationof gene regulatory network. Proceedings of the fifth Pacific Symposium onBiocomputing 2000, 341-352.
11. Hecker M, Lambeck S, Toepfer S, Van Someren E, Guthke R: Generegulatory network inference: data integration in dynamic models—areview. Biosystems 2009, 96(1):86-103.
12. Wessels LFA, Van Someren EP, Reinders MJT: A comparison of geneticnetwork models. Proceedings of the sixth Pacific Symposium onBiocomputing 2001, 508-519.
13. Zhou X, Sumazin P, Rajbhandari P, Califano A: A Systems BiologyApproach to Transcription Factor Binding Site Prediction. PLoS ONE 5(3):e9878, doi:10.1371/journal.pone.0009878.
14. Olman V, Peng H, Su Z, Ying X: Mapping of microbial pathways throughconstrained mapping of orthologous genes. Proceedings of theComputational Systems Bioinformatics Conference 2004, 363-370.
15. Kanehisa M, Goto S, Kawashima S, Nakaya A: The KEGG databases atGenomeNet. Nucleic Acids Research 2002, 30(1):42-46.
16. Sharma R, Evans PA, Bhavsar VC: Transcription factor mapping betweenbacteria genomes. International Journal of Functional Informatics andPersonalised Medicine 2009, 2(4):424-441.
17. Altschul SF, Gish W, Miller W, Myers EW, Lipman DJ: Basic local alignmentsearch tool. Journal of Molecular Biology 1990, 215:403-410.
18. Zdobnov EM, Apweiler R: InterProScan - an integration platform for thesignature-recognition methods in InterPro. Bioinformatics 2001,17(9):847-848.
19. Hunter S, et al: InterPro: the integrative protein signature database.Nucleic Acids Research 2009, 37:D211-D215.
20. Thomas PD, et al: PANTHER: a library of protein families and subfamiliesindexed by function. Genome Research 2003, 13(9):2129-2141.
21. Nargundkar S, Priestley JL: Assessment of evaluation methods for binaryclassification modeling. Proceedings of the Decision Sciences InstituteNational Conference 2003, 1-6.
22. Wijaya E, Yiu SM, Son NT, Kanagasabai R, Sung WK: MotifVoter: a novelensemble method for fine-grained integration of generic motif finders.Bioinformatics 2008, 24(20):2288-2295.
23. Chan TM, Leung KS, Lee KH: TFBS identification based on geneticalgorithm with combined representations and adaptive post-processing.Bioinformatics 2008, 24(3):341-349.
24. Van Steensel B: Mapping of genetic and epigenetic regulatory networksusing microarrays. Nature Genetics 2005, 37:S18-S24.
25. Rhee SY, Crosby B: Biological Databases for Plant Research. PlantPhysiology 2005, 138(1):1-3.
26. Guo AY, et al: PlantTFDB: a comprehensive plant transcription factordatabase. Nucleic Acids Research 2008, 36:D966-D969.
27. Molina C, Grotewold E: Genome wide analysis of Arabidopsis corepromoters. BMC Genomics 2005, 6(1):25.
28. Teixeira MC, et al: The YEASTRACT database: a tool for the analysis oftranscription regulatory associations in Saccharomyces cerevisiae. NucleicAcids Research 2006, 34:D446-D451.
29. Sharma R, Evans PA, Bhavsar VC: Mapping a Regulatory Network BetweenOrganisms. Proceedings of the Fourth International Conference onComputational Systems Biology 2010, 204-218.
doi:10.1186/1752-0509-5-S1-S4Cite this article as: Sharma et al.: Regulatory link mapping betweenorganisms. BMC Systems Biology 2011 5(Suppl 1):S4.
Sharma et al. BMC Systems Biology 2011, 5(Suppl 1):S4http://www.biomedcentral.com/1752-0509/5/S1/S4
Page 12 of 12