Embed Size (px)
Citation preview

NREL is a national laboratory of the U.S. Department of Energy, Office of Energy Efficiency and Renewable Energy, operated by the Alliance for Sustainable Energy, LLC.
Regulatory Considerations Associated with the Expanded Adoption of Distributed Solar
Webinar February 20, 2014
Moderator Lori Bird (NREL)
Presenters Joyce McLaren (NREL)
Carl Linvill (RAP)

2
Webinar Logistics
• Participants are joined in listen-only mode.
• Use the Q&A panel to ask questions during the webinar. We will hold all questions until the end of the webinar.
o To ask a question:
– Click Q&A at the top of the Live Meeting Window
– Type your question in the Q&A box
– Click “Ask” to send question
• The webinar is being recorded and a link will be sent to all online participants once it is available.
3
NREL develops renewable energy and energy efficiency technologies and practices, advances related science and engineering, and transfers knowledge and innovations to address the nation's energy and environmental goals.
NREL is the principal research laboratory for the U.S. Department of Energy's (DOE) Office of Energy Efficiency and Renewable Energy (EERE). The laboratory is managed for EERE by the Alliance for Sustainable Energy, LLC.
Photo by Dennis Schroeder, NREL 25933
About NREL
About RAP
The Regulatory Assistance Project (RAP) is a global, non-profit team of experts that focuses on the long-term economic and environmental sustainability of the power and natural gas sectors. RAP has deep expertise in regulatory and market policies that:
Promote economic efficiency Protect the environment Ensure system reliability Allocate system benefits fairly among all consumers
Learn more about RAP at www.raponline.org
Carl Linvill

5
Agenda
Background
• What is the debate?
Utility Business Models
• How can utilities become involved in DG solar?
Costs and Benefits / Valuation
• How to determine the value of DG solar?
Rate Structures
• What rate structures support increased DG solar?

6
Background
What is the debate?
Which states have active discussion? On what topics?

7
Background on the Debate
• Utilities concerned that: o DG reduces utility revenues and
undermines traditional utility business models
o the fixed cost of maintaining the grid is spread across fewer customers and fewer kWh sales
o cost shifts are occurring between solar and non-solar customers
• Solar industry concerned that: o Policy and rate changes will under-
value solar generation and hinder the solar market
Rapid growth in distributed solar has led to increased attention

8
States with Active Discussions
-
Legislative or regulatory activity on net metering or value of solar
9
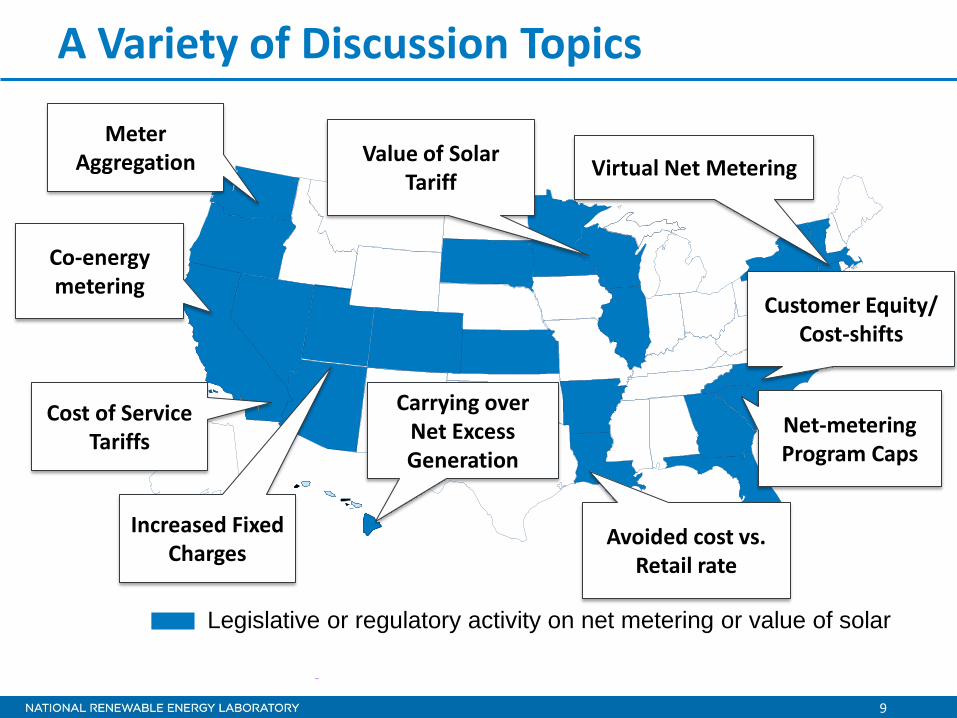
A Variety of Discussion Topics
-
Legislative or regulatory activity on net metering or value of solar
Carrying over Net Excess Generation
Co-energy metering
Net-metering Program Caps
Customer Equity/ Cost-shifts
Avoided cost vs. Retail rate
Value of Solar Tariff
Increased Fixed Charges
Virtual Net Metering
Cost of Service Tariffs
Meter Aggregation

10
A Variety of Discussion Topics • Net-metering
o What should the cap be?
o What method should be used to calculate the installed capacity and the cap?
o At what rate should net excess generation be credited?
o Should excess generation carry over year-to-year or expire at the end of the year?
o How can Time-of-Use rates be combined with net metering?
o Is meter aggregation allowed/required?
o Is Virtual Net Metering allowed/required?
• Cost-shifts / Lost Revenue
o Is there a cost-shift from solar to non-solar customers? How large? How to address?
o What is the impact of distributed PV on utility revenues?
o Should fixed charges be increased to cover infrastructure costs? Should they apply to only self-generators or to all customers, with corresponding reduction in volumetric rates?
o What other rate structures can address the cost-shift and lost revenue issue?
• Value of Solar Tariff
o What variables should be included in a value of solar tariff?
o What value should each cost and benefit be assigned?
o How should a value of solar program be designed?

11
Business Models for Distributed Solar
What are the most common solar business models today?
How can utilities become more involved in distributed solar?

12
Business Models for Distributed Solar
Common Business Models • Customer-owned model
• 3rd party leasing model
• Community and utility-led solar gardens
*See the full report for more description of each of these business model options.
Innovative Business Models • Utility-owned DG solar
• Virtual power plant operator
• Utility partnership/investment in 3rd party leasing companies
• Value added consulting services
• Energy services utility model New utility business models may address utility concerns about lost revenues/cost-shifts.

13
Community Solar / Solar Gardens
Customers pay an upfront fee or fixed monthly payment, which entitles them to a portion of the benefits of a specific solar project.
Variety of Leadership Options
Solar gardens are being initiated by community organizations, municipalities, and utilities across the country.
Variety of Location Options
Solar gardens can be built on brown-fields, public building rooftops, and on private or public land.

14
Benefits to Customers
• Expanded opportunities to
participate in solar
• Increased rate stability
• Potential for bill savings
• Hedge against price increases
Benefits to
Utility/Developer
• Customer satisfaction
• Customer engagement
• Regional economic development
• Lower incentive costs
• Meet RPS requirements
• Potential for distribution system benefits
Community Solar / Solar Gardens

15
Existing Community Solar Projects
Utility-led Community-led
Tucson Electric (AZ) City of Portland “Solar
Forward” (OR)
Xcel Energy (CO) Falmouth Community
Solar, LLC (MA)
Delmarva Power & Light (DE)
Northern Sun Community Solar
Garden (MN)
Green Mountain Power (VT)
Acorn Energy Solar One, LLC (VT)
SMUD Solar Shares (CA)
University Park Solar (D.C.)
Berea Solar Farm (KY) Putney Community
Solar Array (VT)
Florida Keys Electric Co-op (FL)
Winthrop Community Solar (WA)
http://www.sharedrenewables.org/

16
Community Solar Program Design Considerations
Ownership Structure • Privately-owned, Utility-owned, Third-Party Owned, Flip Structure
Subscription Options • Capacity-based – customers purchase the benefits of a certain amount
of capacity (panels) • Generation-based – customers purchase a certain number of kWh or a %
of the system’s generation
Treatment of RECs • Customer-retains, Utility-retains • Are they retired?
Securities Compliance • Does the chosen program structure trigger securities issues?
Eligibility for Incentives • How can incentives be maximized? • Are incentives considered taxable income?
Pricing and Billing

17
NREL is developing a computer model to help utilities understand the economics of Community Solar programs
and consider different program designs.

18
Community Solar: Regulatory Considerations
Securities Compliance • Does the chosen program structure trigger securities issues? Net Metering Policy • Does the state have net-metering? • Does the net metering policy limit the benefits to a single
customer? • Does the net-metering policy require the solar systems to be on
the customer’s property? (e.g. Is virtual net metering allowed?)
Required Community Solar • Should utilities be required to offer community solar?
(e.g. Colorado Community Solar Gardens Act, HB10-1342)

19
Community Solar: Resources
http://www.irecusa.org/wp-
content/uploads/Community-Shared-
Solar-Handout-final-010913.pdf
http://www.solarelectricpower.org/media/71959/solarops-community-solar-
handbook.pdf
http://www.nrel.gov/docs/fy11osti/4
9930.pdf
http://www.mass.gov/eea/docs/doer/renewables/solar/community-shared-solar-implementation-guidelines-with-contracts-032913.pdf

20
• The role of the utility shifts to the management of the distribution system.
• The utility aggregates generation from many distributed units on its system, using demand-side management and smart grid technologies to help balance load and relieve congestion.
• The utility may or may not continue to participate in electricity generation, and may encourage distributed generation at beneficial locations on the system.
Utility-owned
DG Solar
Virtual Power Plant Operator
• Utility owns and maintains DG solar systems
• Utility pays rent to building owners
• Utility earns rate of return on investments
• Utility earns revenue from sale of electricity from systems
• DG systems become another supply-side resource in the utility portfolio
Utility Ownership/Management of DG Solar

21
Regulators can: • Allow IOUs to recover costs of
investment in DG • Encourage IOUs to include
distributed solar in capacity expansion plans
Utilities gain: • Increased customer participation • Experience with DG • Ability to target locations where DG
can support the grid
Regulators can: • Allow IOUs to recover costs of
investments in smart grid and other technologies that support high penetration of DG
• Restructure rates to allow utilities to gain revenue from the provision of system management
Utilities gain: • Clearly defined role into future • Clear revenue stream
Utility Ownership/Management of DG Solar
Utility-owned
DG Solar
Virtual Power Plant Operator

22
Duke Energy installed DG solar on offices, warehouses, schools and manufacturing facilities in North Carolina. Duke owns the systems and pays landowners annual rental fee.
Examples
Arizona Public Service is conducting the Flagstaff Community Power Project. APS installed and owns DG solar on homes and schools to create a high DG scenario. Utility is testing smart grid technologies and learning how to maximize system performance.
Utility-owned
DG Solar
Virtual Power Plant Operator

23
Utility investment in 3rd Party Leasing
Value Added
Consulting Services
Models requiring utility subsidiaries
• Utilities provide customers with comprehensive energy consulting and services, including:
Energy efficiency
Distributed generation
Demand-side management
Connection with vendors
Coordination/site-management
On-bill financing
Energy education
• Utility invests in 3rd party solar leasing companies
• Utility provides customer connections and name recognition
• Utility owns assets and recovers investment costs and rate of return
• 3rd party provider compensated for development and maintenance
• Utility includes the DG as a supply in resource planning
Example: PG&E has tax equity financing agreements with Solar City and Sun Run.

24
• Which business models are best suited for our State’s circumstances (solar resource, market, expected level of DG)?
• Which business models best ensure recovery of system costs and equitability among ratepayers?
• What regulatory changes are needed to facilitate new utility business models?
Business Model Questions for Regulators

25
The Regulatory Assistance Project 50 State Street, Suite 3 Montpelier, VT 05602
Phone: 802-223-8199 www.raponline.org
Presented by: Carl Linvill
February 20, 2014
Regulatory Considerations Associated with the Expanded Adoption of Distributed Solar
Valuation and Rate Structures

Valuation Perspectives and Components
• Long tradition of thinking about “value” from different perspectives
• Whose costs/avoided costs/benefits?
– PV Customer
– Non-participating Customers
– Utility/System
– Society
• Analysts use different components, even for a given perspective
26

Five Different Valuation Perspectives
Perspective What Constitutes “Value”
PV Customer (PCT) Will the PV customer’s costs change?
Other Customers (RIM) Will utility rates change?
Utility (UCT or PACT) Will the utility’s costs (revenue requirement) change?
Total Resources (TRC) Will the sum of utility costs and PV customer costs change?
Society (SCT) Will total costs to society change?
27

States Using Each Test for Energy Efficiency Programs
28
Perspective States Using
Test States Using as PRIMARY Test
PCT 53% ---
RIM 51% 2%
UCT/PACT 65% 12%
TRC 84% 71%
SCT 40% 15%
Source: American Council for an Energy-Efficient Economy (2012)

Major Categories of Value
Benefits
Energy
Line loss savings
Generation capacity
T&D capacity
Fuel price hedge
Risk reduction
Environmental
Grid security & reliability
Costs
Direct
Administrative
Interconnection
Integration
Risk/opportunity cost
29
Terminology differs from study
to study

Value of Solar Studies Differ by Perspective and Advocacy Point of View
• Two different questions to consider in parsing a study:
– What valuation perspective is being analyzed and what components are appropriate given that perspective?
– What advocacy point of view is being presented and how does the advocacy point of view affect which components are included?
30

Common Utility Advocate View
31

Common DG Advocacy View
32

RMI Survey Of Multiple VOS Studies (apples & oranges average: $0.1672/kWh)
33

Valuation Resources
• RAP, Full Value of Energy Efficiency, Lazar & Colburn (September 2013) – http://www.raponline.org/document/download/id/6739
• Rocky Mountain Institute (RMI), A Review of Solar PV Benefit & Cost Studies, 2nd Edition (September 2013) – http://www.rmi.org/Knowledge-Center/Library/2013-13_eLab - DER
Benefit Cost Deck_2nd Edition_130903
• Interstate Renewable Energy Council (IREC), A Regulator’s Guidebook: Calculating the Benefits and Costs of Distributed Solar Generation (October 2013) – http://www.irecusa.org/wp-
content/uploads/2013/10/IREC_Rabago_Regulators-Guidebook-to-Assessing-Benefits-and-Costs-of-DSG.pdf
34

Rate Design
35

Typical Residential Rate Structures
Monthly Bill =
Fixed service charge (e.g. $6.75/month)
+
Volumetric charges (e.g., 8.000 cents/kWh)*
*NOTE: Volumetric charges may vary by time of day or season
36

Almost All PV Systems are Net Metered
99%
1%
Net Metering Tariff
Other Tariff or PPA
37
Source: Solar Electric Power Association (2012)

Why is Net Metering the Dominant Tariff?
• Simplicity: possible with single meter and adaptable to many circumstances
• PURPA:
– Utility obligation to purchase/serve
– Federal ratemaking standard
• State laws/PUC rules or orders
• Usually best option for PV customer:
– Compensation at retail, not wholesale, rate
38

Net Metering Issues under Typical Residential Rate Structures
• PV customer derives value from grid connection, and utility derives value from PV generation
• Most of the utility’s fixed costs & profits for building/operating the grid are recovered through volumetric charges
• Is system value of PV generation greater than or less than volumetric charges?
39
Potential Cross-Subsidies
• If value of PV < volumetric charges:
– Other customers subsidize PV customers
– Under-recovery of utility’s fixed costs
– Upward pressure on rates (cross subsidy)
– Reduced utility shareholder returns
• If value of PV > volumetric charges:
– PV customers subsidize other customers
– Suppresses PV deployment
40

Are potential cross-subsidies a significant problem?
41
• Some level of cross-subsidy is normal
– Customer classes, not individual rates
– Undue discrimination is bad
• At low penetration levels, these lost revenues are extremely small compared to the revenue requirement
• But as deployment grows, at some point this could become a problem

Beware of extrapolating from non-representative situations …
• Tail block rates are far in excess of long run marginal cost are not normal
• Low fixed and demand charges for PV adopters combined with very high tail block rates drives the high subsidy results reported in a few places
42

Tail Block Rates Vary (E3, 2013)
43

Tail blocks and value vary (E3, 2013)
44
0
5
10
15
20
25
30
35
40
2012Top Tier
2020Top Tier
2012Top Tier
2020 TOU
2012Top Tier
2020Top Tier
2012Top Tier
2020Top Tier
2012Top Tier
2020Top Tier
APS PGE SDG&E Xcel
Cen
ts p
er k
Wh
Rate PV LCOE estimate
Assumed PV Capacity Factors: 23% 15% 22% 17%

Possible Alternative or Supplemental Tariff Policies
45
• Fixed charges
• Demand charges
• Minimum monthly bills
• Time-based rates
• Stand-by rates
• Two-way rates (i.e., value of solar)
• Separate PV customer class

Illustration of Alternative Rate Designs
46
Each alternative produces $150/month from a customer using 1,000 kWh/month
Type of Charge Unit / Usage
Typical Current
Residential
Tariff
Option 1
Fixed
Monthly
Charge
Option 2:
Demand
Charge
Option 3:
Bidirectional
Distribution
Charge
Monthly Fixed Charge: $/Month 5.00$ 35.00$ 5.00$ 5.00$
Demand Charge $/kW/Month -$ 3.00$ -$
Distribution Charge $/kWh -$ -$ 0.03$
Off-Peak Energy $/kWh 0.145$ 0.08$ 0.08$ 0.08$
On-Peak Energy $/kWh 0.145$ 0.15$ 0.15$ 0.15$
Average Customer Bill
Fixed Charge Per Customer 5.00$ 35.00$ 5.00$ 5.00$
Demand Charge 10 kW Demand -$ -$ 30.00$ -$
Distribution Charge 1,000 kwh total energy -$ -$ -$ 30.00$
Off-Peak Energy 500 kWh on-peak 72.50$ 40.00$ 40.00$ 40.00$
On-Peak Energy 500 kWh off-peak 72.50$ 75.00$ 75.00$ 75.00$
150.00$ 150.00$ 150.00$ 150.00$

Breakdown of Hypothetical PV Customer Bill
47
Assumptions: 10 kW maximum demand; 1,000 kWh total consumption, 50% on-peak; 1,000 kWh total on-site production. 500 kWh imported from grid off-peak;
500 kwh exported to grid on-peak
Rate Element
Typical Current
Residential
Tariff
Option 1
Fixed
Monthly
Charge
Option 2:
Demand
Charge
Option 3:
Bidirectional
Distribution
Charge
Fixed Charge 5.00$ 35.00$ 5.00$ 5.00$
Demand Charge -$ -$ 30.00$ -$
Distribution Charge -$ -$ -$ 30.00$
Off-Peak Energy 72.50$ 40.00$ 40.00$ 40.00$
On-Peak Energy (72.50)$ (75.00)$ (75.00)$ (75.00)$
Total Bill: 5.00$
Total Distribution Service: 5.00$ 35.00$ 35.00$ 35.00$
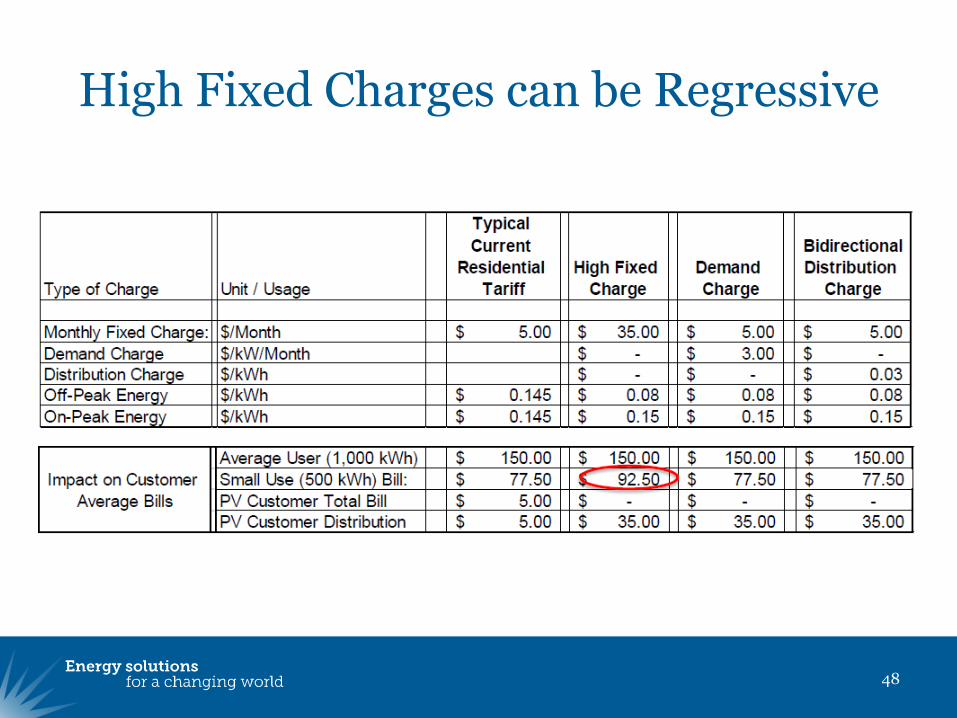
High Fixed Charges can be Regressive
48

Possible Guiding Principles for Fair PV Tariffs
• PV customer should pay utility fair value for services provided by grid connection
• Utility should pay PV customer fair value for services provided by PV
• Rate design should be no more complicated than necessary
• Address any desired incentives and the impact of lost revenues separately
• Account for low income customer impacts
49

Valuation and Rate Design Questions for Regulators
50

Valuation Questions
• What is the current and expected level of PV adoption?
• What investment will be required with and without higher PV adoption?
• Are utilities positioned to measure and capture locational benefits?
• What perspectives will be evaluated?
• What sources of cost and benefit will be included in each?
51

Residential Rate Design Questions
• What is the direction of the subsidy in the current DG tariff under the current residential rate design?
• What is the direction for community solar/solar garden designs?
• Should the residential tariff rate design change?
• Should the DG tariff structure change?
52

Non-residential Rate Design Questions
• What is the direction of the subsidy in the non-residential DG tariffs and rate designs?
• Should the non-residential tariff rate design change?
• Should the non-residential DG tariff structure change?
53

Regulatory Considerations Associated with the Expanded Adoption of Distributed Solar
http://www.nrel.gov/docs/fy14osti/60613.pdf
QUESTIONS?


![34-Standards and Regulatory Considerations[693-714]](https://img.pdfslide.us/doc/110x75/55cf8aac55034654898cdb69/34-standards-and-regulatory-considerations693-714.jpg)