Embed Size (px)
Citation preview

Module 9
Regulatory and policy optionsto encourage developmentof renewable energy
sustainable energy regulation and policymaking for africa


MODULE 9: RENEWABLE ENERGY: REGULATORY AND POLICY OPTIONS
page iii
CONTENTS
1. MODULE OBJECTIVES 9.1
1.1. Module overview 9.11.2. Module aims 9.11.3. Module learning outcomes 9.1
2. INTRODUCTION 9.3
3. WHY SUPPORT RENEWABLE ENERGY? 9.5
4. DESIGN ISSUES FOR REGULATORY/SUPPORT MECHANISMS 9.7
5. TYPES OF REGULATORY AND POLICY SUPPORT MECHANISMS 9.9
5.1. Short-term regulatory/support mechanisms 9.95.2. Medium to long-term regulatory/support mechanisms 9.135.3. Regulatory and policy support mechanisms in practice 9.19
6. EXAMPLES OF REGULATORY AND POLICY SUPPORT MECHANISMSIN AFRICA AND OTHER DEVELOPING COUNTRIES 9.21
6.1. Mauritius: standard feed-in prices for bagasse-basedcogeneration 9.21
6.2. Kenya: explicit target for share of renewables—case ofgeothermal energy 9.23
6.3. South-east Asia: standard PPAs for small hydropowerdevelopment 9.24
6.4. Photovoltaic energy service companies in Zambia 9.26
7. CONCLUSION 9.33
LEARNING RESOURCES 9.35
Key points covered 9.35Answers to review questions 9.35Exercise 9.37Presentation/suggested discussion topics 9.37Relevant case studies 9.37
REFERENCES 9.39
INTERNET RESOURCES 9.39

GLOSSARY/DEFINITION OF KEY CONCEPTS 9.41
ANNEX I. Methodology and examples on how to calculate thelevel of feed-in tarriffs 9.45
Methodology 9.45Examples 9.47
ANNEX II. Structure of the electricity price 9.53
Generation costs 9.53Transmission and distribution costs 9.53Taxes and levies 9.53Profit and return on equity for investors 9.54
CASE STUDY 1. German feed-in mechanisms 9.55
CASE STUDY 2. Spain: support mechanisms for wind energy 9.63
CASE STUDY 3. Denmark: support mechanisms for wind energy 9.71
CASE STUDY 4. Renewable energy in Ghana 9.81
CASE STUDY 5. Zambia: institutional framework and status ofrenewable energy 9.105
CASE STUDY 6. United Kingdom renewables obligation 9.125
PowerPoint presentation: RENEWABLE ENERGY – Module 9:Regulatory measures and policy options to encouragedevelopment of renewable energy 9.135
SUSTAINABLE ENERGY REGULATION AND POLICYMAKING TRAINING MANUAL
page iv

1. MODULE OBJECTIVES
1.1. Module overview
Why support renewable energy? There are many answers to this question. Renewableenergy can aid security of supply. Small-scale renewable energy projects can con-tribute to a government’s social agenda, for example by increasing access to elec-tricity. On a broader social and political level, the development of a renewable energyindustry can create jobs and enhance technical expertise. Renewables can alsodeliver additional local, regional and global environmental benefits.
This module examines types of regulatory/support mechanisms for renewableenergy and the design issues that are involved in these mechanisms. The mod-ule will also give examples of the mechanisms in practice and provide informa-tion on the pros and cons of each system. Most mechanisms of this type haveonly been functioning for a short while with very limited application in Africa.Consequently, conclusions on their success or failure are hard to draw.Sometimes the best solution is to use a combination of mechanisms to supportrenewable energy development in a country.
1.2. Module aims
This module has the following aims:
� To provide an overview of the different advantages that a clear renewableenergy policy can provide, and its possible interaction with other policies;
� To explain what the key building blocks are when designing a regula-tory/support mechanism;
� To give an overview of the different possible approaches;
� To show how these have been implemented in different African countries.
1.3. Module learning outcomes
This module attempts to achieve the following learning outcomes:
� To be able to explain that a renewable energy policy can provide advantagesand support a range of environmental and other policies;
� To understand which design elements are key to the success of the regula-tory/support mechanism;
MODULE 9: RENEWABLE ENERGY: REGULATORY AND POLICY OPTIONS
page 9.1

� To understand different approaches to designing a regulatory/supportmechanism;
� To be able to argue which regulatory or policy approach suits best, given thenational or regional situation
SUSTAINABLE ENERGY REGULATION AND POLICYMAKING TRAINING MANUAL
page 9.2

2. INTRODUCTION
This module gives an overview of the most common regulatory and policy sup-port mechanisms for promoting the deployment of sustainable energy technolo-gies and encouraging increased capacity and output.
The mechanisms described in this module are usually applied where there is atleast some degree of liberalization in the energy system (e.g. even if the majorenergy company is still a state-owned monopoly, other generators are allowed toenter the market): in non-liberalized systems, new technologies can be adoptedby state-owned generators in response to government demands, rather thanthrough the use of specific regulatory/support mechanisms to drive their uptake.
The mechanisms discussed can be divided into two categories, as follows:
1. Regulatory/support options that are immediately applicable to many sub-Saharan African countries1:
� Establishing “standard” power purchase agreements (PPAs);
� Ensuring long-term electricity generation licences and PPAs;
� Developing a favourable tariff setting and adjustment formula;
� “Light-handed” regulation;
� Setting explicit targets for the share of renewables in the electricity gen-eration mix;
� Enacting explicit regulations that encourage local private participation inrenewable energy development;
� Providing subsidies to renewable energy-based power systems especiallythose located in rural areas (e.g. accessing existing rural electrification funds).
2. Other regulatory/support mechanisms implemented in developed countriesthat may be applicable to sub-Saharan African countries in the future:
� Feed-in tariffs (such as those in Germany and Denmark);
� Quota mechanisms (such as the renewable obligation in the UK and var-ious other countries);
� Tender schemes (Ireland);
� Voluntary mechanisms such as green certificates (Netherlands);
� Various hybrid schemes involving two of the above mechanisms (Spain).
MODULE 9: RENEWABLE ENERGY: REGULATORY AND POLICY OPTIONS
page 9.3
1Because of its advanced industrial/technological status and strong internal economy backed by asophisticated legal and regulatory regime, South Africa is an exception in sub-Saharan Africa as itcan often successfully adopt regulatory/support mechanisms that are deployed in developedeconomies.

The main focus is on mechanisms used in electricity systems, as this is wherethe use of such mechanisms is currently most common. They can be used to drivecapacity increases for electricity from renewable energy sources and combinedheat and power (CHP), although in practice most schemes to date have beenrestricted to renewable energies. They could also be used to encourage the pro-duction of heat from renewable energy and CHP, although again to date, the focushas been on electricity. Finally, in theory the mechanisms could also be used todrive the adoption of sustainable energy technologies in other energy areas, forexample the use of a quota obligation to promote renewable fuels in transport,or the provision of heat.
Although different examples of each mechanism have characteristics in common,it should be emphasized that no two schemes are identical. Differences arisebecause of different markets, energy systems and political intentions in differentcountries. The descriptions concentrate on the general characteristics of themechanisms, rather than on specific details of how they are implemented in dif-ferent countries (some of these country specific details are covered in the casestudies).
In addition, each type of mechanism has different strengths and weaknesses,and will tend to encourage the development of sustainable technologies in a par-ticular way. The extent to which weaknesses become serious defects depends toa great extent on the interaction between the mechanism and other policy efforts.These include for example, R&D support, capital grants, production tax creditsand soft loans, as well as broader measures such as changes to planningregimes. Therefore where appropriate, the importance of other supportive mech-anisms is also highlighted.
Many sustainable energy regulatory/support mechanisms—especially those dis-cussed here—are relatively new policy and regulatory areas, so the evidence ontheir performance is not yet definitive. This is particular of sub-Saharan Africawhere many of the regulatory options widely deployed in industrialized countriesare yet to be tried. The purpose here is not to argue that a specific mechanismis the most effective model for any given country, or that the weaknesses demon-strated in the design of some support mechanisms in some countries mean thatthe actual mechanism is not a viable way of promoting the development of sus-tainable energy. Instead, the purpose is to give a broad overview of the differentmain mechanisms, and highlight some of the more significant generic strengthsand weaknesses. The accompanying case studies enable specific issues to befollowed up in more detail.
SUSTAINABLE ENERGY REGULATION AND POLICYMAKING TRAINING MANUAL
page 9.4

3. WHY SUPPORT RENEWABLE ENERGY?
The adoption of sustainable energy policies can bring advantages to both a coun-try and an energy system:
� Renewable projects in particular can aid security of supply—both by reducing theneed for imported fuels, and by increasing the diversity of a national generatingportfolio—a key benefit to many sub-Saharan countries that are dependant onlarge-scale hydropower and thus exposed to drought-related energy risks.
� Small-scale sustainable projects—CHP or renewable—can contribute to a gov-ernment’s social agenda, for example by reducing fuel poverty, or by increas-ing access to electricity.
� Distributed generation (renewable electricity and CHP not connected to longdistance transmission networks) offers benefits in terms of reduced lossesover transmission wires and, in countries without major distribution and trans-mission networks, the possibility of avoiding the costs of building such infra-structure. This can increase the economic efficiency of systems, although thisbenefit is not always reflected in the prices offered for sustainable energy.
� On a broader social and political level, the development of a sustainableenergy industry can create jobs and enhance technical expertise. Building aviable domestic energy supply chain can also offer export opportunities in arapidly expanding international market.
� Renewable energy deployment can deliver additional local, regional and globalenvironmental benefits.
However, many renewable energy technologies are relatively new, and still devel-oping. Although costs of some technologies (especially wind) have fallen dramat-ically, they still need financial support to compete with established, conventionalgeneration in most situations.
This problem is exacerbated by the fact that there is not a “level playing field”in the treatment of conventional and renewable energy technologies. Thisinequality notably includes the failure to take account of the costs of risks (higheroil prices and drought-related hydropower crises) associated with conventionalgenerating technologies when costing generation. Conventional generators ben-efit from the failure to take these risks into account.
In addition, the different operating characteristics of some renewable energytechnologies—for example, the intermittency of wind or some CHP projects—meanthat they can conflict with the operating characteristics of established systems,which are designed for constant, predictable output from large-scale, centralizedgenerating plants. The differences can, for example, lead to increased operating
MODULE 9: RENEWABLE ENERGY: REGULATORY AND POLICY OPTIONS
page 9.5

costs for distributors. Distributors may reflect these increased operating costs inthe power purchase agreements (PPAs) they sign with generators, possibly at alevel, which is in excess of the real system costs of intermittency. This effectivelycreates penalties for producing intermittent power.
Many of the issues ultimately relate to financial risks to investors: the financialrisks of building and operating new, relatively untested technologies in liberal-ized systems mean that investors may be wary of financing new projects wherethe return on their investments is uncertain. They will be unwilling to put moneyinto potentially risky renewable energy projects, if they have other less riskyinvestment opportunities. The key question for evaluating the different mecha-nisms for supporting renewable energy technologies is therefore whether or notthey will create sufficient investor confidence to develop projects (see box 1 belowfor perspectives of risks from the private sector).
SUSTAINABLE ENERGY REGULATION AND POLICYMAKING TRAINING MANUAL
page 9.6
Box 1. Private-sector perspective
“The three most important ‘deal breakers’ to private investors have been found to be:
� Insufficient legal protection and framework for protection of investor rights.
� Lack of payment discipline and enforcement.
� Too few guarantees from governments or multilateral institutions.”
Regulation in Africa – Investors and Operators Regulatory Concerns, Mr. T. Horvei, ChiefExecutive , SAD-ELEC (Pty) South Africa, Report of the Proceedings of the 2nd AnnualConference of the African Forum of Regulators (AFUR), March 2005
Key regulatory risks experienced by investors
� Weak and ever-changing regulatory frameworks.
� Right of government to override regulatory decisions.
� Lack of clarity about power of regulator.
� Regulator without necessary minimum skills, capacity and competence.
� Unilateral regulatory decisions undermining project and investment returns.
� Playing field tilted in favour of dominant industry player (most often a state-owned enterprise).
(Extract from the AFUR discussion paper “Infrastructure Investment and Regulation inAfrica – Investors and Operators’ Regulatory Concerns” presented at the AFUR 2ndannual conference)

4. DESIGN ISSUES FOR REGULATORY/SUPPORT MECHANISMS
As well as the need to encourage investor confidence, there are also other impor-tant factors for policymakers and regulators to take into account when evaluat-ing different regulatory/support mechanisms. Some of these are summarizedbelow:
� Will the scheme be effective in reducing investment risks to enable the deploy-ment of renewable energy technologies, while encouraging investors? This isa fundamental requirement, although the advantages given to renewable tech-nologies should not be disproportionately costly to consumers or taxpayers.
� Will these costs be spread fairly across business, individual consumers andgovernment?
� Whether the mechanism is an effective means of meeting any target set forrenewable energy generation.
� Whether the mechanism will encourage new renewable energy plants, orwhether it just encourages the installation of new capacity.
� How will the mechanism interact with other energy policy measures such asR&D programmes or investment support schemes (in the few African countrieswhere such programmes/schemes exist)?
� Will the mechanism encourage reducing prices for new technologies over time,through reducing or compensating for market failures or through technologi-cal development?
� Will it be sufficiently flexible to take technological developments and redu-cing costs into account in the future, so avoiding the potential for developersto make windfall profits?
� Will it offer the potential for commercial or technical opportunities, for example,the development of a domestic manufacturing industry?
� Whether it will encourage a range of renewable energy technologies, orwhether it will concentrate only on one.
� Whether it will encourage new entry into electricity generation.
� Whether the scheme will be transparent for all users.
� Whether it will allow exports/imports of power.
The weight given to these design issues will obviously depend on the prioritiesand intentions of individual governments, and the final choice of mechanism willhave to take them all into account. For example, if costs to consumers are a cen-tral concern, policymakers may want to implement a competitive mechanism suchas the quota system. On the other hand, if achieving specific levels of output are
MODULE 9: RENEWABLE ENERGY: REGULATORY AND POLICY OPTIONS
page 9.7

a key driver, then less competition-focused mechanisms such as feed-in tariffsmay be more appropriate.
In order for the scheme to be effective, those involved will also need a goodunderstanding of the characteristics of renewable energy generation technolo-gies, the workings of the broader electricity system, and broader issues such asthe potential for innovation or declining technology costs.
SUSTAINABLE ENERGY REGULATION AND POLICYMAKING TRAINING MANUAL
page 9.8

5. TYPES OF REGULATORY AND POLICYSUPPORT MECHANISMS
This section gives a brief overview of the different characteristics of some of themain regulatory and policy support mechanisms. This is a generalized overviewand it should be borne in mind that in reality the detail of different schemes canvary considerably. It should be read together with the more detailed descriptionsof individual programmes, which are given in the case studies. The types of reg-ulatory/support mechanisms are categorized into two: firstly, mechanisms thatare immediately applicable to sub-Saharan African countries; and secondly, othermechanisms implemented in the developed world that may be applicable to theAfrican region in the future.
5.1. Short-term regulatory/support mechanisms
The mechanisms discussed under this section are those that have either beenimplemented in some African countries or in other developing countries. Thesemechanisms to a large extent are relatively straightforward for African regulatoryagencies to implement and may not need significant changes to the Electricity Act.
These include:
� Establishing “standard” power purchase agreements (PPAs);
� Ensuring long-term electricity generation licences and PPAs;
� Developing a favourable tariff setting and adjustment formula;
� “Light-handed” regulation.
� Setting explicit targets for the share of renewables in the electricity genera-tion mix;
� Enacting explicit regulations that encourage local private participation inrenewable energy development;
� Providing subsidies to renewable energy-based power systems especiallythose located in rural areas (e.g. tapping into rural electrification funds).
Establishing “standard” power purchase agreements (PPAs)
In principle, most sub-Saharan African countries are committed to private sectorsupply of power to the national grid. However, negotiations with the utility topurchase energy from small producers tend to be cumbersome and the tariffoffered unattractive to develop renewable energy projects to their full potential.
MODULE 9: RENEWABLE ENERGY: REGULATORY AND POLICY OPTIONS
page 9.9

This market uncertainty stands in the way of substantial investment in renewableenergy-based electricity generation in the region. In South Asia (Nepal and SriLanka), market uncertainty was overcome by instituting a “standard PPA”—a“standard offer” from the national utility to purchase all energy produced by spe-cific renewable energy-based independent power producers (IPP) at a pre-announced price. This is somewhat akin to the feed-in tariff legislationimplemented in developed countries such as Germany. The absence of such a“standard offer” inhibits the scaling up of small renewable energy investmentsin the power sector to their full market potential (UNEP/GEF, 2006).
The lack of clear rules to allow the sale of power produced from sustainableenergy systems discourages investment opportunities in renewable energy-basedelectricity generation. In particular, lack of commitment from the utility to pur-chase excess power produced at an attractive feed-in tariff can often limit therenewable energy project to a size, which is less than optimal in terms of theavailable resources. Similarly, lack of regulatory measures to encourage agro-processing industries to sell excess power to neighbouring rural communitiesresults in sub-optimally sized projects.
Ensuring long-term electricity generation licenses and PPAsfor IPPs
In most sub-Saharan African countries with IPPs, typically, generation licencesare issued for varying periods of 7 to 15 years. This implies that the investorshave a very limited period of time to recoup their costs and make a decent mar-gin. Issuing longer-term electricity generation licences and PPAs to independentpower producers (e.g. 15-30 years) can ensure that the feed-in price of electric-ity charged by the investors of sustainable energy systems is moderated. This isessentially because, longer-term agreements allow for sufficient time for theinvestor to payoff project financing debts as well as providing adequate amorti-zation periods for the equipment.
Developing a favourable tariff setting and adjustment formula
The calculation of the feed-in tariff on the basis of the cost of the fuel can resultin very low feed-in tariffs offered to renewable energy development as the costof renewable fuel is often very low or sometimes free but with higher equipmentcosts. A more favourable tariff setting and adjustment formula is one that takesinto account the “avoided cost” of installing competing thermal power plants. Forexample, in Mauritius, the Government set up a technical committee at theMinistry of Energy to address the issue of energy pricing and power purchaseagreements for bagasse-based cogeneration. In the price setting mechanism, the
SUSTAINABLE ENERGY REGULATION AND POLICYMAKING TRAINING MANUAL
page 9.10

committees worked on the basis of the cost of a 22 MW diesel power plant. Onthis basis, the utility was directed to determine the tariff at the “avoided cost”for the diesel power plant, which in turn became a standard feed-in price for elec-tricity generated by the sugar mills.
“Light-handed” regulation
“Light-handed” regulation refers to the regulatory agency’s deliberate action toeither “ignore” or make less stringent provisions for a player or group of play-ers. In this case, it would entail the regulatory agency explicitly exempting or sig-nificantly reducing the statutory requirements of investors in sustainable energy.For example, the regulatory agency may waive the need for licensing small tomedium scale renewable energy investments below a certain threshold (in thecase of Nepal, initially the threshold was 100 kW capacity but was eventuallyincreased to 1 MW ).
Setting targets2 for the share of renewables in the electricitygeneration mix
To mitigate the negative trend of having an excessively large share of IPPs gen-erating electricity from fossil fuel-based power plants or large-scale hydro plants(that can be prone to drought-related risks), the regulatory agencies in collabo-ration with the Ministries of Energy can set explicit targets for the share of elec-tricity generation from proven renewable energy technologies such as hydro,wind, solar PV, biomass-based cogeneration and geothermal. Kenya provides amodel example where such targets have been set. The Government of Kenya hasset a target of 25 per cent of electricity generation to come from geothermalenergy by the year 2020. Consequently, an IPP is actively exploiting this resourceas part of a broad investment effort aimed at meeting the year 2020 target.
Enacting explicit regulations that encourage local privateparticipation in renewable energy development
The examples of Kenya, Mauritius and Zimbabwe demonstrate the potential finan-cial and technical capability and viability of local private investors in the powersector. This is corroborated by findings from recent AFREPREN/FWD studies whichindicate that local private investors can own and operate small to medium-scaleentities in the power sector, either on their own or with foreign partners (see
MODULE 9: RENEWABLE ENERGY: REGULATORY AND POLICY OPTIONS
page 9.11
2Targets should not be confused with “quotas” which are discussed separately. “Targets” are usu-ally set at the policy level, while “quotas” are often backed up by legislation and might imply cer-tain consequences befalling a specified party for failure to meet the “quotas” or exceeding them.

Marandu and Kayo, 2004). Appropriate policy and financial incentives such asenactment of lower entry requirements, tax holidays and lighter regulation of ini-tial public offers (IPOs) can encourage local private investment in a privatizedelectricity industry. The ideal entry point, as in the case of Zimbabwe and Mauritius,is likely to be in renewable energy systems such as small hydro and wind energysources as well as through local cogeneration in agro-based industries.
Providing subsidies to renewable energy-based power systems
Although developing renewable energy-based power systems in rural areas canregister poor returns on investment, linking decentralized renewable energypower plants to rural electrification provides local benefits and increases the sus-tainability of such projects. However, adding the rural electrification componentincreases capital costs and also lowers the overall load factor of the power plantby increasing demand during peak hours and using small amounts of power dur-ing the rest of the day. In order to provide a reasonable return on investment,the capital cost of rural electrification needs to be covered in part or fully by sub-sidies in the form of grants by the government sourced from rural electrificationfunds or from donors.
A number of governments (primarily Uganda but also Kenya and Tanzania) in theregion have put in place grants for private companies that expand rural electri-fication services, particularly those using renewables for electricity generation.The Ugandan government under its Energy for Rural Transformation (ERT)Programme will pay the additional cost accrued to the private power developerfor providing rural electrification. One example of this is the West Nile RuralElectrification Company, which in April 2003 was awarded the concession of theWest Nile region. This company is investing in a 3.5 MW small hydro project withpartial grant support from the ERT. Three other energy service companies (ESCOs)in Uganda are investing in new generation capacity on similar terms.
SUSTAINABLE ENERGY REGULATION AND POLICYMAKING TRAINING MANUAL
page 9.12
Review question
1. Name at least five regulatory/support mechanisms that can encouragerenewable energy development in the African power sector in the short term.

5.2. Medium to long-term regulatory/supportmechanisms
These support mechanisms are largely implemented in the developed world.Some of them require sophisticated implementation strategies and, in somecases, enactment of new laws or significant changes to the Electricity Act. Asmentioned earlier, with the exception of South Africa and possibly Mauritius, fewsub-Saharan African (SSA) countries have implemented these regulatory/supportoptions. In many SSA countries, the sophisticated regulatory and legal prerequi-sites that are required are yet to be put in place.
Feed-in tariffs
Feed-in tariffs offer either a minimum guaranteed price for output or a premiumon the market price for output. In either case, electricity utilities are obliged toallow generators to connect to the grid, and to buy all of a project’s output at apre-defined price.
Key features:
� The scheme can be open-ended, or can be put in place for a specified num-ber of years.
� The tariff schemes can be banded for different technologies, with less devel-oped technologies receiving higher prices for their output.
� The level of the tariff can be set by assessing several factors such as:
The avoided cost to the utility of building its own new plant;
The end price to the consumer;
A more explicit political decision about the level of tariff necessary to stim-ulate renewable deployment.
� The costs of the tariff can be covered by a levy per kWh on consumers, or ontaxpayers, or both.
� Tariff levels can be set to decline over the years, reflecting the potential fordeclining technology costs.
The level of the tariff tends to be set for several years at a time, often throughlegislation, meaning that there is a high degree of certainty for investors on thereturns available, and a high level of confidence about the duration of thescheme. Schemes offering a minimum guaranteed price tend to provide more cer-tainty for investors than those which offer a premium on the market price, thisbeing due to the higher degree of predictability that this affords.
MODULE 9: RENEWABLE ENERGY: REGULATORY AND POLICY OPTIONS
page 9.13

The level of deployment of technologies is not set in advance, but instead isdriven by the level of the premium in the tariff price. In other words, the govern-ment sets the price for the output from renewable energy generators, but lets themarket determine the level of output. This in turn means that the total costs ofthe scheme are not known in advance because the costs will depend on the suc-cess of the mechanism in driving new capacity. Having said that, it would be pos-sible to make sensible predictions about the amount of new capacity likely to bestimulated and hence the costs, based on the prices set in the tariffs.
Similarly, the length of a scheme can mean that technological developments overthe course of a few years allow participants to make windfall profits in the lastfew years. A degree of flexibility should therefore be designed in to any schemeto ensure that the tariffs are not set unreasonably high, especially in the lateryears of a scheme.
The design of a tariff scheme may have to take into account the availability ofrenewable resources. For example, areas of high wind will obviously prove moreattractive to developers seeking to maximize their returns. This can mean thatnetworks in areas with high wind resources are targeted by developers, whichin turn means that the customers of the network in that area are potentiallysubject to higher prices than network customers in areas with less wind. Thetariff scheme can be designed to minimize this by offering higher prices forwind output in areas with less wind resources, so encouraging developers tosite projects there. Alternatively, in order to distribute the financial impactequally over consumers and to avoid significant differences in price, the levyto finance the feed-in scheme can be equally covered by all the existing net-works (cf. Germany).
As well as the level to which the tariff is set, the success of such schemes candepend on:
� Access charges to the grid—transmission or distribution.
� Any limits set on capacity.
� The ease of siting projects—i.e. getting approvals through planning systems.
Quota mechanisms
Quota mechanisms, also known as renewable portfolio standards (RPS), are anobligation for electricity suppliers to take a certain amount of sustainable power,or for customers to source a proportion of their power from renewable energysources.
SUSTAINABLE ENERGY REGULATION AND POLICYMAKING TRAINING MANUAL
page 9.14

Key features:
� The percentage can increase over time, driving increased deployment.
� Utilities can also choose to pay a penalty rather than buy their allocation ofthe obligation.
� No requirement for utilities to allow priority access to networks.
� The operation of the system is supported by tradable green certificates for theoutput, which certify that the supplier has actually bought renewables-basedpower. These certificates can be sold with the power, or traded separately. Ineither case, the value of the certificate adds value to the actual generation.Green certificate markets are discussed in more detail below.
� Certificates could be banked for use in future compliance periods. This bank-ing period is usually limited (generally five years).
In contrast to tariff systems, the government sets the desired level of output, andallows the market to decide the price that will be paid for it. A quota systemavoids the government selecting which technologies will receive the benefits,instead leaving the technical choices to the market.
The level of incentive for the utilities to comply with the obligation depends onthe level of the penalty payment set—the higher the cost for non-compliance, themore incentive to buy renewables-based power.
The value of renewables-based power can be further enhanced by redistributingany of the money paid as penalties to companies who have met their obligation.Utilities decide how best to meet this obligation, and what projects they will con-tract with if they chose to buy renewables-based power. Not surprisingly, utili-ties will chose to contract with the cheapest forms of generation, so meeting theirobligation in the most cost effective way. This will keep the cost to companiesand consumers down. In addition, there is no requirement for utilities to signlong-term contracts with generators for their output. The short-term nature of themarket can act as a disincentive to investment across the board.
The need to negotiate deals with utilities for their output implies a degree ofexpertise and resources for developers. This may limit new entry into the sys-tem, or at least limit entry to relatively large, well-resourced entities. In addition,new entry by smaller companies may be limited by the investment risks inherentin the mechanism, effectively meaning that only large companies with diverseportfolios are able to participate. Both of these problems can be addressed byensuring the availability of consolidation services to allow smaller developers topool their output, reducing individual participation costs and risks.
If certificates can be banked from one compliance period to the next, careful mon-itoring will be needed to ensure that no gaming takes place, and that there is
MODULE 9: RENEWABLE ENERGY: REGULATORY AND POLICY OPTIONS
page 9.15

not a tendency for the development of renewable energy to enter a “boom andbust” cycle.
Quota mechanisms are relatively new, so there is limited evidence on their per-formance. However, it appears that the emphasis on the market can have twoparticularly significant impacts for generating technologies:
� Only the cheapest forms of generation will receive contracts.
� Less developed—and therefore riskier—technologies will not receive contracts,so limiting their future development and deployment.
If a government wants to support a diverse portfolio of renewable energy technolo-gies, including developing technologies, other support mechanisms (such as cap-ital grants) will be required to compensate for the short-term nature of the market.
SUSTAINABLE ENERGY REGULATION AND POLICYMAKING TRAINING MANUAL
page 9.16
Review question
What are the main differences between a feed-in tariff system and a quotasystem?
Tender schemes
Under a tendering scheme, competitive bids are put forward to government forindividual renewable energy projects, following a call for tenders launched by thegovernment.
Key features:
� Suppliers are obliged to buy a certain amount of renewable power at a pre-mium price.
� Although specific characteristics vary, it is likely that the government will:
Set an overall target for renewables-based generation, adding specified lim-its for individual technologies within that.
Set a specified time for contracts for the generation, during which time theywill receive a premium price.
� The winning contracts are selected by the government, usually on the basisof cost, although in some schemes other factors such as technical quality andsocio-economic aspects also play a role.

� Successful projects can either:
Receive the price they have bid, or
A “strike” price based on an assessment of developers needs.
� Can be banded to encourage the development of newer technologies.
Because there is a guaranteed premium for a set period of time, tender schemescan increase investor confidence in renewable energy projects. This is, of course,highly depended on the length of the contact and the price offered. However, thebureaucracy of the schemes and the government tender processes can act as adisincentive to put projects forward, as this implies significant project develop-ment costs without a guaranteed contract.
In addition, tender schemes tend to be stop/start, with months or even yearsbetween different bidding rounds. This can create a “boom and bust” environ-ment for developers, who may be active for some periods, but without new proj-ects for others. This in turn can discourage the emergence of a domesticrenewable manufacturing industry, as there is no certainty about the frequencyof the periods of “boom”.
Voluntary mechanisms
Green certificates
As well as operating with a quota system, green certificates can be used in vol-untary markets to support renewable-based generation. The certificates can betraded separately from the power and sold to consumers who are willing to paythe additional cost to support sustainable energies. However, in the case of vol-untary markets, the success of the scheme will rely on consumer awareness andwillingness to pay the additional cost. Voluntary schemes pre-suppose a high-level of environmental public awareness—which is virtually absent in most of sub-Saharan Africa.
Because of their voluntary nature, green certificate schemes do not necessarilyprovide confidence to investors to develop new projects. Green certificateschemes therefore rely heavily on the success of other support measures (e.g.grants, soft loans, tax credits) in order to provide this confidence and to keepcosts low enough to make sustainable generation attractive to consumers. Otherstrategies, such as the disclosure of the generating source and green power mar-keting can complement voluntary green certificate markets—these are outlinedbelow.
MODULE 9: RENEWABLE ENERGY: REGULATORY AND POLICY OPTIONS
page 9.17

Disclosure
In addition, green certificates schemes can be supported by policy measures suchas the disclosure of the generation source of electricity on consumers’ bills.Disclosure is based on the assumption that in a competitive market, consumers maychose to buy their power from less environmentally damaging forms of generationrather than solely allowing their choice to be dictated by the price. Disclosurerequirements can include information on the type of generation, the amount of car-bon dioxide emitted per kWh or the amount of radioactive waste produced.
Green power
A related issue is selling “green” power to consumers in markets where con-sumers can chose their supplier. This assumes the presence of a retail compet-itive power market—this has yet to be tried in Africa. This is again based on thepremise that some consumers would include environmental performance in theirchoice of power supplier.
Green power schemes offer a way for suppliers to differentiate their product, andoften to charge a premium for it over market prices for “brown power”. In somemarkets, such as the UK, this has led to a situation where suppliers are obligedto provide a certain proportion of their power from renewable sources under therenewable obligation, but some have chosen to fulfil this obligation by market-ing the green power separately from their standard product and to charge a pre-mium for it. This approach allows them to offset any additional costs ofcontracting for renewable output—or even to profit from the fact that they areobliged to contract for it. Other companies have chosen to contract for greenpower in addition to any renewable obligation they might have.
Voluntary schemes rely on support from other measures to drive a viable mar-ket. Information provided to environmentally conscious consumers could act asa driver, as can the marketing opportunities of supplying green electricity.
Concerns have been raised that green power schemes do not necessarily encour-age new construction, but rather maintain output from older schemes. This canbe avoided by devising schemes, which explicitly state that revenue from ascheme will be used to build new renewable projects.
Various hybrid schemes involving two of the above mechanisms
Some countries—notably Spain and Belgium—have chosen a mixture of supportmechanisms to drive renewable energy development. The strength of this
SUSTAINABLE ENERGY REGULATION AND POLICYMAKING TRAINING MANUAL
page 9.18

approach is that it allows the strengths of individual mechanisms to be adopted,and for the weaknesses to be compensated for by other measures.
The flexibility of hybrid schemes also allows investors to choose which aspect ofthe scheme suits their finances and the type of project best.
5.3. Regulatory and policy support mechanismsin practice
Regulatory/support mechanisms for renewable technologies are relatively newpolicy and regulatory measures, and have often been in place for only a few years.In Africa, the experience with such mechanisms is even more limited. Given thelength of time it can take to develop new projects, evidence of their success orotherwise can therefore only be presented as indicative.
In addition, many of the support mechanisms in place have tended to concen-trate on wind power, as this the most developed renewable technology. Thismeans that other renewable technologies, which may be more appropriate inother countries, may have been neglected by the available support measures.
However, on the basis of the schemes to date, it appears that tariff schemes havebeen more successful than tender and quota schemes at encouraging the deploy-ment of wind power in particular—installed capacity of onshore wind in Denmark,Germany and latterly Spain far outweigh installed capacity in other countries whichhave adopted more of the competitive tender and quota mechanisms (see figure I).
MODULE 9: RENEWABLE ENERGY: REGULATORY AND POLICY OPTIONS
page 9.19
Figure I. Onshore wind cumulative installed capacity (MW)
0
2000
4000
6000
8000
10000
12000
14000
16000
1995 1997 1999 2001 2003
MW
DenmarkGermanyItalyNetherlandsSpainUnited Kingdom

In comparison, countries which have used quota or tender systems show a farlower level of development. This is not entirely unexpected, given the investorcertainty ensured by fixed payment tariffs. However, it should be noted that theremay also be local factors related to the design or wider policy contexts of spe-cific schemes that have contributed to the different rates of development—it maynot just be down to an inherent superiority of one type of mechanism overanother.
So, for example, the ease of getting planning permission for projects or connect-ing projects to networks can directly affect the rate at which renewable energyprojects are implemented. Similarly, the uncertainty created by the possibility offuture changes to schemes can also reduce investor certainty. Some of theseissues are highlighted in the individual case studies.
It is important therefore to remember that the interaction between the mecha-nisms outlined above and other policy measures in place to support renewableenergy will play a vital role in the success of any programme to encourage thedeployment of sustainable energy technologies.
SUSTAINABLE ENERGY REGULATION AND POLICYMAKING TRAINING MANUAL
page 9.20
Review question
Describe in short the main support mechanisms for renewable energy.
Discussion question/exercise
Given the particular situation in your country, which of the described supportmechanisms might prove most useful? Describe the particular situation and givereasons for the support mechanism(s) chosen.
Bear in mind that investor confidence is a crucial aspect, and that you can com-bine aspects from different support mechanisms.

6. EXAMPLES OF REGULATORY AND POLICYSUPPORT MECHANISMS IN AFRICA ANDOTHER DEVELOPING COUNTRIES
6.1. Mauritius: standard feed-in prices for bagasse-based cogeneration
Efforts have consistently been made over the past 40 years in Mauritius to exploitthis bagasse-based cogeneration for energy generation. St. Antoine Sugar Factorybecame the first exporter of electricity to the grid in 1957, when around 0.28 GWhwas sold to the Central Electricity Board (CEB)—the national electricity utility.
In early 1980s, two other bagasse-energy generation projects were implemented.The first one was a sugar factory located at Médine, with an installed capacity of10 MW to supply around 6 MW to the grid. It was designed to generate what istermed as “continuous power” that is, using bagasse as feedstock for combus-tion, during the cane-crushing season only.
The second was in 1982 when another factory—FUEL—commissioned a powerplant with 21.7 MW of installed capacity. This plant exported electricity all year-round, using bagasse as feedstock for combustion during the crop season andcoal during the intercrop season. This arrangement was termed “firm power”.With the successful operation of these two units, the amount of electricity gen-erated from bagasse reached 70 GWh/year.
As the significant potential for cogeneration became apparent, there was a needto have a standard feed-in electricity price to avoid the need for each sugar fac-tory to independently negotiate with CEB. Therefore, the Government set up atechnical committee at the Ministry of Energy to address the issue of energy pric-ing as well as a power purchase agreement (PPA). To develop a price settingmechanism, the Committee worked on the basis of the cost of diesel plant of 22MW capacity—the next planned installation by CEB. Consequently, the Committeedetermined the avoided costs and recommended the kWh price for electricity gen-erated from cogeneration.
For the “continuous” power plants, the price of the electricity was set to aboutUS$ 0.04 and was indexed to the price of oil. These plants have PPAs for 15 yearswith provisions for the supply of a minimum of 16 GWh every crop season, theexport of 45 MW of power to the grid. Other provisions include a power intakeof 3.5 MW daily during off-peak and a bonus/penalty for minimum power sup-ply/default.
MODULE 9: RENEWABLE ENERGY: REGULATORY AND POLICY OPTIONS
page 9.21

The “firm” power plants have slightly longer PPAs of 18 years to supply 180 GWhof energy per year. The minimum from bagasse is 45 GWh. During the crop period,the minimum power is 11 MW as semi-base load and 17 MW for two hours dur-ing evening peak. Power during the off crop season is 13 and 18 MW respectively.The kWh price is about 0.055 US cents, indexed to the price of coal and theexchange rate of the US$ and the euro.
Furthermore, there is a provision to ensure that the utility also buys intermittentlyavailable electricity from the sugar factories. However, the price for intermittentpower is frozen at US$ 0.006 per kWh so as to discourage this highly inefficientmode of electricity generation. As the price setting mechanism has to provide fora value of the fuel utilized, the bagasse used for generation purposes is pricedat Rs100 (or US$ 3.7) per tonne.
The overall effect of the standard feed-in electricity tariffs has been the gradualphasing out of intermittent electricity generation and shifting towards continu-ous as well as firm power. Tables 1 and 2 show the evolution of the electricitygenerated from bagasse/coal and equivalent amount of bagasse used over the1988-1998 period. This is the period during which bagasse-energy developmentwas a high priority issue in the Mauritian sugar industry. On the whole, electric-ity generated from bagasse has increased by more than three-fold over the ten-year period.
In parallel to the incentives for bagasse-based cogeneration, policy measureshave been introduced to increase the efficiency in electricity production. Thosemeasures include:
� A performance linked export duty rebate payable by millers related to theirefforts in energy conservation to generate surplus bagasse and in energy gen-eration, preferably, firm power.
� Income tax exemption on revenue derived from the sale of bagasse electric-ity, and capital allowances for investments in energy efficiency.
In response to these incentives and policies, the sugar industry has implementeda number of measures to efficiently use energy in sugar cane processing, e.g.improved sugar recovery, the enhancement of the calorific value of bagasse,reduction in power consumption in the prime movers of sugar manufacturingequipment, reduction in process heat consumption in juice heating and evapo-ration, adoption of continuous processes, factory computerization and processautomation.
SUSTAINABLE ENERGY REGULATION AND POLICYMAKING TRAINING MANUAL
page 9.22

MODULE 9: RENEWABLE ENERGY: REGULATORY AND POLICY OPTIONS
page 9.23
Table 1. Evolution of electricity production from the sugar industry (GWh) andkWh/tonne cane
Fuel YearPower source 1988 1989 1990 1991 1992 1993 1994 1995 1996 1997 1998
Firm Bagasse 41 26 18 39 50 39 44 46 70 66 112*
Coal 34 68 45 54 43 40 46 41 10 23 62
Continuous Bagasse 19 20 24 21 28 27 28 30 33 53 109
Intermittent Bagasse 12 10 11 10 6 4 4 5 7 6 4
Total GWh 72 56 53 70 84 70 76 81 110 125 225(bagasse)
Total GWh 106 124 98 124 127 110 122 122 120 148 287(bagasseand coal)
Total tonne 5.52 5.44 5.55 5.62 5.78 5.40 4.81 5.16 5.26 5.79 5.78cane (x 106)
kWh/tc 13 10 10 12 15 13 16 16 21 22 39
Source: Deepchand, 2003.
*Includes 30 GWh of electricity generated in 1999 from Crop 1998 stored bagasse.
Table 2. Evolution of equivalent tonnage of bagasse (X 103) used forelectricity export
1988 1989 1990 1991 1992 1993 1994 1995 1996 1997 1998
Firm 93 58 40 88 114 90 100 104 160 149 254
Continuous 49 51 59 53 70 68 70 76 83 133 272
Intermittent 34 30 30 29 18 11 11 14 21 17 10
Total 176 139 129 170 202 169 181 194 264 299 536
Source: Deepchand, 2003.
6.2. Kenya: explicit target for share of renewables—case of geothermal energy
Starting in 1981, Kenya was the first country in Africa to exploit geothermalresources for electricity generation. After some inconclusive initial exploration atOlkaria in the 1950s, interest revived during the 1970s. A feasibility study carriedout to evaluate Olkaria’s potential for generating electricity found that the geo-thermal field covered 80 km2 and could provide steam sufficient to provide25,000 MW of generation capacity (assuming re-injection which would make itfully renewable). So far, 103 geothermal wells have been drilled in Kenya forexploration, production, monitoring and re-injection. Of these, 97 wells are in theOlkaria area and the rest in the Eburru field (Mariita, 2002; Mbuthi 2004).

The draft National Energy Policy provides a target for the contribution of geother-mal electricity generation in Kenya. The policy provides that by the year 2020,the installed capacity of geothermal energy is expected to account for a quarterof the total installed generation capacity up from the current 9.7 per cent (Mbuthiand Andambi, 2004). Consequently, to encourage investment in geothermaldevelopment for electricity generation, the energy policy provides the followingincentives (Republic of Kenya, 2004):
� Ten-year tax holiday for geothermal plants of at least 50 MW; seven years forplants in the range of 30-49 MW; and five years for plants between 29-10 MW.
� Seven-year tax holiday on dividend incomes from investments made fromdomestic sources.
� Duty and tax exemptions on the procurement of plant equipment and relatedaccessories for generation and transmission during project implementation. Inaddition, the procurement of spare parts would be made free of duties and taxes.
Consequently, Kenya’s geothermal energy developed has realized an installedcapacity of 127 MW, of which 12 MW is exploited by ORMAT International, an inde-pendent private power producer (KPLC, 2003; Mbuthi and Andambi, 2004).
6.3. South-east Asia: standard PPAs for smallhydropower development
Small hydropower development in Nepal
As a direct result of the liberalization in the power sector brought about by theElectricity Act (1992), international independent power producers (IPPs) investedin two medium hydropower projects in 1995: the Khimiti Hydro Electric Project(60 MW) and Bhote Koshi HEP (36 MW). The PPAs for these projects were nego-tiated on a case-by-case basis between the utility and the IPP. In October 1998,the government of the time announced that the national utility, Nepal ElectricityAuthority (NEA), would purchase all energy produced by small producers (5 MWor below) at a standard “power puchase agreement (PPA)”3. By early 1999, thefirst small hydro IPPs began to carry out feasibility studies and approach finan-cial institutions with the standard PPA in hand. The first financial closure by localbanks took place in 2000 and the Syange project (183 kW) was on line in January2002 followed by the Piluwa Khola (3 MW) project October 2003.
Even after the standard PPA was announced, prospective IPPs remained skepti-cal about the credibility of the utility’s offer. There was only limited confidence
SUSTAINABLE ENERGY REGULATION AND POLICYMAKING TRAINING MANUAL
page 9.24
3The rate was Rs 3.00 (4 US cents) for the dry season and Rs 4.25 (5.7 US cents) with an escalationof 6 per cent per year for five years on the local currency rate.

that small hydropower could be developed into a profitable sector at the ratesbeing offered. Support was provided by Winrock International and GTZ to entre-preneurs and their engineering consultants by sharing feasibility costs, provid-ing free technical reviews of feasibility studies and site construction, and byhelping them negotiate with the utility, banks and insurance companies.
After the “standard PPA” was announced, over 50 feasibility studies were com-pleted, 20 PPAs signed, 10 projects reached financial closure, and seven projectshave commenced construction resulting in five completed projects. The projectsthat were financed after the “standard PPA” came into force are marked in boldin the table below. Once the barrier of market uncertainty for the produced elec-tricity was removed through the “standard PPA” and developers gained confidencein the sector, hydropower has become attractive as an investment sector to bothprivate developers and financing institutions, despite the ongoing insurgency inthe countryside. All financing for these hydropower projects has come from localbanks. Nepal has seen an investment by local banks of some US$ 47 million innew small hydropower projects in the last seven years, of which US$ 13 millionhas gone to smaller projects under the “standard PPA”.
MODULE 9: RENEWABLE ENERGY: REGULATORY AND POLICY OPTIONS
page 9.25
Table 3. Private sector investment in small hydro in Nepal
Date of Total cost Local financingProjects Size (MW) commissioning (US$M) (US$M)
Khudi 4.0 June 2006 6.36 4.47
Sisne 0.75 2006 1.4 0.99
Chaku 1.5 Jun 2005 1.64 1.15
Sun Koshi 2.6 Mar 2005 3.6 2.51
Rairang 0.5 2004 0.45 0.29
Piluwa 3.0 Oct 2003 5.5 3.16
Chilime 20 Aug 2003 30 19.86
Indrawati 7.5 2002 20.5 14.29
Syange 0.2 Jan 2002 0.3 0.16
Jhimruk 12 1995 20 Norwegian grant
Andhi Khola 5.1 1991 3.8 Norwegian grant
Note: Jhimruk and Andhi Khola have been privatized and are now operated by the Butwal PowerCompany.
Small hydropower development in Sri Lanka
In 1996, as part of the liberalization in the power sector started in 1994 by theSri Lankan government, the Central Electricity Board (CEB) allowed the grid con-nection of private small hydro (<10 MW) and issued a “standard PPA” starting in

1997 and revised annually. The rate on the PPA was determined by the avoidedcost of fuel at the CEB thermal plants and hence to the international price ofpetroleum fuel. The international fuel prices were averaged over three years toavoid large spikes which often occur in petroleum prices. This means that pri-vate small hydropower developers are paid only for the energy (MWh) they pro-duced and not for the capacity (MW) which they also contribute to the system.Despite this, returns on investment were found to be attractive with simple pay-back periods typically of around 3-4 years or less. The published feed-in tariff isshown in the table below. It is likely that the persistent high price of petroleumproducts will help to contribute to continued and increased returns to investors.
SUSTAINABLE ENERGY REGULATION AND POLICYMAKING TRAINING MANUAL
page 9.26
Table 4. PPA feed-in electricity prices in Sri Lanka for small hydropower
Dry season (Feb.-April) Wet season (balance months)Rs/kWh Rs/kWh
1997 3.38 2.89
1998 3.51 3.14
1999 3.22 2.74
2000 3.11 2.76
2001 4.20 4.00
2002 5.13 4.91
2002 5.90 5.65
2003 6.06 5.85
2004 5.70 4.95
2005 6.05 5.30
US$ 1 = SL Rs 100, so the Rs can be read as US cents.
6.4. Photovoltaic energy service companiesin Zambia4
Introduction
The following example is the result of a well-thought out scheme that has beenimplemented in the Eastern Province of Zambia. The programme of rural electri-fication in Zambia shows that the concept of ESCOs offers an interesting policytool and could be replicated in other countries.
4Lemaire X. (2006) Case Study: Photovoltaic Energy Service Companies in Zambia. Centre forManagement under Regulation, Warwick Business School.

Energy service companies (ESCOs)
The concept of ESCOs5 was launched in 1998 in the Eastern Province of Zambiawith the support of the Swedish International Development Agency (SIDA). In thefirst version of the project, the Zambian government would buy the photovoltaicsolar systems that are lent to an energy service company, which could have upto 20 years to reimburse the loan from the government (initially a donation fromthe international agency).6 The ESCO installs solar equipment in households andsmall shops and charges a limited fee. Then, the ESCO gets a monthly payment forthe systems. A battery fund has been created to replace the batteries regularly.
Unlike conventional installers, these small enterprises are not paid for the instal-lation of a product—the initial fee covers just a small part of the cost of instal-lation—instead they are paid for the delivery of an energy service to their clients.In this scheme, ESCOs are given incentives to ensure a continued operation ofthe systems, as the customers pay only for the time that the service is provided.In fact, ESCOs are not operationally far from conventional utilities who wouldcharge a low cost of connection to the grid and receive a monthly payment fromtheir customers for the delivery of electricity.
Key ESCO aspects
The selection of the enterprises to become ESCOs was done in 1999. Now threeautonomous ESCOs exist in the districts near the border with Mozambique andMalawi: one in Nyimba—operational in 2000 (NESCO), one in Lundazi—opera-tional in 2001 (LESCO) and one in Chipata—operational in 2002 (CHESCO).
ESCOs are small structures with a director/project manager, twofinance/administrative staff and 2-3 technicians. ESCOs photovoltaic systemsinclude currently a 50 Wp panel with a 90-105 Ah battery. Each ESCO has its ownhistory and faces specific constraints due to its location.
In Lundazi, LESCO has 150 systems, out of which 70 are currently operating. Theother systems are not working mainly due to battery problems. The majority ofbattery failures are in the Zambia National Service Camp. LESCO is facing finan-cial problems due to non-payment of the monthly service fee by this institution.
MODULE 9: RENEWABLE ENERGY: REGULATORY AND POLICY OPTIONS
page 9.27
5The project described in this case study is mainly funded by the Swedish International DevelopmentAgency (SIDA) with the technical assistance of the Stockholm Environment Institute and the Universityof Zambia.6In 2005, the formal ownership of the solar systems has been transferred to ESCOs and it has beendecided that the capital will have to be reimbursed in 10 years instead of 20 years, but with a 50 per centcapital subsidy. In the future, ESCOs will get a loan from a credit facilitator and buy directly the solarsystems.

In Chipata, CHESCO has 150 systems, out of which 140 systems are currentlyworking. CHESCO has faced a lot of difficulties with the tokens of a SIEMENS pre-payment system. Every time the charged tokens were not recognized, the clienthad to return to CHESCO’s office in Chipata from sometimes as far as 60 km andCHESCO had to give them extra days of electricity as compensation.
In Nyimba, NESCO has 100 systems, 94 systems are currently working. NESCOwas the first ESCO established, and now seems to have a good knowledge of thesystems.
To establish comparisons, the cost of connection to the grid with ZESCO is300,000 ZMK (US$ 91) in the capital Lusaka, 500,000 ZMK (152 US$) in Nyimbaand 800,000 ZMK (US$ 244) in Lundazi. The monthly payment for grid electricitydepends of course on the level of consumption, but is on average far less thanthe monthly service fee charged by ESCOs for solar energy, especially for thekind of appliances used. The low residential consumer monthly tariff of ZESCOis 18,000 ZMK (US$ 5). This is due notably to the fact that electricity from thegrid is highly subsidized in Zambia.
A positive commercial relationship with clients
400 clients are now paying a monthly fee to the ESCOs for solar photovoltaicelectricity. Each ESCO has a waiting list of 400-500 clients. Solar systems enablesmall businesses to extend their hours of work and therefore to improve theirincome generation. For households, solar systems improve the quality of life bysupplying basic needs such as light, TV and radio. The impact of a basic servicesuch as light seems to be tremendous, especially for pupils who can study dur-ing the night. According to the latest available data, there has been a good pay-ment record, no acts of vandalism and very few solar panels have been stolen,this being due to strong social control. Nevertheless, due to default of payment,a limited number of solar systems have been repossessed.
Technicians of ESCOs have to go every month to visit the clients and collect fees(except for prepaid systems). It means therefore that an inspection of the instal-lation is conducted monthly. This also enables ESCOs to have regular feedbackfrom their customers.
Persistent technical problems that are or can be solved
The main technical problem comes as usual from the batteries and the regula-tors. For various reasons, very few batteries from the first installations are stillworking. The initial design of the different systems and the quality of some
SUSTAINABLE ENERGY REGULATION AND POLICYMAKING TRAINING MANUAL
page 9.28

batteries seems the issue. At the start, the ESCOs lacked the capacity and thenecessary qualifications to maintain the systems. There could be also a tendencyto overuse the systems, especially in businesses. Now, it seems that with achange of the kind of batteries used, the training of ESCO technicians in orderto enable them to design the systems, and the dissemination of information toclients who are now more aware of the possibilities and limits of their solar sys-tem, these initial technical difficulties are about to be solved.
Financial uncertainty for ESCOs
ESCOs get a long-term loan that has to be refunded. ESCOs charge an installa-tion fee that represents less than 10 per cent of the cost of the system (which isabout US$ 900). The monthly fee is currently around US$ 10-13, which seems tobe the maximum that clients are willing to pay. This covers the running costs (ser-vicing, maintenance) of the ESCOs, but cannot cover all the capital costs. In fact,now that the ownership of the installations is progressively and officially trans-ferred to the ESCOs, it has been agreed that 50 per cent of the capital cost willfinally have to be subsidized for the first installations and 25 per cent for the newinstallations that the ESCOs will buy from now on (Swedpower, 2005, p. 5). Someuncertainty seems to remain on the future of the exemption of VAT for ESCOs.
Moreover, the inflation rate in Zambia is still around 20 per cent per year (com-pared to 400 per cent at the beginning of the 1990s).7 ESCOs are importing allthe components of solar systems that are paid for in US dollars while they arebeing paid in local currency by customers who cannot easily absorb successiveincrease of the monthly fee. This creates considerable distortion for ESCOs.8
Important points for replication
Even if ESCOs in Zambia are just starting to be fully operational, some lessonscan already be drawn from this case.
The choice of location
In the Eastern Province of Zambia, the rural population is wealthier than in otherparts of Zambia. The initial survey showed that 75 per cent of the respondents
MODULE 9: RENEWABLE ENERGY: REGULATORY AND POLICY OPTIONS
page 9.29
7As the money invested in local currency is quickly devalued, some ESCOS have launched a small busi-ness (of soft drinks) to make money and keep the capital. The battery fund is deposited in US dollars.8The current fee charged by ESCOs even after successive increases, is around 40-45,000 Kwacha. Itshould be at 52,000 Kwacha to match the initial fee value charged by the ESCOs the year they startedto be operational based on exchange rate changes.

in this area were willing to pay US$ 5 per month for electricity (for an averagemonthly income of US$ 42 in 1998). In poorer places, the contribution capacityof households will be lower. Therefore, the possibility of replication seems to belimited for the moment to the relatively wealthier places in Africa.
The maintenance scheme also implies that solar systems are not installed intolarge area, so that ESCOs can regularly access all the systems for maintenanceand to collect the fees. They need to have a sufficient number of clients (150-200) to be profitable. Another point to take into account is any planned gridextension that can affect the economics of ESCOs. However, competition fromgrid connected conventional electricity does not mean necessarily the bankruptcyof ESCOs working in the area, as ESCOs will have clients situated in the outskirtsof the main towns who will never be connected (for example, the centres ofLundazi, Chipata and now Nyimba are connected to the grid while householdson the outskirts are not).
The commercial scheme
Initially, only one kind of basic system chosen by the Department of Energy wasoffered: a 50 Wp panel with a 90-105 Ah battery to enable the connection of fourbulbs and a power point for a small TV/radio. Now ESCOs tend to provide a morediversified range to meet the needs of their clients. It seems that there will bethree standard sets:
� The current 50-70 Wp with a 100 Ah battery without inverter.
� 80-120 Wp and a 150 Ah battery with maybe a small inverter.
� 120-150 Wp for a system with a refrigerator.
It is also important to take into account the fact that for some groups of clientssuch as farmers, income can vary considerably during the year. Therefore, pay-ment of the debt by ESCOs may have to be made on a basis other than monthly,e.g. quarterly or annually.
Providing electricity to institutions such as schools, health centres and the armymay be a priority from a social point of view, but that raises the question of thecapacity and the willingness of these institutions to pay the ESCOs on a regularbasis.
Training, public awareness and the choice of equipment
As usual in solar energy, the fact that solar systems need to be sized to the con-sumption requirement of the users implies a good understanding by the clients
SUSTAINABLE ENERGY REGULATION AND POLICYMAKING TRAINING MANUAL
page 9.30

of the possibilities and the limits of their solar systems. It appears that it is bet-ter to leave the choice of the system to the companies that can then build directrelations with the suppliers. Therefore, competitive tender at a governmental levelfor the purchase of photovoltaic systems, even if it can reduce prices by a bulkpurchase, may have to be avoided. Moreover, competitive tenders tend to excludelocal companies in favour of international companies. Direct purchase may favourthe creation of a local network of solar companies.
The training of the technicians is also crucial to enable them to adjust the regu-lation of solar systems. Most of the problems linked to the batteries are not justlinked to the product itself and could have been solved with correct training. Nowthat technicians are trained in the design of systems, ESCOs in Zambia will pur-chase their equipment directly.
Financial uncertainty and capital costs
Although technical problems are being solved, ESCOs in Zambia are still facingfinancial uncertainty due to macro-economic conditions, which are out of theircontrol. This situation of excessive inflation is not specific to Zambia and provesto be quite damaging for small companies. Furthermore, the capital cost for solarelectricity, as for conventional electricity, still needs to be subsidized as the pur-chasing power of inhabitants remains low and there are no local financial insti-tutions ready to give loans to small rural companies.
Conclusion
The success of the market-driven concept of ESCOs demonstrates that with asuitable financing scheme, households and businesses can afford solar photo-voltaic systems. Initial funding from the national government (supported byinternational agencies) is essential, but once provided, the concept of ESCOsseems to be capable of solving the eternal problems of up-front costs and main-tenance. This example tends to prove that after enabling the establishment ofa network of local entrepreneurs, solar systems can be maintained and candeliver a real service.
In a first phase, the initial funding can be worked out as a direct subsidy, a softloan (to be reimbursed over a long period of time), tax exemptions, or a combi-nation of those. Whilst it is most likely ESCOs will continue to depend at leastpartly on external funding, the aim should be to decrease ESCOs financialdependency towards the mid and longer term. One way to increase their incomecould be the broadening of their client portfolio and the diversification of theservices offered.
MODULE 9: RENEWABLE ENERGY: REGULATORY AND POLICY OPTIONS
page 9.31

The regulator should carry out reviews of the financial and operational perform-ance of the ESCOs on a regular basis, and should come up with clear recommen-dations for the ESCOs, as is done in the case of Zambia by the Energy RegulationBoard (ERB).
SUSTAINABLE ENERGY REGULATION AND POLICYMAKING TRAINING MANUAL
page 9.32

7. CONCLUSION
Renewable energy technologies tend to be less developed than “conventional”electricity generation technologies. The use of regulatory and policy supportmechanisms is a necessity for driving the new technologies towards commercialviability by encouraging deployment and reducing investor risk.
MODULE 9: RENEWABLE ENERGY: REGULATORY AND POLICY OPTIONS
page 9.33


LEARNING RESOURCES
Key points covered
These are the key points covered in this module:
� The advantages and benefits of supporting renewable energy through regula-tory and policy measures.
� The main issues to address when designing a policy instrument to supportrenewable energy.
� The existing policy instruments to support renewable energy, including feed-in tariffs, quota mechanisms amongst others.
� The advantages and disadvantages for each of these policy instruments.Provision of information enabling the reader to consider, in a given country,which (or combination) of system(s) would suit their national situation best.
� Experiences from Europe, Africa and other developing countries.
MODULE 9: RENEWABLE ENERGY: REGULATORY AND POLICY OPTIONS
page 9.35
Question: Name at least five regulatory/support mechanisms that canencourage renewable energy development in the African powersector in the short term.
Answer:
- Establishing “standard” power purchase agreements (PPAs)
- Ensuring long-term electricity generation licences and PPAs
- Developing a favourable tariff setting and adjustment formula
- “Light-handed” regulation
- Setting explicit targets for the share of renewables in the electricity generation mix
- Enacting explicit regulations that encourage local private participation in renew-able energy development
- Providing subsidies to renewable energy-based power systems
Question: What are the main differences between a feed-in tariff systemand a quota system?
Answer: A feed-in tariff system provides certainty on the price for green electric-ity, as this price is fixed over a certain period. A feed-in tariff system does not pro-vide certainty on the level of green electricity that will be supplied. The fixedpremium is the incentive for investors.
Answers to review questions

SUSTAINABLE ENERGY REGULATION AND POLICYMAKING TRAINING MANUAL
page 9.36
A quota system provides certainty on the level of green electricity that will be sup-plied, as the target is fixed, as well as a fine for non-compliance. A quota systemdoes not provide certainty on the price for green electricity, as the price will bedetermined by supply and demand in the tradable certificate market. The targetand the fine are the incentive for investors.
In theory, a quota system with tradable certificates is more efficient, as it stimu-lates the market players to develop the cheapest technologies. On top of that, thetrade of certificates could improve efficiency between different regions or coun-tries. On the other hand, the feed-in tariff system has proved very successful forwind energy on land in Germany and Spain, mainly thanks to the investor confi-dence that the system provides.
Question: Describe in short the main support mechanisms for renewableenergy.
Answer:
A feed-in tariff system: see answer above.
A quota system: see answer above.
Tender schemes:
The government organizes tenders for individual renewable energy projects. Thebest proposal gets the approval to develop the project. The developer gets a lotof certainty about his project and about the income for his project (as a fixed pre-mium for the green electricity will be paid by the suppliers). On the other hand,this system does not provide a continuous incentive for new renewable energyprojects, which hinders the development of a full-grown green electricity market.
Voluntary mechanisms:
The system is based on customers’ willingness to pay a higher price for green elec-tricity. The system relies on the consumer’s awareness of the advantages of greenelectricity and the disadvantages of other forms of electricity. The marketing andlabelling of green electricity are key aspects in this support mechanism.
Hybrid schemes involving two of the mentioned support mechanisms:
A support scheme can make use of aspects of the different support mechanismsto correct a shortcoming of one of the individual support mechanisms.
For instance, when a quota system does not provide enough investor confidencebecause of a lack of a fully-grown certificate market, the government can introducea minimum price for certificates to protect a developer from a cash flow problemshould the certificate price decrease dramatically. This happened for instance inFlanders, Belgium.
To avoid this, in a feed-in scheme, the incentive for innovation would fade (becausethe price is fixed for a long period). The fixed premium can be decreased over time(for instance, five per cent per year for new projects) so the learning curve of thetechnology would not be harmed.

Relevant case studies
1. Germany: feed-in mechanisms
2. Spain: support mechnisms for wind energy
3. Denmark: support mechanisms for wind energy
4. Ghana: status of renewable energy
5. Zambia: power sector reform and renewables
6. UK: renewables obligation
See annexes in separate files.
MODULE 9: RENEWABLE ENERGY: REGULATORY AND POLICY OPTIONS
page 9.37
Presentation/suggested discussion topic
Presentation:
ENERGY REGULATION – Module 9: Regulatory measures for renewable energy
Suggested discussion topic:
Given the particular situation in your country, which of the described support mech-anisms might prove most useful? Bear in mind that investor confidence is a cru-cial aspect, and that you can combine aspects from different support mechanisms.
Exercise
What support mechanisms for renewable energy exist in your country? Are thesedirected towards electricity, heat or both? What have been the results so farand what suggestions would you make to improve the system?
Take into account that you should avoid changing the fundamental design ofthe system, as this would undermine investor confidence.
Write a 2-3 page essay answering these questions.


REFERENCES
Report of the proceedings of the 2nd Annual Conference of the African Forum for UtilityRegulators (AFUR), Kampala, Uganda, 14-18 March 2005.
M. Tse, Energy and Renewable Energy Technologies (2006), Capacity Building in EnergyEfficiency and Renewable Energy Regulation and Policy-Making in Africa. Case Study 2:Ghana Wind Energy Project.
Lemaire X. (2006), Case Study: Photovoltaic Energy Service Companies in Zambia. Centrefor Management under Regulation, Warwick Business School.
Global Environment Facility (GEF) (2006), Appendix L: Small Hydropower Experience inSouth Asia. GEF, Washington—unpublished.
Mbuthi, P. and Andambi, H. (2004), Feasibility and Enhanced Role of Geothermal in Kenya’sEnergy Supply. African Energy Policy Research Network/Heinrich Boll Foundation,Nairobi.
Kenya Power and Lighting Company (KPLC) (2003), Annual Report and Accounts2002/2003. KPLC, Nairobi.
Deepchand, K. (ed.) (2003), AFREPREN Occasional Paper No. 21: Opportunities for Cogener-ation in a Reforming African Power Sector. AFREPREN, Nairobi.
INTERNET RESOURCES
The Global Regulatory Network (GRN) strengthens regional associations and promotes theunderstanding of complex regulatory practices: www.globalregulatorynetwork.org
Public Utility Research Center: www.purc.org
African Forum of Utility Regulators: www.afurnet.org
Centre of Regulation and Competition: www.competition-regulation.org.uk
European Renewable Energy Council (EREC): www.erec-renewables.org
European Energy Regulators (CEER): www.ceer-eu.org
Electricity Control Board of Namibia (ECB): www.ecb.org.na
Energy Regulation Board of Zambia (ERB): www.erb.org.zm
Kenyan Electricity Regulatory Board: www.erb.go.ke
MODULE 9: RENEWABLE ENERGY: REGULATORY AND POLICY OPTIONS
page 9.39


GLOSSARY/DEFINITION OF KEY CONCEPTS
CHP, combined heat and A method of using the heat that is produced as a by-power, cogeneration product of electrical generation and that would otherwise be
wasted. The heat can be used for space heating of buildings(usually in district or community heating schemes) or forindustrial purposes. Utilizing heat in this way means that70-85 per cent of the energy converted from fuel can be putto use rather than the 30-50 per cent that is typical for elec-trical generation alone. Cogeneration schemes can be rela-tively of small-scale, for use at the level of a factory orhospital, or they can be major power stations. The term CHPis employed in the United Kingdom and some other parts ofEurope, while the term cogeneration is employed elsewherein Europe, the United States and other countries worldwide.
Consolidation services Independent services enabling generators, including smallergenerators, to combine their output and negotiate betterterms for its sale.
Deregulation The process of removing or reducing regulation. It is oftenemployed in connection with the liberalization process forprivatized industries.
Energy services The provision of energy supply and measures concerned withend-use in a single package.
Energy services company Companies concerned with maximizing efficient and cost-(ESCO) effective supply and end-use of energy for their customers.
This can encompass a mixture of the following as appropri-ate: competitive purchasing of various fuels; CHP; end-useefficiency measures; consumption monitoring and manage-ment and others. ESCOs should be distinguished from energysupply companies whose main role is to supply units of gas,electricity or heat. ESCOs can also be distinguished fromenergy management companies whose main role is to supplyenergy efficiency services.
Liberalization Technically, the removal of restrictions on the movement ofcapital. It has come to refer to a policy of promoting liberaleconomics by limiting the role of government in the opera-tion of the market economy. Liberalization can include priva-tization and deregulation/re-regulation. Typically, it refers tothe establishment of an industry structure to allow competi-tion. The process includes the shifting of publicly-owned
MODULE 9: RENEWABLE ENERGY: REGULATORY AND POLICY OPTIONS
page 9.41

companies into the private sector, such that provision ofservices is subject to greater competition or, in the case ofnatural monopolies to greater oversight with regard to eco-nomic efficiency.
Monopoly The situation where one company has the market power tocontrol the price or availability of a good or service.
Quota mechanisms More generally known as a renewable portfolio standard oras an obligation mechanism.
Renewable energy The use of energy from a source that does not result in thedepletion of the earth’s resources whether this is from a cen-tral or local source.
Renewable energy A certificate that represents a unit of renewable electricitycertificates (RECs) generated that can be used to verify the fulfilment of an obli-
gation to source a certain percentage of renewable genera-tion as required in renewable portfolio standard schemes.Trading may be allowed so that companies that underachievetheir obligation can buy certificates from those who haveoverachieved.
Renewable portfolio A market-based mechanism devised by Nancy Rader andstandard Richard Norgaard for the American Wind Energy Association
in 1996. It obliges supply companies or consumers to pur-chase a specific amount of electricity from renewable energysources. The key goal of such a mechanism is to minimizethe costs of increasing renewable energy capacity throughthe stimulation of competition to fulfil obligations. The RPSmechanism is also known as a quota or obligation mecha-nism. Examples of the RPS include the renewables obliga-tion in the United Kingdom or the mandatory renewableenergy target in Australia). The market may be operatedthrough the creation and trading of certificates (renewableenergy certificates).
Shallow connection In essence these types of charges mean that generators paycharges only for the equipment needed to make the physical connec-
tion of their generation plant to the grid network, and thatall other costs are the responsibility of the distribution net-work operator (DNO). This principle is usually introduced tostimulate distributed generation, and should be accompa-nied with the development of a transparent mechanism forthe recovery of costs incurred by DNOs relating to the nec-essary reinforcement of the grid network (the “deep” costelements).
SUSTAINABLE ENERGY REGULATION AND POLICYMAKING TRAINING MANUAL
page 9.42

Strike price A reference price as agreed between electricity retailers (buy-ers) and electricity generators (sellers) in their “contracts fordifference”. If the resulting wholesale price index (as refer-enced in the contract) in any time period is higher than the“strike” price, the generator will refund the differencebetween the “strike” price and the actual price for thatperiod. Similarly a retailer will refund the difference to thegenerator when the actual price is less than the “strikeprice”. Market players use this type of contract to protectthemselves from volatility in price and volume of electricity.
Tariff mechanism A mechanism to encourage the growth of renewable energygenerating capacity. Notable examples are Denmark andGermany. A tariff mechanism generally provides a particularrate per kWh of electricity generated and guarantees thatpayments will continue for a fixed or minimum period. Thetariff can be fixed beforehand, can be fixed to reduce in spe-cific gradations over time or can be linked to the averageelectricity tariff. Also known as a price mechanism.
Tender mechanism A mechanism to encourage the growth of renewable energywhere competitive bids are put forward to government forindividual sustainable energy projects. Suppliers are obligedto buy a certain amount of renewable power at a premiumprice. Although specific characteristics vary, it is likely thatin the framework of this kind of policy the government willset an overall target for sustainable generation, and thenspecified limits for individual technologies within that andalso set a specified time for contracts for the generation, dur-ing which time they will receive a premium price. The gov-ernment, usually on the basis of cost, selects the winningcontracts although in some schemes other factors such astechnical quality and socio-economic aspects also play a role.
MODULE 9: RENEWABLE ENERGY: REGULATORY AND POLICY OPTIONS
page 9.43


ANNEX I. METHODOLOGY AND EXAMPLES ONHOW TO CALCULATE THE LEVEL OFFEED-IN TARIFFS
Methodology
Introduction
A feed-in tariff (FIT) is a pre-defined guaranteed minimum price or a guaranteed premiumon the market price for every kWh of green electricity generated. The tariff scheme is usu-ally differentiated for different green electricity production technologies, with less devel-oped technologies receiving higher prices for their output. The scheme is usually definedfor a specified number of years, but again this can vary depending on the technology.
Overall aim
The overall aim when designing a set of feed-in tariffs is to fix a premium tariff which:
� Covers the extra cost of electricity production using the given technology (thus stim-ulating investment)
� While at the same time avoids over-subsidizing the given technology (thus creatingwindfall profits and making the system more costly).
Relevant parameters
As is illustrated in table 1, the minimum to average generation costs for renewable ener-gies vary widely among different technologies, and within the same technology, accord-ing to differences in the national market and resource conditions.
MODULE 9: RENEWABLE ENERGY: REGULATORY AND POLICY OPTIONS
page 9.45
Table 1. Minimum to average generation costs for the main green electricitytechnologies in EU151
Range of electricityTechnology generation cost (€/MWh)
Wind onshore 50-80
Small-scale hydro 40-140
Biomass using forestry residues 40-80
Agricultural biogas 60-100
Photovoltaics > 450
1COM(2005) 627 final - Communication form the European Commission—The support of electricity fromrenewable energy sources—Annex 3 (December 2005).

The most relevant parameters are on the one hand plant-specific data, and more generalparameters on the other. The most influential parameters when determining the genera-tion costs are:
� Investment costs
� Full load hours
� Fuel price (in the case of biomass)
� Interest rate
� Expected return on equity
A non-exhaustive list of relevant parameters is presented below, as several tens of variablescan be of influence depending on the given technology or on the country in question.
Plant-specific data:
� Investment costs
� Operational costs
� Energetic efficiency
� Full load hours
� Fuel price (in the case of biomass-fired plants)
General parameters:
� Depreciation time
� Interest rate
� Expected return on equity
� Tax regime
Other relevant parameters:
� Electricity price
� The level of support instruments (other than the feed-in tariffs, e.g. investment subsi-dies/tax incentives)
� The period during which the feed-in tariff is guaranteed
Because of the great amount of different variables, the renewable energy generation costsare generally calculated specifically. For this purpose a number of projects have devel-oped mathematical models.2
A simplified calculation based on the most crucial parameters is presented in “Examples”lower in this annex.
SUSTAINABLE ENERGY REGULATION AND POLICYMAKING TRAINING MANUAL
page 9.46
2The Green-X and FORRES 2020 projects developed rather complex mathematical models to calculategeneration costs. In the Netherlands a detailed methodology was developed by ECN to calculate thefeed-in tariffs for new renewable electricity projects in 2004 and 2005 (www.ecn.nl).

Determine the feed-in tariffs
Once the generation costs per technology are known, the level of the feed-in tariff can befixed accordingly.
Policy considerations
The level of the tariff can finally be influenced by the explicit political decision to stimu-late renewable deployment. For instance a national government can decide to introducehigher feed-in tariffs to reach a certain share of renewable electricity by a given year, orto activate a virtually non-existent sector, or to establish the renewable energy policy asan umbrella policy aiming to improve on other policies such as energy poverty, education,health care and gender issues.
Examples
The following examples intend to illustrate the methodology to calculate the feed-in tarifffor some of the green electricity production technologies, rather than describing in detailthe existing mathematical models. The presented calculations are highly simplified inorder to visualize the methodology, as they take into account only a few of the differentrelevant variables. It is stressed that further modelling is required when actually fixing thefeed-in tariff levels for a given country.
On-shore wind energy
First thing to do is to determine what a typical wind energy project in the given countryor region would look like. In this example a following typical project3 is considered:
MODULE 9: RENEWABLE ENERGY: REGULATORY AND POLICY OPTIONS
page 9.47
3Only “investment cost” and “maintenance cost” could be seen as generally applicable. “Full loadhours” depend on site-specific wind data and need to be measured on a case-by-case basis. A roughestimate can be made based on national or regional wind data, whenever available. “Interest rate”can vary depending on financial markets conditions. “Duration of support” is a design element of thefeed-in scheme and can vary according to the technology. For instance the duration is typically 10years for wind, and 20 years for PV.
Capacity (kWe) 1500
Full load hours/year 2000
Investment cost (€/kWe) 1100
Operation and maintenance cost 40(€/kWe/year)
Interest rate r ( per cent) 6.5
Duration of support t (years) 10
Feed-in tariff (€/kWh) ?
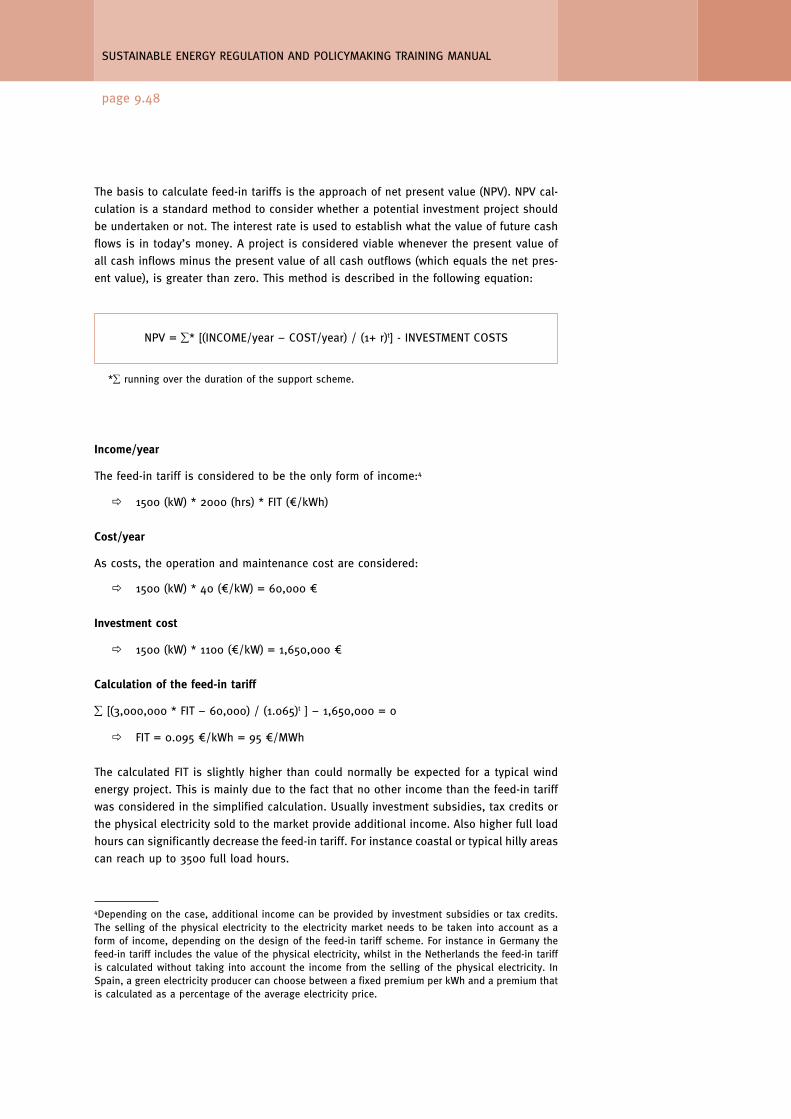
The basis to calculate feed-in tariffs is the approach of net present value (NPV). NPV cal-culation is a standard method to consider whether a potential investment project shouldbe undertaken or not. The interest rate is used to establish what the value of future cashflows is in today’s money. A project is considered viable whenever the present value ofall cash inflows minus the present value of all cash outflows (which equals the net pres-ent value), is greater than zero. This method is described in the following equation:
SUSTAINABLE ENERGY REGULATION AND POLICYMAKING TRAINING MANUAL
page 9.48
NPV = ∑* [(INCOME/year – COST/year) / (1+ r)t] - INVESTMENT COSTS
*∑ running over the duration of the support scheme.
Income/year
The feed-in tariff is considered to be the only form of income:4
� 1500 (kW) * 2000 (hrs) * FIT (€/kWh)
Cost/year
As costs, the operation and maintenance cost are considered:
� 1500 (kW) * 40 (€/kW) = 60,000 €
Investment cost
� 1500 (kW) * 1100 (€/kW) = 1,650,000 €
Calculation of the feed-in tariff
∑ [(3,000,000 * FIT – 60,000) / (1.065)t ] – 1,650,000 = 0
� FIT = 0.095 €/kWh = 95 €/MWh
The calculated FIT is slightly higher than could normally be expected for a typical windenergy project. This is mainly due to the fact that no other income than the feed-in tariffwas considered in the simplified calculation. Usually investment subsidies, tax credits orthe physical electricity sold to the market provide additional income. Also higher full loadhours can significantly decrease the feed-in tariff. For instance coastal or typical hilly areascan reach up to 3500 full load hours.
4Depending on the case, additional income can be provided by investment subsidies or tax credits.The selling of the physical electricity to the electricity market needs to be taken into account as aform of income, depending on the design of the feed-in tariff scheme. For instance in Germany thefeed-in tariff includes the value of the physical electricity, whilst in the Netherlands the feed-in tariffis calculated without taking into account the income from the selling of the physical electricity. InSpain, a green electricity producer can choose between a fixed premium per kWh and a premium thatis calculated as a percentage of the average electricity price.

MODULE 9: RENEWABLE ENERGY: REGULATORY AND POLICY OPTIONS
page 9.49
Photovoltaic energy—autonomous
A typical example is considered below:
Capacity (kWp) 2
Full load hours/year 12505
Investment cost (€/kWp) 10.0006
Operation and maintenance 07
cost (€/kWe/year)
Interest rate r (per cent) 6.5
Duration of support t (years) 20
Feed-in tariff (€/kWh) ?
5An average of 800 full load hours is typical for a country such as Germany. In Morocco full loadhours can be as high as 1500, and in some specific regions in the world (like deserts), even 2000full load hours are possible. See “Energy from the Desert”, www.iea-pvps.org. The maintenance costis very low for a PV installation, and is therefore neglected in the example.6The investment cost can vary significantly depending on the specific situation, on the use of batter-ies or a diesel generator to decrease intermittency. For more details on costs of PV systems, seeEuropean Roadmap for PV R&D, PVNET, paris.fe.uni-lj.si/pvnet/files/PVNET_Roadmap_Dec2002.pdf#search=%22PVNET%22.7The maintenance cost is very low for PV installations, and is therefore neglected in the example.8A grid-connected system does not need a battery and battery charger.
Income/year
Following the same approach in the wind energy case, the income is:
� 2 (kW) * 1250 (hrs) * FIT (€/kWh)
Investment cost
� 2 (kW) * 10,000 (€/kW) = 20,000 €
Calculation of the feed-in tariff
∑ [(2,500 * FIT) / (1.065)t] – 20.000 = 0
� FIT = 0.72 €/kWh = 720 €/MWh
Photovoltaic energy—grid connected
The same example considered as a grid-connected system (instead of an autonomous sys-tem8) offers the following result.

Income/year
� 2 (kW) * 1250 (hrs) * FIT (€/kWh)
Investment cost
� 2 (kW) * 6500 (€/kW) = 13.000 €
Calculation of the feed-in tariff
∑ [(2.500 * FIT) / (1,065)t] – 13.000 = 0
� FIT = 0.470 €/kWh = 470 €/MWh
Biofuel
An example of a 10,000 kWe installation is considered using biofuel (palm oil)9 in a con-densing steam turbine.
SUSTAINABLE ENERGY REGULATION AND POLICYMAKING TRAINING MANUAL
page 9.50
Capacity (kWp) 2
Full load hours/year 1250
Investment cost (€/kWp) 6500
Operation and maintenance 0cost (€/kWe/year)
Interest rate r (per cent) 6.5
Duration of support t (years) 20
Feed-in tariff (€/kWh) ?
Capacity (kWe) 10,000
Full load hours/year 600010
Investment cost (€/kWe) 800
Operation and maintenance 120cost (€/kWe/year)
Fuel cost (€/GJ) 1011
Interest rate r (per cent) 6.5
Duration of support t (years) 10
Feed-in tariff (€/kWh) ?
9ECN-C—05-016 – Small-scale independent electricity installations using biomass (2005), www.ecn.nl.VITO – Onrendabele toppen van duurzame elektriciteitsopties in Vlaanderen (2005), www.energie-sparen.be10In principle even higher full load hours (>7000) are reachable, provided there is a continuous fuelsupply (generally guaranteed through contracts). In reality, such installations do not always run atfull capacity yet and need regular stops for maintenance.11The price of crude palm oil in January 2007 was circa 360 euros/ton CPO (www.mpoc.org.my). Ifthen an energy content of 37 GJ/ton is assumed, the cost per ton comes at circa 10 euros.

MODULE 9: RENEWABLE ENERGY: REGULATORY AND POLICY OPTIONS
page 9.51
Income/year
Following the same approach as above, the income is:
� 10,000 (kW) * 6000 (hrs) * FIT (€/kWh)
Cost/year
Fuel cost: 10 €/GJ
Electricity production: 60,000,000 kWh = 540,000 GJ(1 kWh = 3.6 MJ, efficiency of energy conversion assumed at 40 per cent)
� Fuel cost/year: 5,400,000 €
� Operation and maintenance cost/year: 10,000 * 120 = 1,200,000 €
Investment cost
� 10,000 (kW) * 800 (€/kW) = 8,000,000 €
Calculation of the feed-in tariff
∑ [(60,000,000 * FIT – 1,200,000 – 5,400,000) / (1.065)t ] – 8,000,000 = 0
� FIT = 0.127 €/kWh = 127 €/MWh
Small-scale hydro12
Capacity (kWe) 100
Full load hours/year 6000
Investment cost (€/kWe) 2500
Operation and maintenance 3cost (per cent of investment)
Interest rate r (per cent) 6.5
Duration of support t (years) 10
Feed-in tariff (€/kWh) ?
Income/year
Following the same approach as before, the income is:
� 100 (kW) * 6000 (hrs) * FIT (€/kWh)
Cost/year
Operation and maintenance cost /year: 100 (kW) * 2500 (€/kW) * 0.03 = 7500€
Investment cost
� 100 (kW) * 2500 (€/kW) = 250,000 €
12State-of-the-art of small hydropower – European Small Hydro Association – www.esha.be

Calculation of the feed-in tariff
∑ [(600,000 * FIT –7500) / (1.065)t ] – 250,000 = 0
� FIT = 0.063 €/kWh = 63 €/MWh
SUSTAINABLE ENERGY REGULATION AND POLICYMAKING TRAINING MANUAL
page 9.52

ANNEX II. STRUCTURE OF THE ELECTRICITYPRICE
The price for the supplied electricity finally paid by the end-consumer is significantlyhigher than the generation cost. The price structure for electricity generally consists offour components:
� Generation cost
� Transmission and distribution cost
� Taxes and levies
� Profit and return on equity for investors
Generation costs
The generation costs are the costs necessary to produce the electricity, as described above(e.g. investment costs, fuel cost, operation and maintenance cost, etc.).
Transmission and distribution costs
The transmission and distribution costs are the costs related to the transport of the elec-tricity to the end-consumer. The supplier needs to pay the transmission and distributiongrid operator for using the grid. The supplier integrates these costs in electricity bills tothe end-consumer.
Taxes and levies
As for any product, tax needs to be paid for supplied electricity. In most cases, additionallevies are applied by the government, usually as a percentage per supplied kWh. Theselevies can include contributes to finance:
� The operation of the energy regulator
� The treatment of nuclear waste
� Social and environmental public obligations
Other components can influence the price of electricity, for instance the balancing costs(especially for wind energy).
Transmission and distribution costs, taxes and levies are applicable for any type of elec-tricity generation, both fossil-based, nuclear and renewable energy. Therefore these costsdo not influence the level of the feed-in tariff, and should not be included in the feed-intariff calculations.
MODULE 9: RENEWABLE ENERGY: REGULATORY AND POLICY OPTIONS
page 9.53

Profit and return on equity for investors
Finally a profit and return on equity component is part of the electricity price.
SUSTAINABLE ENERGY REGULATION AND POLICYMAKING TRAINING MANUAL
page 9.54

MODULE 9: RENEWABLE ENERGY: REGULATORY AND POLICY OPTIONS
page 9.55
Case study 1.
GERMAN FEED-IN MECHANISMS
CONTENTS
1. Introduction 9.57
2. Regulation in Germany 9.57
3. Electricity feed-in law 1991 9.57
4. The renewable energy law 1998 9.58
5. Other mechanisms to support renewables in Germany 9.61
6. Conclusion 9.62
7. References 9.62


1. INTRODUCTION
Germany currently has more installed wind energy capacity than any other country.In late 2003, Germany had a total of 14000 MW of installed capacity (WPM, 2004).It has had a very rapid deployment rate, though this is now slowing as goodonshore sites become rarer. Before 1990 Germany had invested significant fundsin renewable energy R&D with little practical results. Since 1990, the use of par-ticular financial mechanisms, most notably the long-term availability of a tariffmechanism, has seen the strong practical results indicated by the statistics forincreasing wind energy exploitation. Germany has employed a number of sup-port mechanisms in the last fifteen years, each of which has supported renew-able energy technologies including biomass, solar power, hydropower,geothermal energy and energy derived from landfill gas, sewage treatment andcoal-bed methane from coal mines (Federal Ministry for the Environment 2000).Different levels of compensation apply with regard to each technology. This casestudy will primarily deal with support mechanisms as they have applied to windenergy as this provides the best example of an applied policy engendering pos-itive results.
2. REGULATION IN GERMANY
It is worth noting that regulation in Germany has until recently relied upon inter-pretation of legislation by either the courts or by the Federal Cartel Office (FCO)—or both. A regulatory agency was established in 2004 but the full range of itspowers has not yet been brought to bear. The lack of a regulator has meant thatsupport mechanisms for RE have been subject to some drawn out court cases asutilities have tried to avoid costs.
3. ELECTRICITY FEED-IN LAW 1991
Germany’s first significant mechanism for encouraging wind energy exploitationcame with the introduction of the Stromeinspeisungsgesetz or Electricity Feed-InLaw (EFL) on 1 January 1991. This forced German distribution network operators(DNOs) to purchase all electricity offered to them from a range of renewablesources, with wind-generated electricity to be paid a price equal to 90 per centof the average price charged to end-users over the year. The price was paid by
MODULE 9: RENEWABLE ENERGY: REGULATORY AND POLICY OPTIONS
page 9.57

the local company and was passed on to local consumers. This was an exampleof a “renewable energy feed-in tariff” (REFIT), mechanism. Under the EFL, eachDNO had an effective catchment area within which it was obliged to pay the tar-iff to the generators of renewable-based electricity from any qualifying projectswithin that area.
The EFL laid down that the actual connection of the generator to the grid be paidfor by the project developer, with the utility responsible for arranging and financ-ing its own affairs in order to be capable of utilizing the electricity delivered toits grid network. The main sticking point that arose was that the DNOs, opposedas they were to the law overall, submitted excessive bills for grid connection. TheEFL was supported by a 100 MW subsidy programme, which was rapidly extendedto a 250 MW programme as a result of the high-level of response it encountered.The programme provided an additional operating subsidy of €0.031/kWh on topof the EFL-mandated price, at the time equal to €0.084/kWh.
The resulting €0.151/kWh available was thus very substantial. Anderson for exam-ple makes a comparison with the rates of around €0.046-0.051/kWh that wereavailable to American projects at the time and with which they were able to oper-ate profitably (Anderson, 1995). The result in Germany was that the programmewas heavily oversubscribed. Anderson suggests that by applying a lower levelof remuneration, considerably more capacity could have been incentivized with-out any greater cost having to be borne by the consumer. Setting the level ofremuneration can be regarded as one of the key problems with the tariff mech-anism—setting it high means that investors can earn an unnecessarily high rateof return whilst setting it too low means the mechanism will fail to stimulateinvestors.
4. THE RENEWABLE ENERGY LAW 1998
The EFL was changed to some degree in 1998 to become the Erneuerbare EnergienGesetz (EEG), which has been commonly translated as the “Act on GrantingPriority to Renewable Energy Sources”, though it literally translates as“Renewable Energy Law”. The change in the legislation on renewables took placeat the same time as the new German legislation regarding the liberalization ofthe German energy market (Mallon 2000). The EEG effectively acted to bring theEFL into line with the new legislation introduced to reform the energy sector. Theimmediate effect of the EEG was to place a cap on renewables, such that theymay not supply more than 10 per cent of electricity in Germany.
SUSTAINABLE ENERGY REGULATION AND POLICYMAKING TRAINING MANUAL
page 9.58

The new tariff scheme, detailed in the EEG law, was adopted in 2000. The EEGlays down pricing mechanisms for the support of a range of renewable energytechnologies, with a specific pricing mechanism applied to each. It also rede-fines the regulations regarding the financial and institutional support of windenergy.
The EEG law restates the obligation on distribution network owners regardingconnection of renewable energy generators to the grid where such a connectionis requested. The nearest grid owners to a proposed site are obliged to connecta new generator to their grid. Whilst the generator owner is liable for the costsof connection to the grid, the bill submitted to the generator for this function ismade subject to oversight by the Federal Cartel Office (FCO) to ensure that thecost is a reasonable reflection of the actual costs. The grid owner is liable forany costs relating to the upgrading of the grid to facilitate the new generator.That is, the German system uses shallow connection charging for renewable elec-tricity generation.
The EEG Act compels the grid owners to purchase electricity produced by therenewable energy generators within the pricing mechanism laid down within theAct. The new act also contains provision to address one of the most contentiousaspects of the old EFL Act, establishing a national equalization scheme. Thenational equalization scheme makes compulsory the payment of compensationto those distribution and transmission network owners which bear above aver-age costs of paying for renewable energy sources from those which make pur-chases below the average. This removes the system set up under the EFL,whereby the costs borne by local network operators could only be passed on totheir own consumers. This socialization of costs is administered by the networkoperators themselves, with the law enabling network operators to require eachother be independently audited to assess the actual costs of purchasing renew-able electricity (Bechberger and Reiche 2004).
The EEG also changed the mechanism for calculating the base price paid for wind-generated electricity. The previous flat payment of 90 per cent of the final con-sumer tariff is replaced by initial fixed payments of €0.088/kWh for the first fiveyears, with the potential for an extension of this period dependent on the actualperformance of the turbine. Wholesale electricity prices in Germany are typically€0.02/kWh.
This has the effect of producing a scale of payment dependent on the quality ofthe location of the wind turbine and, it is hoped, ensuring that efficiently oper-ated turbines can be run profitably, while inefficiently run turbines can not. Theeffects of this may well be an increase in the number of sites that can be prof-itably operated, and, it is speculated, may act to increase the further penetration
MODULE 9: RENEWABLE ENERGY: REGULATORY AND POLICY OPTIONS
page 9.59

of turbines to sites further from the coast. Regardless of when the higherpayments cease, the turbines should, at least in theory, continue to be paid ata rate of €0.059/kWh for a minimum period of twenty years. Whilst the lowerrate is below that paid under the old EFL mechanism, which had dropped toaround €0.08/kWh by early 2000, the initial higher rate exceeds it significantly.This approach should act to provide more of a return during the early stages ofturbine operation, thus aiding in obtaining capital. Turbines already in operationwill also switch to the new tariff scheme, though with an amendment to reflecttheir status as already having received some subsidy.
The EEG also draws offshore wind projects into the payment mechanism specif-ically, placing support for offshore installations alongside onshore projects, butwith the initial rate of €0.088/kWh available for the first nine years of operation.It would appear that the nearest distribution network owners to offshore instal-lations will be compelled to provide connection to the national grid, as withonshore installations (German Federal Environment Ministry, 2000). As withonshore wind, the network operators will be reimbursed for costs under theequalization provision of the EEG. The EEG is estimated to add €0.001/kWh toGerman electricity prices.
The results of the new law were positive and expansion of German wind energycapacity has continued up to 2004. However, the mechanism has been subjectto a much-delayed review since January 2003. The result is likely to see furtherchanges in the level of tariff paid across the board for renewably generated elec-tricity. Current proposals would see a slight drop in onshore payments, from€0.088/kWh to €0.087/kWh guaranteed for the first five years, with €0.055thereafter instead of €0.059. Offshore wind would receive a slightly higher tar-iff of €0.091/kWh with a guaranteed availability of twelve years instead of nineprovided turbines are in place by 2010. Turbines already installed are subjectto the tariff in place when they were first brought online. Such guarantees areimportant for ensuring the security of income and to avoid discouraging newinvestment.
Those technologies which are currently less mature receive different rates thanwind. The highest rate is currently that paid to photovoltaic generation of elec-tricity, which currently attracts compensation of €0.434/kWh. Other technolo-gies currently attract similar rates to onshore wind energy. Lindenberger andSchulz estimate that the overall costs of the EEG will rise as shown in table 1.It should be noted that these figures do not take into account the implicit costsavings relating to electricity purchase from sources which are displaced bythe RE sources. Nor do they take into account any system costs and benefitsassociated with the operation of increased distributed generation on electric-ity networks.
SUSTAINABLE ENERGY REGULATION AND POLICYMAKING TRAINING MANUAL
page 9.60

5. OTHER MECHANISMS TO SUPPORTRENEWABLES IN GERMANY
Initial efforts in German RE policy were also aided with the application of capi-tal grants in the period 1990-1996. Efforts are currently being assisted with theuse of two tax-related instruments:
� Income tax relief: the Income Tax Enforcement Decree allows a deductionto be made against production costs resulting from investment in RES inbuildings.
� Ecological tax reform: this increases taxes on various motor fuels and on elec-tricity. This benefits biofuel production, though adds costs to electricity fromrenewable energy sources, due to the difficulty in differentiating such elec-tricity once it is in the system. To compensate for this, the German Governmenthas introduced the Market Incentive Programme, which acts to provide invest-ment subsidies and additional low-rate loans to various renewable sources.(Bechberger and Reiche 2004).
The central mechanisms for the support of renewable energy in Germany are fur-ther bolstered by various other mechanisms at the regional level. Since the 1990sthese have included additional low-rate loans and other investment subsidiesavailable within specific regions.
MODULE 9: RENEWABLE ENERGY: REGULATORY AND POLICY OPTIONS
page 9.61
Table 1. Projected annual subsidy within the EEG
Hydropower Windpower Biomass PV TotalYear Mio € Mio € Mio € Mio € Mio €
2000 348 692 67 17 1125
2001 426 952 132 30 1540
2002 443 1565 170 54 2232
2003 460 1993 201 76 2731
2004 476 2331 232 98 3137
2005 493 2598 263 118 3472
2006 510 2822 293 137 3762
2007 527 3040 323 155 4045
2008 544 3263 353 172 4331
2009 560 3502 382 189 4633
2010 577 3764 412 205 4957
Source: Lindenberger and Schulz, 2003.

6. CONCLUSION
The German feed-in laws and associated mechanisms have been very successfulat stimulating growth in wind energy deployment. The early phases of these lawscould be criticized for having imposed high costs on consumers although subse-quent revisions have reduced the level of subsidy and hence costs.
7. REFERENCES
Anderson, D. (1995). Renewable Germany – The German ESI and Renewables Policy. MiltonKeynes, Open University.
Bechberger, M. and D. Reiche (2004). “Renewable Energy Policy in Germany: Pioneeringand Exemplary Regulations.” Energy for Sustainable Development 8(1): 47-57.
Corporate Information (1999). Germany – Industry Overview : Electric Power Companies,Corporate Information.
German Federal Environment Ministry (2000). Act on Granting Priority to Renewable EnergySources (Germany) (Renewable Energy Sources Act. Berlin, Federal Ministry for theEnvironment, Nature Conservation and Nuclear Safety: 29.
German Federal Environment Ministry (2003). Indicative Target of the Federal Republic ofGermany for the Consumption of Electricity from Renewable Energy sources in 2010and Measures to Achieve that Target. Berlin: 14.
Knight, S. (2000). New Law Aims to Double Renewables. Windpower Monthly. 16: 20-21.
Köpke, R. (2004). Wheeling and Dealing. New Energy. 1: 12-13.
Lindenberger, D. and W. Schulz (2003). Entwicklung der Kosten des Erneuerbare-Energien-Gesetzes. Köln, Energiewirtschaftliches Institut an der Universität zu Köln: 16.
Mallon, K. (2000). The Liberalisation of Europe’s Electricity Markets – Is the EnvironmentPaying the Price for Cheap Power?, Greenpeace International: 50.
WPM (2004). Operating Wind Power Capacity. Windpower Monthly. 20: 66.
SUSTAINABLE ENERGY REGULATION AND POLICYMAKING TRAINING MANUAL
page 9.62

MODULE 9: RENEWABLE ENERGY: REGULATORY AND POLICY OPTIONS
page 9.63
Case study 2.
SPAIN: SUPPORT MECHANISMSFOR WIND ENERGY
CONTENTS
1. Introduction 9.65
2. Governance of Spanish policy 9.652.1. Spanish renewable energy policy 9.662.2. Changes to Spanish policy 9.67
3. Conclusion 9.68
4. References 9.69


1. INTRODUCTION
Spain is the country that has seen the greatest expansion of wind energy utiliza-tion of recent years. Spain currently has the second largest installed capacity ofelectricity generated from wind, with a capacity of 5780 MW installed by late2003, with the large majority of this expansion occurring since 1995. The mainexpansion of Spain’s wind generation occurred following the introduction of atariff mechanism in 1994. The level of this expansion is demonstrated in table 1:
MODULE 9: RENEWABLE ENERGY: REGULATORY AND POLICY OPTIONS
page 9.65
Table 1. Spanish installed wind turbine capacity
Year MW
1995 115
1996 221
1997 512
1998 834
1999 1530
2000 2099
2001 3335
2002 4830
Late 2003 5780
Spain began the 1990s with a stated target for further installation of wind energyequal to 275 MW of capacity to be in place by 2000. This objective was exceededin 1997. The current target for wind in Spain is to have 8974 MW installed by2010, as part of the effort to reach the 12 per cent target for renewable energyset by the European Union (McGovern 2000). In general, estimates of likely ratesof expansion have fallen short of the actual rates. The IEA, for example, expectedthat installed capacity could be as high as 750 MW by 2000 in a report publishedin 1998 (IEA, 1998), the same year that figure was actually exceeded.
2. GOVERNANCE OF SPANISH POLICY
Responsibility for Spanish policy relating to renewable energy lies with theInstitute for the Diversification and Conservation of Energy, (Instituto para laDiversificación y Ahorro de la Energía—IDAE), a “semi-autonomous” organizationoperated through the Ministry of Industry.

The main regulatory body for all energy sources in Spain is the National EnergyCommission (Comisión Nacional de Energía—CNE). CNE is attached to the Ministryof Economy. It acts to set budgets, to ensure that licences are complied with andto settle any disputes arising from regulation. CNE is responsible for oversightof the legislatively mandated payments made to renewable energy sources.
2.1. Spanish renewable energy policy
Spanish policy at the national level has been founded on the twin pillars of aREFIT-style subsidy scheme and of generous capital subsidies. However, regionalpolicies have also played an important role in both making wind energy projectseconomic and in encouraging the growth of new turbine manufacturers.
One important aspect of Spanish law, which already favoured renewables in themid 1990s, was the existence of an obligation introduced in 1987 via RoyalDecree, on distribution companies to purchase all electricity from independentpower producers at a fixed rate. The intended effect of this being to minimizeany problems that Spanish wind turbine owners might face from utilities hostileto the use of renewables.
Spanish wind energy development, and renewable energy development gener-ally, is under the purview of a national renewable energy plan, which forms oneaspect of the Energy Savings and Efficiency Plan (PAEE).
A wide-ranging national policy on renewables effectively began in 1994 with RoyalDecree 2366/1994. This formed the legal basis for the provision of feed-in tariffsfor electricity from renewable sources with a capacity under 100MW. The decreeinstituted a tariff at a rate of 80-90 per cent of the average final consumer pricepaid for electricity, with the specific rate calculated on an annual basis. Until thelate 1990s this was typically calculated to equal 88.5 per cent. In 1994, applica-tion of this rate amounted to an increase in the tariff available to wind from the10 peseta/kWh (€0.063/kWh) rate typically paid to IPPs, up to 11.57 pta/kWh(€0.073/kWh). The tariff was guaranteed to be paid for a five-year period in orderto provide increased stability to the market and to thus help encourage investment.
A 1997 adjustment altered the payment scheme, effectively offering developersa choice of two payment schemes. They could opt to receive either a fixed price,in 1997 this being equal to €0.066/kWh, or a variable price based on the aver-age price paid by consumers for all electricity consumed domestically in Spain,plus an environmental bonus. In 1997 this variable price worked out to€0.034/kWh, with an environmental bonus of €0.032/kWh, making the two prac-tically the same, though this was not a matter of deliberate policy (WindDirections 1999). This figure was also intended to include a consideration for
SUSTAINABLE ENERGY REGULATION AND POLICYMAKING TRAINING MANUAL
page 9.66

those avoided costs for the distributor, which would otherwise be incurred in theprocess of purchasing from traditional large-scale generators (Cerveny and Resch,1998). Controversially, the payment was reduced, by an average of 5.48 per cent,at the end of 1999 as part of a round of government cuts (WPM 2000).
The adjustment made in 1997, introduced as part of a general electricity lawthrough Royal Decree 54/1997, included the codicil that the new payment regimewould apply only to those installations with a maximum generating capacity of50 MW. Any problem which this might have presented to new large-scale proj-ects appears to have been circumvented through the breaking down of projectsinto pieces resulting in components with generating capacities less than this limitand presenting them as being separate, even where they are practically adjacent.Further regulation concerning payments stems from Royal Decree 2818/1998.
In addition to the creation of a REFIT-style support mechanism, the 1994 decreealso divided electrical distribution from generation as well as establishing a mora-torium on nuclear plant construction. Alongside the REFIT-style mechanism forsubsidizing electrical production from wind generators, there is a second policypillar aimed at supporting growth in the use of wind energy, and growth of anindustry to exploit it. The IDAE oversees the allocation of capital grants to proj-ects intending to install less than 20MW of wind turbine capacity, with publiccapital invested with the aim of attracting private capital to meet the majority ofany costs.
In 1997, IDAE made US$ 70.6 Million available to such projects, offering up to40 per cent of costs. Funding was announced to be preferred for those projectsin remote areas with poor levels of grid connectivity.
2.2. Changes to Spanish policy
The Spanish government has proposed changes to the way that wind is subsi-dized in Spain in 2004. The new law will see the premium option—where the pay-ment is related to the electricity market price—changed to instead offergenerators the chance to trade on the open market for electricity. The price theyachieve will then be supplemented with a premium payment equal to 40 per centof the electricity sector’s average billing price per kWh for the entirely of its sup-ply for the year (known as the Average Electricity Tariff—AET). (McGovern 2004).The total cost for electricity in Spain in 2002 was around €0.13/kWh before taxand €0.155/kWh after tax. (Eurostat 2003)
The fixed price choice is also subject to change. The subsidy available had previ-ously been held between 80-90 per cent of the AET, tending towards the 90 per centfigure. However, there always remained the potential for a review to see this
MODULE 9: RENEWABLE ENERGY: REGULATORY AND POLICY OPTIONS
page 9.67

reduced to 80 per cent, with obvious economic implications for investors. Thenew law will fix payments at 90 per cent of the AET for the first five years of plantoperation, dropping to 85 per cent for the next ten years and then 80 per centfor the remainder of the plant’s life. This new set-up is intended to stabilize secu-rity of investment in new projects.
A third option allowing generators to stick with the old arrangements will alsobe open to generators until 2007.
It is likely that the market option will allow companies more revenue, though withfewer guarantees than are available with the fixed price option due to the riskthat the generator may not be able to sell its electricity. The mixture of mecha-nisms in this way allows generators to choose the support that best suits theirproject, as well as allowing the Spanish Government to incentivize companiestowards acting competitively and removing the prioritization of the electricity fromrenewable sources and thus reducing the level of interference that they offer tofree market trading of electricity generally. Effectively, having the choice will allowgenerators to take into account their own need for security of revenue againstthe potential for greater revenue at greater risk. It is likely that generators willhave the opportunity to switch between options on an annual basis.
The viability of the market scheme will depend on how capable the generatorsprove to be within the market, as well as on the particular conditions applicablewithin the market relating to the ability of the wind generators to effectivelydeliver power to a schedule, and the penalties that apply for failure to do so.What these conditions will be are not yet clear.
3. CONCLUSION
Using a feed-in scheme plus some other support systems, Spain has been suc-cessful in increasing its wind energy utilization. The changes announced in 2004will bring in a hybrid support scheme that offers a middle way between feed-in/tariff schemes and obligation/certificate schemes, that is likely to be of inter-est to many other countries looking to balance the costs and benefits of eachtype of support mechanism.
SUSTAINABLE ENERGY REGULATION AND POLICYMAKING TRAINING MANUAL
page 9.68

4. REFERENCES
Cerveny, M. and G. Resch (1998). Feed-In Tariffs and Regulations ConcerningRenewable Energy Electricity Generation in European Countries. Vienna,Energieverwertungsagentur (E.V.A.).
Eurostat (2003). Electricity Prices for EU Households on 1 July 2003. Luxembourg,Eurostat.
IEA (1998). Spain. Renewable Energy Policy in IEA Countries - Vol.2: Countryreports. Paris, OECD:: 187-194.
McGovern, M. (2000). A Grand Scale Renewables Strategy. Windpower Monthly.16: 3, 27-30.
McGovern, M. (2004a). Guarded Welcome to New Support System. WindpowerMonthly. 20: 1, 25-26.
McGovern, M. (2004b). Spain’s Tariff Options: Moving Towards Market Realities.Windpower Monthly. 20: 31-34.
Wind Directions (1999). Boom Continues in 1999. Wind Directions. 18: 4, 3.
WPM (2000). Government Cuts Wind Tariff in Spain. Windpower Monthly. 16: 2,pp. 19.
WPM (2001). Operating Wind Power Capacity. Windpower Monthly. 17: 4, pp. 46.
WPM (2004). Operating Wind Power Capacity. Windpower Monthly. 20: 1, pp. 66.
MODULE 9: RENEWABLE ENERGY: REGULATORY AND POLICY OPTIONS
page 9.69


MODULE 9: RENEWABLE ENERGY: REGULATORY AND POLICY OPTIONS
page 9.71
Case study 3.
DENMARK: SUPPORT MECHANISMS FOR WIND ENERGY
CONTENTS
1. Introduction 9.73
2. Initial policies for Denmark 9.73
3. The Law for Wind Turbines 1992 9.74
4. Energy regulation in Denmark 9.75
5. Changes in Danish energy policy 9.75
6. Conclusion 9.78
7. References 9.79


1. INTRODUCTION
Denmark can be regarded as a leader in both policies to increase the generatingcapacity of wind energy, and in the manufacture of wind energy technology. Itcurrently has enough capacity in place to generate 18 per cent of its electricityin an average wind year.
Denmark has a long history of utilizing wind energy for energy generation pur-poses. Both World Wars saw Denmark develop electricity generation as a substi-tute for the fossil fuels to which it lacked access. The late 1970s and 1980s sawDemark look to wind energy again as a possible energy source which wouldenable it to take more control over its energy security and reduce the environ-mental impact of its energy use. Government efforts in R&D were matched withan interest from an environmental movement seeking an alternative to nuclearpower. This led to both a grass roots movement interested in developing the tech-nology and government policies to encourage the use of wind generators.Increases in Danish wind energy capacity are shown in the table.
2. INITIAL POLICIES FOR DENMARK
MODULE 9: RENEWABLE ENERGY: REGULATORY AND POLICY OPTIONS
page 9.73
Table 1. The Danish domestic market, 1983-1990
MW capacity – Denmark Number of turbines sold to Year domestic market sales Danish domestic market
1983 20.6 919
1984 7.2 216
1985 23.1 326
1986 31.7 358
1987 33 311
1988 82 457
1989 65.7 469
1990 81 432
As Danish capacity was produced domestically, sales can be taken to correlatewith total installed capacity in those years. (FDV, 1999)
Karnøe attributes this growth to the following changes in the national institu-tional set-up that acted to increase the profitability of wind power projects:

(a) The increased reimbursement of energy excise tax (1984) due to fallingoil prices.
(b) New prices for sales to the grid.
(c) A 20 per cent direct subsidy to dispersed installations (reduced from30 per cent) but a 50 per cent subsidy to installations in wind farms.
(Karnoe, 1990)
3. THE LAW FOR WIND TURBINES 1992
The Law for Wind Turbines, enacted in 1992, was the first Danish policy to intro-duce a full subsidy mechanism. It established a fixed tariff rate to be paid by theutilities for any wind generated electricity.
The Act also formalized the allotment of responsibility for meeting the costs ofgrid connection for wind turbines, an issue that had previously engendered con-siderable controversy. The law stipulated that turbine owners would henceforthbe responsible for costs of grid connection, with the distribution utilities respon-sible for strengthening the grid so that the connection was workable. In fact, thisactually set up a system of shallow connection charging with utilities having tostrengthen the grid in the specific area in which the wind farm was to be con-structed, and thus bearing the majority of the cost burden. While the agreementoriginally applied only to turbines under 150 kW, then under 250 kW, it was laterrelaxed to apply across the board (Gipe, 1995).
The Act fixed the amount the utilities had to pay for wind-generated electric-ity at 85 per cent of that charged to a local, average retail consumer with anannual consumption of 20,000 kWh. This amounted to €0.044/kWh, but tur-bines received up to DKK €0.081/kWh by the end of the scheme in 2000 asthe result of the addition of a CO2 tax compensation of €0.014/kWh and anenergy tax compensation of €0.022/kWh (Kjær, 1999). This price compareswith the price of €0.028/kWh that electricity could attract with the Nordicpower exchange in 2003.
Further measures to increase the available sites include a Government mandateto each region. This has resulted in the identification of more potential onshoresites than was expected, with the likelihood that these will be developed in thenext few years.
SUSTAINABLE ENERGY REGULATION AND POLICYMAKING TRAINING MANUAL
page 9.74

4. ENERGY REGULATION IN DENMARK
The regulatory structure for the electricity sector in Denmark is shown in figure Ibelow. The Energy Authority regulates the distribution network operators (DNOs)and deals with any complaints. The Minister grants licences. The system opera-tors are responsible for prioritization relating to renewables on the grid and forbalancing the system.
MODULE 9: RENEWABLE ENERGY: REGULATORY AND POLICY OPTIONS
page 9.75
Figure I. Regulatory governance bodies within the Danish electricity supply sector
Ministry ofEconomic and
Business Affairs
The EnergyAuthority
The CompetitionAuthority
System operator (SO)
The Energy Supervisory Board
Grid companies(distribution and
transmission)
Supply committedcompanies
Production companies(M 25 MW)
The Energy Complaints Board
5. CHANGES IN DANISH ENERGY POLICY
Danish energy policy, including that relating to wind energy and other renewableenergy sources was brought up to date with Energy21, published in 1996. Thislaid down Danish targets for onshore wind energy of 1500MW to be in place by

2005 (Danish Energy and Environment Ministry, 1996). Danish onshore capacitymoved beyond the projected 1500 MW onshore capacity in 1999 (WPM, 2000).Additional capacity gains are being made as smaller turbines are replaced withlarger ones. Energy21 also laid down an offshore wind target of 4 GW. Denmarkcurrently has the world’s largest offshore farm, 160 MW at Horns Rev and hasgranted contracts for a number of others to be constructed.
Fixed-price tariffs remained as the central pillar of subsidization until 1 January2000, when they were set to be displaced by a renewable portfolio standard(RPS). In addition to the higher price paid during the life of the tariff, wind wasalso exempted from—or rather compensated for—the imposition of energy andCO2 taxes. Both of these measures helped to make wind more competitive withrespect to conventional electricity generators.
However, the attempted adoption of the market-based RPS undermined the per-ceived security of investment in wind energy in Denmark. Sales of turbines imme-diately dropped to zero in 2000, threatening both Danish targets for renewableinstallation and the Danish manufacturing industry, which had come to dominateits domestic market sector.
At this point it is worth noting that the Danish turbine manufacturing industry,with the advantages it gained from its historical experience and a bottom-upapproach to developing its technology was best placed to capitalize on the con-tinuous expansion of the worldwide wind energy industry in the 1990s. The windturbine manufacturing industry is now Denmark’s third largest export industry.Also, aside from wind energy Denmark relies on coal for much of its energy andso has relatively high greenhouse gas emissions on a per capita basis.
The Danish Government could not afford to ignore either the undermining of thehome market for wind or the effect this would have on Danish environmentalcommitments. The Government rapidly readopted the tariff-based mechanism in2001, albeit with some changes to reflect the improved nature of the technologyand to reduce the rising level of overall costs within the tariff mechanism. A par-liamentary hearing in September 2001 led the Government to conclude that re-attempting to adopt the RPS mechanism was impracticable at that stage.
After 2001, the reformed support mechanism for wind energy in Denmark pro-vided a fixed price system with an environmental premium per kWh in additionto the market electricity price. The system became somewhat more complex asthe result of efforts to cut down on the overall costs of subsidies to wind.Settlement prices changes such that they had several components:
� Base Price: €¢4.42/kWh. In cases where turbines were no longer entitled tothe base price, they were effectively compelled to seek a price on the market.
SUSTAINABLE ENERGY REGULATION AND POLICYMAKING TRAINING MANUAL
page 9.76

� Subsidy 1: €¢1.34/kWh
� Subsidy 2: €¢2.28/kWh
� Special Price: By arrangement
� Green Certificates: Subject to the future development of a green market. Untilthat point entitlement to subsidy 1 as a default position.
Entitlement to each of these components is related to ownership, plant capacity, plantage and historical plant output. An overview of entitlement is shown in table 2.
MODULE 9: RENEWABLE ENERGY: REGULATORY AND POLICY OPTIONS
page 9.77
Table 2. Settlement of wind turbines
Settlement price
Utility owned
Grid connected before January 1, 2000 Market price plus a variable subsidy adding up to 8.04 €-cents. An upper limit of the variable subsidy of6.43 €-cents has been imposed. Grid connected afterJanuary 1, 2000 The base price, subsidy 1 and 2 are givenuntil further notice.
Owned by collective supply companies
Grid connected before January 1, 2000 Subsidy 1 is given until further notice
Grid connected after January 1, 2000 The base price, subsidy 1 and 2 are given until furthernotice.
Non-utility owned
Existing turbines Turbines less than 10 years old are entitled to the baseprice and subsidy 1. The base price and subsidy 1 weregiven as a minimum until January 1, 2003.
Furthermore, subsidy 2 is given until the full-load hoursshare has been used but not later than 2012. If the fullload share has not been used within 10 years the subsidyis reduced to 1.34 €-cent/kWh.
Turbines that are no longer entitled to the base price, sub-sidy 1 and 2 are entitled to Green Certificates.
New turbines connected to the grid Base price until 22,000 full-load hours have been produced.before December 31, 2002 In addition, the turbines are entitled to green certificates.
New turbines connected to the grid Green certificatesafter December 31, 2002
Offshore turbines Base price, subsidy 1 and 2 until further notice.
Source: Techwise, 2002.
Notes: 1) “Until further notice” means until the European Commission has defined new rules forgrid connection and settlement of renewable production facilities. 2) Collective supply companiesare defined as: Distribution companies, Supply-committed companies, Transmission Companiesand SR-Companies. 3) Existing turbines are defined as turbines bought on a binding contract beforeDecember 31, 1999 and which are requested to be grid connected before August 21, 2000. 4) Thefull-load hour share is defined as 25,000 hours for turbines with a capacity of 200 kW or less,15,000 hours for turbines with a capacity between 201 and 599 kW and 12,000 hours for turbineswith a capacity in excess of 600 kW.

The average domestic electricity price in Denmark for small-scale consumers in2003 was €0.2558/kWh after tax, making it the most expensive in the EuropeanUnion. However domestic energy use is heavily taxed in Denmark and the pre-tax price of €0.134/kWh is comparatively low for the EU. (Eurostat, 2003) Theprices available within the tariff were effectively 30 per cent lower for new tur-bines than the prices paid for turbines already generating. (ECN, 2003).
It was planned that Denmark would attempt to switch over to a green tradingmechanism from 1 January 2003, however, this deadline was not met, and insteada scheme wherein wind turbines erected after 1 January 2003 receive the marketprice plus ~€¢1.34/kWh was instituted. The scheme includes a maximum allow-able price of €¢4.83/kWh. Turbines that qualify for the subsidy are eligible toreceive it for up to twenty years. (Techwise, 2002).
Electricity from biomass maintains the feed-in tariff of 8.1 ct/kWh. The premiumfor renewables is financed as an addition to the electricity price per kWh, sharedequally among all electricity consumers in relation to their electricity use. Theresult of the return to the more stable tariff mechanism was a boom year forinstallation and sales of wind turbines in Denmark, with over 400 MW ofincreased wind capacity.
Denmark typically has a spinning reserve1 of around 20 per cent of the load andthis has generally been sufficient to cope with any fluctuations in the output ofwind power. Interconnection with Norway and Sweden, both with large amountsof hydropower has proved to complement the Danish system, with output fromhydropower easily able to be altered to respond to windpower output.Nevertheless Denmark has had to be at the forefront of developing new technol-ogy to deal with balancing the distribution and transmission grids with high lev-els of intermittent generation. Neilsen gives consideration to the technicalproblems associated with this (Neilsen, 2002a; Neilsen, 2002b).
6. CONCLUSION
The Danish renewables support mechanisms have led to the substantial devel-opment of wind power and its use of feed-in type mechanisms (with guaranteedprices and connection agreements) has also favoured small-scale wind develop-ment much of which was undertaken through community ownership. Even in 2004
SUSTAINABLE ENERGY REGULATION AND POLICYMAKING TRAINING MANUAL
page 9.78
1Generating capacity which is currently unused but is synchronized with the network such that it canbe brought on line to respond to system needs instantaneously.

around 75 per cent of wind power in the country is produced by turbines ownedby communities and individuals. Attempts to change the mechanisms havecaused setbacks and the current (2004) system can be seen as attempting toincorporate elements of feed-in and certificate/obligation systems to overcomethe disadvantages of each.
REFERENCES
Danish Energy and Environment Ministry (1996). Energy 21. The Danish Government’sAction Plan for Energy 1996. Copenhagen, Miljobutikken.
ECN (2003). Renewable Electricity in Europe.
Fact sheets: Denmark 2003. Amsterdam, ECN.
Eurostat (2003). Electricity Prices for EU Households on 1 July 2003. Luxembourg, Eurostat.
FDV (1999). Table 1: Sales of Danish Wind Turbines – Power Rating in Megawatts, DanishWind Turbine Manufacturers Association. 2000.
FDV (1999). Table 2: Sales of Danish Wind Turbines – Number of Units, Danish Wind TurbineManufacturers Association. 2000.
Gipe, P. (1995). Wind Energy Comes of Age. New York, John Wiley & Sons.
Karnøe, P. (1990). “Technological Innovation and Industrial Organization in the DanishWind Industry.” Entrepreneurship & Regional Development 2: 105-123.
Kjær, C. (1999). That was Then - This is Tomorrow. Windpower Monthly. 15: 34-39.
Neilsen, J. E. (2002a). Review of Technical Options and Constraints for Integration ofDistributed Generation in Electricity Networks. Amsterdam, Eltra/ECN: 98.
Neilsen, J. E. (2002b). Review of the role of ICT (Information and Communication Technology)in Network Management and Market Operations. Amsterdam, Eltra/ECN: 52.
Techwise (2002). Review of Current EU and MS Electricity Policy and Regulation – Denmark.Copenhagen, Techwise: 45.
WPM (2000). Operating Wind Power Capacity. Windpower Monthly. 16: 62.
MODULE 9: RENEWABLE ENERGY: REGULATORY AND POLICY OPTIONS
page 9.79


MODULE 9: RENEWABLE ENERGY: REGULATORY AND POLICY OPTIONS
page 9.81
Case study 4.
RENEWABLE ENERGY IN GHANA
CONTENTS
1. Background 9.831.1. Energy generation 9.831.2. Transmission and distribution 9.841.3. Energy consumption 9.85
2. Energy regulation in Ghana 9.872.1. Institutional structure of the energy sector 9.872.2. Status of energy sector reforms, current policies 9.892.3. Rural electrification 9.90
3. Renewable energy 9.933.1. Biomass 9.943.2. Solar electricity 9.953.3. Solar thermal technology 9.983.4. Wind energy 9.983.5. Mini/micro hydro generation 9.99
4. Conclusions 9.101
5. Key recommendations 9.103


1. BACKGROUND
1.1. Energy generation
Ghana’s first major generation project was the Akosombo hydroelectric dam, com-missioned in 1965 with an initial output of 588 MW. Prior to this, several smalldiesel plants were in operation, providing services to local communities, mines,industries, hospitals and educational institutions around the country. Thesesmaller and more expensive plants were phased out as cheap electricity gradu-ally became available through the national grid. Power output from Akosombowas increased to 912 MW in 1972; followed in 1982 by the addition of 160 MWfrom a second hydroelectric plant located at Kpong, downstream from Akosombo.
In 1998, poor rainfall in the catchment area of the Akosombo dam led to sharplyreduced output from the plant, and two foreign companies, Cummins Ltd. andAggrekko Ltd. were contracted to run two 30 MW diesel power plants to feedpower directly into the national grid. These plants were classified as “EmergencyPower Producers” and were eventually shut down in 2000 when the electricitysupplied by Volta River Authority (VRA) increased to normal levels. However, a30 MW diesel plant, commissioned in 1992, is run by VRA in Tema.
Further expansion took place in 1999 with the completion of a 330 MW-combinedCycle Thermal Plant at Aboadze in south-western Ghana. Output at the Aboadzeplant was increased in 2000 with the addition of a 220 MW simple cycle thermalgenerator using waste heat from the original turbines. The expanded plant isjointly owned by the Volta River Authority and CMS Energy of Michigan, USA. In2000, the Government purchased a 125 MW power barge to generate electricityfrom natural gas from the Tano fields but this is yet to be commissioned. Table 1shows the installed capacity of electricity generating plants in the country in 2005.
MODULE 9: RENEWABLE ENERGY: REGULATORY AND POLICY OPTIONS
page 9.83
Table 1. Installed capacity of generating plants (2005)
Generation plants Type of plant Fuel Capacity (MW)
1. Akosombo Hydro Hydro 1,038
2. Kpong Hydro Hydro 160
3. Takoradi thermal plant Thermal LCO/gas 330
4. TICO (CMS/VRA Thermal LCO/gas 220plant at Takoradi)
5. Tema diesel plant Thermal Diesel 30
Ghana’s electricity grid is interconnected with those of the neighbouring countriesof Benin, Burkina Faso, Côte d’Ivoire and Togo. Before 1995, Ghana had a surplus

of electric power, allowing VRA to export electricity to Compagnie Ivoirienned’Électricité (CIE) of Côte d’Ivoire and Communaté Électrique du Bénin (CEB) ofTogo and Benin. However, as demand grew within Ghana, the country began toface an electricity deficit. VRA now augments electric power supply by buying fromCôte d’Ivoire, which has expanded its generation capacity. VRA imports up to 250 MWof power from Côte d’Ivoire, and transmits power onwards to Togo and Benin.
Power purchases from CIE have been mixed, with VRA having to import morepower during times of crises, for example, during the 1998 drought, which led toa drastic fall in hydro-capacity from Akosombo. Table 2 below shows the sourceof power supply by VRA to the Ghanaian market in 2005.
SUSTAINABLE ENERGY REGULATION AND POLICYMAKING TRAINING MANUAL
page 9.84
Table 1. Power supply to the Ghanaian electricity market by VRA in 20031
Generation source Electricity generated (GWh)
Hydro 3,884
Thermal 2,015
Purchased from CIE 940
Total 6,839
1VRA Annual Report, 2003.
There is also some standby generation capacity available. Notably, mining com-pany Anglogold-Ashanti has a 21 MW diesel plant at Obuasi, and the Tema OilRefinery operates a 6.5 MW diesel plant at Tema. The Volta Reservoir receivedsubstantially above-average inflows during 1999, enabling output from Akosomboand Kpong to be raised from 3,830 GWh in 1998 to 5,169 GWh in 1999. By 2003,the water level in the lake fell again to as low as 237 feet in July and about 247feet in November. The minimum operating level of the dam is 248 feet.
1.2. Transmission and distribution
VRA owns and operates the nationwide transmission system and the distributionsystem for northern Ghana. The distribution system in southern Ghana is man-aged by the Electricity Company of Ghana (ECG). As of December 2003, the exist-ing transmission network system comprised of 36 substations and approximately4,000 km of 161 KV and 69 KV lines. This includes 129 km of double-circuit 161 KVinterconnection to Togo and Benin. There is also a single 220 km circuit, being a225 KV inter-tie with Côte d’Ivoire’s transmission network. The distribution systemcomprises 8,000 km of sub-transmission lines, 30,000 km of distribution networkswith 22 bulk supply points and 1,800 MVA of installed transformer capacity.

1.3. Energy consumption
In 2004, Ghanaians consumed a total of 5,158 GWh of electricity supplied by VRA.VRA has two main customers: the Volta Aluminium Company (VALCO), which isthe largest industrial customer, and ECG, the largest non-industrial customer. VRAalso supplies power to some mining concerns and other industries. In 2002,VALCO took up to 32 per cent of the power sold by VRA. Production at VALCOwas closed in May 2003, following a breakdown in negotiations between the gov-ernment and VALCO’s parent company Kaiser Aluminum at the end of VALCO’senergy contract. Extra electricity became available to VRA as a result of thesmelter shutdown. In October 2004 VALCO was bought by the Government ofGhana and subsequently reopened on a reduced scale in September 2005 undera joint venture agreement with the US company ALCOA.
ECG distributes power to households and industries in the heavily populatedsouthern part of Ghana. The utility presently has about 1.1 million customers, ofwhich about 80 per cent are residential and the remaining 20 per cent includeindustrial customers, the military, and other public facilities. The distribution net-work has relatively high losses of about 26 per cent, including about 15 per centnon-technical losses. This indicates that a significant amount of distributed poweris lost through illegal connections and wastage.
MODULE 9: RENEWABLE ENERGY: REGULATORY AND POLICY OPTIONS
page 9.85


2. ENERGY REGULATION IN GHANA
2.1. Institutional structure of the energy sector
The energy sector in Ghana is managed at different levels by the organizationsdetailed below. For simplicity, the various institutions are grouped under policy,regulatory, operational and support institutions. Some of their roles overlap—forexample the roles of the Energy Commission and the Environmental ProtectionAgency in licensing petrol filling stations.
Policy institutions
� The Ministry of Energy: As part of the executive arm of Government, theMinistry is the ultimate body responsible for development of energy policy forGhana. The ministry is responsible for developing and implementing energysector policy in Ghana, and also supervises the operations of the agenciesassociated with the sector.
Regulatory institutions
These include:
� The Energy Commission (EC): An independent agency responsible for licens-ing, regulating and monitoring private and public entities operating in theenergy sector. The commission also collects and analyses energy data andcontributes to the development of energy policy for Ghana. EC was establishedin 1997 in accordance with the recommendations of the Power Sector ReformsCommission (PSRC).
� The Public Utilities Regulatory Commission (PURC): An independent agency setup as recommended by the Power Sector Reforms Commission (PSRC) to over-see the performance of the public utilities. PURC is mandated to protect theinterest of consumers and to examine and approve the rates chargeable bythe utilities.2
� Environmental Protection Agency (EPA): Responsible for establishing, monitor-ing and enforcing environmental policies for the country. EPA has oversightresponsibility in any activity that is likely to have an environmental impact.EPA monitors the activities involved in the production and use of energy.
MODULE 9: RENEWABLE ENERGY: REGULATORY AND POLICY OPTIONS
page 9.87
2Public Utilities Regulatory Commission Act, 1997 (Act 538).

� National Petroleum Tender Board: Supervision of international competitivebidding and award of contracts for the procurement of crude oil and petro-leum products for Tema Oil Refinery.
Operational institutions
� The Volta River Authority (VRA): This wholly state-owned entity is responsiblefor generation and transmission of electricity in Ghana. VRA was establishedin 1961 under the Volta River Development Act (Act 46) to generate electricpower by means of the water in the river Volta, and to supply electricitythrough a transmission system.3
� The Electricity Company of Ghana (ECG): 100 per cent state-owned entityresponsible for distribution of electricity to consumers in southern Ghana,namely in the Ashanti, Central, Greater Accra, Eastern and Volta Regions.Established in 1967, ECG, the nation’s main electricity distributor, is respon-sible for providing line connection to domestic and certain categories of indus-trial consumers. ECG is responsible for billing and maintaining a reliablesupply of electricity to its customers.
� The Northern Electrification Department (NED): Established in 1997 as a sub-sidiary of VRA, it is responsible for power distribution in northern Ghana, serv-ing the Brong-Ahafo, Northern, Upper East and Upper West Regions.
� Tema Oil Refinery (TOR): Responsible for the importation of crude oil andpetroleum products. Also undertakes the refining of all the crude oil importedinto the country and bulk sale of petroleum products to OMCs and bulk con-sumers. TOR was incorporated in 1960 under the companies’ code of Ghana.
Support institutions
� The Energy Foundation (EF) Ghana: Established in November 1997 by thePrivate Enterprise Foundation in collaboration with the Government of Ghana,the Energy Foundation is a non-profit institution with the goal of promotingsustainable development and efficient consumption of energy as a key strat-egy to manage Ghana’s growing energy needs in a sustainable manner. TheFoundation offers energy efficiency and renewable energy advice and supportto residential, industrial and commercial energy consumers in Ghana.
� Ghana National Petroleum Corporation (GNPC): Established by law in 1983 topromote the exploration and development of petroleum resources in Ghana,4
GNPC is currently responsible for oil and gas exploration and production.
SUSTAINABLE ENERGY REGULATION AND POLICYMAKING TRAINING MANUAL
page 9.88
3The Forty-Sixth Act of the Parliament of the Republic of Ghana (The Volta River Development Act, 1961).4The Ghana National Petroleum Corporation Law (PNDC Law 64).

� Bulk Oil Storage and Transportation Company (BOST): Bulk Oil Storage andTransportation is a Government-owned, limited liability company that under-takes planning for storing and managing strategic stocks of petroleum prod-ucts. BOST runs several storage depots in the port cities of Tema and Takoradi,and in seven other locations around the country. In addition, BOST is respon-sible for primary distribution of the products. Funding for maintaining thereserves comes from a special levy on petroleum products.
� Oil marketing companies (OMCs) and retail outlets: The oil marketing compa-nies are responsible for distribution and marketing of petroleum products,mainly through small retail outlets countrywide.
2.2. Status of energy sector reforms, current policies
There have been a number of energy sector reforms in Ghana over the years,mostly focusing on the power subsector: expanding capacity and extending theelectrical grid across the nation and to smaller communities. These efforts havebeen largely successful and have led to the electrification of all district capitalsunder the National Electrification Programme. Although renewable energy has notfeatured prominently in the reforms, its role has largely been to supplement thenational grid by providing power as a stopgap measure and for providing elec-tricity to inaccessible communities.
The most recent energy sector reforms were started in 1997, when the World Bankindicated that support would no longer be provided for electricity projects indeveloping countries unless there was a clear commitment by the Governmentto reforming the sector. While the reforms were undertaken primarily to securean IDA credit for the construction of the 330 MW Takoradi thermal plant, therewas also a view to secure private participation in the development of future elec-tricity infrastructure. At the time that the reforms were instituted, there was verylittle external investment in energy, which led to poor quality service and poorfinancial performance by utilities. In broad terms, the reforms sought to achievethe main goals listed below:
1. Establish a new, effective regulatory framework;
2. Allow for competition in the generation and wholesale supply of power;
3. Commercialize existing state-owned power utilities, enhance their manage-ment and accountability, and secure private sector participation;
4. Unbundle the utilities;
5. Minimize the Government’s role and use of public resources in the sector, par-ticularly through subsidies;
MODULE 9: RENEWABLE ENERGY: REGULATORY AND POLICY OPTIONS
page 9.89

6. Use available public resources to improve the cost effectiveness of transmis-sion and distribution projects under the National Electrification Scheme.
These reforms were expected to lead to increased access to electricity in all sec-tors of the economy and increased efficiency in the delivery of power to con-sumers. Some achievements of the reforms include the conversion of theElectricity Corporation of Ghana into a limited liability company under theStatutory Corporations Act (1993). In addition, thermal power generation has beenopened up for private sector participation and competition. The expected influxof private investment to the electricity sector has not yet occurred, in spite of thehigh growth in demand and the need for additional capacity. So far, there hasbeen only one private sector power generation plant; the Takoradi InternationalPower Company (TICO), with a 220 MW capacity. It was constructed in 2000, andis owned jointly by VRA (10 per cent) and CMS Energy (90 per cent). It draws itssource from the Takoradi thermal plant, which is owned fully by VRA.
The reforms also led to the creation of a new classification of “bulk customers”by the Energy Commission. Beginning 2004, the EC defined bulk customers ofelectricity in the mining and manufacturing industries as those customers whoare able to negotiate power supply contracts directly with VRA and ECG or anyother licensed independent power producer with a framework of wheelingcharges and other guidelines determined by the PURC. This is expected to givesuch customers more flexibility and better pricing based on their high levels ofconsumption.
The power sector reforms have also led to the introduction of the EmbeddedGeneration Facility (EGF) concept. By definition, an EGF is a power generation unitsupplying power at low to medium voltage to an electricity substation within aparticular distribution system. For example, during the 1997-98 power crises, twoprivate companies—Aggreko Ltd. and Cummins Ltd.—each provided 30 MW powerfrom diesel generation sets directly into the 33 kV distribution network. TheEmbedded Generation Facility also allows for renewable energy power producersto supply power at local levels.
2.3. Rural electrification
Ghana’s Government embarked upon the Economic Recovery Programme (ERP) inthe 1980s. These reforms included the establishment of a National ElectrificationScheme (NES) in 1989 with the aim of providing nationwide access to electricityby 2020. Under this scheme all communities with populations above 500 were to have access to electricity. Over the years, funding for NES has beenmainly through grants, concessionary credit, government sources, and the
SUSTAINABLE ENERGY REGULATION AND POLICYMAKING TRAINING MANUAL
page 9.90
national electrification fund levy. The levy of ¢1.7/KWh (US¢ 0.02/KWh) is paidby grid electricity consumers and generates about ¢9.8 billion (US$ 1.1 million)per year. However, heavy donor reliance has meant that specific electrificationprojects have been undertaken only when funding became available.
An extension to the NES for rural electrification is the Self Help ElectrificationProject (SHEP). SHEP allows for the electrification of communities not directly cov-ered under NES but which are within 20 km of an existing or planned 11 kV or33 kV transmission line. The community is required to provide a certain minimumcontribution to the project, usually in the form of wooden poles for the distribu-tion wires. Government would then provide additional assistance to complete theproject. The average tariff for electricity for urban consumers is between 5.2-8.2 US¢/kWh, but rural subscribers pay about US$ 1.00 as a connection fee tothe electricity supplier and then a subsidized lifeline tariff of about $2.00/monthfor consumption of up to 50 KWh/month. This amounts to about US¢ 4.0/KWh.The extra costs for connecting rural communities (transmission, distribution andservice drop costs) are covered by Government under the NES.
Before the launch of NES in 1990, only 478 (11 per cent) out of 4,221 identifiedcommunities nationwide had access to electricity. Of the 110 district capitals atthe time, only 46 were on the national grid. Between 1991 and 1994, the initialphases of SHEP 1 and SHEP 2 were completed, with the connection of 50 and250 communities to the grid respectively. SHEP 3 was launched in 1995, and cov-ered almost 1,400 communities nationwide. By the end of 1999, all 110 districtcapitals were electrified; and over 450 communities (52 per cent) also had power.By 2004, 3,500 communities had access to power, representing 65 per cent ofthe total. Presently, all communities with populations greater than 3,000 are con-nected to the grid. As a result of the ongoing electrification scheme, access toelectricity in the country had reached about 48 per cent by 2003, which is amongthe highest in sub-Saharan Africa.
The rural electrification drive may receive a boost with the recent announcementby the Minister of Energy of the arrival of US$ 15 million worth of equipment,with an additional US$ 30 million earmarked to support the project.5 Also, theGovernment recently announced its intention to shift the focus of the NationalElectrification Scheme (NES) to ensure that rural communities used the suppliedpower to boost economic activities.6
So far, many rural communities have benefited from the available electric power,even though power supply to the rural areas has been unreliable with frequent
MODULE 9: RENEWABLE ENERGY: REGULATORY AND POLICY OPTIONS
page 9.91
5“All Set For Bui Dam To Take Off”, Daily Graphic, October 28, 2005. 6“Government To Shift Focus Of National Electrification Scheme”, Daily Graphic, Sept. 28, 2005.

power outages and low voltage situations. However, many households considerthe current electricity tariffs as unaffordable.7
SUSTAINABLE ENERGY REGULATION AND POLICYMAKING TRAINING MANUAL
page 9.92
7Amissah-Arthur, Jabesh; Anamuah Amonoo, Jojo. Study of the Social and Poverty Impacts of EnergyInterventions on Rural Communities in Ghana. Kumasi Institute of Technology (KITE), April 2004.

3. RENEWABLE ENERGY
Although several efforts have been made through feasibility and pilot pro-grammes, there has not been a concerted policy regime that specifically targetsrenewable energy technologies (RETs). Moreover, none of the electrification pro-grammes have included renewable energy as an alternative source of power. Thishas meant that renewables remain in the hands of individuals with little govern-ment support. In spite of the EGF facility introduced under the reforms, there isno process in place presently for individuals or cooperatives to feed the powergenerated from renewable energy systems into the national grid. Some of thesignificant initiatives with regards to renewables are outlined below.
The earliest effort to harness renewables came in the wake of the global energycrisis of the 1970s, when the Government of Ghana created a special committeeon energy resources. This marked the beginning of the Government’s interest indiversifying Ghana’s energy sources, and pursuing a developmental programmein renewable energy technologies.
In 1983, the Government instituted the National Energy Board (NEB) by enactinga law (PNDC Law 62). The Board was to oversee the development of renewableenergy resources. Also, NEB’s scope of activities spanned energy conservation(electricity and petroleum) and demand management. A total of 135 projects wereundertaken by NEB, 29 of them being in renewables.
The NEB was abolished in 1991, and until 1996 when another policy document wasput in place, the activities of NEB were carried out by the Ministry of Mines andEnergy. In 1996, the Energy Sector Development Programme (ESDP) was initiated.
Under the ESDP, the Renewable Energy Development Programme (REDP) was setup to promote the development of RETs and the renewables industry, as well asto build a database on renewable energy activities in Ghana. REDP supported anumber of biomass and solar energy projects.
ESDP has been the overall policy regime regulating the development of RE tech-nologies in Ghana to date. However, ESDP is to be replaced with the NationalRenewable Energy Strategy (NRES) being formulated with the support of theDanish International Development Agency (DANIDA). This is under the StrategicNational Energy Programme (SNEP), which is intended to dictate the direction ofthe development of energy in Ghana from 2000-2020.
The current energy policy document is the Strategic National Energy Programme.SNEP is projected to span a twenty-year period, 2000-2020. In 2003, a technol-ogy catalogue for SNEP was published, in which the goal of SNEP was stated as:
MODULE 9: RENEWABLE ENERGY: REGULATORY AND POLICY OPTIONS
page 9.93

“... to contribute to the development of a sound and well regulated commercialenergy market that will provide sufficient, viable, efficient and least cost energyservices for social welfare and economic activities through the formulation of acomprehensive plan that will identify the optimal path for the development, util-isation and efficient management of the country’s energy resources.”8
The document identifies the following RETs as viable projects that warrant attention:
� Solar water heaters;
� Biomass—charcoal kilns, sawdust briquetting, biomass gasification, palletiz-ing, biogas plants, pyrolysis;
� Grid/off grid solar systems;
�� Grid/off grid wind turbines;
� Off-grid small hydro;
� Landfill gas power plants.
Renewable energy contributes an insignificant part of electricity supply in Ghana.For example, by 2001, the estimated over 4,000 off-grid PV systems installednationwide had a total capacity of 1MW, compared to the grid capacity of over1,700 MW in 2003.9 Besides the major hydroelectric plants, electricity generatedfrom RETs is used at the individual household or institution level, and does notenter the supply grid. The different renewable energy technologies and accord-ing case studies in Ghana are described below.
3.1. Biomass
The combustion of biomass is the primary means of energy for most of theGhanaian population. In the rural areas, fuel wood for cooking accounts for57 per cent and charcoal 30 per cent of energy consumption. Charcoal is also thefuel of choice for cooking in the urban areas. Efforts in the renewable energy fieldhave focused on developing and deploying new technologies to make biomasscombustion safer and more efficient.
More advanced uses of biomass involve the conversion of biomass into otherforms before being used for energy generation. In ovens and furnaces, biomassis typically used in the form of charcoal, sawdust briquettes, and gas. Gas canbe generated directly for use in a gasification plant, or in a biogas plant. A smallnumber of biogas plants have been installed in Ghana, and the Kwame NkrumahUniversity of Science and Technology (KNUST) has built research prototypes ofviable biomass converters.
SUSTAINABLE ENERGY REGULATION AND POLICYMAKING TRAINING MANUAL
page 9.94
8Strategic National Energy Plan 2000-2020 Technology Catalogue, April 2003.9Electricity Sector Overview; Ghana Energy Commission.

At least three palm-oil mills have biomass-fired power plants for generating elec-tricity from palm fruit residues. These have a total generating capacity of 1.5 MW.Also, at least one sawmill runs a plant based on wood residue, while anothersuch plant lies abandoned.10 According to the technology catalogue of SNEP, thereare many commercial biomass cogeneration plants available in Ghana, operatingmainly in off-grid locations.
One of the most famous biogas projects in Ghana is the “Integrated Rural Energyand Environment Project” commissioned in 1990 at Appolonia in the Greater Accraregion. This pilot project was to produce biogas from human and animal waste,and the gas used to produce electricity and also for cooking. The system pro-vided electricity to five social centres, a school, 21 houses, and 15 streetlights.This project has shown itself to be unsustainable, and has come to a standstill.11
Recently, worldwide interest has been directed at biofuels. A promising plant isJatropha curcas, which grows in arid conditions and yields seeds that can beprocessed into biodiesel. This fuel has been shown to run in conventionalengines. Currently, a Jatropha oil-extracting project is running on a pilot basis inYaakrom in the Brong Ahafo region. In 2005, DaimlerChrysler and UNESCOannounced funding for a research project, Jatropha Energy Development for RuralCommunities in Ghana. The project will be undertaken by a team from KNUST andCambridge University and aims to establish a small-scale industry for the devel-opment of Jatropha diesel to serve rural communities.12 The authors are unawareof any company that offers any biomass technologies for sale at this time.
3.2. Solar electricity
Solar photovoltaics (PVs) are by far the most popular renewable energy applica-tion. Solar electricity has been shown to be technically viable, but due to thehigh initial costs there has not been a widespread application of PV systemsnationwide. PV systems have been used to provide electric power mainly forhealth centres and for homes. Some PV systems have also been installed forcommercial applications such as telecommunication repeater stations, waterpumping, and battery charging. Furthermore, the solar lantern is quite wellreceived, and had the cost been lower, would have been a viable competitor to thekerosene lantern. In the urban areas, PV systems are often used in electricity back-up systems in areas where grid reliability is low. Also, a few wealthy individualsinvest in PV systems for their homes in order to diversify their energy sources.
MODULE 9: RENEWABLE ENERGY: REGULATORY AND POLICY OPTIONS
page 9.95
10Renewable Energy Development Programme, Draft National Renewable Energy Strategy, Ministry ofEnergy, Energy Commission, and DANIDA. October 2003.11E. K. Ackom, Technical & Economic Viability Analysis of Renewable Energy Technologies in Ghana.PhD Thesis. Brandenburg University of Technology, 2005.12www.mondialogo.org/106.html

Currently, there are a number of private companies offering renewable energytechnologies and services in Ghana. Most of them are involved in solar electric-ity, and mainly sell to private urban households. The companies sell discretecomponents such as panels and balance of system (BOS) parts: batteries, invert-ers, chargers, solar lanterns, and submersible pumps. However, some companiesoffer full system design, installation and maintenance. A few companies offerinstallation and maintenance services only.
Recently, some opportunities were created for the private sector to supply largequantities of solar PV equipment. For example, in 2005, the Ministry of Educationrequired 300 solar home systems for its Non-formal Education Division (NFED).The supply and installation of the pre-designed PV systems was put to a com-petitive tender.
Several projects have deployed solar PV systems to provide electricity servicesto off-grid communities. Notable projects are the Renewable Energy ServicesProject (RESPRO) in the East Mamprusi district. This project started in February1999 and was originally expected to last three years after which RESPRO wouldbecome a public sector company providing rural energy services for a fee.Although the project phase formally ended on 31 March 2003, the Ministry hascontinued to support the programme.
RESPRO has installed and is operating solar PV systems in over one hundredcommunities in thirteen districts of the three Northern regions and Brong-Ahaforegion. Table 3 shows the total number of installations under RESPRO.13
SUSTAINABLE ENERGY REGULATION AND POLICYMAKING TRAINING MANUAL
page 9.96
13Ministry of Energy: www.energymin.gov.gh
Table 3. Number of installations carried out under RESPRO
Solar home systems 2,200
School systems 42
Clinics systems 6
Water pumping system 1
Street lighting 24
Total 2,273
Another solar electricity initiative is the Solar Rural Electrification Project run by theMinistry of Energy between July 1998 and December 2000. More than 1,500 sys-tems were installed in several communities in the Volta, Eastern, Upper West,Greater Accra and Northern Regions. Some of these communities have since beenconnected to the national grid, and the Ministry intends to relocate those PV sys-tems to other districts where they are needed.

The Ministry has also installed a number of PV street/area lighting projects inthe rural areas. This application of PV has been found to benefit the communityas a whole, suggesting a higher social impact vs. cost ratio than individual homesystems. For example, a single street or area lamp placed at a lorry station orthe village centre extends hours of business for food vendors and bus operators.The maintenance of such projects can be put under the local authority or thetransport union, and this can be more sustainable in the long run.
Table 4 summarizes the extent of PV deployment in Ghana. The RESPRO projectis item 4 on the list, appearing as the Rural Energy Services Company (RESCO).
MODULE 9: RENEWABLE ENERGY: REGULATORY AND POLICY OPTIONS
page 9.97
Table 4. List of PV projects in Ghana14
Organization Project
Danida/MOH Solar Project PV refrigeration, lighting, water pumping and heating, Equiprural or small health sectors with reliable tech.
CIDA-UR/UST Renewable Small-home-systems (SHS), battery charging, water distillationEnergy Project
UST/GTZ solar pump project Radial flow centrifugal water pump
MOME [special unit, in close UNDP/GEF, GEF grant of $2.5 mil. Ghana Gov. $0.5 million for collaboration with the Volta establishment of RE-based rural energy services company RiverAuthority (VRA/NED)] UNDP/GEF (RESCO) to provide off-grid solar electrification to initially 13 villages
MOME 2 solar service centres
Funding through a $185 million (306,177 million Cedis) syndi-cated loan provided by IDA, ORET of Netherlands, DANIDA,Nordic Development Fund (NDF) and Caisse Francaise deDeveloppement (CFD), the rest of 105,066 million Cedis was tobe the local component of the programme
MOME Wachiau Project 2.1 kW solar battery charging centreBattery operated home systems (BOHS)
MOME Spanish Solar Project Concessionary loan of the Spanish Government of $5 million foroff-grid solar electrification of 10 villages, Home, school & com-munity systems, water pumps, streetlights
MOME Solar Thermal Projects Crop dryers for reduction of post-harvest lossesImprove quality of agric. produce for high export prices
CIDA-University Of Regina, in Solar service centres (SSC), installed in rural communities sincecollaboration with the 3.1995University of Science and CN$ 1.24 , of which CIDA (Canadian International DevelopmentTechnology of Ghana Agency) contributes $900,000 with the remaining amount
donated by the participating universities
The Ghana Solar Energy GEF Small Grants Project and society (GHASES)/GEF also Women’s World Banking micro-credit schemeGhases/Women’s World Banking Training/marketing for improved charcoal stove; administration
of a micro-credit scheme
Sun oven Production and marketing of solar ovens
14www.areed.org/country/ghana/ghana.pdf

The estimated 4,600 PV projects are summarized according to application intable 5.
SUSTAINABLE ENERGY REGULATION AND POLICYMAKING TRAINING MANUAL
page 9.98
Table 5. PV systems in Ghana according to application
Application Quantity
Lighting 4270
Vaccine refrigeration 210
Water pumping 80
Telecommunication repeater stations 63
Radio transceivers 34
Battery charging stations 20
Rural telephone systems 3
Grid-connected power generation* 1
*This unit, installed at the Ministry of Energy, is experiencing technical problems.
3.3. Solar thermal technology
Thermal applications of solar energy are limited to small systems for the provi-sion of hot water from solar water heaters (SWHs). Solar water heaters have beeninstalled in individual homes, hospitals and hotels, but this has been on a smallscale because cheaper water-heating alternatives such as electric water heatersare available.11
Solar drying of foodstuffs is widespread and is the traditional form of storingmany types of food, but this is usually rudimentary—foodstuffs are spread out inthe sun or hung in barns to dry. A number of solar crop driers have been man-ufactured and trails have shown them to be a viable application of solar energyin Ghana.10
3.4. Wind energy
Ghana’s wind resources are confined to narrow stretches along the eastern coast-line and offshore; but the speeds are moderate. Even so, it is still expected thatwind energy can be harnessed to provide electricity in commercial quantities8, 11.
A number of private companies in Ghana sell small wind turbines (systems< 50 kW have been advertised).
In 2004, Enterprise Works Ltd. launched the “Ghana Wind Energy Project”, ademonstration project of 12 wind turbines (600-1,000 Wp) installed along the

eastern coast of Ghana. The Global Environment Facility and the World Bank pro-vided funding. Six of these wind turbines were locally manufactured, with theintention of developing local technical capacity in the fabrication of small windturbine systems.
3.5. Mini/micro hydro generation
Studies conducted in Ghana over the past three decades have shown that thereexists a theoretical availability of up to 25 MW of micro hydropower from70 sites.10 However, recent studies have shown that a number of these sites arefed from water sources that tend to dry up for a number of months in the year.Some of the other sites have been found to be economically unfeasible.11
Currently, one of the feasible sites is being developed, and a 30 kW systemexpected to be established soon.15
MODULE 9: RENEWABLE ENERGY: REGULATORY AND POLICY OPTIONS
page 9.99
15Personal communication with Mr. W. Ahiataku-Togobo.


4. CONCLUSIONS
The penetration of renewable energy technologies (RET) in Ghana could have beenextensive by now if the barriers to the successful application of these technolo-gies had been dealt with earlier. Some of the barriers had to do with the cost ofthe technology (which is rapidly reducing), but other barriers have to do withfinancial arrangements, government policies and customer education.
Many years of heavily subsidized petroleum and electricity costs have made REoptions, especially PV, uncompetitive and therefore the sector was unable toattract sufficient private sector investment. The few companies dealing in RETsare unable to generate enough sales to keep them running, since the people whoneed their services most cannot afford them.
The Government launched a number of pilot projects, which subsequently failed.By their very nature, these projects could be seen as a “test of concepts” andtherefore failure was an “acceptable” option. However, the authors are of theopinion that certain mechanisms could have been put in place to ensure the suc-cess of such projects. For example, the biogas project at Appolonia had certaindifficulties with the provision of sufficient dung. Also, the tariffs paid by the con-sumers at Appolonia were insufficient and could not keep the plant running. Thusthe facility has been out of use for considerable time, even though electricity con-tinues to be provided by fuelling the generators with regular diesel fuel.
The RESPRO is also reported to have run into difficulties, where many of theinstallations have batteries that are run down but cannot be replaced due to lackof funds. Once again, it would appear that the tariff regime is unable to sustainthe project.
The Ghana Wind Energy Project launched by Enterprise Works ran into technicaldifficulties when some of the electronic components at various sites were dam-aged during windstorms.
MODULE 9: RENEWABLE ENERGY: REGULATORY AND POLICY OPTIONS
page 9.101


5. KEY RECOMMENDATIONS
Based on observations and interviews in Ghana, several key areas have beenidentified as needing attention. The areas listed below are not intended to becomprehensive, and do not take into account efforts that may be presently under-way at the government level which were not made known to the authors duringthe course of their research.
Firstly, it is recommended that future energy policies be reviewed to incorporaterenewable energy technologies as part of the energy mix. The present situationwhere large-scale grid electricity is planned separately from decentralized renew-able sources has hindered the development of the sector and perhaps reducedthe number of communities that could have been electrified.
As part of the planning process, it is recommended that firm numerical targetsbe established for the proportion of total electrical energy that will come fromRETs. When a target it set, it will allow resources to be mobilized and foster poli-cies and programmes to achieve this goal.
The present tax waiver on solar generating sets was found to be restrictive andhas not led to the expected increase in the development of solar energy in Ghana.It may be worth considering the removal of these duty and tax waivers on RETs,and apply the funds instead to an RET fund to support viable renewable energyprojects. Having a fund for renewable technologies will allow careful evaluationof projects for feasibility and economic benefit. The selected projects will also befully funded and are likely to be on a scale that will be sustainable.
It would be necessary for the Energy Commission to clarify regulations regardingindependent power producers and the Embedded Generation Facility to allow pri-vate operators to evaluate the opportunities present in the energy sector andmake investment decisions. Lack of clarity may be preventing much neededinvestments. The regulator should also make provisions to make it easier forcooperatives to generate their own power using renewable resources.Furthermore it will be necessary to provide technical support to communities thathave natural resources and are interested in establishing their own generationfacilities. This particularly applies in the case of mini and micro-hydro resources.
The classification of energy producers should be refined to distinguish smalloperators from large ones. This does not necessarily mean compromising on envi-ronmental and performance standards, but it will allow smaller companies to beincorporated into the mainstream energy sector. Under the current situation,smaller energy service companies do not benefit from the resources of the EnergyCommission because the barriers to recognition are too high.
MODULE 9: RENEWABLE ENERGY: REGULATORY AND POLICY OPTIONS
page 9.103

To make RETs more practical and visible in the lives of ordinary people, it wouldbe necessary to move emphasis away from pilot projects to viable and functionalentities. The abundance of pilot programmes in the past has created the impres-sion that renewable energy technologies are an exotic curiosity and far removedfrom the real world. By selecting proven technologies and establishing viable busi-nesses around them, policymakers and industry can start to change this perception.
Finally, renewable energy technologies should be incorporated into the NEP andSHEP programmes as soon as possible. There should be a single electrificationprogramme in which several alternative power sources are available.Communities and programme managers can together then choose the bestoptions for each community. This will also prevent the situation where people onthe grid are subsidized, but those who choose to use RETs are made to bear thefull cost of their installations.
SUSTAINABLE ENERGY REGULATION AND POLICYMAKING TRAINING MANUAL
page 9.104

MODULE 9: RENEWABLE ENERGY: REGULATORY AND POLICY OPTIONS
page 9.105
Case study 5.
ZAMBIA: INSTITUTIONAL FRAMEWORK AND STATUS OF RENEWABLE ENERGY
CONTENTS
1. Background 9.1071.1. Energy consumption 9.1071.2. Energy supply 9.109
2. Energy regulation 9.111
3. Renewable energy 9.113
4. Conclusions 9.115
5. Key recommendations 9.117
Annex. Current renewable energy initiatives 9.121Energy service companies 9.121AREED 9.121Increased access to energy services project 9.122


1. BACKGROUND
1.1. Energy consumption
The overall energy consumption trends for Zambia between 1986 and 2002 aregiven in figure I.
MODULE 9: RENEWABLE ENERGY: REGULATORY AND POLICY OPTIONS
page 9.107
Figure I. Energy consumption trends (1986-2002)
50.00
100.00
150.00
200.00
250.00
1986 1987 1988 1989 1990* 1991 1992 1993 1994 1995 1996 1997 1998 1999 2000 2001 2002
Year
Total energy Petroleum Electricity Coal Woodfuel
Peta
Joul
es
Source: Department of Energy, Energy Bulletin 1990-2003.
There has been a moderate growth in total energy consumption between 1986and 2002. The increase has mainly been attributed to wood fuel utilization in thehousehold sector as a result of increasing population.
However, petroleum and coal consumption trends witnessed a decline due mainlyto a corresponding decline in economic activities, especially after 1991, when thecountry experienced industrial company closures following the privatization pro-gramme. The closures were mainly a consequence of opening the market to inter-national goods and services, thereby making some local goods and servicesuncompetitive.
The overall energy consumption by sector for Zambia is illustrated in table 1 andfigure II for the year 2000.

The energy consumption pattern in Zambia is dominated by households and min-ing. As shown in table 1 and figure II, households account for 73.0 per cent oftotal final energy consumption in 2000. The largest share of energy consumptionby households is attributed to firewood as illustrated in figure I, which indicatesthe overall importance of firewood in the provision of energy in Zambia. The min-ing sector, second in importance in terms of energy consumption, accounted for10.2 per cent of total final consumption, followed by industry 8.3 per cent andtransport 4.7 per cent.
SUSTAINABLE ENERGY REGULATION AND POLICYMAKING TRAINING MANUAL
page 9.108
Table 1. Energy consumption by sector (year 2000)
Sector Peta Joules Per cent
Agriculture and forestry 5.75 2.8
Commerce and industry 17.06 8.3
Government/services 2.29 1.1
Households 150.56 73
Mining 20.99 10.2
Transport 9.67 4.7
TOTAL 206.33 100
Source: Department of Energy, Energy Bulletin 1990-2003.
Figure II. Sectoral energy consumption chart (2000)
Mining10%
Households73%
Transport5%
Agriculture& forestry
3%Commerce& industry
8%
Government/services
1%

1.2. Energy supply
Zambia is well endowed with hydropower resources. The main river catchmentareas that have been developed are the Zambezi and Kafue. On the Kafue River,Zambia has developed the Kafue Gorge hydroelectric scheme (900 MW); on theZambezi River, Kariba North Bank (600 MW) and Victoria Falls power station(108 MW). Small/mini-hydro power stations serve the rural areas. The significantones are Lusiwasi (12 MW), Chishimba falls (6 MW), Musonda falls (5 MW) andLunzua (0.75 MW). The main power stations are interconnected into the main gridvia a 330 and 220 kV network. There is an untapped hydropower potential of about6000 MW. Table 2 shows total installed electricity generation capacity in 2004.
MODULE 9: RENEWABLE ENERGY: REGULATORY AND POLICY OPTIONS
page 9.109
Table 2. Installed electricity generation capacity (2004)
No. Description Capacity (MW) Type
1 Kafue Gorge 900 Hydro
2 Kariba North Bank 600 Hydro
3 Victoria Falls 108 Hydro
4 Lunsemfwa and Mulungushi 38 Hydro
5 Small hydros 24 Hydro
6 Isolated generation 10 Diesel
7 Gas turbine (stand-by) 80 Gas
Total installed capacity 1760
The country also has large deposits of coal at Maamba in the south of the coun-try, along the Zambezi valley with deposits estimated at 30 million tons. Otherareas where coal deposits have been located are Lwangua North, Luano,Lukusashi, Chunga and Lubaba. These deposits are estimated at several hundredthousand tons each. Due to production constraints and lack of investment funds,the design output of 1.2 million tons per annum of beneficiated and saleable coalhas drastically dropped over the last years. Coal only contributes about 6 per centof the country’s energy needs, mainly in the mining and industrial sectors. Atdomestic sector level, research has been completed aimed at developing suit-able appliances that can use coal briquettes.
Peat is another potential source of energy in the country. A general cartographicanalysis reveals that there are peat land areas along the Zambezi and Kafue rivervalleys. However, there has not been a systematic investigation of the resourceto date, therefore its use in Zambia cannot be quantified.
Zambia receives a lot of sunshine, such that solar power presents itself as a sub-stitute to other energy sources. It is competitive when remote areas are being

considered, especially for water pumping, electrifying village communities andrefrigeration in health clinics. The main constraint is the initial investment cost,which is quite prohibitive. The other form of renewable energy source is windpower. Today in Zambia its use is basically limited to water pumping.
Wood fuel and charcoal are estimated to meet the energy needs of about 70 per centof the rural and urban population. The copper mines utilize nearly 2000 tons ofcharcoal annually in the refineries.
Petroleum is not indigenous to Zambia. This has to be imported as crude andrefined into petrol, kerosene, diesel, aviation gas, and heavy fuel oil. Petroleumhas to be imported at international prices, transported through a 1500 kmpipeline to the refinery in Ndola. The refinery has a processing capacity of 1.0 mil-lion tons per year.
SUSTAINABLE ENERGY REGULATION AND POLICYMAKING TRAINING MANUAL
page 9.110

2. ENERGY REGULATION
The current institutional and legal framework for the energy sector is a result ofthe liberalization and reform process that started with the first ever NationalEnergy Policy, released in 1994 (NEP1994). The Government’s liberalization of var-ious sectors of the Zambian economy at the beginning of the 1990s was the maindriving force of the reforms in the energy sector. New laws, namely the EnergyRegulation Act (1995), the Electricity Act (1995) and the Rural Electrification Act(2003) were enacted to facilitate liberalization and to ensure consistency of theenergy sector with other sectors.
The Energy Regulation Act provides for the establishment of the sector regulator,the Energy Regulation Board (ERB), and defines its functions and powers. TheERB is the sole licensing authority for operators in the energy sector and isresponsible for close monitoring and supervision of such operators. The ERB isalso responsible for monitoring the level and structure of competition, marketentry issues (i.e. the ease of market entry) and investigating and remedying con-sumer complaints. In order for the ERB to execute its mandate, the Board workswith other statutory bodies such as the Environmental Council of Zambia, theZambia Competition Commission and the Zambia Bureau of Standards. Thistherefore means that the legal and regulatory framework of the power sector alsoneeds to recognize the legislation of these institutions namely: the Environmentaland Pollution Act, the Zambia Competition Commission Act and the ZambiaBureau of Standards Act.
The Electricity Act provides the framework within which the electricity sector willoperate. It abolished the statutory monopoly that the state-owned utility ZESCOLimited had enjoyed in the electricity subsector and provides for new entrants.The act sets out the rights and obligations of the electricity supply companiesand those of the consumer.
The Rural Electrification Act established the Rural Electrification Authority, aninstitution responsible for implementing rural electrification, as well as definingits functions and establishing the Rural Electrification Fund.
Furthermore, a new awareness of the integrated nature of energy in economicdevelopment has prompted the review of the existing policy and the formulationof the 2005 National Energy Policy (NEP2005). The NEP2005 sets out theGovernment’s intentions in the energy sector, these being aimed at ensuring thatthe sector’s latent potential to drive economic growth and reduce poverty is fullyharnessed. The NEP2005 is still under consideration by Government.
MODULE 9: RENEWABLE ENERGY: REGULATORY AND POLICY OPTIONS
page 9.111

Some of the gaps in the current legal and regulatory framework include:
� Open access to the transmission grid by independent power producers (IPPs)is difficult to implement because the transmission system operator, ZESCOLimited, has a vested interest in maintaining control and owns most of thegenerating power stations.
� About 70 per cent of power sales in the country are covered under long-termagreements between ZESCO, CEC and the mines, thus reducing the scope forcompetition amongst new entrants.
� There is lack of an established and well-functioning electricity market for thesale and purchase of power. Consumers do not have power supply choices.
� The Framework Incentive Package for promoting private power investments isnot backed by law.
� Sub-economic tariffs.
� Cross-subsidization in tariffs.
Since the promulgation of the Energy Regulation Act and the Electricity Act in1995, two prominent private companies have entered the power sector, namelythe Copperbelt Energy Corporation (CEC) and the Lunsemfwa & Mulungushihydropower company. Both companies operate under licence from the ERB.However, the power tariffs were negotiated between parties under various long-term power purchase agreements.
The Rural Electrification Authority (REA) was also established following the prom-ulgation of the Rural Electrification Act of 2003. The REA is still in its early stagesof development. The REA is expected to spearhead the development and appli-cation of renewables for rural electrification in Zambia.
SUSTAINABLE ENERGY REGULATION AND POLICYMAKING TRAINING MANUAL
page 9.112

3. RENEWABLE ENERGY
Renewable energy sources are increasingly being used in Zambia but still remaininsignificant in terms of contribution to the total national energy supply. Someof the past and current renewable energy initiatives are detailed in annex 1 ofthis case study. There is no specific legal framework dealing with renewableenergy sources in their entirety, however, renewables are regulated under theEnergy Regulation Act and when used for electricity generation, the Electricity Actalso applies. These pieces of legislation, in their present state, are not adequateto regulate and promote renewable energy.
Although Zambia is endowed with many renewable sources of energy, efforts toharness these resources have been minimal. This is despite the fact that renew-able sources of energy, particularly solar and wind energy, are widely availableand have the potential to improve the living standards of rural population.
Some of the constraints to a wider use of new and renewable sources of energyinclude:
� Lack of awareness among the general population about the renewable sourcesof energy technologies;
� Lack of an institutional framework for resource mobilization, system planningand expansion;
� High initial costs;
� Inadequate adaptive research on NRSE technologies to Zambian situation;
� Lack of end-user acceptability;
� Inadequate demonstration projects;
� Lack of specialized training.
Some of the policies and regulatory measures that the Government has embarkedon to promote renewable energy development are:
� Establishment of the Rural Electrification Authority (REA) is expected to effec-tively accelerate the implementation and mobilization of funds for renewableenergy for rural areas.
� Government’s deliberate policy to deal with the current inadequate informa-tion about available renewable energy resources and applicable technologies,poor dissemination of information, low literacy levels and a lack of awarenessof potential business opportunities among entrepreneurs.
� Government’s policy to ensure that energy prices reflect costs of providingenergy and also to take into account principles of fairness and equity.
MODULE 9: RENEWABLE ENERGY: REGULATORY AND POLICY OPTIONS
page 9.113

The above policy measures, which are contained in the proposed NEP2005, areadequate to promote the development and deployment of renewable energy ifthey are backed by the appropriate legal, regulatory and institutional frameworks.In addition, the government will need to take further deliberate measures to buildthe necessary capacity at various policymaking levels within both the governmentitself and the Energy Regulation Board and the Rural Electrification Authority in orderto achieve an effective regulatory environment for the promotion of renewables.
SUSTAINABLE ENERGY REGULATION AND POLICYMAKING TRAINING MANUAL
page 9.114

4. CONCLUSIONS
The power sector in Zambia has been going through a dramatic change from atotally state-controlled business with vertically integrated subsector monopoliesto a free market with competition and private sector investment. An appropriatelegal and regulatory framework has been established through legislative instru-ments, such as the Energy Regulation Act and the Electricity Act. A sector regu-lator, the Energy Regulation Board, was established in 1997 as an independent andsole licensing authority for operators in the energy sector. A Rural ElectrificationAct was passed in 2003 and a Rural Electrification Authority established.
Zambia does not have a specific legal framework dealing with renewable energytechnologies (RETs) in their entirety. However, these are regulated under theEnergy Regulation Act and the Electricity Act. A specific framework for the pro-motion and development of RETs is necessary.
The major constraints to a wider use of RETs include: (a) lack of awareness aboutRETs; (b) high initial costs; (c) inadequate adaptive research on RE technologiesto the Zambian situation; (d) lack of end-user acceptability; (e) inadequatedemonstration projects; and (f) lack of specialized training.
The National Energy Policy of 1994 (NEP1994) clearly spells out policy measuresneeded to accelerate the development of renewable energy. These include:
� Promotion of education and training in renewable energy at various levels;
� Promotion of information dissemination about renewable energy;
� Promotion of renewable energy technological development.
The proposed National Energy Policy of 2005 (NEP2005) further recommends:
� Strengthening of the institutional framework for research and development ofRETs;
� Application of appropriate financial and fiscal instruments for stimulating theimplementation of RETs;
� Actively involve women in decision-making and planning in renewable energyprogrammes and activities;
� Promotion of biomass technologies for electricity generation.
The above policy measures are contained in the proposed new national policy(the NEP2005). Consequently the above policies have not yet been implementeda significant degree. However, it is expected that this situation will be addressednow that the Rural Electrification Authority has been established.
MODULE 9: RENEWABLE ENERGY: REGULATORY AND POLICY OPTIONS
page 9.115

Zambia is currently undertaking a series of renewable energy projects such asthe African Rural Energy Enterprise Development (AREED), Access to EnergyServices (IAES), and ESCO projects. These are pilot projects from which impor-tant lessons have been learnt. The ESCO project in Eastern Province can for exam-ple now be extended countrywide given further financial and technical assistance.The same can be said about the other projects.
SUSTAINABLE ENERGY REGULATION AND POLICYMAKING TRAINING MANUAL
page 9.116

5. KEY RECOMMENDATIONS
Policy changes that would better promote renewable energy technologies can besummarized as follows:
� Deliberate and clear policy to build and strengthen awareness on renewableenergy technologies (RETs) at the policymaker level through appropriate train-ing and other capacity-building activities.
� Build capacity within the relevant regulatory agencies on the techniques topromote RETs through appropriate regulation.
� Minimize financial constraints and create attractive investment incentives forthe private sector to participate in the provision of RET solutions to the energysector problems by introducing tax incentives and smart subsidies for exam-ple. This would greatly compliment the Government’s own funding and thecurrent 3 per cent rural electrification levy.
� Strengthen institutions currently involved with the development of RETsincluding the Rural Electrification Authority (REA). Comprehensive capacity-building is required at REA at this stage.
� Ensure that electricity tariffs are cost reflective with a view to encouraging private investment.
� Build an effective communication infrastructure to ensure that there is ade-quate information available about RETs to the general public. Awareness ofthe business opportunities available to entrepreneurs.
� Ensure that experiences gained from some of the pilot projects that theGovernment has already undertaken (such as PV-ESCOs, AREED, and IAES) areused as examples of the application of renewable energy providing success-ful and sustainable solutions.
� Consider a renewable energy policy as an opportunity to address other poli-cies such as employment, gender issues and energy poverty (especially inrural areas).
MODULE 9: RENEWABLE ENERGY: REGULATORY AND POLICY OPTIONS
page 9.117


REFERENCES
Salasini R. (2006), Capacity-Building in Energy Efficiency and Renewable Energy Regulationand Policy-Making in Africa, UNIDO Zambia Country Report on Energy and RenewableEnergy Technologies.
Salasini R. (2006), Capacity-Building in Energy Efficiency and Renewable Energy Regulationand Policy-Making in Africa, UNIDO Zambia Energy Regulation Board Country Case Study.
Zambia National Energy Policy.
Framework and Package of Incentives (FPI) for the promotion of private power investment(MEWD/DoE).
Energy Regulation Act.
Electricity Act.
Rural Electrification Act.
Petroleum Act.
Department of Energy (1990-2003), Energy Bulletin.
MODULE 9: RENEWABLE ENERGY: REGULATORY AND POLICY OPTIONS
page 9.119


ANNEX. CURRENT RENEWABLE ENERGYINITIATIVES
Energy service companies
The ESCO project was a new approach for providing electric light and other basic servicesto people in rural areas through solar photovoltaic (PV) systems. The approach was basedon the Energy Service Company (ESCO) approach. The main objective was to create a sus-tainable market by which the people in rural areas would access the services provided bysolar photovoltaic technology at a fee. The project was initiated by the Government ofZambia (through the Department of Energy) in 1998 with financial support from theSwedish International Development Agency (SIDA) and technical assistance from theStockholm Environment Institute (SEI).
This project was executed in three phases: Phase I (June 1998–June 2000), Phase II(October 2001–December 2003) and Phase III (September 2004–September 2005). Theproject is currently at the reporting stage of Phase III.
AREED
The AREED Initiative is a multi-country initiative and was established in 2000 by a groupof multi-lateral (UNEP and the UNF), international companies/NGOs (primarily E&Co) andnational government partners (Ghana, Mali, Senegal, United Republic of Tanzania andZambia). It is being implemented by E&Co and seeks to develop new sustainable energyenterprises that use clean, efficient and renewable energy technologies to meet the energyneeds of the rural poor, thereby reducing the environmental and health consequences of exist-ing energy use patterns.
The main objectives of AREED are:
� To create rural energy enterprises and to build the capacity of NGOs and institutionsto facilitate enterprise development.
� To provide early stage funding and enterprise development services to entrepreneurs,build capacity in African NGOs to work with clean energy enterprises and work withfinancial institutions to assess the rural energy business sector as well as integrateenterprise investments into their portfolios.
In order to achieve the above objectives, AREED has the following components in its portfolio:
� Training and tools to help entrepreneurs start and develop energy businesses;
� Enterprise start-up support in areas such as business planning, structuring and financing;
� Seed capital for early stage enterprise development;
� Assistance in sourcing second stage financing.
� Partnerships with banks and NGOs involved in rural energy development.
MODULE 9: RENEWABLE ENERGY: REGULATORY AND POLICY OPTIONS
page 9.121

The AREED initiative has begun operations in Botswana, Ghana, Senegal and Zambia. Itis working in-country with a number of local partners, including ENDA in Senegal, KITE inGhana, CEEEZ in Lusaka and the Mali Folkecenter.
Increased Access to Energy Services Project (IAES)
The Government, through the Ministry of Energy and Water Development (MEWD), recog-nizes the need for increasing rural and peri-urban access to electricity and informationcommunication technology (ICT) as a strategy to reduce poverty in these areas. As part ofthe implementation strategy, the government embarked on the Increased Access to EnergyServices Project (IAES) financed by World Bank, Global Environmental facility, otherdonors, and the Prototype Carbon Fund.
IAES project objectives and design strategy
The objective of the project is to provide for investment and technical assistance/capa -city building activities to enable the scaling-up of access to electricity and ICT services inrural and peri-urban areas to maximize development impact: (a) income generation by SMEsthrough productive uses (farm and non-farm), and (b) improved quality of life emphasizingthe effectiveness of social services (such as health, education) and administrative service.
The underlying approach of the IAES project is to expand access via public-private partner -ships in a commercially oriented manner, i.e. with focus on cost recovery. It is recognizedthat there is a need for “smart” subsidies that address the up-front capital cost invest-ment requirements and the initial transaction costs to encourage entrepreneurial activitywhile maintaining efficiency of operations and promoting output. The level and terms ofthe capital subsidy may differ according to project characteristics—including underlyingprospects for economic growth and investment risks. GEF provided financial support willbe available for developing local hydro and other renewable energy generation for sale tothe grid and to independent grids.
The scale-up strategy for designing delivery mechanisms and targeting the limitedresources (credit and grants) is driven by the consideration of maximizing the develop-ment impact on growth and poverty within the prevailing sectoral context and taking intoaccount emerging changes that can be characterized as a “break from the past” inGovernment policies for the sector.
This means (see schematic below) geographically targeted introduction of electricity andICT services at established centers of economic and/or social activities for the benefit oflarge numbers of people drawn to those centers from the respective catchment areas.Such concentrations of activity and centers of day-to-day life for most rural people aremissions, farm blocks, trading and administrative centers (including postal centers) andperi-urban townships. As appropriate, they would also include community centers andzonal resource centers.
SUSTAINABLE ENERGY REGULATION AND POLICYMAKING TRAINING MANUAL
page 9.122

Finally, another key aspect of project design is consistent with the Government’s emerg-ing policy thrusts and initiatives that aim to engineer a “break from the past”, by open-ing up key infrastructure sectors of the economy to new entrants while at the same timestrengthening the existing parastatal players. In keeping with this, the IAES project aimsto target a third of the IDA credit for rural electrification investments and the bulk of GEFgrant resources for enabling rural electrification and renewable energy investments viapublic-private partnerships (PPP). Specifically, the project would develop and strengthentwo parallel and complementary service delivery modalities and sector players: ZESCO andnew entrants that are non-ZESCO sponsors. The latter potentially include sponsors of sub-projects and investments such as mission groups, other private sponsors, and creditwor-thy NGOs as well as community-based organizations with bankable business plans.
A key preparation activity is to prepare and offer on a competitive basis, the opportunityto undertake pre-defined rural and peri-urban electrification schemes, or “subprojects”,designated as Priority Rural Electrification Projects (PREPs).
MODULE 9: RENEWABLE ENERGY: REGULATORY AND POLICY OPTIONS
page 9.123
Missions Commercialfarms
Trading andadministrativecentres
Peri-urbantownships
ZESCO Public-PrivatePartnership(PPP)
High-impact users
O Productive use enterprises (including agriculture)O Health facilitiesO Secondary and vocational trainingO Water pumpingO Administrative facilitiesO Households with affordability
Grid extension
Isolated grids
Solar PV


MODULE 9: RENEWABLE ENERGY: REGULATORY AND POLICY OPTIONS
page 9.125
Case study 6.
UNITED KINGDOM RENEWABLESOBLIGATION
CONTENTS
1. Policy and industry structure 9.127
2. The Non-Fossil Fuel Obligation (NFFO) 9.127
3. Renewables obligation 9.128
4. Prices and costs of the renewables obligation 9.130
5. Impact of the renewables obligation 9.131
6. Other support for renewables 9.133
7. Will the United Kingdom meet its renewables target? 9.134
References 9.134


1. POLICY AND INDUSTRY STRUCTURE
The lead government department on energy policy in the United Kingdom is theDepartment of Trade and Industry (DTI) and it is here that renewables policy ismainly developed. However, the Department for the Environment, Food and RuralAffairs (DEFRA) is the lead government department on climate change and envi-ronmental issues and it also has the lead on energy efficiency.
The electricity and gas industries were privatized in the United Kingdom in thelate 1980s. There have been a number of changes in the energy market since pri-vatization but the structure as at mid-2005 was as follows: six large integratedgas and electricity supply and generation companies and a number of smallercompanies involved in generation and/or supply; nine electricity distribution com-panies (distribution network operators—DNOs) in England and Wales; a singlegas transportation and electricity transmission company for England and Wales(that also does gas transportation in Scotland); two integrated electricity distri-bution, transmission and generation companies in Scotland, (they are also twoof the gas and electricity suppliers that serve Scotland, England and Wales). Thewhole industry is regulated by the Gas and Electricity Markets Authority (morecommonly known as the Office of Gas and Electricity Markets (Ofgem)) which isan independent regulator established by an Act of Parliament. There has beenfull retail competition since the late 1990s and price controls were removed fromthe household retail market in 2002. (Note that the situation in Northern Irelandis different where there is a separate market and regulator.)
The United Kingdom Government’s Energy White Paper, published in 2003, makesa strong commitment to environmental as well as economic and social goals forenergy policy. The United Kingdom is signed up to the Kyoto protocol (thatrequires greenhouse gas emissions to be cut by 12.5 per cent compared to 1990levels by 2010) and has also set more internally demanding targets (20 per centreduction by 2010) for reducing carbon dioxide emissions. It has a number ofpolicies and programmes to foster the development of renewable energy andenergy efficiency to help achieve a low carbon economy.
2. THE NON-FOSSIL FUEL OBLIGATION(NFFO)
The United Kingdom’s first programme to support renewable energy was the Non-Fossil Fuel Obligation (NFFO) introduced in 1990. The NFFO was primarily established
MODULE 9: RENEWABLE ENERGY: REGULATORY AND POLICY OPTIONS
page 9.127

to subsidize nuclear power, which the Government had been unable to privatizealong with the rest of the electricity industry, as the electricity generation com-panies would not have been viable as private companies if they included thenuclear power stations. However, the Government decided to broaden the obli-gation to include specified renewable energy technologies. The Electricity Act1989, enabled the raising of a fossil fuel levy (i.e. on all fossil—coal, gas andoil—fuel generated electricity) to pay for the NFFO. The NFFO operated via bid-ding for support in various technology bands—developers of eligible types ofrenewable electricity generation bid for support and those who were successfulreceived subsidy payments (which varied according to the technology) on top ofthe market price that they would otherwise be paid. However, this scheme stim-ulated only small amounts of renewable energy generation—up from 1.8 per centof total electricity generated in 1990 to 2.5 per cent of electricity in 2000).
Following the election of a new Government in 1997, support for renewable energywas reviewed was the aim of overcoming three main problems with the NFFO:
� Limited development of renewable energy (some commentators have arguedthat this was largely due to the low-cost cap imposed on support via the NFFOrather than the nature of the mechanism itself);
� Ending the must-take or priority access contracts that renewable energy gen-erators who received support via the NFFO received—these were felt to sepa-rate them too much from the reality of the marketplace;
� That a support mechanism shouldn’t “pick winners” by giving different levelsof support to different technologies.
(Mitchell and Connor, 2004)
The result of the review was the establishment of the renewables obligation.
3. RENEWABLES OBLIGATION
The renewables obligation was introduced in 2002 to boost the amount of elec-tricity generated from renewable energy. The United Kingdom has set itself a tar-get to generate 10 per cent of its electricity from renewable sources by 2010 and15 per cent by 2015, as part of its commitment to reducing greenhouse gas emis-sions. The renewables obligation is the main policy instrument to achieve thisand its main feature is that electricity suppliers (retailers) have to source a setpercentage of the electricity that they sell to customers from renewablesources. This started at 3 per cent in 2002 and will rise to 15 per cent by 2015in line with the national target.
SUSTAINABLE ENERGY REGULATION AND POLICYMAKING TRAINING MANUAL
page 9.128

The current main sources of renewable electricity generation that are eligible forthe financial support provided by the renewables obligation are:
� Hydroelectricity power stations with a capacity of less than 20 megawatts;
� Wind farms both onshore and offshore;
� Electricity generated from landfill gas and sewage gas;
� Electricity generated by burning energy crops and other natural waste, anduntil 2016, electricity generated from power plants which co-fire such mate-rial with coal.
Over time generation from other technologies such as wave and tidal powerplants, which are also eligible, is predicted to increase.
The 2010 target only includes electricity generated from sources eligible for therenewables obligation. It therefore excludes electricity generated by large hydroelec-tricity power stations and some forms of energy from waste (notably incineration).
The legal basis for the renewables obligation (RO) is contained in Section 32 ofthe Electricity Act 1989 (as amended in 2000) which enables the Secretary ofState, by order, to impose an obligation on suppliers (“the RenewablesObligation”). This power has been devolved to the Scottish Executive in respectof suppliers in Scotland (Renewables Obligation Scotland (ROS)). The RO and theROS came into effect on 1 April 2002 and are scheduled to stay in place until31 March 2027. An obligation period runs from 1 April to 31 March each year. TheGas and Electricity Markets Authority (Ofgem) is responsible for the administra-tion of the orders.
The orders place a legal obligation on each licensed electricity supplier to pro-duce evidence that either it has supplied a specified proportion of its electricitysupplies from renewable energy sources to customers in the United Kingdom, orthat another electricity supplier has done so, or, that between them, they havedone so. Section 32B of the Act allows for “green certificates” to be issued undersection 32 orders. Such certificates certify that a generating station has gener-ated from renewable sources an amount of electricity and that it has been sup-plied to customers in the United Kingdom. These are known as RenewablesObligation Certificates (“ROCs”) (issued under the RO) or Scottish RenewablesObligation Certificates (“SROCs”) (issued under the ROS). These certificates canbe purchased separately from the electricity in respect of which they were issued.So suppliers can meet this obligation by contracting with renewable energy gen-erators to buy their output directly (and receive “green certificates” for doing so),or by buying the ROCs separately from the renewable power generated.Alternatively, a supplier can discharge its Renewables Obligation, in whole or inpart, by paying the buy-out price to a central fund. The proceeds of the buy-out
MODULE 9: RENEWABLE ENERGY: REGULATORY AND POLICY OPTIONS
page 9.129

fund are divided between those suppliers who have met the obligation by obtain-ing the required number of green certificates, so providing an additional valueto ROCs.
In order for ROCs to be issued, the generating station that generates the elec-tricity must be accredited by Ofgem as capable of generating electricity from eli-gible renewable sources. The participation of a generating station in the schemeis voluntary and there are certain criteria that need to be met before a stationcan be accredited. The orders set out what sources of electricity are eligiblerenewable sources and also specify the exclusion of certain types of generatingstations, e.g. stations incinerating waste. Time limits for eligibility are placed onstations co-firing, i.e. burning biomass and fossil fuel to generate electricity.
Suppliers are required to produce evidence of compliance with their renewablesobligation to Ofgem by 1 October each year. Evidence can be via ROCs or SROCs.
4. PRICES AND COSTS OF THERENEWABLES OBLIGATION
Unlike the feed-in scheme in Germany, the renewables obligation does not guar-antee connection nor specify the price that renewable generators will be paid forthe electricity that they generate—this is set by the market for all electricity gen-eration and is usually agreed in bilateral contracts between generators and sup-pliers. However, in addition to the market price for renewable electricity,generators can sell their ROCs/SROCs to suppliers who have to meet their obli-gations or pay the buy-out price. The buy-out price (which is set in the order andrises each year in line with the retail price index (RPI)) thus sets the basic pricefor ROCs—so long as demand for ROCs exceeds supply. However, as supplierswho meet their obligations via ROCs will also get extra revenue from the buy-outfund, this further increases what they are willing to pay for ROCs/SROCs. Togethertherefore, these features increase the market value of renewable generation. Thefollowing prices illustrate this.
Illustrative prices for renewable energy under the RO:
� The market price for the electricity (which can be sold separately from theROC)—this has varied significantly since 2002 from around 1.5p/kWh to4p/kWh.
� 3p/kWh for the ROC (the buy out price started at £30/MWh or 3p/KWh).
� 1.5p/kWh for the extra revenue from the recycled buy-out fund.
SUSTAINABLE ENERGY REGULATION AND POLICYMAKING TRAINING MANUAL
page 9.130

Thus the renewable electricity generators can obtain significant additional rev-enue from the RO.
The buy-out price is intended to act as a cap on the costs to be charged to con-sumers. In 2003/2004, the total renewables obligation across the UnitedKingdom was 13,627,412 MWh. The simple calculation of multiplying this by£30.51 gives a total cost to consumers of around £416 million.
Total public support for the renewables industry (through the renewables obliga-tion, capital grants and research and development support) is expected to aver-age £700 million per annum between 2003 and 2006. Around two-thirds of thiswill come through the renewables obligation, the cost of which is met by elec-tricity consumers and will reach up to £1 billion per annum by 2010 (the equiv-alent of a 5.7 per cent increase in the price of electricity).
The cost of reducing carbon dioxide emissions through the renewables obliga-tion is currently higher than other policy mechanisms which primarily incentivizeenergy efficiency. However, the renewables obligation is not just in place to meetthe Government’s climate change objectives. Its other goal is to promote diver-sity and security of energy supplies. It is recognized that technologies that arenot mature will have higher costs, but that as they develop, these costs shouldcome down.
Another cost issue is that the renewables obligation provides the same level offinancial support for all eligible renewable projects. The Government adopted thisapproach to ensure that the most economic renewable energy projects are devel-oped first, while minimizing Government intervention in the market. A conse-quence is that some projects using the lowest cost technologies (onshore windand landfill gas) at the best sites receive more support from the renewablesobligation than necessary to see them developed. The Department of Trade andIndustry is looking at this issue for new sites in its review of the renewablesobligation.
5. IMPACT OF THE RENEWABLESOBLIGATION
The renewables obligation has increased the total renewable electricity generatingcapacity in the UK from 1400 MW in 2002 to 2400 MW in 2004. A rough break-down of this is as follows:
MODULE 9: RENEWABLE ENERGY: REGULATORY AND POLICY OPTIONS
page 9.131
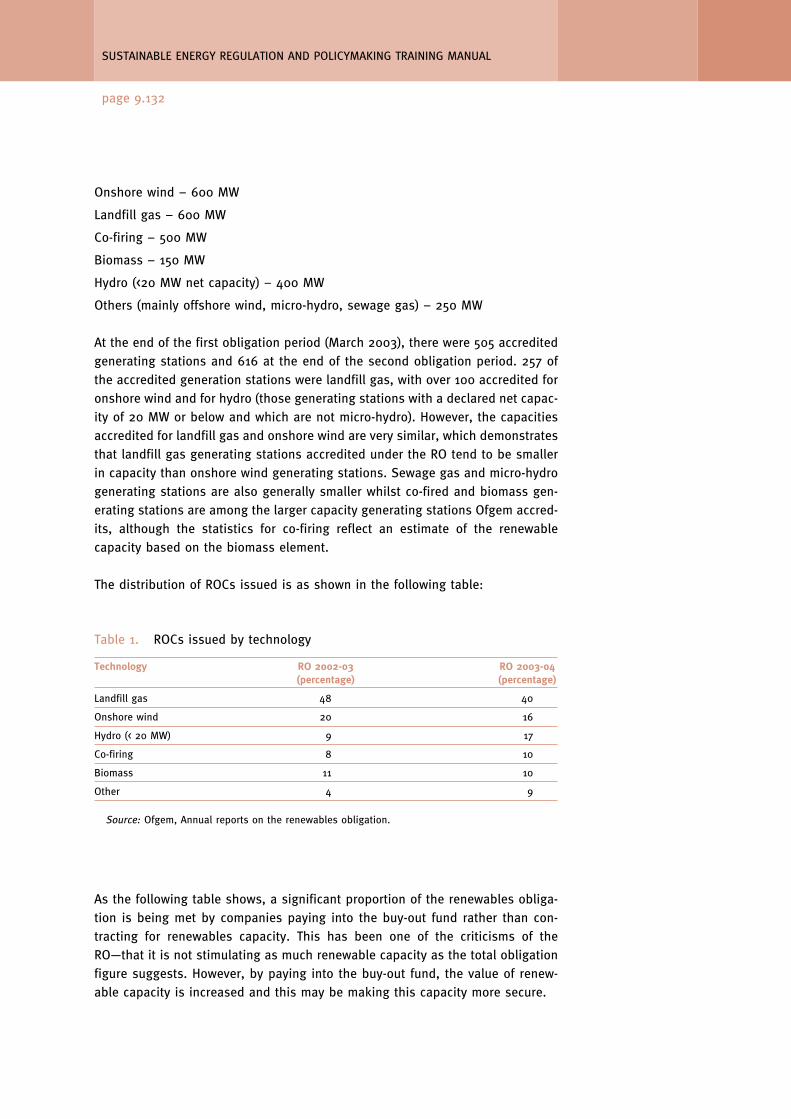
Onshore wind – 600 MW
Landfill gas – 600 MW
Co-firing – 500 MW
Biomass – 150 MW
Hydro (<20 MW net capacity) – 400 MW
Others (mainly offshore wind, micro-hydro, sewage gas) – 250 MW
At the end of the first obligation period (March 2003), there were 505 accreditedgenerating stations and 616 at the end of the second obligation period. 257 ofthe accredited generation stations were landfill gas, with over 100 accredited foronshore wind and for hydro (those generating stations with a declared net capac-ity of 20 MW or below and which are not micro-hydro). However, the capacitiesaccredited for landfill gas and onshore wind are very similar, which demonstratesthat landfill gas generating stations accredited under the RO tend to be smallerin capacity than onshore wind generating stations. Sewage gas and micro-hydrogenerating stations are also generally smaller whilst co-fired and biomass gen-erating stations are among the larger capacity generating stations Ofgem accred-its, although the statistics for co-firing reflect an estimate of the renewablecapacity based on the biomass element.
The distribution of ROCs issued is as shown in the following table:
SUSTAINABLE ENERGY REGULATION AND POLICYMAKING TRAINING MANUAL
page 9.132
Table 1. ROCs issued by technology
Technology RO 2002-03 RO 2003-04(percentage) (percentage)
Landfill gas 48 40
Onshore wind 20 16
Hydro (< 20 MW) 9 17
Co-firing 8 10
Biomass 11 10
Other 4 9
Source: Ofgem, Annual reports on the renewables obligation.
As the following table shows, a significant proportion of the renewables obliga-tion is being met by companies paying into the buy-out fund rather than con-tracting for renewables capacity. This has been one of the criticisms of theRO—that it is not stimulating as much renewable capacity as the total obligationfigure suggests. However, by paying into the buy-out fund, the value of renew-able capacity is increased and this may be making this capacity more secure.

6. OTHER SUPPORT FOR RENEWABLES
The fact that the RO does not pay different prices for different technologies meansthat suppliers tend to favour the least costly forms of renewables (currently land-fill gas and onshore wind) which can be viewed as an advantage on cost-effectiveness grounds. However, this does mean that it may not promote as muchdiversity as schemes that pay higher prices for less mature technologies. The UKGovernment is tackling this issue via a range of other schemes of funding forrenewables—typically capital grants to offset the extra costs of technologies suchas offshore wind, biomass, wave and tidal power, and photo-voltaic. Theseinclude grants for large and medium-scale schemes and some grants for smalland micro-scale technologies.
Examples include:
� Bioenergy has received £55 million in capital grants to support 22 projects,although not all of these are proceeding due to various difficulties in makingthem commercially viable.
� The offshore wind scheme has allocated capital grants of £117 million to12 projects, two of which are now fully operational. The remaining projects areexpected to come on stream in the next three years, providing total capacityof over 1,000 megawatts, enough to supply more than 600,000 households.
MODULE 9: RENEWABLE ENERGY: REGULATORY AND POLICY OPTIONS
page 9.133
Table 2. A comparison of RO compliance figures over the 1st and 2nd obligation periods
2002/2003 2003/2004
Total obligation (TWh) 8,393,972 12,387,720
ROCs and SROCs produced (£ mlln) 4,973,091 6,914,524
Buy-out paid (£ mlln) 78,853,260 157,960,978
Buy-out not paid (£ mlln) 23,773,170 9,026,231
Percentage obligation met by ROCs or SROCs 59 56
Buy-out distributed and late payment fund (£ mlln) 79,251,930 158,466,502
Buy-out paid per ROC or SROC produced (£) 15.94 22.92
What a ROC or SROC was “worth” to a supplier (£) 45.94 53.43
Source: Ofgem, 2nd annual report on the renewables obligation.

7. WILL THE UK MEET ITS RENEWABLESTARGET?
By April 2004 (two years after the introduction of the renewables obligation), thelevel of electricity supplied from eligible renewable sources was 2.4 per cent, sig-nificantly lower than the obligation level of 4.3 per cent. In the early phases there-fore, the RO has been underperforming in terms of delivering new renewableelectricity capacity. Various estimates have been made of whether the rate ofgrowth will increase sufficiently for the 2010 target of 10 per cent electricity fromrenewable sources to be achieved. These range from 7.5 per cent (House of LordsScience and Technology Committee) to close to 10 per cent on the most opti-mistic of a range of estimates produced for the National Audit Office (NAO, 2005).According to the NAO the main challenges to achieving the 2010 target are:
� Whether revised planning guidance for England facilitates the planningprocess for new renewable energy sites;
� Whether the upgrading of the electricity transmission and distribution net-works, required to accommodate new renewable generation, is planned,funded and installed on time;
� Whether investor confidence in the way the renewables obligation is workingis maintained;
� Whether financial support provided through capital grants and the researchand development programme fulfil their respective objectives.
REFERENCES
House of Lords Science and Technology Committee. Renewable Energy: Practicalities. 4thReport of Session 2003-04 HL Paper 126-I (15 July 2004) Available on the parliamen-tary website (www.parliament.uk).
National Audit Office. DTI: Renewable Energy. Report by the Comptroller and Auditor GeneralHC 210 2004-2005 (11 February 2005). Available on the NAO website (www.nao.gov.uk).
Comprehensive information on the renewables obligation including the annual report onprogress is available on the Ofgem website (www.ofgem.gov.uk).
See also the website for the Department of Trade and Industry (www.dti.gov.uk/energy).
SUSTAINABLE ENERGY REGULATION AND POLICYMAKING TRAINING MANUAL
page 9.134

MODULE 9: RENEWABLE ENERGY: REGULATORY AND POLICY OPTIONS
page 9.135
Module 9
SUSTAINABLE ENERGY REGULATION AND POLICYMAKING FOR AFRICA
Renewable Energy
Module 9:
REGULATORY MEASURES AND POLICY
OPTIONS TO ENCOURAGE DEVELOPMENT
OF RENEWABLE ENERGY
Module 9
SUSTAINABLE ENERGY REGULATION AND POLICYMAKING FOR AFRICA
Module overview
• Why support sustainable energy
• Design issues for support mechanisms
• Types of support mechanisms
• Support mechanisms in practice
SUSTAINABLE ENERGY REGULATION AND POLICYMAKING TRAINING MANUAL
page 9.136
Module 9
SUSTAINABLE ENERGY REGULATION AND POLICYMAKING FOR AFRICA
Module aims
• To provide an overview of the different advantages that a clear renewable energy policy can provide, and its possible interaction with other policies
• To explain what the key building blocks are when designing a regulatory/support mechanism
• To give an overview of the different possible approaches
• To show how this has been implemented in different African countries
Module 9
SUSTAINABLE ENERGY REGULATION AND POLICYMAKING FOR AFRICA
Module learning outcomes
• To be able to explain that a renewable energy policy can provide advantages and support a range of environmental and other policies
• To understand which design elements are key to the success of the regulatory/support mechanism
• To understand different approaches to designing a regulatory/support mechanism
• To be able to argue which regulatory or policy approach suits best, given the national or regional situation

MODULE 9: RENEWABLE ENERGY: REGULATORY AND POLICY OPTIONS
page 9.137
Module 9
SUSTAINABLE ENERGY REGULATION AND POLICYMAKING FOR AFRICA
Why Support Sustainable Energy
• Environment
• Security of supply
• Decentralized production
• Links with socio-economic policy:
– Fuel poverty
– Gender
– Employment
– Capacity-building
Module 9
SUSTAINABLE ENERGY REGULATION AND POLICYMAKING FOR AFRICA
Design Issues for Support Mechanisms
• Effectiveness and efficiency
• Investor confidence is key
• Interaction with other policy measures
• Flexibility
• Stimulation of reducing prices over time

SUSTAINABLE ENERGY REGULATION AND POLICYMAKING TRAINING MANUAL
page 9.138
Module 9
SUSTAINABLE ENERGY REGULATION AND POLICYMAKING FOR AFRICA
Types of Support Mechanisms
• The mechanisms discussed can be divided into two
categories:
– Regulatory/support options that are immediately applicable to
many sub-Saharan African countries
– Other regulatory/support mechanisms implemented in the
developed countries that may be applicable to sub-Saharan
African countries in the future
Module 9
SUSTAINABLE ENERGY REGULATION AND POLICYMAKING FOR AFRICA
Support Mechanisms Applicable in
the Short Term
Establishing “standard” Power Purchase Agreement (PPAs)
• Eliminate cumbersome negotiations
• Institute a “Standard PPA” - a “standard offer” from the national utility to purchase all energy produced by specific renewable energy-based Independent Power Producers (IPP) at a pre-announced price
• Set clear rules to allow the sale of power produced to encourage investment in renewables

MODULE 9: RENEWABLE ENERGY: REGULATORY AND POLICY OPTIONS
page 9.139
Module 9
SUSTAINABLE ENERGY REGULATION AND POLICYMAKING FOR AFRICA
Support Mechanisms Applicable in
the Short Term (2)
Long term Electricity Generation Licenses and PPAs for IPPs
• Currently generation licenses are issued for varying periods of 7 to 15 years
• Investors have a very limited period of time to recoup their costs and make a decent margin
• Issuing longer term electricity generation licenses and PPAs to IPPs (e.g. 15-30 years) can encourage investors
• Longer term agreements allow for sufficient time for the investor to pay off project financing debts and make a profit
Module 9
SUSTAINABLE ENERGY REGULATION AND POLICYMAKING FOR AFRICA
Support Mechanisms Applicable in
the Short Term (3)
Developing a favourable Tariff Setting and Adjustment Formula
• Calculation of the feed-in tariff on the basis of the cost of the fuel can
result in very low feed-in tariffs offered to renewables
• Renewable fuel cost is often very low or sometimes free but with higher
equipment costs
• A more favourable tariff setting and adjustment formula takes also into
account the “avoided cost” of installing competing thermal power plants

SUSTAINABLE ENERGY REGULATION AND POLICYMAKING TRAINING MANUAL
page 9.140
Module 9
SUSTAINABLE ENERGY REGULATION AND POLICYMAKING FOR AFRICA
Support Mechanisms Applicable in
the Short Term (4)
“Light-handed” Regulation
• Deliberate removal of, or making less stringent, provisions for a player
or group of players
• Explicitly exempting or significantly reducing the statutory
requirements of investors in sustainable energy
• For example, waiving the need for licensing small to medium scale
renewable energy investments below a certain capacity threshold
Module 9
SUSTAINABLE ENERGY REGULATION AND POLICYMAKING FOR AFRICA
Support Mechanisms Applicable in
the Short Term (5)
Setting Targets for Renewable Electricity Generation
• Set explicit targets for the share of electricity generated from proven
renewable energy technologies such as hydro, wind, solar PV,
bagasse-based cogeneration and geothermal
• The Government of Kenya has set a target of 25 per cent of electricity
generation to come from geothermal energy by the year 2020
• IPPs actively encouraged to exploit renewables to meet targets

MODULE 9: RENEWABLE ENERGY: REGULATORY AND POLICY OPTIONS
page 9.141
Module 9
SUSTAINABLE ENERGY REGULATION AND POLICYMAKING FOR AFRICA
Support Mechanisms Applicable in
the Short Term (6)
Encouraging local private participation in renewable energy development
• Local private investors can own and operate small to medium scale entities in the power sector
• Either on their own or with foreign partners
• Appropriate policy and financial incentives such as:
– Enactment of lower entry requirements
– Tax holidays
– Lighter regulation of Initial Public Offers (IPOs)
Module 9
SUSTAINABLE ENERGY REGULATION AND POLICYMAKING FOR AFRICA
Support Mechanisms Applicable in
the Short Term (7)
Providing Subsidies to Rural Investments
• Rural electrification provides local benefits but has high capital cost
• Demand/usage of electricity in rural areas is low
• For a reasonable return on investment, the capital cost of rural
electrification needs to be covered in part or fully by subsidies
• Usually grants financed by donors through rural electrification funds
• Used to finance rural electrification concessions (e.g. Uganda)

SUSTAINABLE ENERGY REGULATION AND POLICYMAKING TRAINING MANUAL
page 9.142
Module 9
SUSTAINABLE ENERGY REGULATION AND POLICYMAKING FOR AFRICA
Support Mechanisms Applicable in
the Short Term (8)
Conclusions
• Relatively easy regulatory and policy initiatives can initiate renewable energy investments
• Some good examples available in Uganda, Kenya, Tanzania, Mauritius
• Such initiatives will:
– Show opportunities and bottlenecks
– Provide input for medium and longer term support instruments
Module 9
SUSTAINABLE ENERGY REGULATION AND POLICYMAKING FOR AFRICA
Questions/Activities
“Which of the described support mechanisms
could be relatively easily implemented in
your country to stimulate renewable energy
investments?”
Discuss

MODULE 9: RENEWABLE ENERGY: REGULATORY AND POLICY OPTIONS
page 9.143
Module 9
SUSTAINABLE ENERGY REGULATION AND POLICYMAKING FOR AFRICA
Support Mechanisms Applicable in
the Medium to Long Term
Feed-in Tariffs
• A minimum guaranteed price for output or
• A premium on the market price for output
• High degree of certainty for investors
• Costs to be covered by a levy per kWh (on consumers, on taxpayers, or on both)
Module 9
SUSTAINABLE ENERGY REGULATION AND POLICYMAKING FOR AFRICA
Support Mechanisms Applicable in
the Medium to Long Term (2)
Quota Mechanisms
• Obligation for electricity suppliers or customers
• Supported by tradable green certificates
• Penalty when there is non-compliance
• Government sets level of output
• Leaving choice of technology to the market
• Incentive to comply ~ level of the penalty

SUSTAINABLE ENERGY REGULATION AND POLICYMAKING TRAINING MANUAL
page 9.144
Module 9
SUSTAINABLE ENERGY REGULATION AND POLICYMAKING FOR AFRICA
Support Mechanisms Applicable in
the Medium to Long Term (3)
Tender Schemes
• Government organizes competitive bids for RE projects
• Guaranteed premium ~ increase investor confidence
• Produces stop-go development
Module 9
SUSTAINABLE ENERGY REGULATION AND POLICYMAKING FOR AFRICA
Support Mechanisms Applicable in
the Medium to Long Term (4)
Voluntary Mechanisms
• By means of green certificates
• Relying on consumer awareness and willingness to pay
• Disclosure
• Green power marketing

MODULE 9: RENEWABLE ENERGY: REGULATORY AND POLICY OPTIONS
page 9.145
Module 9
SUSTAINABLE ENERGY REGULATION AND POLICYMAKING FOR AFRICA
Support Mechanisms Applicable in
the Medium to Long Term (5)
Various Hybrid Schemes
• Involving two of the above mechanisms
• Example: Spain wind support mechanisms
• Possible to combine best of two (or more) worlds
• Avoid your system getting too complex
Module 9
SUSTAINABLE ENERGY REGULATION AND POLICYMAKING FOR AFRICA
Support Mechanisms in Practice
• Relatively new policy
• Thus far concentrated on wind power
• Tariff schemes seem more successful for wind power (so
far)
• Still unclear for biomass

SUSTAINABLE ENERGY REGULATION AND POLICYMAKING TRAINING MANUAL
page 9.146
Module 9
SUSTAINABLE ENERGY REGULATION AND POLICYMAKING FOR AFRICA
Questions/Activities
“A feed-in system will stimulate the cheapest
technology.”
True or false?
Discuss