Embed Size (px)
Citation preview

Regulations, Market Structure, Institutions, and
the Cost of Financial Intermediation
Aslı Demirgüç-Kunt, Luc Laeven, and Ross Levine∗
Keywords: Bank Concentration, Interest Margins, Overhead Costs, Bank Policies, Regulation JEL Classification: G21, G28, O16
∗Finance Research Manager, Development Research Group, The World Bank; Financial Economist, Financial Sector Operations and Policy Department, The World Bank; and Curtis L. Carlson Professor of Finance, University of Minnesota and the NBER. We thank Allan Berger, John Boyd, Gianni De Nicolo, Carola Schenone, Phil Strahan, Andrew Winton, seminar participants at the University of Minnesota, the World Bank, and the Cleveland Federal Reserve Bank, and an anonymous referee for very helpful discussions and comments. This paper’s findings, interpretations, and conclusions are entirely those of the authors and do not necessarily represent the views of the World Bank, its Executive Directors, or the countries they represent.

Regulations, Market Structure, Institutions, and
the Cost of Financial Intermediation
Aslı Demirgüç-Kunt, Luc Laeven, and Ross Levine∗
Abstract
This paper examines the impact of bank regulations, market structure, and national institutions
on bank net interest margins and overhead costs using data on over 1,400 banks across 72
countries while controlling for bank-specific characteristics. The data indicate that tighter
regulations on bank entry and bank activities boost the cost of financial intermediation. Inflation
also exerts a robust, positive impact on bank margins and overhead costs. While concentration is
positively associated with net interest margins, this relationship breaks down when controlling
for regulatory impediments to competition and inflation. Furthermore, bank regulations become
insignificant when controlling for national indicators of economic freedom or property rights
protection, while these institutional indicators robustly explain cross-bank net interest margins
and overhead expenditures. Thus, bank regulations cannot be viewed in isolation; they reflect
broad, national approaches to private property and competition.
∗Finance Research Manager, Development Research Group, The World Bank; Financial Economist, Financial Sector Operations and Policy Department, The World Bank; and Curtis L. Carlson Professor of Finance, University of Minnesota and the NBER.

1. Introduction
This paper assesses the impact of bank regulations, market structure, and national
institutions on the cost of intermediation as measured by bank net interest margins and bank
overhead expenditures. Banks mobilize and allocate society’s savings and the efficiency with
which they intermediate capital has substantive repercussions on economic performance
(Jayaratne and Strahan, 1996; Demirguc-Kunt and Maksimovic, 1998; Rajan and Zingales, 1998;
Wurgler, 2000; Beck, Levine, and Loayza, 2000; and Levine, Loayza, and Beck, 2000). Thus,
research on the determinants of the cost of intermediation will naturally enter the policy dialogue
(Group of Ten, 2001; Bank for International Settlements, 2001; and International Monetary
Fund, 2001).
Theory provides conflicting predictions about the relationships among regulations,
concentration, institutions, and bank efficiency. Many of these differences arise because of
differing beliefs about the causes of bank concentration. One common view holds that
regulatory impediments to competition and monopolistic power create an environment in which
a few powerful banks stymie competition with deleterious implications for efficiency. From this
perspective, high concentration is a useful signal of an uncompetitive and hence inefficient
market. Alternatively, the “efficient-structure” theory argues that more efficient banks have
lower costs and garner greater market share (Demsetz, 1973; Pelzman, 1977).1 From this
perspective, competitive environments may produce concentrated and efficient banking systems.
Finally, a growing literature holds that some countries have institutions that restrict competition
to protect a powerful elite (Engerman and Sokoloff, 1997; Acemoglu, et al., 2001; Haber et al.,
1 Scale economies may also drive banking to a monopolistic structure (Diamond, 1984; Boyd and Prescott, 1986).
1

2003).2 According to this “institutions” view, bank regulations and concentration reflect broader
institutional characteristics rather than representing independent determinants of bank efficiency.
To assess the impact of bank regulations, the usefulness of concentration as a signal, and to
understand the role of national institutions in shaping regulations and market structure, one needs
to examine individual banks operating in distinct regulatory and institutional environments.
This is the first study to examine the influence of bank regulations, concentration, and
institutional development on bank margins and overhead expenditures across a broad cross
section of countries while controlling for bank specific factors and cross-country differences in
macroeconomic and financial sector conditions. We use bank-level data across 72 countries and
over 1,400 banks. This sample includes great diversity in terms of the cost of financial
intermediation, other bank characteristics, bank regulations, macroeconomic and financial
conditions, and national institutions. New data on bank regulations allow us to contribute to the
public policy debate and help distinguish among theoretical models by studying the regulatory,
market structure, and institutional determinants of the cost of intermediation.
We examine two dependent variables to gauge the cost of financial intermediation: the
net interest margin and overhead expenditures. The net interest margin equals interest income
minus interest expense divided by interest-bearing assets. The net interest margin measures the
gap between what the bank pays savers and what the bank receives from borrowers. Thus, the
net interest margin focuses on the traditional borrowing and lending operations of the bank. The
overhead expenditure ratio is computed by dividing bank overhead costs by the total assets of the
bank. Cost inefficiencies and market power may be reflected in high overhead costs. Though
subject to measurement problems discussed below, the net interest margin and overhead
2 For an analysis of the politics fostering bank deregulation and policies, see Kroszner and Strahan (1999) and Rajan and Zingales (2003).
2

expenditures reflect the pure operational efficiency of the bank and the competitive nature of the
banking market. For brevity, we focus on the results using bank net interest margins because the
two dependent variables yield remarkably similar findings.
To assess and interpret accurately the relationship between the cost of intermediation and
regulations, concentration, and national institutions, we need to account for the fact that banks
differ within countries and banks differ systematically across countries. At a country-level, we
control for differences in what the term “bank” means. That is, we control for differences in
banks’ ability to conduct securities market, insurance, and real estate operations, and whether
banks can own nonfinancial firms. We also control for the degree of state-ownership of
commercial banks. At the bank-specific level, we control for bank size, the liquidity of bank
assets, bank equity relative to its assets, the degree to which the bank raises income through fees
and commissions, the standard deviation of each bank’s return on assets, and the market share of
each bank. Although the relationships between bank margins and these bank-specific variables
are independently informative as we discuss below, our focus is on the impact of bank
regulations, concentration, and national institutions on bank margins. Thus, we primarily use
these bank-specific variables to control for country-level and bank-level differences that might
confound the inferences that we draw on bank regulations, concentration, and national
institutions.
To examine bank regulations, we exploit Barth, Caprio, and Levine’s (2001b, 2003) new
database. We focus on regulations concerning bank entry, reserve requirements, restrictions on
bank activities, and an overall index of regulatory restrictions on banks. Thus, we use an
assortment of information on the degree to which regulations may impede bank operations and
competition.
3

To study the impact of bank concentration on the cost of intermediation, we primarily use
the fraction of assets held by the three largest banks. We confirm our results using alternative
measures of bank concentration. If bank concentration reflects only regulatory restrictions on
competition and our data fully measure regulatory restrictions, then any positive relationship
between bank margins and concentration should vanish when controlling for regulatory
restrictions. If concentration reflects regulatory restrictions and efficient-structure forces, then
we may actually find a negative coefficient on concentration after controlling for regulatory
impediments to competition.
We also analyze the impact of institutions on the cost of intermediation using indicators
of property rights protection and the degree of economic freedom. Controlling for institutions
permits us to assess whether bank regulatory policies influence bank margins and overhead costs
beyond broad national approaches to competition. If bank regulatory policies reflect national
approaches to competition in general and our data comprehensively measure institutions, then
any association between regulations and the cost of intermediation should disappear when we
control for the overall level of institutional development governing property rights and
competition.
To assess the robustness of the links between the cost of financial intermediation and
regulations, market structure, and institutions, we control for various theories of the role of
macroeconomic influences on bank margins and overhead expenditures. Huybens and Smith
(1999), for instance, stress that inflation exacerbates informational asymmetries and therefore
leads to larger interest margins. We examine this prediction. Also, we control for the level of
equity market development since competition from other segments of the financial system may
influence the cost of intermediation. Furthermore, since business-cycle fluctuations and
4

government ownership of banks may influence the pricing of loans and deposits, we include
GDP growth and the extent of state-ownership of banks in the analyses.
There are at least three important reasons for examining a broad cross-section of
countries in assessing the relationship between the cost of intermediation and bank regulations,
bank concentration, and national institutions. First, although past research focuses on the U.S.,
the U.S. banking industry is unrepresentative. For example, the U.S. has over 23,000 banking
institutions, which is large even compared to Japan (4,635), Germany (3,509), and France (547).3
Also, the U.S. has very developed financial, legal, and regulatory systems, few state-owned
banks, and strong protection of private property, but these features do not hold in many
countries. Thus, it is important to look beyond the U.S. and to control for differences in
institutional development in drawing inferences about the impact of banking structure and
regulations on net interest margins. Second, existing work focuses on concentration as a signal
of competitiveness, but concentration per se is difficult to interpret. Theory suggests that
concentration reflects many factors, including regulatory restrictions on competition, efficient-
structure forces, and market power by banks.4 By controlling for regulatory restrictions on bank
competition, bank-specific characteristics, and the overall institutional environment, we narrow
the range of factors for which concentration proxies. This can only be done in a cross-country
context. Thus, while not fully resolving the interpretational problem with bank concentration,
we obtain more informative measures of the impact of bank concentration on net interest margins
3 These statistics are for 1996 and are taken from Berger, Demsetz, and Strahan (1999, Table 5). 4 While a few influential papers examine the relationship between concentration and efficiency outside of the U.S., they do not control for cross-country differences in regulatory restrictions on bank competition. Similar to the U.S. studies, the non-U.S. studies also tend to produce ambiguous results on the concentration-efficiency relationship (Goldberg and Rai, 1996; Lloyd-Williams, Moyneux, and Thornton, 1994). Using cross-country banking data, Demirguc-Kunt and Huizinga (1999) find little evidence that bank concentration has any effect on bank profitability or margins. In a cross-country, cross-industry study Cetorelli and Gambera (2001) show that banking sector concentration exerts a depressing effect on overall economic growth, though it promotes the
5

across countries. Finally, although Jayaratne and Strahan (1996, 1998) and Stiroh and Strahan
(2003) examine the impact of the deregulation of branching restrictions in the United States, we
provide estimates of the impact of numerous regulations on bank efficiency across 72 countries
while controlling for bank concentration, national economic and banking conditions, and cross-
country differences in a range of institutional features.
Our research is related to an enormous literature on bank structure and efficiency. We
focus on a few key papers that motivate our approach and refer readers to more comprehensive
reviews (Bank for International Settlements, 2001; Berger and Mester, 1997; Berger, Demsetz,
and Strahan, 1999; Boyd and Graham, 1991, 1998; Group of Ten, 2001; and International
Monetary Fund, 2001). Most of the empirical evidence on banking structure and efficiency
examines the U.S. banking industry, producing generally ambiguous results. Some evidence
suggests that banks in highly concentrated local markets have larger overhead expenditures,
charge higher rates on loans, pay lower rates on deposits, and are slower to reduce rates in
response to Federal Reserve reductions in interest rates than banks in less concentrated markets
(Berger and Hannan, 1989, 1998; Hannan and Berger, 1991; and Neumark and Sharpe, 1992).
Others disagree. Smirlock (1985) and Graddy and Kyle (1979) find that interest rate spreads are
narrower in concentrated banking systems, while Whitehead (1977, 1978) and Keeley and
Zimmerman (1985) report more mixed results. Although Berger, Saunders, Scalise, and Udell
(1998) find that the best performing banks are generally not located in highly concentrated
markets and Rajan and Peterson (1995) find that firms are less credit constrained in more
concentrated banking markets, other researchers do not find unambiguous evidence that mergers
and acquisitions that increase bank concentration systematically lower deposit rates and increase
growth of industries that depend heavily on external finance. See Claessens and Laeven (2004) on the factors driving cross-country differences in bank competition.
6

bank profitability (Prager and Hannan, 1999; Simons and Stavins, 1998; Berger and Humphrey,
1992; Pilloff, 1996; and Petersen and Rajan, 1994). Berger (1995) concludes that the
relationship between bank concentration and efficiency in the United States depends critically on
what other factors are held constant (Berger, Hunter, and Timme, 1993; Boyd and Runkle, 1993;
Clark, 1988; Berger and Mester, 1997; Radecki et al., 1997; Vives, 2001; Hughes et al., 1999;
and Berger et al., 2000). We contribute to this work by extending the analysis to a large number
of countries and controlling for cross-country differences in institutional development and
regulatory policies.5
The paper is organized as follows. Section 2 discusses the econometric methodology.
Section 3 discusses the data. Section 4 presents the results, and Section 5 concludes.
2. Methodology
To assess the impact of bank regulations, banking sector concentration, and institutional
development on bank efficiency while controlling bank-specific characteristics and the
macroeconomic and financial environment, we estimate regressions of the following form:
Net Interest Margini,k = α + β1Ci + β2BB
i,k + β3Ri + β4Mi + β5Ii + εi,k (1)
Where i indexes country i, and k indexes bank k; Ci is a measure of bank concentration in
country i; Bi, k is a vector of bank-specific characteristics for bank k in country i; Ri is a vector of
regulatory restrictions on banks; Mi is a vector of macroeconomic and financial system control
5 Existing research on economics of scope and scale also focuses on the U.S. banking industry and generally does not find large cost savings or efficiency gains from consolidation (Berger et al., 1987; Ferrier et al., 1993; Rhoades, 1993, 1998; Peristiani, 1997). Indeed, researchers find that the cost curve facing U.S. banks is very flat, with estimates of scale-efficient size as low as $100 million of assets (Berger and Humphrey, 1991; Boyd and Runkle, 1993; Clark, 1996; Berger, Demsetz, and Strahan, 1999). We do not estimate a cost curve for banks. In examining the determinants of net margins, however, we do examine bank size while controlling for the independent effects of bank regulations, bank concentration, the macroeconomic environment, institutional development, and other bank specific traits.
7

variables; Ii is a vector of institutional development indicators; and εi,k is the residual. As
stressed above, we examine overhead expenditures instead of net interest margins in robustness
checks. We obtain extraordinarily consistent results using overhead expenditures and report the
only discrepancy below.
Since the model includes country-specific variables, we use a generalized least squares
estimator with random effects. The random effects specification is supported by the Breusch and
Pagan (1980) Lagrange multiplier test, which strongly rejects the null hypothesis that errors are
independent within countries.
To conduct the analyses, we need measures of (1) net interest margins, (2) bank
concentration, (3) bank-specific characteristics that may influence interest margins, (4)
regulatory policies, (5) cross-country differences in the macroeconomic environment and the
level of stock market development, and (6) cross-country differences in the level of institutional
development, e.g., the degree to which broad, national institutions support private property rights
and promote economic openness and competition in general.
3. Data
We use two main data sources. Bank-level information from 72 countries on over 1400
banks is from the BankScope database provided by Fitch-IBCA. The BankScope database has
comprehensive coverage in most countries, accounting for over 90 percent of all banking assets.
As specified in more detail below, we use data over the 1995-1999 period. One advantage of
using data averaged over the 1995-99 period is that we smooth variables that vary over time.
Information on commercial bank regulations is obtained from the Barth, Caprio and Levine
(2001b, 2003) database. Since the regulatory data are for commercial banks, we use bank-level
8

data on commercial banks from the BankScope database.6 Also, focusing on commercial banks
enhances the comparability of banks in our sample since some countries have banks that are not
classified as commercial banks. Table 1 provides summary statistics.
3.1 Net Interest Margin
Net interest margin equals interest income minus interest expense divided by interest-
bearing assets and is average over 1995-1999. The net interest margins measures the gap
between what the bank pays the providers of funds and what the bank gets from firms and other
users of bank credit. Since the net interest margin focuses on the conventional borrowing and
lending operations of the bank, we normalize by interest-bearing assets rather than total bank
assets. Belarus, Burundi, Ghana, and Moldova are notable for their margins of over 10 percent,
whereas countries like Switzerland and Netherlands have very low margins of less than two
percent.
We use a variety of control variables and sensitivity checks to mitigate problems with
interpreting the net interest margin variable. We want to hold a sufficient amount constant such
that we can interpret greater net interest values as reflecting either operational inefficiency or
market power. Confounding issues arise, however. For instance, banks engaging in fee income
generating activities may have different net interest margins because of cross-subsidization of
activities. For example, commercial banks may reduce lending rates to borrowers that also use
bank services that generate fee and commission income, such as underwriting of securities and
consulting advice on mergers and acquisitions. In this case, cross-bank differences in net interest
margins may reflect difference in bank activity, rather than differences in efficiency or
competition. Also, bank inefficiencies and market conditions may yield high overhead costs
6 Detailed variable definitions are provided in the longer working paper version of this paper.
9

rather than large interest margins. Thus, cross-bank differences in net margins may reflect
choices regarding whether to enjoy high overhead costs or large margins rather than reflecting
differences in efficiency and competition. Furthermore, bank margins may reflect different asset
allocations and risk tastes of firms. These measurement and interpretational issues emphasize
the need to control for bank specific characteristics, conduct an array of sensitivity checks, and to
use alternative measures of bank efficiency/performance.7 As discussed above, we confirm the
results using overhead expenditures as an alternative dependent variable, which we define below.
3.2 Concentration
Bank concentration equals the fraction of bank assets held by the three largest
commercial banks in the country and is averaged over 1995-99. Bank concentration is computed
using bank-level data from the BankScope database. Bank concentration ranges from a low of
20 percent for the U.S. to 100 percent in Burundi and Rwanda. But high concentration is not
only a developing country phenomenon. Belgium, Denmark, the Netherlands and Switzerland
have concentration levels over 70 percent. For robustness, we confirm this paper’s results using
alternative bank concentration measures that we discuss below.
3.3 Bank-specific Control Variables
We control for bank-specific traits. We use 1995 values to reduce potential simultaneity
with interest margins, which is computed over the period 1995-1999. The results, however, do
not change when using bank-specific control variables averaged over the 1995-99. Moreover,
we obtain the same results on the country-specific variables when we omit the bank-specific
7 Studies in the United States focusing on the efficiency-structure relationship have used price data from extensive surveys conducted by the Federal Reserve System. See for example Berger and Hannan (1989). In these studies, banks are assumed to be more efficient if they set prices that are more favorable to customers (higher deposit rates, lower loan rates); in other words if they have lower ex-ante margins. Such data are not available on a cross-country basis.
10

variables altogether. Thus, endogeneity problems from the bank-specific variables are not
biasing the conclusions on our variables of focus: bank regulations, bank concentration, and
institutional development.
Bank size equals the logarithm of total bank assets in millions of US dollars. Size may be
an important determinant of net interest margins if there are increasing returns to scale in
banking.
Bank equity equals the book value of equity divided by total assets. Some theories
suggest that well-capitalized banks face lower expected bankruptcy costs and hence lower
funding costs. According to this view, higher bank equity ratios imply larger net interest
margins when loan rates do not vary much with bank equity.8
Fee income equals non-interest-operating income divided by total assets. Banks have
different product mixes. These differences may influence the pricing of loan products. Some,
for instance, argue that well-developed fee income sources will produce lower interest margins
due to cross-subsidization of bank activities. Thus, we control for fee income in assessing the
impact of bank regulations, bank concentration, and national institutions on bank margins.
Liquidity equals the liquid assets of the bank divided by total assets. We use this
indicator to control for differences in bank assets. Banks with high levels of liquid assets in cash
and government securities may receive lower interest income than banks with less liquid assets.
If the market for deposits is reasonably competitive, then greater liquidity will tend to be
negatively associated with interest margins.
8 There is quite a bit of variation in bank capitalization despite international capital adequacy requirements. Banks in Japan, Finland, Rwanda, and Korea have very low capital ratios of less than five percent. Banks in Mexico appear to be very highly capitalized with ratios of over 20 percent. Such a wide variance raises questions of comparability. BankScope organizes the accounting data so as to be comparable internationally. However, differences in accounting conventions regarding the valuation of assets, loan loss provisioning, hidden reserves and other problems remain. Thus, we conducted the analyses both with and without bank equity in the regressions and found very similar results to those reported below.
11

Bank risk equals the standard deviation of the rate of return on bank assets over the
period 1995-99. Some hold that banks operating in more risky environment will tend toward an
equilibrium characterized by a high net interest margin to compensate for this risk. Thus, to
assess the independent effect of regulations, bank concentration, and institutions on bank
margins, we present regressions controlling for individual bank risk.
Overhead equals overhead costs divided by total assets. We use this to capture cross-bank
differences in the organization and operation of the bank. Different organizations will choose
different business systems, product mixes, and asset allocations with consequently different
overhead cost structures. Also, cost inefficiencies or low levels of market competition may be
reflected in high overhead costs. Given that overhead may measure cost inefficiency and market
competition, we first conduct the analyses excluding overhead as a regressor. Then, we use
overhead as an alternative measure of bank efficiency/performance, i.e., as the dependent
variable (using overhead averaged over the 1995-1999 period). Finally, we include overhead (in
1995) as a control variable. These different analyses confirm the paper’s conclusions.
Market share equals the bank’s assets divided by total commercial bank assets in the
economy. A bank that dominates the national market may enjoy a larger net interest income than
a bank that does not control much of the market even after controlling for bank size. In other
words, a bank with a large market share may exert market power to enjoy a higher net interest
margin. Note this is different from concentration. Concentration is not computed at the bank-
level; it is a national characteristic. Clearly, there is a relationship. In the case of a country with
a single bank, market share and concentration will both equal one. Just as clearly, however,
there can be concentrated banking systems in which many banks do not have much market share.
Indeed, although the Market share and Bank concentration variables are significantly correlated,
12

the correlation coefficient is quite low (0.12). We conduct the bulk of the analysis without
market share and then show that the results are robust to its inclusion.
3.4 Regulatory Variables
Fraction of entry denied equals the fraction of entry applications denied. This figure is
above 75 percent in Bangladesh, Egypt, Ghana, Kenya, and Thailand. On the other extreme,
many countries including Germany, Switzerland and the United States have granted licenses to
all applicants. One problem with this measure is that in the absence of applications – which may
itself indicate the presence of insurmountable entry barriers – this variable is not defined.
However, when we replace the missing values with ones in those countries that received zero
entry application, we obtain very similar results to those reported below. Also, we found similar
results when we separately examine the fraction of entry denied for domestic and foreign
applicants respectively.9
Activity restrictions is an indicator of the degree to which banks face regulatory
restrictions on their activities in securities markets, insurance, real-estate, and owning shares in
non-financial firms. Activity restrictions may also have an important impact on bank efficiency
by reducing competition and limiting economies of scope (Barth, Caprio and Levine, 2001a;b;
2003). The indicator potentially ranges from 0 to 4, where higher values indicate greater
restrictions. Indonesia and Japan have severe restrictions on bank activity, with values of 3.75
and 3.5 respectively. Germany, Austria, the United Kingdom, and Switzerland do not impose
9 We also examined Foreign ownership, which equals the proportion of banking assets held in foreign-controlled banks – defined as 50 percent or more foreign-owned. In Ghana, Hungary, and Jordan, foreign owned banks represent greater than 50 percent of the banking system. At the other extreme, India, Rep. of Korea, and Nigeria have negligible foreign ownership. While we find a close relationship between net interest margins and restrictions on bank entry, we do not find that foreign ownership per se is important for accounting for interest margins. See, Levine (2003) for more on the impact of foreign banks.
13

many restrictions on bank activities (Activity restrictions equals 1.25). In our sample, banks
differ substantially in their ability to engage in different activities as noted in Table 1.
Reserve requirements takes on the value one if there are reserve or liquidity requirements
and zero otherwise. About a quarter of the countries in the sample have no reserve requirements.
To the extent that reserve holdings are not remunerated or remunerated at less-than-market rates,
these regulations impose a tax on the bank.10
Banking freedom is an overall indicator of banking freedom that ranges from 1 to 5.
Larger values signify more freedom. This variable comes from the Economic Freedom Index of
the Heritage Foundation and is designed to provide an overall measure of the openness of the
banking industry and the extent to which banks are free to operate their businesses. Since it may
be difficult to identify a single, key regulation that explains net interest margins, we also
examine this overall index of bank freedom.
3.5 Macroeconomic and Financial System Control Variables
Inflation equals the annual rate of the change in CPI index. Boyd, Levine and Smith
(2001) show that countries with high inflation have underdeveloped financial systems and banks.
Huybens and Smith (1999) develop a theoretical model in which interest margins tend to rise in
the presence of inflation. Thus, we control for inflation in our analyses.
GDP growth equals the rate of real per capita GDP growth. If investment opportunities
in an economy are correlated with the business cycle, there may exist a positive relationship
between business opportunities for banks and the growth rate of the economy.
Total value traded equals the trading of domestic equities on domestic exchanges as a
share of GDP. We include this measure of stock market development (Levine and Zervos, 1998)
14

because countries with better functioning markets may create a competitive environment that
puts downward pressure on bank interest margins.
State ownership equals the share of banking system assets that are in state-owned banks,
where state-owned is defined as 50 percent or more state-ownership. This measures government
involvement in the banking industry. Banking systems dominated by state-banks tend to be
inefficient and less open to entry (La Porta, Lopez-de-Silanes, and Shleifer, 2002). In our
sample, Bangladesh, Belarus, Burundi, Egypt, India, Romania and Russia have banking systems
where state-owned banks account for more than 60 percent of the market.
3.6 Institutional Impediments to Competition
Besides examining specific regulatory restrictions on competition and the impact of bank
concentration on net interest margins, we also consider three indexes of the overall institutional
environment. In particular, we assess whether bank regulation and concentration influences bank
interest margins beyond the overall institutional structure of the economy.
Property rights is an indicator of the protection of private property rights. It ranges from
1 to 5. Higher values signify greater protection of private property rights. There are some
countries that do a poor job of protecting private property rights. Rwanda’s Property Rights
index equals one, while it equals two for Bangladesh, Burundi and Romania. While a large
number of countries have Property Rights index values of five.
KKZ Institution index is an aggregate index of the level of institutional development.
Kaufman, Kraay, and Zoido-Loboton (2001) compile information on (i) voice and
accountability, i.e., the extent to which citizens can choose their government and enjoy political
rights, civil liberties, and an independent press, (ii) political stability, i.e., a low likelihood that
10 We also examine the stringency of capital requirements as computed by Barth, Caprio, and Levine (2003). The
15

the government will be overthrown by unconstitutional or violent means, (iii) government
effectiveness, i.e., the quality of public service delivery, competence of civil servants, and the
absence of politicization of the civil service, (iv) light regulatory burden, i.e., relative absence of
government controls on goods markets, government interference in the banking system,
excessive bureaucratic controls on starting new businesses, or excessive regulation of private
business and international trade, (v) rule of law, i.e., protection of persons and property against
violence or theft, independent and effective judges, contract enforcement, (vi) freedom from
graft – absence of the use of public power for private gain, corruption.
Economic freedom equals an overall index of economic freedom. It measures the extent
to which individuals and firms feel free to conduct their businesses. Since Economic freedom
and the KKZ Institution index explicitly include information on the freedom to conduct banking
operations, we do not include the indexes and the bank regulation variables simultaneously in the
analyses. Including Economic freedom and the KKZ Institution index simultaneously with the
regulatory variables, however, confirms the results below. Economic freedom ranges in value
from 1 to 5, with greater values signifying better protection of freedoms. The United Kingdom,
the United States, and Switzerland have indexes of greater than 4.05. Burundi and Rwanda have
Economic Freedom indexes of less than 1.9.
GDP per capita equals real per capita GDP expressed in thousands of 1995 US dollars.
Since it is very difficult to define and measure the important features of well-functioning
institutions, we also use GDP per capita as a general indicator of institutional development.
A broad set of research suggests that better institutions will promote greater competition
throughout the economy. This work predicts that better institutions will negatively influence net
interest margins (Engerman and Sokoloff, 1997; Acemoglu, et al., 2001; Easterly and Levine,
capital stringency index, however, did not robustly enter the net interest margins regression significantly.
16

2003). However, Bianco, Jappelli, and Pagano’s (2001) research indicates that the impact of
overall institutional quality on net interest margins is theoretically ambiguous. On the one hand,
improvements in the institutional environment (encompassing better property rights, stronger
contract enforcement, and a higher level judicial efficiency) increase the value of collateral for
bank loans and therefore reduce the cost of financial intermediation for existing borrowers. On
the other hand, such improvements can extend the credit market to low-grade borrowers and
thereby raise the average interest rate paid on loans. As a result, the impact of better institutions
on net interest margins could be ambiguous. We empirically examine the impact of overall
institutional development on net interest margins.
3.7 Summary Statistics
The Table 1 Panel B correlations highlight key relationships. The results indicate that
tighter regulatory restrictions (more Fraction entry denied, more Activity restrictions, less
Banking freedom) and higher levels of bank concentration are associated with bigger net interest
margins. Furthermore, the correlations show that better institutions (Property rights protection,
KKZ Institution index, Economic freedom) are negatively correlated with bank interest margins
and negatively associated with regulatory restrictions. Furthermore, macroeconomic instability,
as proxied by inflation, is positively associated with net interest margins, while greater stock
market development (Value traded) is negatively linked with bank interest margins. The
correlations among these national characteristics suggest that it is important to control for a range
of factors in assessing the impact of any of these country traits on the cost of financial
intermediation.
17

Moving beyond correlations, we now examine the relationship between net interest
margins and bank regulations, bank concentration, and the institutional environment while
controlling for bank-specific characteristics and the macroeconomic and financial environment.
4. The Results
4.1 Bank-specific Effects and Concentration
Table 2 presents regressions of net interest margin on bank specific variables, bank
concentration, and the regulatory variables. Depending on data availability for the regulatory
variables, there are between 55 and 71 countries and between 1217 and 1372 banks. The table
provides within-country and between-country R2’s for each regression.
First, consider the bank-specific variables in Table 2. Large banks tend to have lower net
interest margins than small banks. This is consistent with models that emphasize the positive
role of size arising from scale efficiency. Banks that hold a high fraction of liquid assets have
lower net interest margins. This is consistent with banks receiving lower returns on holding cash
or securities, but facing a competitive market for deposits. Highly capitalized banks have higher
margins, which is consistent with theories stressing that highly capitalized banks can charge
more for loans and/or pay less on deposits because they face lower bankruptcy risks. Finally,
banks engaging in fee-based activities tend to have lower margins, consistent with – though not
direct evidence of – cross-subsidization of bank activities.
Now, consider concentration. As shown in Table 2, bank concentration enters positively
and significantly at the five-percent level in all of the regressions. While the impact of
concentration on net interest margins is not inconsequential, the economic magnitude is not
huge. For instance if Romania were to change from its very highly concentrated banking
structure (Bank concentration = 0.78) to the level in Poland (0.57), this would represent a one-
18

standard deviation change in bank concentration. If we use the coefficient from regression 2
(2.3), Romania’s reduction in bank concentration would translate into a reduction in its net
interest margin from 8.45 to 7.97, which is a bit less than one-fourth of a standard deviation drop
in the net interest margin. The economic effect of concentration is further illustrated by
comparing Burundi and Kenya. Burundi’s level of bank concentration is 1, i.e., the three largest
commercial banks fully account for the banking system in Burundi. If it had the level of bank
concentration in Kenya (0.57), this would involve a two-standard deviation reduction in bank
concentration. Again using the coefficient from regression 2, Burundi’s two-standard deviation
reduction in bank concentration would translate into a reduction in its net interest margin from
10.74 to 9.95, which is about 0.40 of a standard deviation, and would not dramatically close the
gap with Kenya’s net interest margin (7.46).
4.2 Regulatory Restrictions
Table 2 also evaluates the impact of regulatory variables. We include (1) Fraction of
entry denied, (2) Activity restrictions, (3) Reserve requirements, and (4) Banking freedom one-
at-a-time while controlling for Bank concentration and the bank-specific factors.
The results indicate that regulatory restrictions substantively increase net interest
margins. First, in countries that deny a higher fraction of bank entry applications, margins are
larger. This is consistent with the view that restricting entry protects existing banks and allows
them to enjoy larger margins. Note this is the only finding that differs when using overhead
expenditures instead of net interest margins as the dependent variable. With overhead
expenditures, the restricting entry index does not enter significantly at the 0.05 level.
The Table 2 regressions also indicate that, in countries that restrict banks from engaging
in non-traditional activities, such as securities underwriting, real estate, owning non-financial
19

firms, and insurance, margins tend to be larger. The economic size of the effect is substantial.
For instance, if Mexico had the same level of restrictions on activities as Korea (2.25 instead of
3), this one-standard deviation drop in Activity restrictions would induce a full percentage point
drop in net interest margins in Mexico according to regression 2 (0.75*1.4). Thus, a one-
standard deviation drop in Activity restrictions translates into 0.6 of a standard deviation drop in
margins. Third, consistent with some theories, reserve requirements tend to boost net interest
margins. This relationship is not very strong, however; the coefficient is significant at the 0.10
level. Finally, greater regulatory restrictions on operating a banking business in general are
associated with higher banking margins. In sum, regulatory restrictions tend to boost margins.
4.3 The Macroeconomic and Financial Sector Environment
Tables 3 and 4 examine the relationship between net interest margin, bank concentration,
bank-specific traits, and selected features of the macroeconomic and financial sector
environment. We do this both to study the relationship between net interest margins and these
macroeconomic and financial sector controls and to assess the robustness of the findings on bank
concentration and the bank-specific features to controlling for national characteristics. Table 3
reports results without the regulatory variables. Table 4 adds the regulatory variables.
The macroeconomic and financial features help explain cross-bank net interest margins
(Table 3). First, higher inflation rates are positively associated with net interest margins.
According to the estimates, a one-standard deviation increase in the rate of inflation (i.e., nine
percentage points) boosts net interest margins by 0.36 of a percentage point (9*0.04). Thus,
while significant, inflation’s impact on net interest margins is not economically huge. Second,
the regression results indicate that economic growth is negatively associated with net interest
margins at 10 percent significance level. Third, total value traded enters negatively and
20

significantly in regression (3) of Table 3. The coefficient estimate suggests that if Mexico had
the same level of stock market development as the United States (0.70 instead of 0.12), then this
would eliminate the difference in the net interest rate margin between the United States (4.3) and
Mexico (5.7). Fourth, the degree of state ownership of the banking industry is positively linked
with net interest margins. Fifth, the data indicate that inflation retains a strong, positive
independent relationship with net interest margins while controlling for the other macroeconomic
variables. The other macroeconomic and financial controls, however, are no longer significantly
correlated with net interest margins at the five percent significance level. Finally, note that the
Table 3 results on the bank specific variables and Bank concentration are very similar to the
Table 2 results when we control for the regulatory environment.
4.4 Regulatory Environment, plus Controlling for Inflation
Next we examine the impact of bank regulations and bank concentration on net interest
margins while controlling for bank characteristics and inflation (Table 4). We report the results
while controlling for only the inflation rate and not the other macroeconomic and financial sector
features because (i) theory suggests that inflation influences interest margins, (ii) inflation
remained significantly associated with the net interest margin when including additional
macroeconomic and financial controls, (iii) the macroeconomic/financial variables are highly
correlated (Table 1), and (iv) we obtain the same results when using the other
macroeconomic/financial controls. Finally, note that inflation is positive and significant across
the different specifications in Table 4.
The Table 4 results confirm that restrictive bank regulations boost net interest margins
when controlling for macroeconomic conditions. When controlling for inflation, Fraction of
21

entry denied and Activity remain significantly positively correlated with net interest margin.
Banking freedom enters with a significantly negative coefficient.
Furthermore, note that the relationship between net interest margins and bank
concentration virtually vanishes when including inflation and the regulatory environment. When
controlling for either Activity restrictions, Reserve requirements, or Banking freedom,
concentration enters significantly only at the 10 percent level and concentration enters
insignificantly when controlling for the Fraction of entry denied. Also, note that concentration
never enters negatively and significantly. Thus, the results do not provide supportive evidence
for theories stressing that a few, highly efficient banks will dominate the market, leading to a
negative associate between concentration and efficiency when controlling for impediments to
competition. These results do not reject that the hypothesis that there are economic forces at
play that induce more efficient banks to capture greater market share. Rather, this paper’s more
limited conclusion is that after we control for macroeconomic stability and include proxy
measures – albeit imperfect measures-- of regulatory impediments to competition, concentration
is unrelated to bank net interest margins at the 0.05 significance level.
4.5 Institutional Setting
In Table 5 we examine the impact of the institutional setting on bank net interest margins
when controlling for Bank concentration, inflation, and bank-specific controls. Then, in Table 6,
we expand the analysis by also including regulatory restrictions.
First, the results document a strong link between institutions – such as Economic
freedom, Property rights protection, and the KKZ Institution index – and net interest margins
(Tables 5 and 6). Countries where the overall institutional environment is conducive to private
sector competition tend to have lower interest margins. The coefficient estimates in regression 3
22

imply that if Mexico had the same level of Economic freedom as the United States (4.2 instead
of 2.9), this would more than eliminate the net interest difference of the two countries by
bringing Mexico’s net interest margin of 5.7 down below the U.S. level of 4.3. Thus, the overall
institutional environment is importantly linked with net interest margins.
Second, after controlling for the institutional environment, Bank concentration no longer
enters significantly even at the 0.10 significance level (Tables 5, 6). While concentration
remained significantly associated with net interest margins at the 0.10 when controlling for
regulatory restrictions (Table 4), Tables 5 and 6 show that concentration enters insignificantly
when controlling for overall institutional development.
Third, when we include concentration, bank-specific controls, inflation, regulatory
restrictions, and Property rights simultaneously, we find that (1) Property rights matter for
explaining margins, (2) regulatory restrictions do not provide additional explanatory power, (3)
inflation remains significantly positively associated with margins, and (6) the remaining bank-
specific controls remain significant as discussed above. As noted, we do not include the other
institutional indicators in Table 6 because the KKZ Institution index and Economic freedom
measure include information on bank regulations. This would bias the results against finding a
significant coefficient on the regulatory restriction measures. Indeed, we get the same results
when including the KKZ Institution index and Economic freedom measure. Since the regulatory
variables do not enter significantly when including the Property rights index, this suggests that
bank regulations reflect something broader about the competitive environment.
We interpret these results as suggesting that there are broad national approaches to
competition and property rights that help explain economic efficiency throughout the economy,
23

including the banking industry. Once we account for these broad institutions, bank specific
regulations and bank competition have no additional explanatory power.
4.6 Robustness
We have conducted a large number of sensitivity analyses. Many of these have already
been mentioned. Here we mention some additional checks.11
First, as emphasized in the Introduction, we confirm the results using overhead
expenditures as a share of bank assets as the dependent variable. The Table 7 findings confirm
this paper’s conclusions. Bank concentration and regulatory restrictions do not help explain
cross-bank differences in overhead costs when controlling for the overall level of institutional
development.
Second, Table 8 presents pure cross-country comparisons by averaging across the banks
in each country. Thus, we use one observation per country and do not control for any bank-
specific factors. The dependent variable is the average net interest margin across the banks in a
particular country. These regressions eliminate the bank-specific information. Thus, if bank-
specific endogeneity is driving the early results, then removing bank specific-effects should
reverse the findings. That is not the case. As show, bank concentration is unconditionally
positively associated with net interest margins. Furthermore, activity restrictions and banking
freedom are very closely linked with net interest margins even when controlling for inflation and
bank concentration. Moreover, bank concentration and regulatory restrictions become
insignificant when we control for Property rights. Thus, the pure cross-country results confirm
this paper’s bank-level analyses.
11 The longer working paper version provides the results from these additional tests.
24

Third, we also examine market share (Table 9). Unlike concentration, market share is a
bank specific variable that measures the relative size of the individual bank. We again confirm
the paper’s findings. When controlling for market share, we find that regulatory restrictions on
bank activity tends to boost net interest margins when also conditioning on bank concentration
and other bank-specific factors.
We find that market share enters positively and significantly, consistent with the view
that banks that are relatively large compared to the market can exert market power to increase
rents. Furthermore, when adding institutional development to the analysis, we again find that
Property rights lowers net interest margins and the regulatory variables no longer enter
significantly. Throughout the analysis, market share enters positively and significantly. When
individual banks enjoy market power, they charge higher net interest margins even after
controlling for other bank specific traits, overall market concentration, regulatory restrictions on
banks, and overall level of institutional development.
Fourth, we confirm the results using three alternative measures of bank concentration.
The three measures are as follows. Bank concentration (Top-5) equals the fraction of
commercial bank assets held by the five largest commercial banks in the country, instead of the
three largest banks. Bank concentration (All) equals the fraction of all bank assets, not only
commercial banks assets, held by the three largest banks in the country. Finally, Bank
concentration (Deposits) equals the share in total deposits of the deposits of the five largest
banks in the country. Unlike the other measures, this indicator is not from Bankscope data, but is
25

taken from Barth, Caprio, and Levine (2001b, 2003) and is based on bank deposits, not assets.12
We obtain very similar results using these different concentration measures.
Fifth, we focused on countries with very high concentration levels. Specifically, we
created dummy variables for those countries with concentration values of greater than 80
percent. We then examined whether countries with these very high concentration levels were
different, i.e., did very high concentration imply high net interest margins even when controlling
for the institutional environment. Again, we find that once we account for broad national
institutions, bank concentration and a dummy variable that identifies highly concentrated
systems have no additional explanatory power.
Sixth, we control for the riskiness and profitability of individual banks. Since banks that
assume different levels of risk may charge different interest rates, we control for the standard
deviation of the return on assets of each bank. This does not alter our findings. We further
extended the analyses by controlling for bank profits as measured by return on assets. Again,
controlling for bank risk and return on assets did not change the results.
Seventh, we confirm that the results hold when using bank-specific factors averaged over
the 1995-99 period rather than using the initial values of the bank-specific variables.
Finally, we confirm this paper’s results using alternative samples. We have confirmed
the results when omitting Latin American countries, Sub-Saharan African economies, or the
United States. Also, we confirm the results when excluding very small countries (e.g., countries
with populations of less than one million). Similarly, for some countries, we only have data on
three or fewer banks. The results are unchanged when restricting the sample to countries for
which we have data on four or more banks.
12 The correlation coefficients between the different concentration measures are high and significant at the one percent level. The correlation at the country level with Bank concentration is 0.97 for Bank concentration (Top-5),
26

5. Conclusions
This paper investigates the impact of bank regulations, concentration, and institutions on
bank net interest margins and overhead expenditures using bank level data across 72 countries
while controlling for a wide array of macroeconomic, financial, and bank specific-traits. In
summary, we emphasize four findings.
First, individual bank characteristics explain a substantial part of the within-country
variation in financial intermediary costs. High net interest margins and large overhead
expenditures tend to be associated with small banks, banks that hold a low fraction of liquid
assets, banks that hold a relatively low amount of capital, banks without substantial income from
fee-based activities, and banks with a large market share. The latter finding is consistent with the
view that banks that are relatively large compared to the market can exert market power to
increase rents.
Second, bank regulations help explain the cost of financial intermediation. Tighter
regulations on bank entry, restrictions on bank activities, and regulations that inhibit the freedom
of bankers to conduct their business boost bank net interest margins. These results hold when
controlling for banking sector concentration, bank-specific characteristics, and the rate of
inflation. Furthermore, complimentary research does not find countervailing benefits from
regulatory restrictions on bank entry, activities, or freedom in terms of (a) bank stability, (b)
firms’ access to external finance, (c) bank valuations, or (d) overall financial development (Beck,
Demirguc-Kunt, and Levine, 2003a,b; Barth, Caprio, and Levine, 2003; Caprio, Laeven, and
Levine, 2003).
Third, there is an important caveat to the finding that bank regulations explain net interest
margins and overhead expenditures: bank regulations cannot be viewed in isolation from the
0.97 for the Bank concentration (All), and 0.85 for the Bank concentration (Deposits).
27

overall institutional framework. Bank regulations reflect broader, national institutions associated
with the protection of private property rights and the freedom to compete in the economy. Thus,
when controlling for these broader, national institutions, bank regulations do not provide
additional explanatory power of cross-bank net interest margins. Institutional development,
however, does explain cross-bank differences in net interest margins. We do not interpret these
results as suggesting that bank regulations are unimportant for explaining bank margins. Rather,
we interpret the findings as consistent with a strand of literature that emphasizes that policies and
regulations stem from national institutions.
Four, the evidence on the relationship between concentration and net interest margins is
mixed, which is perhaps unsurprising given the conflicting predictions from theory. When
controlling for bank-specific factors, concentration is positively and significantly linked with
bank net interest margins. This relationship breaks down, however, when controlling for
regulatory restrictions on banks and macroeconomic stability. Given the availability of data on
the macroeconomic environment and regulatory impediments on banks, these results shed
skeptical light on using national bank concentration measures to proxy for the competitive
environment facing the banking industry. Furthermore, even when controlling for regulatory
restrictions and the overall institutional environment, we never find a significant positive link
between concentration and efficiency as predicted by some theories of banking.
28
References
Acemoglu, Daron, Simon Johnson, and James A. Robinson. (2001). “The colonial origins of
comparative development: An empirical investigation.” American Economic Review 91,
1369-1401.
Bank for International Settlements. (2001). “The Banking Industry in the Emerging Market
Economies: Competition, Consolidation, and Systemic Stability.” BIS Papers 4, Basle.
Barth, James, Gerard Caprio, and Ross Levine. (2001a). “Banking Systems Around the Globe:
Do Regulation and Ownership Affect Performance and Stability?” In Financial
Supervision and Regulation: What Works and What Doesn’t, edited by Frederic S.
Mishkin, pp. 31-88. Chicago, IL: Chicago University Press.
Barth, James, Gerard Caprio, and Ross Levine. (2001b). “The Regulation and Supervision of
Banks Around the World: A new Database.” In Integrating Emerging Market Countries
into the Global Financial System, Brookings-Wharton Papers on Financial Services,
edited by Robert E. Litan and R. Herring, pp. 183-241. Washington, DC: Brookings
Institution Press.
Barth, James, Gerard Caprio, and Ross Levine. (2003). “Bank Regulation and Supervision:
What Works Best?" Journal of Financial Intermediation, forthcoming.
Beck, Thorsten, Asli Demirgüç-Kunt, and Ross Levine. (2000). “A New Database on Financial
Development and Structure.” World Bank Economic Review, September, 597-605.
Beck, Thorsten, Asli Demirgüç-Kunt, and Ross Levine. (2002). “Law, Endowments, and
Finance.” Journal of Financial Economics, forthcoming.
Beck, Thorsten, Asli Demirgüç-Kunt, and Ross Levine. (2003a). “Bank Supervision and
Corporate Finance.” University of Minnesota (Carlson School of Management), mimeo.
29

Beck, Thorsten, Asli Demirgüç-Kunt, and Ross Levine. (2003b). “Bank Concentration and
Crises.” University of Minnesota (Carlson School of Management), mimeo.
Beck, Thorsten, Ross Levine, and Norman Loayza. (2000). “Finance and the Sources of the
Growth.” Journal of Financial Economics 58, 261-300.
Becker, Gary. (1983). “A Theory of Competition Among Pressure Groups for Political
Influence.” Quarterly Journal of Economics 98, 371-400.
Berger, Allen N. (1995). “The Profit-Structure Relationship in Banking - Tests of Market Power
and Efficient-Structure Hypothesis." Journal of Money, Credit and Banking 27, 404-431.
Berger, Allen N., Rebecca S. Demsetz, and Philip E. Strahan. (1999). “The Consolidation of the
Financial Services Industry: Causes, Consequences, and Implications for the Future.”
Journal of Banking and Finance 23, 135-194.
Berger, Allen N., Robert DeYoung, Hesna Genay, and Gregory F. Udell. (2000). “Globalization
of Financial Institutions: Evidence from Cross-Border Banking Performance.”
Brookings-Wharton Papers on Financial Services 3, 23-125.
Berger, Allen N., and Timothy H. Hannan. (1989). “The Price-Concentration Relationship in
Banking.” Review of Economics and Statistics 71, 291-299.
Berger, Allen N., and Timothy H. Hannan. (1998). “The Efficiency Cost of Market Power in the
Banking Industry: A Test of the ‘Quiet Life’ and Related Hypotheses.” Review of
Economics and Statistics 80, 454-465.
Berger, Allen N., Gerald A. Hanweck, and David B. Humphrey. (1987). “Competitive Viability
in Banking: Scale, Scope and Product Mix Economies.” Journal of Monetary Economics
20, 501-520.
30
Berger, Allen N., and David B. Humphrey. (1991). “The Dominance of Inefficiencies Over Scale
and Product Mix Economies in Banking.” Journal of Monetary Economics 28, 117-148.
Berger, Allen N., and David B. Humphrey. (1992). “Megamergers in Banking and the Use of
Cost Efficiency as an Antitrust Defense." Antitrust Bulletin 37, 541-600.
Berger, Allen N., Anthony Saunders, Joseph M. Scalise, and Gregory F. Udell. (1998). “The
Effects of Bank Mergers and Acquisitions on Small Business Lending." Journal of
Financial Economics 50, 187-229.
Besanko, David, and Anjan V. Thakor. (1992). “Banking Deregulation: Allocational
Consequences of Relaxing Entry Barriers.” The Journal of Banking and Finance 16,
909-932.
Bianco, Magda, Tullio Jappelli, and Marco Pagano. (2001). “Courts and Banks: Effects of
Judicial Enforcement on Credit Markets.” CSEF Working Paper No. 58, 48 p.
Boot, Arnoud W.A., and Anjan V. Thakor. (1996). “Banking Structure and Financial
Innovation.” In Universal Banking: Financial System Design Reconsidered, edited by
Ingo Walter and A. Saunders, pp. 420-430. Chicago, IL: Irwin Professional Publishing.
Boyd, John H., and Stanley L. Graham. (1991). “Investigating the Banking Consolidation
Trend.” Federal Reserve Bank of Minneapolis Quarterly Review, Spring, 3-15.
Boyd, John H., and Stanley L. Graham. (1998). “Consolidation in US Banking.” In Bank
Mergers and Acquisitions, edited by Yakov Amihud and Geoffrey Miller, pp. 113-135.
Norwell, MA: Kluwer Academic Publishers.
Boyd, John H., Ross Levine, and Bruce D. Smith. (2001). “The Impact of Inflation on Financial
Sector Performance.” Journal of Monetary Economics 47, 221-248.
31

Boyd, John H. and Edward C. Prescott. (1986). "Financial Intermediary-Coalitions." Journal of
Economic Theory 38, 211-32.
Boyd, John H. and David E. Runkle. (1993). “Size and Performance of Banking Firms.” Journal
of Monetary Economics 31, 47-67.
Breusch, Trevor S. and Adrian Rodney Pagan. (1980). “The Lagrange Multiplier Test and Its
Applications to Model Specification in Econometrics.” The Review of Economic Studies
47, 239-253.
Caprio, Gerard, and Daniela Klingebiel. (1999). “Episodes of Systematic and Borderline
Financial Crises.” World Bank, mimeo.
Caprio, Gerard, Luc Laeven, and Ross Levine. (2003). “Governance and Valuation of Banks.”
University of Minnesota, mimeo.
Cetorelli, Nicola, and Michele Gambera. (2001). “Banking Market Structure, Financial
Dependence and Growth: International Evidence from Industry Data.” Journal of Finance
56, 617-648.
Claessens, Stijn, Asli Demirgüç-Kunt, and Harry Huizinga. (2001). “How Does Foreign Entry
Affect Domestic Banking Markets?” Journal of Banking and Finance 25, 891-911.
Claessens, Stijn, and Daniela Klingebiel. (2001). “Competition and Scope of Activities in
Financial Services.” World Bank Research Observer 16, 18-40.
Claessens, Stijn and Luc Laeven. (2004). “What Drives Bank Competition? Some International
Evidence.” World Bank, mimeo.
Clark, Jeffrey A. (1996). “Economic Cost, Scale Efficiency and Competitive Viability in
Banking.” Journal of Money, Credit, and Banking 28, 342-64.
32

Demirgüç-Kunt, Asli, and Vojislav Maksimovic. (1998). “Law, Finance, and Firm Growth.”
Journal of Finance 53, 2107-2137.
Demirgüç-Kunt, Asli, Luc Laeven, and Ross Levine. (2003) “Regulations, Market Structure,
Institutions, and the Cost of Financial Intermediation.” National Bureau of Economic
Research Working Paper.
Demirgüç-Kunt, Asli, and Harry Huizinga. (1999). “Determinants of Commercial Bank Interest
Margins and Profitability: Some International Evidence.” World Bank Economic Review
13, 379-408.
Demsetz, Rebecca S., and Philip E. Strahan. (1997). "Diversification, Size, and Risk at Bank
Holding Companies." Journal of Money, Credit, and Banking 28, 300-13.
Demsetz, Harold. (1973). “Industry Structure, Market Rivalry, and Public Policy,” Journal of
Law and Economics 16, 1-9.
Demsetz, Harold. (1974). “Two Systems of Belief about Monopoly.” In Industrial
Concentration: The New Learning, edited by Harvey J. Goldschmid, Michael H. Mann,
and J. Fred Weston, pp. 93-100. Boston: Little-Brown.
Diamond, Douglas W. (1984). "Financial Intermediation and Delegated Monitoring." Review of
Economic Studies, 51, 393-414.
Easterly, William, and Ross Levine. (2003). “Tropics, Germs, and Crops: How Endowments
Influence Economic Development.” Journal of Monetary Economics, forthcoming.
Engerman, Stanley L., and Kenneth L. Sokoloff. (1997). “Factor Endowments, Institutions, and
Differential Paths of Growth Among New World Economies: A View from Economic
Historians of the United States.” In How Latin America Fell Behind, edited by Stephen
Haber, pp. 260-304. Stanford, CA: Stanford University Press.
33

Ferrier, Gary D., Shawna Grosskopf, Kathy J. Hayes, and Suthathip Yaisawarng. (1993).
“Economies of Diversification in the Banking Industry: A Frontier Approach.” Journal
of Monetary Economics 31, 229-249.
Gande, Amar, Manju Puri, and Anthony Saunders. (1999). “Bank Entry, Competition, and the
Market for Corporate Securities Underwriting.” Journal of Financial Economics 54,
165-195.
Gerschenkron, Alexander. (1965). Economic Backwardness in Historical Perspective. New
York, NY: Praeger.
Gilbert, R. Alton. (1984). “Bank Market Structure and Competition: A Survey.” Journal of
Money, Credit and Banking 16, 617-645.
Goldberg, Lawrence G. and Anoop Rai. (1996). "The Structure-Performance Relationship for
European Banking.” Journal of Banking and Finance 20, 745-771.
Graddy, Duane B. and Reuben Kyle. (1979). “The Simultaneity of Bank Decision-Making,
Market Structure, and Bank Performance.” Journal of Finance 34, 1-18.
Group of Ten. (2001). Report on Consolidation in the Financial Sector. Bank for International
Settlements: Basel, Switzerland.
Haber, Stephen H., Armando Razo, and Noel Maurer. (2003). The Politics of Property Rights:
Political Instability, Credible Commitments, and Economic Growth in Mexico,
Cambridge, UK: Cambridge University Press.
Hannan, Timothy H. and Allen N. Berger. (1991). “The Rigidity of Prices: Evidence from the
Banking Industry.” American Economic Review 81, 938-945.
Hughes, Joseph, William Lang, Loretta Mester, and Choon-Geol Moon. (1999). “The Dollars
and Sense of Bank Consolidation.” Journal of Banking and Finance 23, 291-324.
34
Huybens, Elisabeth, and Bruce D. Smith. (1999). “Inflation, financial markets, and long-run real
activity.” Journal of Monetary Economics 43, 283-315.
International Monetary Fund. (2001). Financial Sector Consolidation in Emerging Markets,
Chapter V. International Capital Market Report.
Jayaratne, Jith, and Philip E. Strahan. (1996). “The Finance-Growth Nexus: Evidence from Bank
Branch Deregulation.” Quarterly Journal of Economics 111, 639-670.
Jayaratne, Jith, and Philip E. Strahan. (1998). “Entry Restrictions, Industry Evolution and
Dynamic Efficiency: Evidence from Commercial Banking." Journal of Law and
Economics 49, 239-274.
Kaufmann, Daniel, Aart Kraay, and Pablo Zoido-Lobatón (1999). “Governance Matters.” Policy
Research Working Paper 2196. World Bank.
Kaufmann, Daniel, Aart Kraay, and Pablo Zoido-Lobatón. (2001). “Governance Matters II:
Updated Indicators for 2000/01.” World Bank, mimeo.
Keeley, Michael C., and Gary C. Zimmerman. (1985). “Competition for Money Market Deposit
Accounts.” Federal Reserve Bank of San Francisco Economic Review 1, 5-27.
Kroszner, Randall S., and PhilipE. Strahan. (1999). “What Drives Deregulation? Economics and
Politics of the Relaxation of Bank Branching Restrictions.” Quarterly Journal of
Economics 114, 1437-67.
Lamoreaux, Naomi R. (1986). “Banks, Kinship, and Economic Development: The New England
Case.” Journal of Economic History 46, 647-667.
La Porta, Rafael, Florencio Lopez-de-Silanes, Andrei Shleifer, and Robert W. Vishny. (1999).
“The Quality of Government.” Journal of Law, Economics, and Organization 15,
222-279.
35

Levine, Ross. (2003). “Deny Foreign Bank Entry: Implications for Bank Interest Margins.” In
Bank Competition, edited by Luis Antonio Ahumada and Rodrigo Fuentes. Santiago,
Chile: Banco Central de Chile, forthcoming.
Lloyd-Williams, D. M., Phil Molyneux, and John Thornton. (1994). “Market Structure and
Performance in Spanish Banking.” Journal of Banking and Finance 18, 433-443.
Macey, Jonathan R. and Geoffrey Miller. (1998). “Bank Mergers and American Bank
Competitiveness.” In Bank Mergers and Acquisitions, edited by Yakov Amihud and
Geoffrey Miller, pp. 175-190. Norwell, MA: Kluwer Academic Publishers.
Mayer, Colin. (1990). “Financial Systems, Corporate Finance and Economic Development.” In
Asymmetric Information, Corporate Finance and Investment, edited by R. Glen Hubbard,
pp. 307-332. Chicago, IL: The University of Chicago Press.
Neumark, David and Steven A. Sharpe. (1992). “Market Structure and the Nature of Price
Rigidity: Evidence from the Market for Consumer Deposits.” Quarterly Journal of
Economics 107, 657-680.
North, Douglass. (1990). Institutions, Institutional Change, and Economic Performance.
Cambridge: Cambridge University Press.
Olson, Mancur. (1993). “Dictatorship, Democracy, and Development.” American Political
Science Review 87, 567-576.
Pagano, Marco. (1993). “Financial Markets and Growth. An Overview.” European Economic
Review 37, 613-622.
Peltzman, Sam. (1976). “Toward a More General Theory of Regulation.” Journal of Law and
Economics 18, 211-240.
36

Peltzman, Sam. (1977). “The Gains and Losses from Industrial Concentration.” Journal of Law
and Economics 20, 229-263.
Peristiani, Stavros. (1997). “Do Mergers Improve X-efficiency and Scale Efficiency of US
Banks? Evidence from the 1980s.” Journal of Money, Credit, and Banking 29, 326-337.
Petersen, Mitchell A., and Raghuram G. Rajan. (1994). "The Benefits of Lending Relationships:
Evidence from Small Business Data." The Journal of Finance 49, 3-37.
Petersen, Mitchell A. and Raghuram G. Rajan. (1995). “The Effect of Credit Market Competition
on Lending Relationships” Quarterly Journal of Economics 110, 407-443.
Pilloff, Steven J. (1996). “Performance Changes and Shareholder Wealth Creation Associated
with Mergers of Publicly Traded Banking Institutions.” Journal of Money, Credit, and
Banking 28, 294-310.
Pilloff, Steven J. and Anthony M. Santomero. (1998). “The Value Effects of Bank Mergers and
Acquistions.” In Bank Mergers and Acquisitions, edited by Yakov Amihud and Goeffrey
Miller, pp. 59-78. Norwell, MA: Kluwer.
Prager, Robin A. and Timothy H. Hannan. (1999). “Do Substantial Horizontal Mergers Generate
Significant Price Effects? Evidence from the Banking Industry.” Journal of Industrial
Economics 46, 433-452.
Radecki, Lawrence J., John Wenninger, and Daniel K. Orlow. (1997). “Industry Structure:
Electronic Delivery’s Potential Effects on Retail Banking.” Journal of Retail Banking
Services 19, 57-63.
Rajan, Raghuram G., and Luigi Zingales. (1998). “Financial Dependence and Growth.”
American Economic Review 88, 559-586.
37
Rajan, Raghuram G., and Luigi Zingales. (2003). Saving Capitalism from the Capitalists. New
York, NY: Random House.
Rhoades, Stephen A. (1993). “The Efficiency Effects of Horizontal Bank Mergers.” Journal of
Banking and Finance 17, 411-422.
Rhoades, Stephen A. (1998). “The Efficiency Effects of Bank Mergers: an Overview of Case
Studies of Nine Mergers.” Journal of Banking and Finance 22, 273-291.
Shaffer, Sherrill. (1993). “A Test of Competition in Canadian Banking.” Journal of Money,
Credit, and Banking 25, 49-61.
Shepherd, William G. (1982). “Economies of Scale and Monopoly Profits.” In Industrial
Organization, Antitrust, and Public Policy, edited by John V. Craven, pp. 165-204,
Boston: Kluwer-Nijhoff Publishing.
Simons, Katerina and Joanna Stavins. (1998). “Has Antitrust Policy in banking Become
Obsolete?” Federal Reserve Bank of Boston New England Economic Review, March,
13-26.
Smirlock, Michael. (1985). “Evidence on the (Non) Relationship between Concentration and
Profitability in Banking.” Journal of Money, Credit, and Banking 17, 69-83.
Stiroh, Kevin, and Philip E. Strahan. (2003). “Competitive Dynamics of Deregulation: Evidence
from U.S. Banking.” Journal of Money, Credit, and Banking, forthcoming.
Vives, Xavier. (2001). “Competition in the Changing World of Banking.” Oxford Review of
Economic Policy 17, 535-545.
World Bank. (2000). Global Economic Prospects and the Developing Countries 2000. The
World Bank.
38

39
Wurgler, Jeffrey. (2000). “Financial Markets and the Allocation of Capital.” Journal of Financial
Economics 58, 187-214.

40
Table 1. Summary statistics and correlation matrix for entire sample by variable
Panel A Summary statistics
Variable Observations Mean Std. Dev. Minimum Maximum Net interest margin 1,430 3.61 2.03 0.72 12.60Bank concentration 1,430 0.45 0.21 0.20 1.00Bank concentration (Top-5) 1,430 0.57 0.22 0.27 1.00Bank concentration (All) 1,430 0.41 0.20 0.18 0.97Bank concentration (Deposits) 1,330 0.46 0.24 0.12 1.00Bank size 1,430 7.04 2.02 1.74 13.49Liquidity 1,375 21.90 16.42 0.23 82.19Bank equity 1,429 9.18 6.97 -0.77 78.76Fee income 1,426 0.90 1.52 -6.39 13.80Overhead 1,430 3.02 1.65 0.64 10.18Market share 1,430 0.04 0.09 0.00 0.98Bank risk 1,430 0.64 1.12 0.00 11.52GDP per capita 1,430 22.50 14.25 0.15 47.99Value traded 1,409 0.35 0.35 0.00 1.47Inflation 1,402 4.37 9.05 0.41 238.51GDP growth 1,430 3.02 1.59 -3.12 15.67KKZ Institution index 1,430 0.93 0.62 -1.18 1.72Economic freedom 1,428 3.65 0.54 1.83 4.54Property rights 1,428 4.38 0.81 1.00 5.00Fraction entry denied 1,273 0.09 0.18 0.00 1.00Activity restrictions 1,430 2.25 0.73 1.00 3.50Reserve requirements 1,419 0.60 0.49 0.00 1.00Banking freedom 1,428 3.66 0.73 1.00 5.00Foreign ownership 1,093 0.13 0.20 0.00 0.99State ownership 1,258 0.16 0.22 0.00 0.80
Notes: All country-level variables are averages for the period 1995-99, except Bank concentration (Deposits) for which we use data for the year 1999. All bank-specific variables are year 1995 data, except net interest margins, overhead ratios and bank risk for which we use averages for the period 1995-99.

41
Panel B Correlation matrix
Net interest
margin Bank
concentration Bank size Liquidity Bank equity Fee income GDP per
capita Value traded Inflation GDP growthNet interest margin 1.000Bank concentration **0.083 1.000Bank size **-0.379 **-0.226 1.000Liquidity **-0.053 **0.143 **-0.175 1.000Bank equity **0.247 **0.186 **-0.454 **0.083 1.000Fee income 0.012 **0.155 **-0.109 **0.153 **0.186 1.000GDP per capita **-0.452 **-0.234 **0.270 **-0.210 **-0.162 -0.021 1.000Value traded **-0.207 **-0.139 **0.146 **-0.191 **0.057 0.008 **0.418 1.000Inflation **0.382 **0.180 **-0.202 **0.164 **0.112 **0.107 **-0.444 **-0.309 1.000GDP growth **0.163 **-0.069 -0.050 **0.067 0.020 **-0.114 **-0.456 -0.012 0.046 1.000KKZ Institution index **-0.426 **-0.104 **0.220 **-0.232 **-0.082 **0.006 **0.804 **0.533 **-0.485 **-0.232Economic freedom **-0.339 **-0.267 **0.301 **-0.327 **-0.118 **-0.077 **0.775 **0.636 **-0.463 **-0.307Property rights **-0.376 **-0.237 **0.355 **-0.260 **-0.159 **-0.089 **0.754 **0.547 **-0.435 **-0.224Fraction entry denied **0.210 **0.189 **-0.144 **0.161 0.040 0.009 **-0.617 **-0.348 **0.309 **0.218Entry fit test **0.131 **0.341 **-0.116 0.045 **0.100 0.023 **-0.129 **0.170 **0.104 **0.109Activity restrictions **0.274 **-0.316 **0.146 **-0.181 **-0.090 **-0.212 **-0.183 -0.006 **0.160 **0.259Reserve requirements -0.035 0.042 -0.020 **0.141 **-0.052 0.022 **-0.173 **-0.401 **0.068 -0.038Banking freedom **-0.167 **0.154 -0.028 **-0.067 0.036 **0.079 **0.386 **0.445 **-0.232 **-0.233Foreign ownership 0.046 **0.235 **-0.137* **0.137 0.008 0.011 **-0.109 **-0.296 **0.066 **0.240State ownership 0.009 **0.070 **-0.143* **0.254 0.054 **0.070 **-0.395 **-0.213 **0.299 **0.237

Notes: All country-level variables are averages for the period 1995-99, except Bank concentration (Deposits) for which we use data for the year 1999. All bank-specific variables are year 1995 data, except net interest margins, overhead ratios and bank risk for which we use averages for the period 1995-99. ** indicates significance at a 5% level.
KKZ Institution
index Economic freedom
Property rights
Fraction entry denied
Activity restrictions
Reserve requirements
Banking freedom
Foreign ownership
State ownership
KKZ Institution index 1.000 Economic freedom **0.803 1.000 Property rights **0.825 **0.904 1.000Fraction entry denied **-0.629 **-0.630 **-0.560 1.000 Activity restrictions **-0.380 **-0.066 **-0.071 **0.194 1.000 Reserve requirements **-0.338 **-0.332 **-0.249 **0.154 **-0.205 1.000 Banking freedom **0.589 **0.629 **0.500 **-0.377 **-0.305 **-0.329 1.000 Foreign ownership -0.044 -0.043 **-0.069 -0.024 **-0.149 **0.198 **0.174 1.000 State ownership **-0.409 **-0.613 **-0.454 **0.538 **-0.122 **0.322 **-0.556 **-0.215 1.000
42
Panel B Correlation matrix (cont.)

Table 2. Regression results controlling for bank regulatory environment
(1) (2) (3) (4) Bank concentration **2.782 **2.326 **2.584 **2.206 (1.313) (1.055) (1.141) (1.108) Bank size ***-0.179 ***-0.182 ***-0.185 ***-0.180 (0.024) (0.024) (0.023) (0.024) Liquidity ***-0.015 ***-0.018 ***-0.017 ***-0.019 (0.003) (0.003) (0.003) (0.003) Bank equity **0.015 ***0.024 ***0.019 ***0.024 (0.006) (0.006) (0.006) (0.006) Fee income **-0.065 -0.024 -0.034 -0.029 (0.026) (0.026) (0.026) (0.026) Fraction of entry denied **2.760 — — — (1.155) Activity restrictions — ***1.366 — — (0.378) Reserve requirements — — *1.036 — (0.577) Banking freedom — — — ***-0.963 (0.294) R2-within 0.096 0.107 0.101 0.107 R2-between 0.209 0.232 0.165 0.221 No. observations 1217 1372 1362 1371 No. countries 55 71 69 70
Notes: Dependent variable is net interest margin. All country-level variables are averages for the period 1995-99. All bank-specific variables are year 1995 data, except net interest margins for which we use averages for the period 1995-99. We use GLS with random country effects. A constant term was included, but is not reported. *, **, *** indicate significance levels of 10, 5, and 1 percent respectively.
43

Table 3. Regression results controlling for macro environment
(1) (2) (3) (4) (5) Bank concentration **2.314 ***2.889 1.834 **2.727 *2.066 (1.080) (1.122) (1.164) (1.150) (1.140) Bank size ***-0.179 ***-0.181 ***-0.177 ***-0.162 ***-0.155 (0.024) (0.024) (0.023) (0.024) (0.024) Liquidity ***-0.019 ***-0.018 ***-0.020 ***-0.020 ***-0.021 (0.003) (0.003) (0.003) (0.003) (0.003) Bank equity ***0.022 ***0.024 ***0.024 ***0.025 ***0.024 (0.006) (0.006) (0.006) (0.006) (0.006) Fee income -0.024 -0.031 0.001 0.006 0.010 (0.026) (0.026) (0.027) (0.027) (0.027) Inflation ***0.041 — — — ***0.090 (0.009) (0.023) GDP growth — *-0.202 — — -0.024 (0.104) (0.108) Total value traded — — ***-2.847 — *-1.640 (0.906) (0.889) State ownership — — — **2.559 -0.432 (1.108) (1.219) R2-within 0.106 0.107 0.110 0.113 0.114 R2-between 0.293 0.165 0.237 0.196 0.461 No. observations 1344 1372 1352 1206 1168 No. countries 70 71 66 63 58
Notes: Dependent variable is net interest margin. All country-level variables are averages for the period 1995-99, except total value traded for which we use 1995 data. All bank-specific variables are year 1995 data, except net interest margins for which we use averages for the period 1995-99. Results estimated using GLS with random country effects. A constant term was included, but is not reported. *, **, *** indicate significance levels of 10, 5, and 1 percent respectively.
44
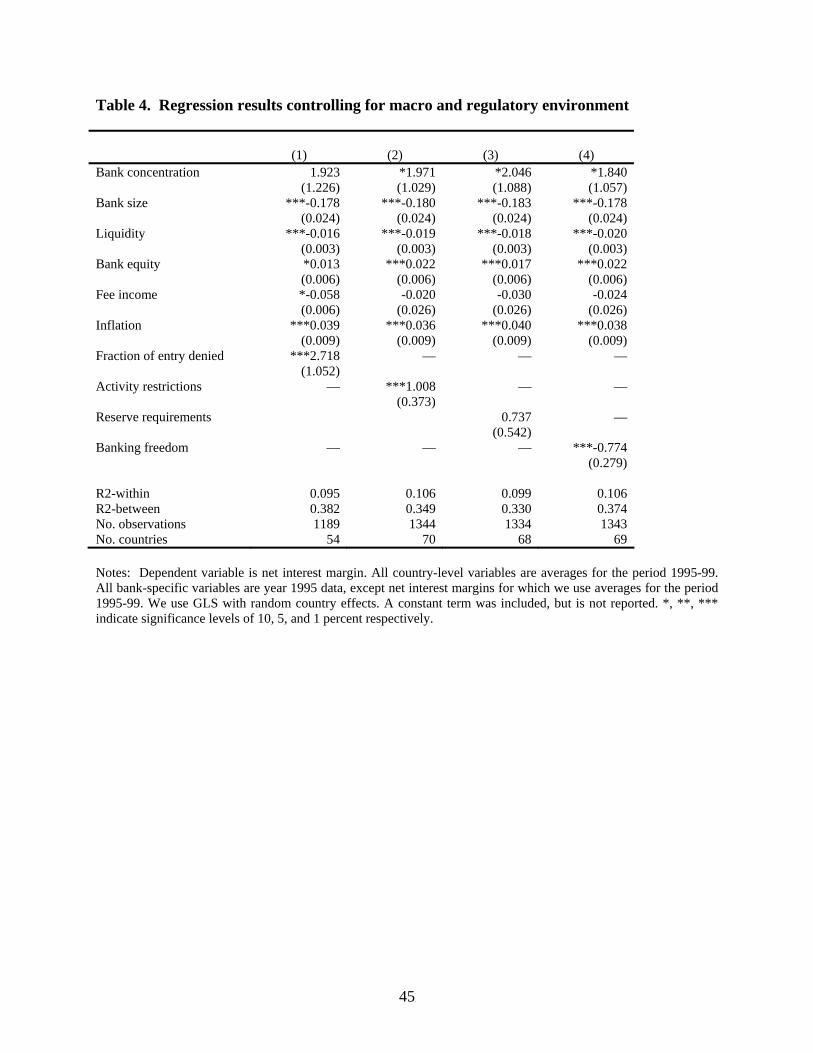
Table 4. Regression results controlling for macro and regulatory environment
(1) (2) (3) (4) Bank concentration 1.923 *1.971 *2.046 *1.840 (1.226) (1.029) (1.088) (1.057) Bank size ***-0.178 ***-0.180 ***-0.183 ***-0.178 (0.024) (0.024) (0.024) (0.024) Liquidity ***-0.016 ***-0.019 ***-0.018 ***-0.020 (0.003) (0.003) (0.003) (0.003) Bank equity *0.013 ***0.022 ***0.017 ***0.022 (0.006) (0.006) (0.006) (0.006) Fee income *-0.058 -0.020 -0.030 -0.024 (0.006) (0.026) (0.026) (0.026) Inflation ***0.039 ***0.036 ***0.040 ***0.038 (0.009) (0.009) (0.009) (0.009) Fraction of entry denied ***2.718 — — — (1.052) Activity restrictions — ***1.008 — — (0.373) Reserve requirements 0.737 — (0.542) Banking freedom — — — ***-0.774 (0.279) R2-within 0.095 0.106 0.099 0.106 R2-between 0.382 0.349 0.330 0.374 No. observations 1189 1344 1334 1343 No. countries 54 70 68 69
Notes: Dependent variable is net interest margin. All country-level variables are averages for the period 1995-99. All bank-specific variables are year 1995 data, except net interest margins for which we use averages for the period 1995-99. We use GLS with random country effects. A constant term was included, but is not reported. *, **, *** indicate significance levels of 10, 5, and 1 percent respectively.
45

Table 5. Regression results controlling for institutional environment
(1) (2) (3) (4) Bank concentration 0.939 1.571 0.929 1.214 (1.027) (0.970) (1.045) (1.057) Bank size ***-0.174 ***-0.172 ***-0.170 ***-0.170 (0.024) (0.024) (0.024) (0.024) Liquidity ***-0.019 ***-0.020 ***-0.020 ***-0.020 (0.003) (0.003) (0.003) (0.003) Bank equity ***0.022 ***0.022 ***0.023 ***0.022 (0.006) (0.006) (0.006) (0.006) Fee income -0.023 -0.024 -0.027 -0.027 (0.026) (0.026) (0.026) (0.026) Inflation ***0.031 ***0.023 ***0.025 ***0.028 (0.008) (0.009) (0.009) (0.009) GDP per capita ***-0.088 — — — (0.018) KKZ Institution index — ***-1.797 — — (0.301) Economic freedom — — ***-2.046 — (0.415) Property rights — — — ***-1.132 (0.249) R2-within 0.106 0.106 0.107 0.107 R2-between 0.475 0.540 0.503 0.475 No. observations 1344 1344 1343 1343 No. countries 70 70 69 69
Notes: Dependent variable is net interest margin. All country-level variables are averages for the period 1995-99. All bank-specific variables are year 1995 data, except net interest margins for which we use averages for the period 1995-99. We use GLS with random country effects. A constant term was included, but is not reported. *, **, *** indicate significance levels of 10, 5, and 1 percent respectively.
46

Table 6. Regression results controlling for macro, regulatory, and institutional environment
(1) (2) (3) Bank concentration 1.159 1.152 1.228 (1.206) (1.031) (1.058) Bank size ***-0.171 ***-0.171 ***-0.170 (0.024) (0.024) (0.024) Liquidity ***-0.017 ***-0.020 ***-0.020 (0.003) (0.003) (0.003) Bank equity ***0.013 ***0.022 ***0.022 (0.006) (0.006) (0.006) Fee income **-0.058 -0.025 -0.027 (0.026) (0.026) (0.026) Inflation ***0.028 ***0.027 ***0.028 (0.009) (0.009) (0.009) Property rights ***-1.114 ***-1.048 ***-1.037 (0.296) (0.253) (0.286) Fraction of entry denied 1.503 — — (1.069) Activity restrictions — 0.449 — (0.389) Banking freedom — — -0.213 (0.316) R2-within 0.095 0.107 0.107 R2-between 0.504 0.483 0.478 No. observations 1189 1343 1343 No. countries 54 69 69
Notes: Dependent variable is net interest margin. All country-level variables are averages for the period 1995-99. All bank-specific variables are year 1995 data, except net interest margins for which we use averages for the period 1995-99. We use GLS with random country effects. A constant term was included, but is not reported. *, **, *** indicate significance levels of 10, 5, and 1 percent respectively.
47

48
Table 7. Regression results using an alternative efficiency measure and controlling for institutions and regulatory restrictions
Overhead costs (1) (2) (3) Bank concentration 0.056 -0.081 -0.057 (0.820) (0.735) (0.737) Bank size ***-0.133 ***-0.132 ***-0.132 (0.021) (0.021) (0.021) Liquidity 0.002 -0.000 -0.000 (0.003) (0.002) (0.002) Bank equity -0.002 0.006 0.006 (0.006) (0.005) (0.005) Fee income ***0.362 ***0.373 ***0.372 (0.023) (0.022) (0.022) Inflation *0.012 *0.012 *0.013 (0.007) (0.007) (0.007) Property rights ***-0.564 ***-0.587 ***-0.584 (0.205) (0.182) (0.200) Fraction of entry denied 0.008 — — (0.739) Activity restrictions — 0.142 — (0.276) Banking freedom — — -0.065 (0.220) R2-within 0.210 0.212 0.212 R2-between 0.525 0.517 0.515 No. observations 1189 1343 1343 No. countries 54 69 69
Notes: Dependent variable is overhead costs over total average assets, average for the period 1995-99. All country-level variables are averages for the period 1995-99. All bank-specific independent variables are year 1995 data. We use GLS with random country effects. A constant term was included, but is not reported. *, **, *** indicate significance levels of 10, 5, and 1 percent respectively.

Table 8. Regression results using country-level averages and controlling for institutions and regulatory restrictions
(1) (2) (3) (4) (5) (6) (7) (8) Bank concentration *2.417 **2.474 *2.192 1.318 1.538 1.442 1.499 1.536 (1.340) (1.161) (1.164) (1.081) (1.065) (1.221) (1.044) (1.068) Inflation ***0.038 ***0.033 ***0.036 ***0.024 ***0.027 ***0.027 ***0.026 ***0.027 (0.012) (0.012) (0.011) (0.008) (0.008) (0.009) (0.008) (0.008) Fraction of entry denied 1.805 — — — — 0.523 — — (1.466) (1.444) Activity restrictions — **0.989 — — — — 0.315 — (0.410) (0.364) Banking freedom — — ***-0.810 — — — — -0.189 (0.267) (0.281) Economic freedom — — — ***-2.028 — — — — (0.467) Property rights — — — — ***-1.164 ***-1.181 ***-1.102 ***-1.080 (0.285) (0.337) (0.288) (0.298) R2 0.320 0.321 0.346 0.468 0.457 0.469 0.462 0.460 No. observations (countries) 55 71 70 70 70 55 70 70
Notes: Dependent variable is net interest margin averaged across banks in each country. All country variables are averages for the period 1995-99. Net interest margins are country-averages for the period 1995-99. We report OLS estimates with heteroskedasticity-consistent standard errors. A constant term was included, but is not reported. *, **, *** indicate significance levels of 10, 5, and 1 percent respectively.
49

Table 9. Regression results controlling for bank market share, institutions and regulatory restrictions
(1) (2) (3) (4) (5) (6) (7) (8) (9) Bank concentration *2.004 1.085 1.172 1.225 0.441 0.716 0.576 0.643 0.740 (1.057) (1.069) (0.944) (0.989) (0.979) (0.988) (1.077) (0.959) (0.996) Market share ***1.583 ***1.677 ***1.621 **1.336 **1.171 **1.164 **1.347 **1.195 **1.142 (0.577) (0.644) (0.570) (0.576) (0.573) (0.575) (0.645) (0.574) (0.575) Bank size ***-0.220 ***-0.214 ***-0.219 ***-0.210 ***-0.198 ***-0.197 ***-0.199 ***-0.199 ***-0.197 (0.027) (0.027) (0.027) (0.027) (0.027) (0.027) (0.027) (0.027) (0.027) Liquidity ***-0.018 ***-0.015 ***-0.019 ***-0.019 ***-0.020 ***-0.020 ***-0.016 ***-0.019 ***-0.020 (0.003) (0.003) (0.003) (0.003) (0.003) (0.003) (0.003) (0.003) (0.003) Bank equity ***0.023 *0.012 ***0.021 ***0.022 ***0.023 ***0.022 ***0.013 ***0.022 ***0.022 (0.006) (0.007) (0.006) (0.006) (0.006) (0.006) (0.006) (0.006) (0.006) Fee income -0.026 **-0.054 -0.017 -0.022 -0.026 -0.025 **-0.055 -0.023 -0.025 (0.026) (0.026) (0.026) (0.026) (0.026) (0.026) (0.026) (0.026) (0.026) Inflation — ***0.040 ***0.036 ***0.038 ***0.025 ***0.029 ***0.029 ***0.028 ***0.029 (0.008) (0.008) (0.008) (0.008) (0.008) (0.008) (0.008) (0.008) Fraction of entry denied — ***2.380 — — — — 1.288 — — (0.891) (0.932) Activity restrictions — — ***0.948 — — — — 0.458 — (0.329) (0.349) Banking freedom — — — ***-0.712 — — — — -0.195 (0.254) (0.263) Economic freedom — — — — ***-1.931 — — — — (0.382) Property rights — — — — — ***-1.065 ***-1.046 ***-0.978 ***-0.981 (0.229) (0.260) (0.231) (0.263) R2-within 0.106 0.095 0.105 0.106 0.107 0.107 0.096 0.107 0.107 R2-between 0.220 0.430 0.414 0.415 0.528 0.501 0.527 0.510 0.503 No. observations 1372 1189 1344 1343 1343 1343 1189 1343 1343 No. countries 71 54 70 69 69 69 54 69 69
Notes: Dependent variable is net interest margin. All country-level variables are averages for the period 1995-99. All bank-specific variables are year 1995 data, except net interest margin for which we use averages for the period 1995-99. We use GLS with random country effects. A constant term was included, but is not reported. *, **, *** indicate significance levels of 10, 5, and 1 percent respectively.
50