Embed Size (px)
Citation preview
Regulation XIII –New Source Review
January 14, 2020South Coast AQMDCall-in #1-866-705-2554Passcode:5691551
Agenda
Previous Working Group Summary
Offsetting
Open Market
Internal Bank2
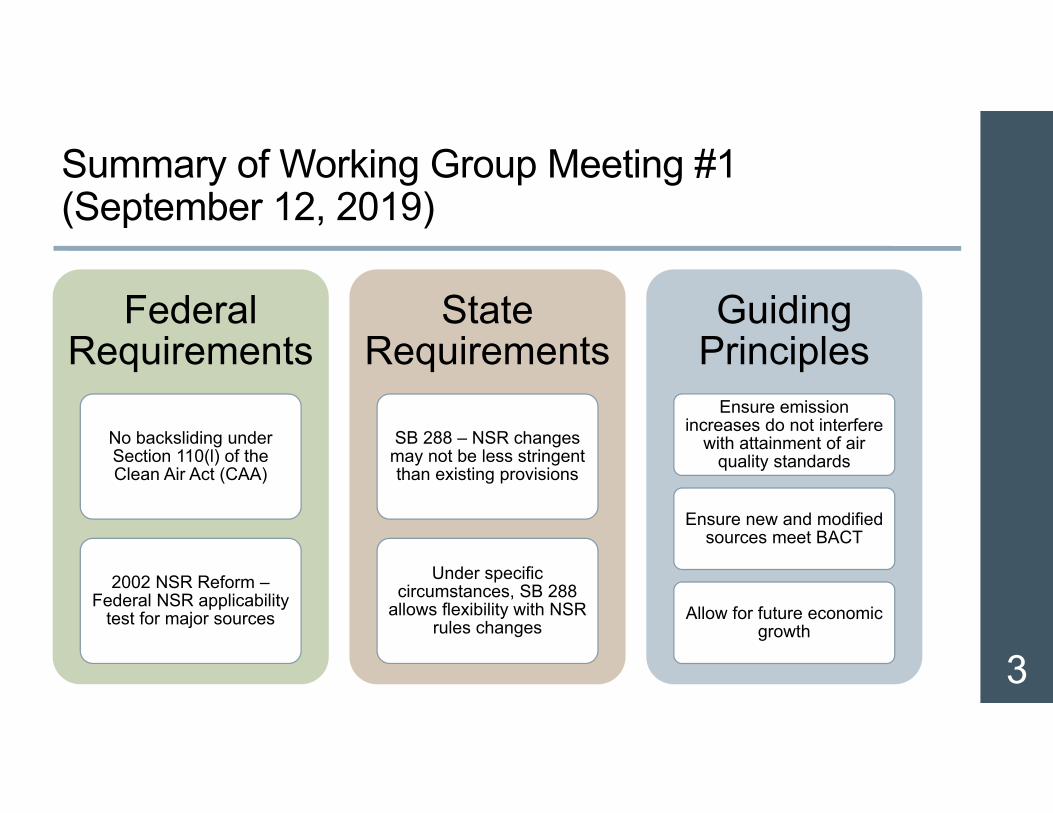
Summary of Working Group Meeting #1(September 12, 2019)
Federal Requirements
No backsliding under Section 110(l) of the Clean Air Act (CAA)
2002 NSR Reform –Federal NSR applicability
test for major sources
State Requirements
SB 288 – NSR changes may not be less stringent than existing provisions
Under specific circumstances, SB 288
allows flexibility with NSR rules changes
Guiding Principles
Ensure emission increases do not interfere
with attainment of air quality standards
Ensure new and modified sources meet BACT
Allow for future economic growth
3
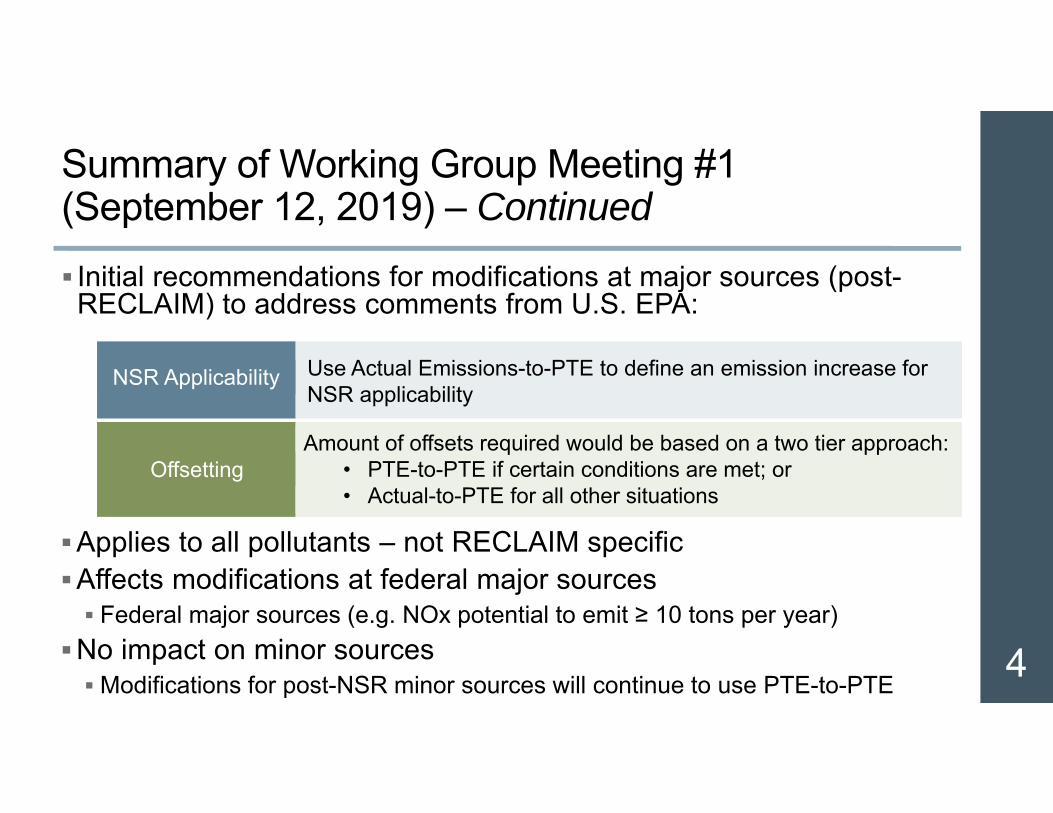
Summary of Working Group Meeting #1(September 12, 2019) – Continued
Initial recommendations for modifications at major sources (post-RECLAIM) to address comments from U.S. EPA:
4
NSR Applicability Use Actual Emissions-to-PTE to define an emission increase for NSR applicability
OffsettingAmount of offsets required would be based on a two tier approach:
• PTE-to-PTE if certain conditions are met; or • Actual-to-PTE for all other situations
Applies to all pollutants – not RECLAIM specificAffects modifications at federal major sources Federal major sources (e.g. NOx potential to emit ≥ 10 tons per year)
No impact on minor sourcesModifications for post-NSR minor sources will continue to use PTE-to-PTE
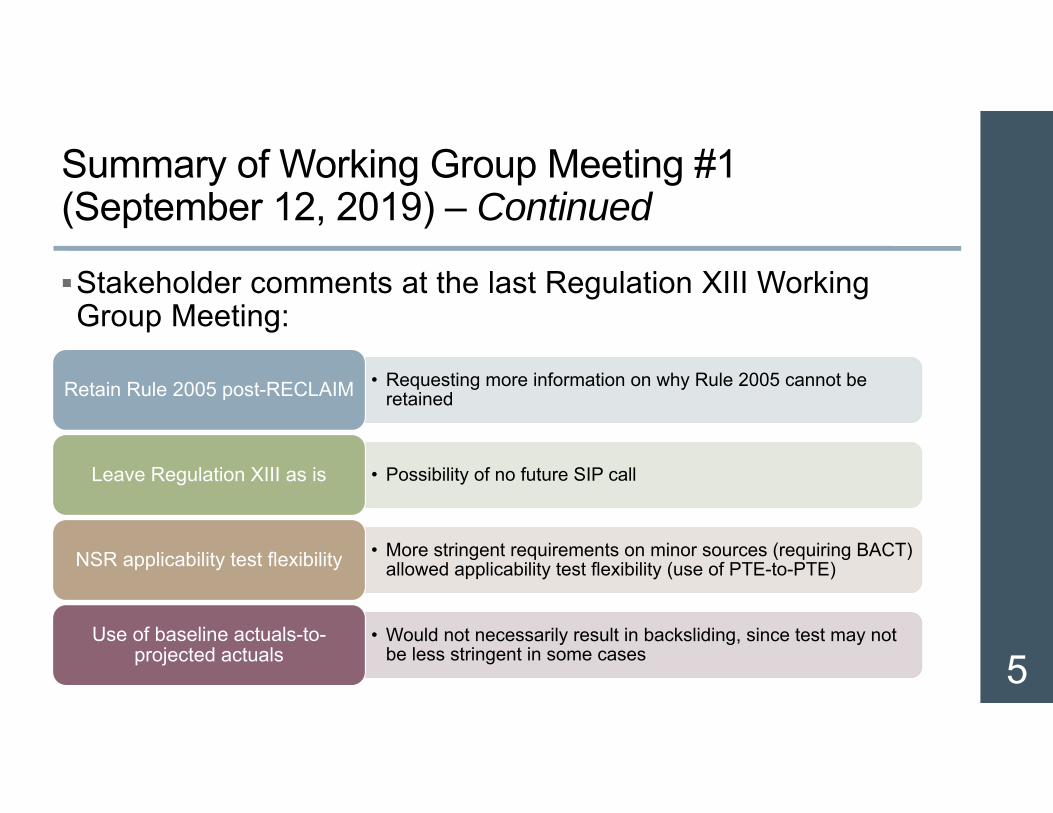
Summary of Working Group Meeting #1 (September 12, 2019) – Continued
Stakeholder comments at the last Regulation XIII Working Group Meeting:
5
• Requesting more information on why Rule 2005 cannot be retainedRetain Rule 2005 post-RECLAIM
• Possibility of no future SIP callLeave Regulation XIII as is
• More stringent requirements on minor sources (requiring BACT) allowed applicability test flexibility (use of PTE-to-PTE)NSR applicability test flexibility
• Would not necessarily result in backsliding, since test may not be less stringent in some cases
Use of baseline actuals-to-projected actuals
Offsetting
Offsets
Two sources of offsets under Regulation XIII: Open market Internal Bank
Recent comments by U.S. EPA regarding applicability and calculation of offsets for major source modifications will increase the demand for offsetsPrevious RECLAIM WGM discussions focused on NOx offsets in the open market and internal bank Analysis found possible shortage in future years and limited availability of NOx
ERCs in the open market based on historical demand from RECLAIM facilities Presentation today will focus on NOx, SOx, VOC, and PM10 current and projected offset availability in the open market and internal bank
7

Open Market
Open Market ERCs
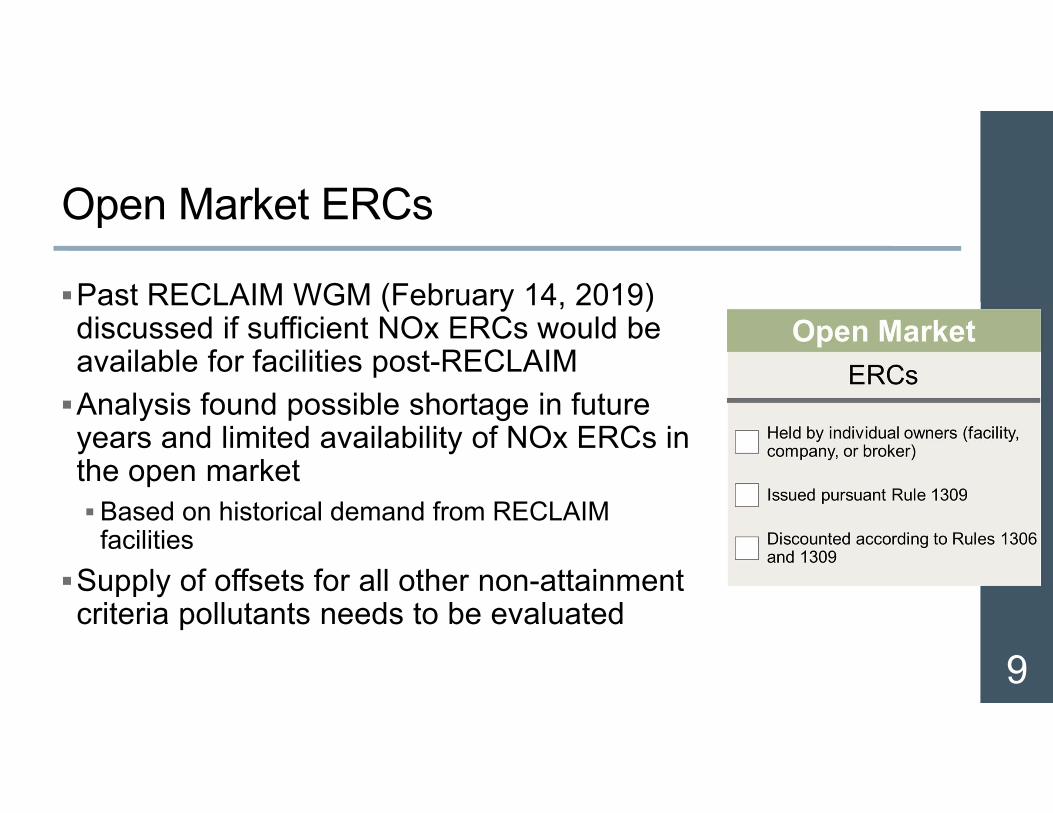
Past RECLAIM WGM (February 14, 2019) discussed if sufficient NOx ERCs would be available for facilities post-RECLAIMAnalysis found possible shortage in future years and limited availability of NOx ERCs in the open marketBased on historical demand from RECLAIM
facilitiesSupply of offsets for all other non-attainment criteria pollutants needs to be evaluated
9
Open Market – ERC Generation
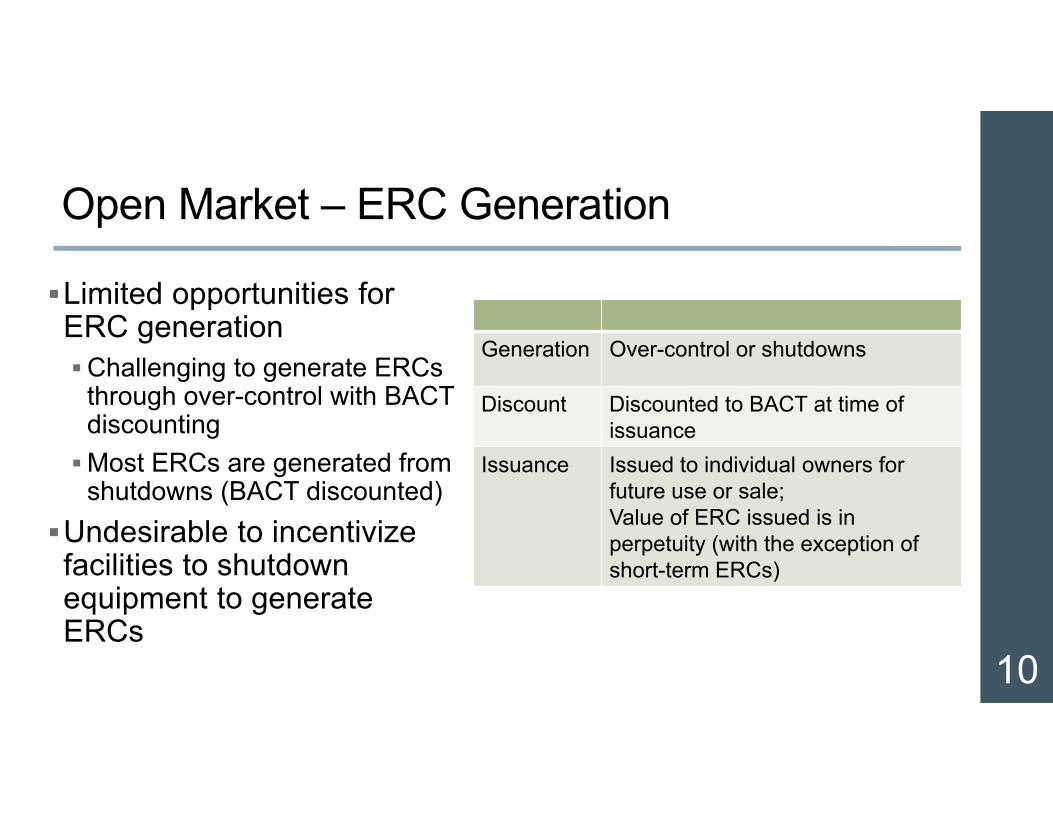
Limited opportunities for ERC generationChallenging to generate ERCs
through over-control with BACT discountingMost ERCs are generated from
shutdowns (BACT discounted)Undesirable to incentivize facilities to shutdown equipment to generate ERCs
10
Generation Over-control or shutdowns
Discount Discounted to BACT at time of issuance
Issuance Issued to individual owners for future use or sale;Value of ERC issued is in perpetuity (with the exception of short-term ERCs)
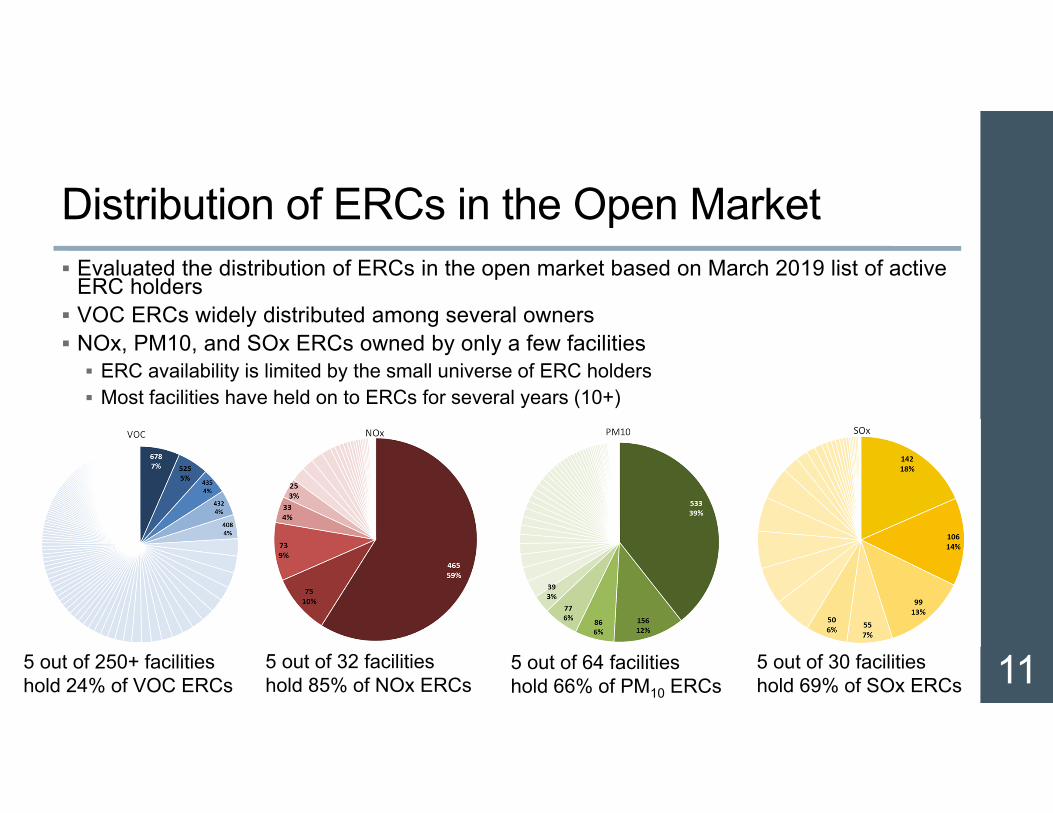
Distribution of ERCs in the Open Market Evaluated the distribution of ERCs in the open market based on March 2019 list of active
ERC holders VOC ERCs widely distributed among several owners NOx, PM10, and SOx ERCs owned by only a few facilities ERC availability is limited by the small universe of ERC holders Most facilities have held on to ERCs for several years (10+)
115 out of 32 facilitieshold 85% of NOx ERCs
5 out of 64 facilities hold 66% of PM10 ERCs
5 out of 30 facilities hold 69% of SOx ERCs
5 out of 250+ facilities hold 24% of VOC ERCs
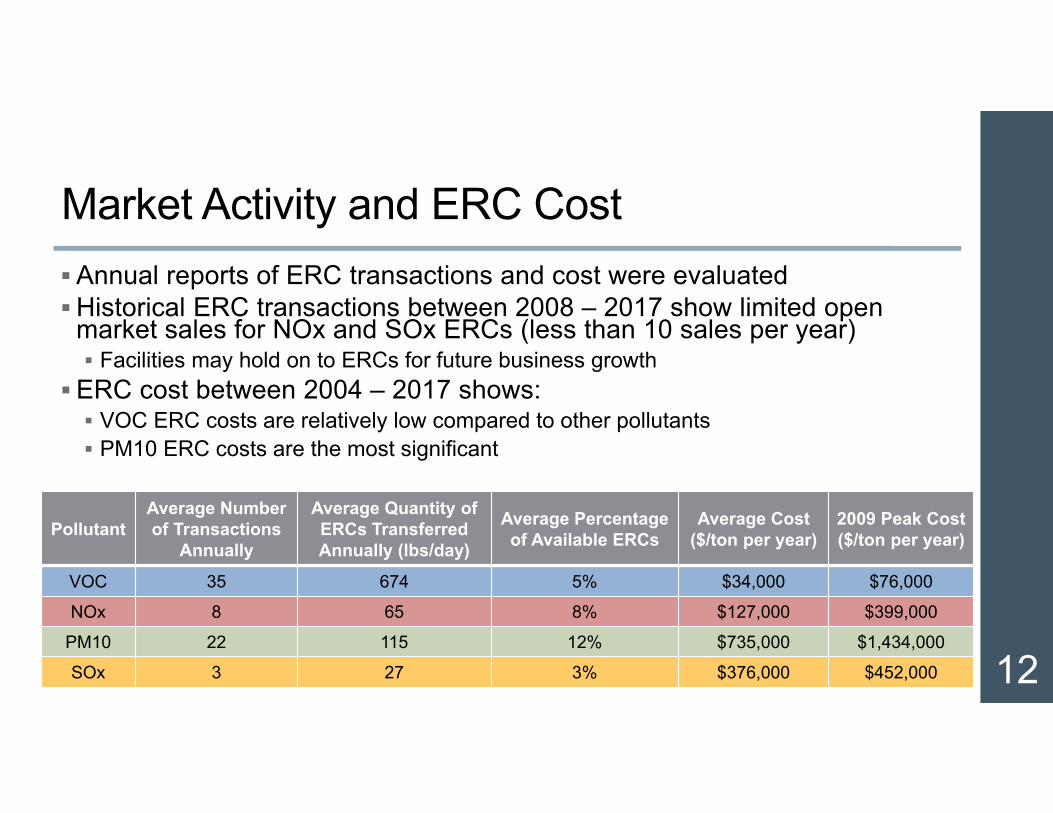
Market Activity and ERC CostAnnual reports of ERC transactions and cost were evaluatedHistorical ERC transactions between 2008 – 2017 show limited open
market sales for NOx and SOx ERCs (less than 10 sales per year) Facilities may hold on to ERCs for future business growth
ERC cost between 2004 – 2017 shows: VOC ERC costs are relatively low compared to other pollutants PM10 ERC costs are the most significant
12
PollutantAverage Number of Transactions
Annually
Average Quantity of ERCs Transferred Annually (lbs/day)
Average Percentage of Available ERCs
Average Cost($/ton per year)
2009 Peak Cost ($/ton per year)
VOC 35 674 5% $34,000 $76,000
NOx 8 65 8% $127,000 $399,000
PM10 22 115 12% $735,000 $1,434,000
SOx 3 27 3% $376,000 $452,000
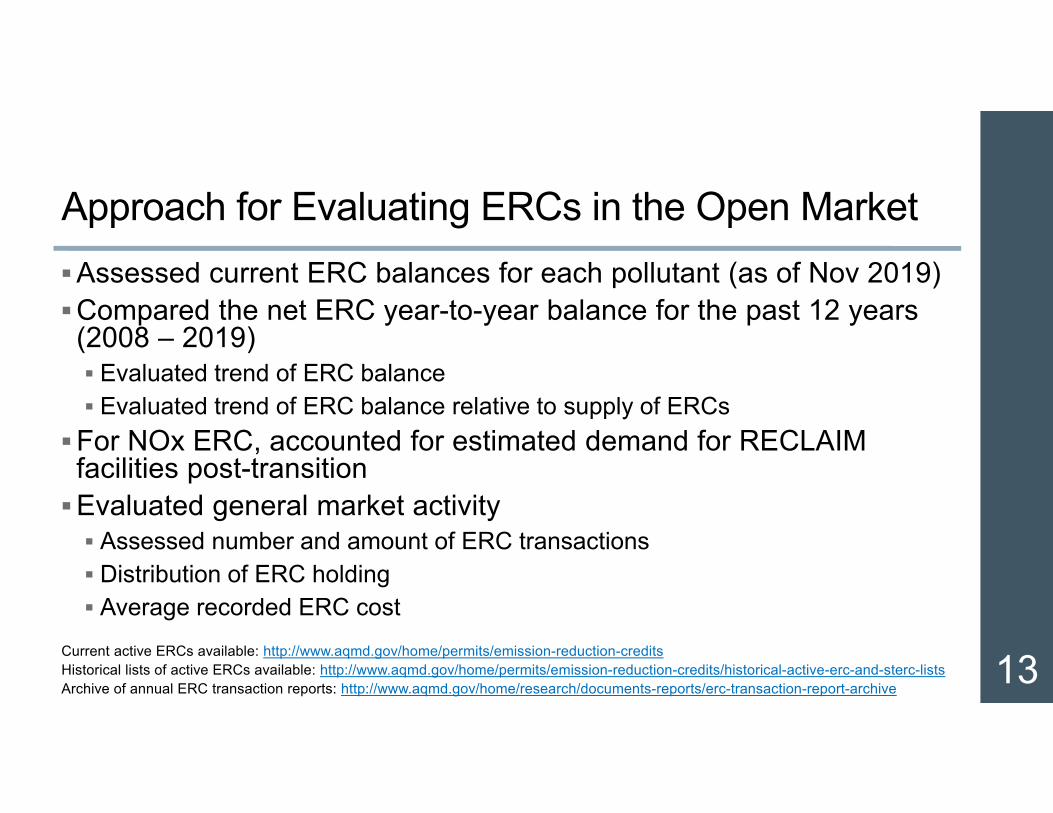
Approach for Evaluating ERCs in the Open MarketAssessed current ERC balances for each pollutant (as of Nov 2019)Compared the net ERC year-to-year balance for the past 12 years (2008 – 2019) Evaluated trend of ERC balance Evaluated trend of ERC balance relative to supply of ERCs
For NOx ERC, accounted for estimated demand for RECLAIM facilities post-transitionEvaluated general market activity Assessed number and amount of ERC transactions Distribution of ERC holding Average recorded ERC cost
13Current active ERCs available: http://www.aqmd.gov/home/permits/emission-reduction-creditsHistorical lists of active ERCs available: http://www.aqmd.gov/home/permits/emission-reduction-credits/historical-active-erc-and-sterc-listsArchive of annual ERC transaction reports: http://www.aqmd.gov/home/research/documents-reports/erc-transaction-report-archive
0
2,000
4,000
6,000
8,000
10,000
12,000
14,000
16,000
2008 2009 2010 2011 2012 2013 2014 2015 2016 2017 2018 2019
Ope
n Market E
RCs (lbs/da
y)
VOC
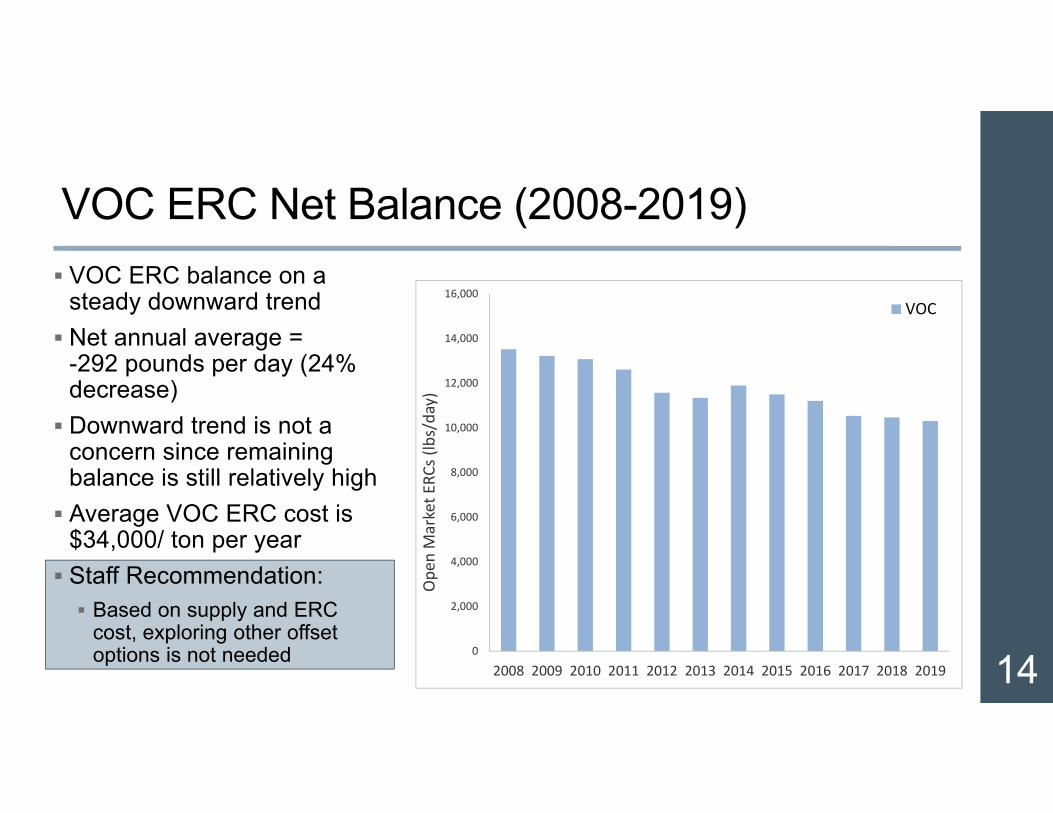
VOC ERC Net Balance (2008-2019) VOC ERC balance on a
steady downward trend Net annual average =
-292 pounds per day (24% decrease) Downward trend is not a
concern since remaining balance is still relatively high Average VOC ERC cost is
$34,000/ ton per year Staff Recommendation: Based on supply and ERC
cost, exploring other offset options is not needed 14
0
200
400
600
800
1,000
1,200
1,400
2008 2009 2010 2011 2012 2013 2014 2015 2016 2017 2018 2019
Ope
n Market E
RCs (lbs/da
y)
NOx
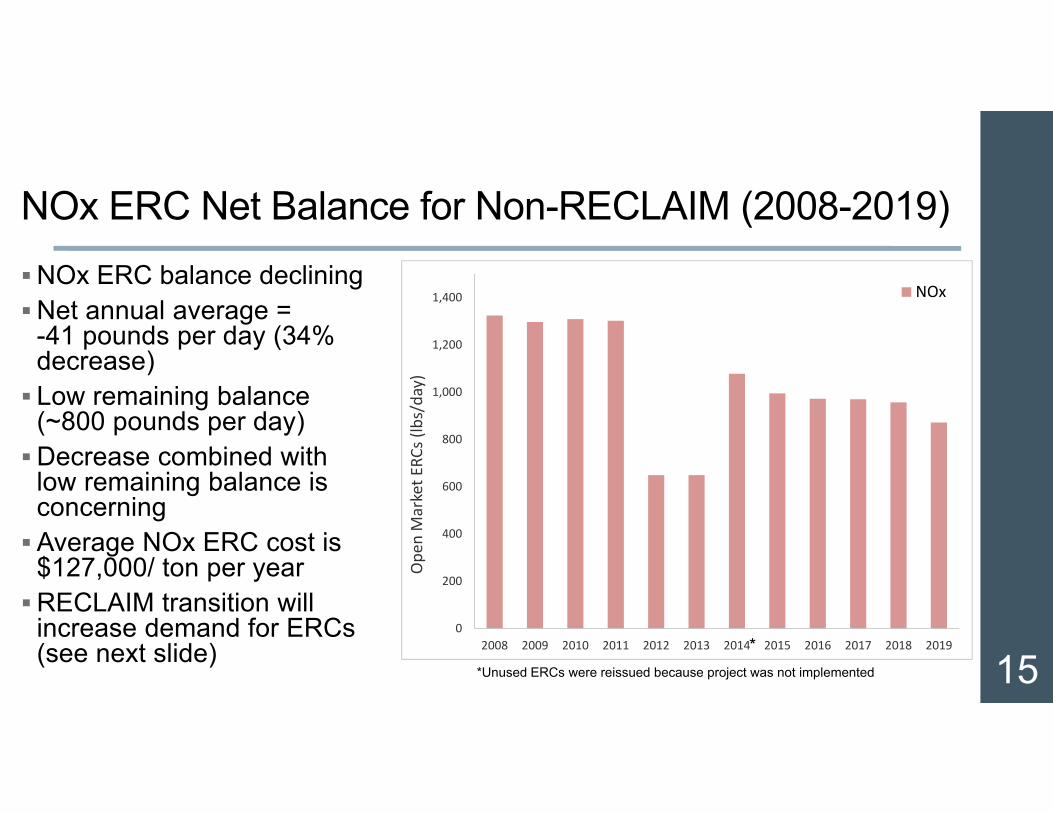
NOx ERC Net Balance for Non-RECLAIM (2008-2019)NOx ERC balance decliningNet annual average =
-41 pounds per day (34% decrease) Low remaining balance
(~800 pounds per day)Decrease combined with
low remaining balance is concerningAverage NOx ERC cost is
$127,000/ ton per yearRECLAIM transition will
increase demand for ERCs (see next slide) 15
**Unused ERCs were reissued because project was not implemented
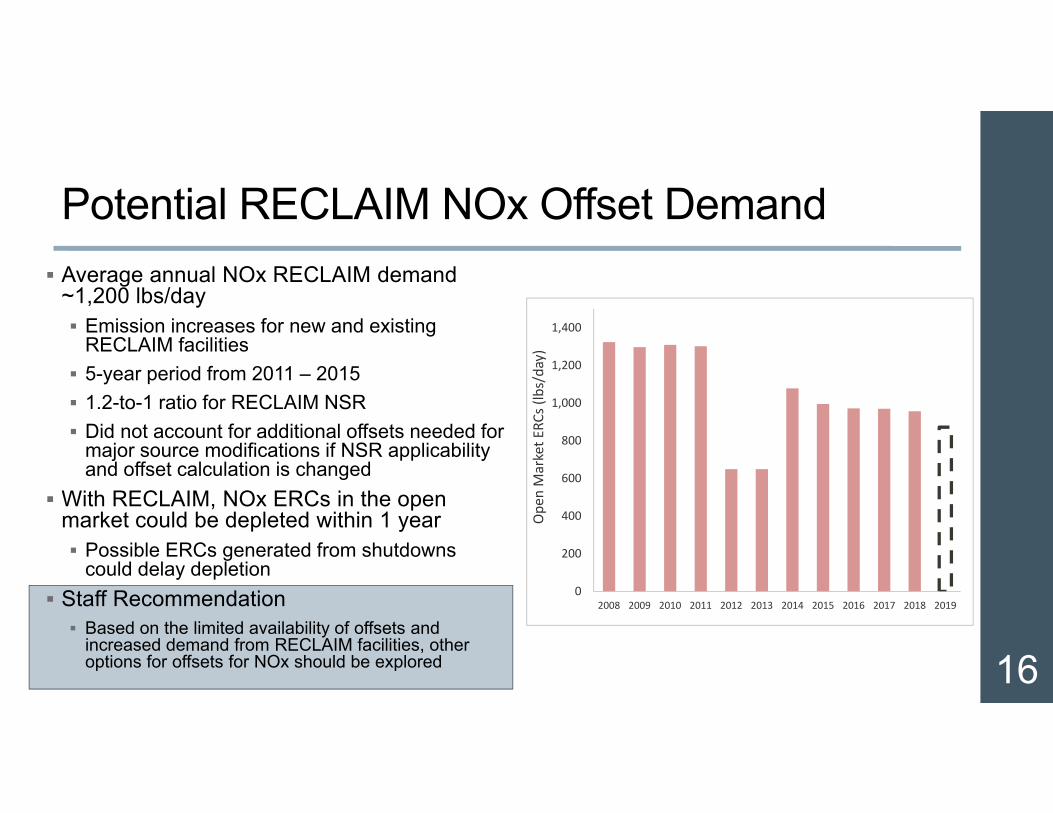
Potential RECLAIM NOx Offset Demand Average annual NOx RECLAIM demand
~1,200 lbs/day Emission increases for new and existing
RECLAIM facilities 5-year period from 2011 – 2015 1.2-to-1 ratio for RECLAIM NSR Did not account for additional offsets needed for
major source modifications if NSR applicability and offset calculation is changed
With RECLAIM, NOx ERCs in the open market could be depleted within 1 year Possible ERCs generated from shutdowns
could delay depletion Staff Recommendation Based on the limited availability of offsets and
increased demand from RECLAIM facilities, other options for offsets for NOx should be explored 16
0
200
400
600
800
1,000
1,200
1,400
2008 2009 2010 2011 2012 2013 2014 2015 2016 2017 2018 2019
Ope
n Market E
RCs (lbs/da
y)

0
200
400
600
800
1,000
1,200
1,400
2008 2009 2010 2011 2012 2013 2014 2015 2016 2017 2018 2019
Ope
n Market E
RCs (lbs/da
y)
PM10
PM10 ERC Net Balance (2008-2019) PM10 ERC balance relatively
stagnant Except for recent increase from
a facility shutdown Net annual average -5 pounds per day (6% decrease) –
Excludes 2019 41 pounds per day (51% increase) –
Includes 2019 Average PM10 ERC cost is
$735,000/ ton per year Staff recommendation: Based on the high price, other options for
PM10 offsets should be explored
17
0
100
200
300
400
500
600
700
800
900
1,000
2008 2009 2010 2011 2012 2013 2014 2015 2016 2017 2018 2019
Ope
n Market E
RCs (lbs/da
y)
SOx
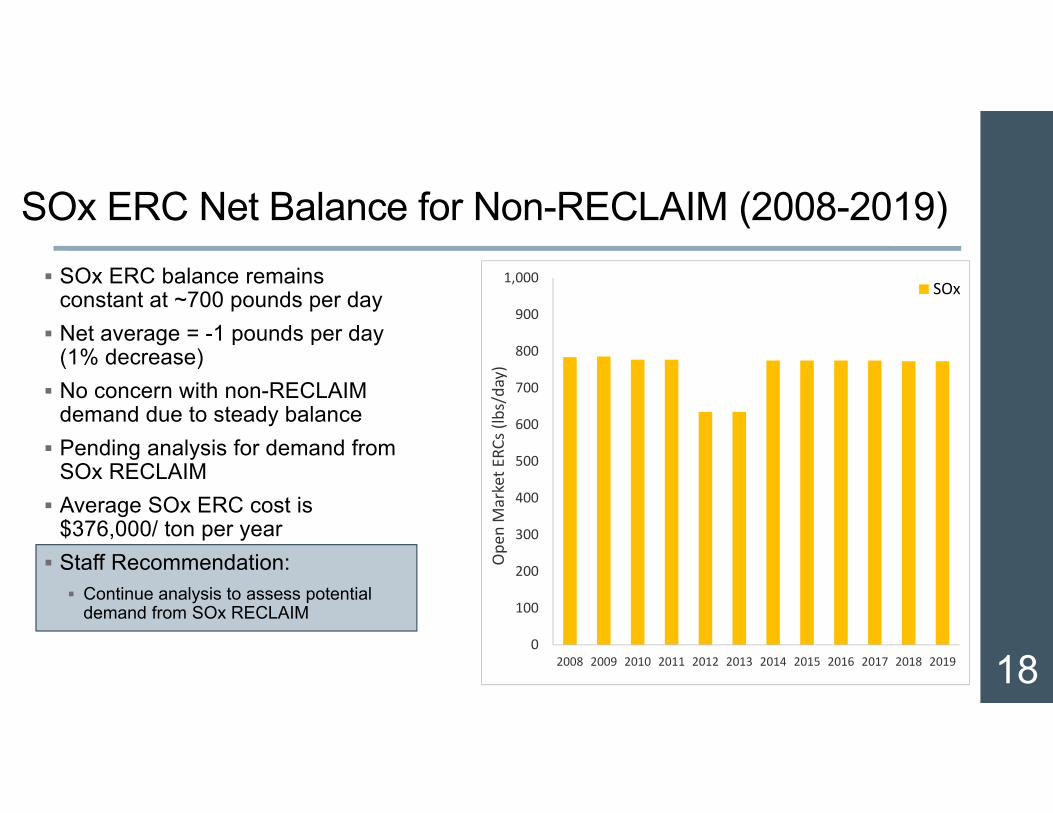
SOx ERC Net Balance for Non-RECLAIM (2008-2019) SOx ERC balance remains
constant at ~700 pounds per day Net average = -1 pounds per day
(1% decrease) No concern with non-RECLAIM
demand due to steady balance Pending analysis for demand from
SOx RECLAIM Average SOx ERC cost is
$376,000/ ton per year Staff Recommendation: Continue analysis to assess potential
demand from SOx RECLAIM
18
Summary of Staff Recommendations for Open Market
VOCNot pursuing other offset options for VOC based on supply and ERC
costNOxExplore other options for offsets for NOx due to the limited availability
of offsets and increased demand from exiting RECLAIM facilitiesPM10Explore other options for offsets for PM10 due to the high priceSOxContinue analysis to assess potential demand from SOx RECLAIM
19
Internal Bank
South Coast AQMD Internal Bank
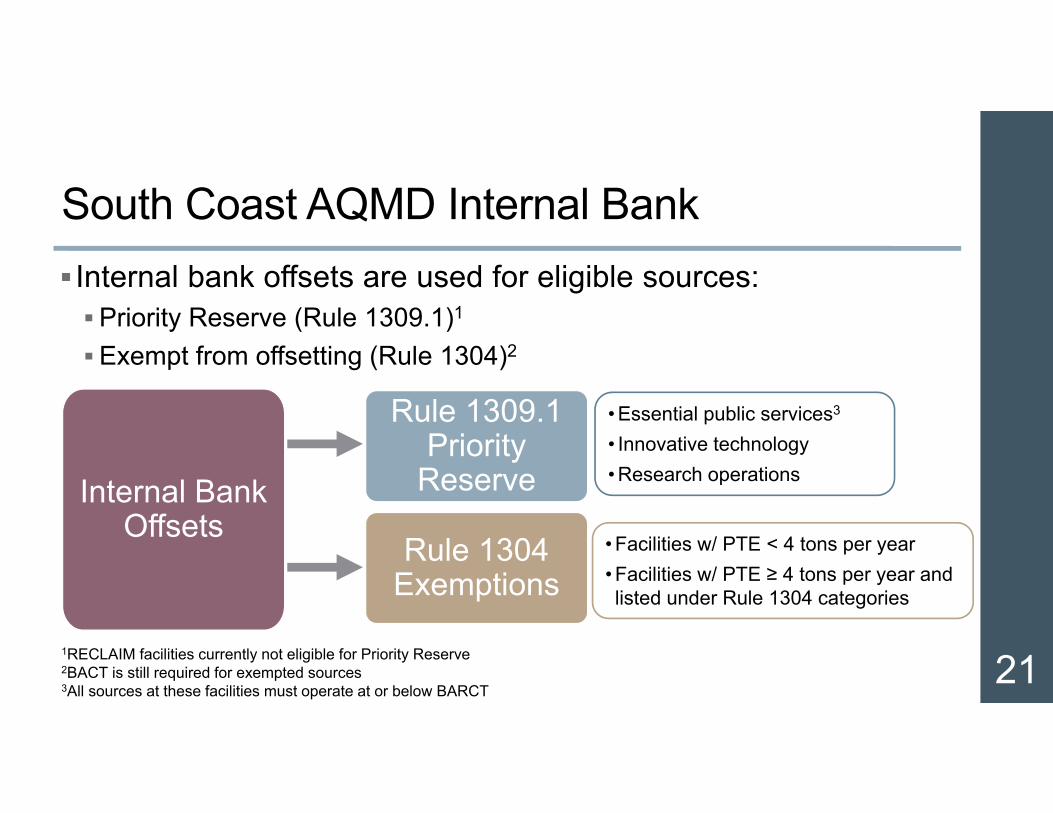
Internal Bank Offsets
Rule 1309.1 Priority
Reserve
Rule 1304 Exemptions
21
Internal bank offsets are used for eligible sources: Priority Reserve (Rule 1309.1)1
Exempt from offsetting (Rule 1304)2
1RECLAIM facilities currently not eligible for Priority Reserve2BACT is still required for exempted sources 3All sources at these facilities must operate at or below BARCT
• Essential public services3
• Innovative technology• Research operations
• Facilities w/ PTE < 4 tons per year • Facilities w/ PTE ≥ 4 tons per year and listed under Rule 1304 categories

South Coast AQMD Internal Bank
22
Offsets in the internal bank generated mostly from orphan shutdownsEmission reductions from sources
that shutdown but did not apply for emission reduction credits (ERCs)
All offsets in the internal bank are discounted annually to BARCT To satisfy federal surplus at time
of use requirement
Generation Primarily orphan shutdowns (amount deposited = 80% of PTE of the orphan shutdown)
Discount Entire balance discounted annually to BARCT
Issuance Provided to sources that are eligible for Priority Reserve (Rule 1309.1) or exempt (Rule 1304)
BARCT Discount for Internal Offsets
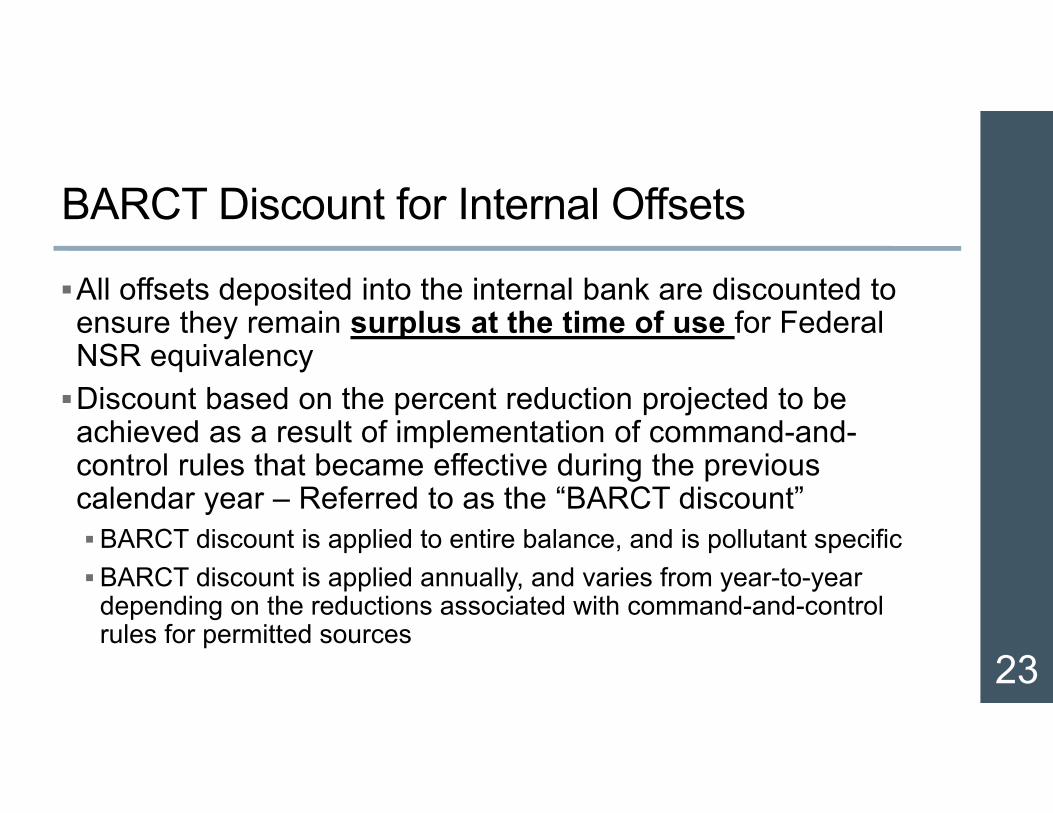
All offsets deposited into the internal bank are discounted to ensure they remain surplus at the time of use for Federal NSR equivalencyDiscount based on the percent reduction projected to be achieved as a result of implementation of command-and-control rules that became effective during the previous calendar year – Referred to as the “BARCT discount”BARCT discount is applied to entire balance, and is pollutant specificBARCT discount is applied annually, and varies from year-to-year
depending on the reductions associated with command-and-control rules for permitted sources
23
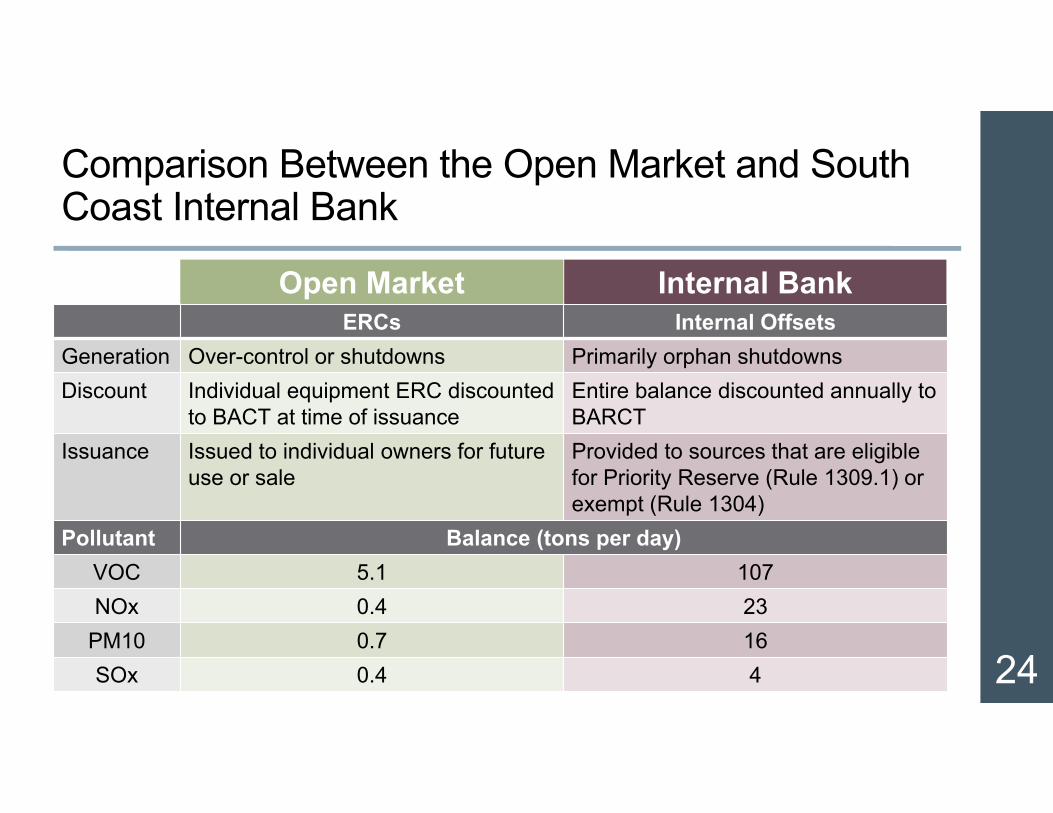
Comparison Between the Open Market and South Coast Internal Bank
24
Open Market Internal BankERCs Internal Offsets
Generation Over-control or shutdowns Primarily orphan shutdownsDiscount Individual equipment ERC discounted
to BACT at time of issuanceEntire balance discounted annually to BARCT
Issuance Issued to individual owners for future use or sale
Provided to sources that are eligible for Priority Reserve (Rule 1309.1) or exempt (Rule 1304)
Pollutant Balance (tons per day)VOC 5.1 107NOx 0.4 23
PM10 0.7 16SOx 0.4 4
Accounting of Internal Bank Offsets
25
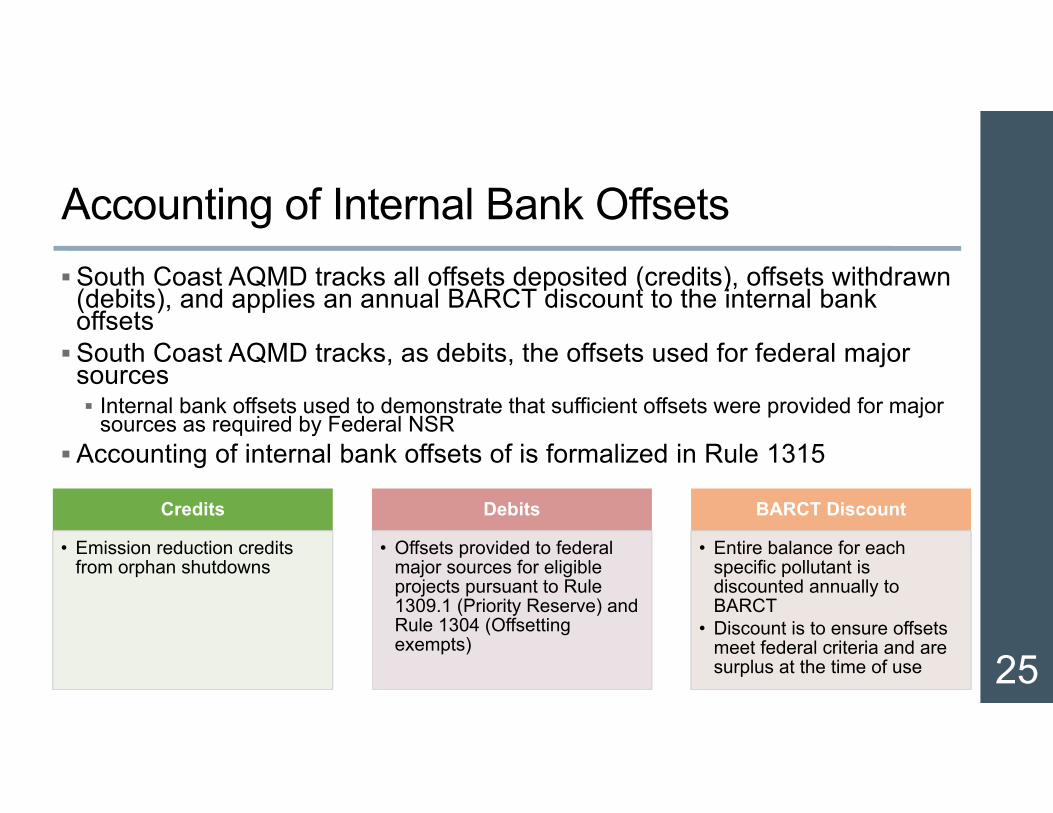
South Coast AQMD tracks all offsets deposited (credits), offsets withdrawn (debits), and applies an annual BARCT discount to the internal bank offsets South Coast AQMD tracks, as debits, the offsets used for federal major
sources Internal bank offsets used to demonstrate that sufficient offsets were provided for major
sources as required by Federal NSRAccounting of internal bank offsets of is formalized in Rule 1315
Credits
• Emission reduction credits from orphan shutdowns
Debits
• Offsets provided to federal major sources for eligible projects pursuant to Rule 1309.1 (Priority Reserve) and Rule 1304 (Offsetting exempts)
BARCT Discount
• Entire balance for each specific pollutant is discounted annually to BARCT
• Discount is to ensure offsets meet federal criteria and are surplus at the time of use
Projections for Internal Bank Offsets
Internal offset projections based on: Future draw for eligible major sources only pursuant to Rules 1304 and
1309.1Average credits, debits1, and BARCT discount over the past 5 years
(2013 – 2017) Internal offsets projections only consider federal requirements
261Growth factor from 2016 Air Quality Management Plan (AQMP) applied to the projected debits
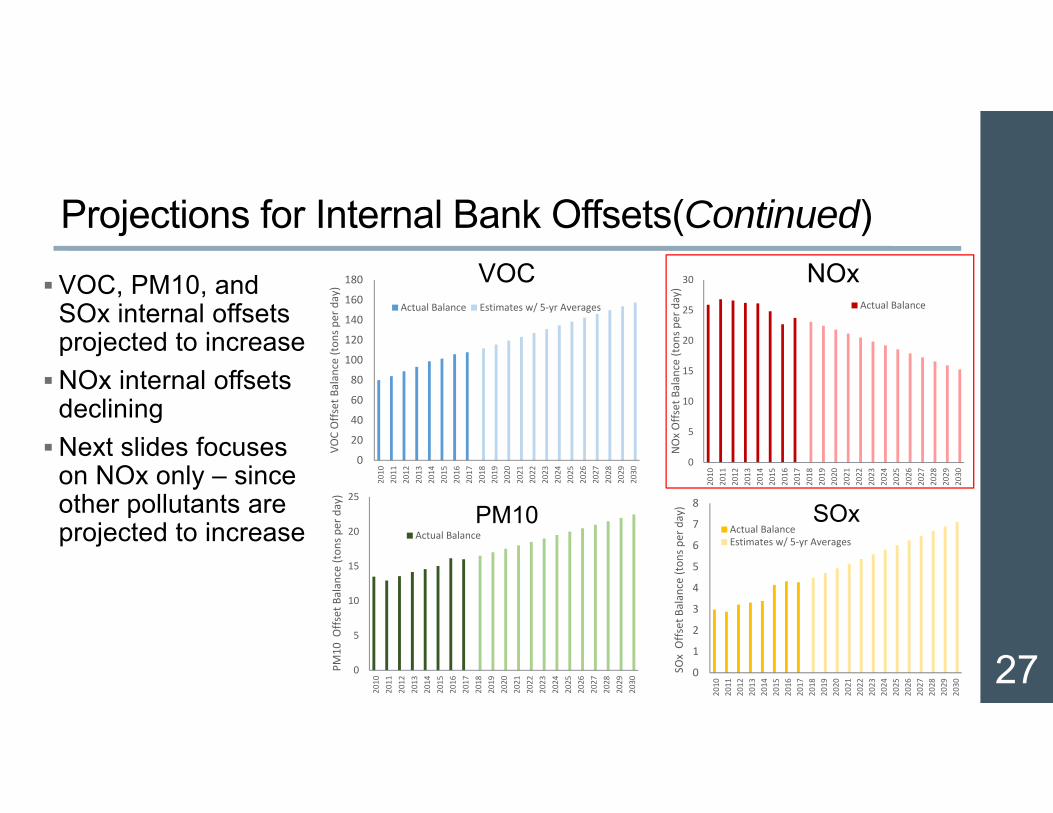
Projections for Internal Bank Offsets(Continued)VOC, PM10, and
SOx internal offsets projected to increaseNOx internal offsets
declining Next slides focuses
on NOx only – since other pollutants are projected to increase
27
0
5
10
15
20
25
30
2010
2011
2012
2013
2014
2015
2016
2017
2018
2019
2020
2021
2022
2023
2024
2025
2026
2027
2028
2029
2030
NOx Offs
et Balan
ce (ton
s per day)
Actual Balance
0
5
10
15
20
25
2010
2011
2012
2013
2014
2015
2016
2017
2018
2019
2020
2021
2022
2023
2024
2025
2026
2027
2028
2029
2030
PM10
Offs
et Balan
ce (ton
s per day)
Actual Balance
0
1
2
3
4
5
6
7
8
2010
2011
2012
2013
2014
2015
2016
2017
2018
2019
2020
2021
2022
2023
2024
2025
2026
2027
2028
2029
2030
SOx Offs
et Balan
ce (ton
s per day)
Actual BalanceEstimates w/ 5‐yr Averages
0
20
40
60
80
100
120
140
160
180
2010
2011
2012
2013
2014
2015
2016
2017
2018
2019
2020
2021
2022
2023
2024
2025
2026
2027
2028
2029
2030
VOC Offs
et Balan
ce (ton
s per day)
Actual Balance Estimates w/ 5‐yr Averages
VOC NOx
PM10 SOx
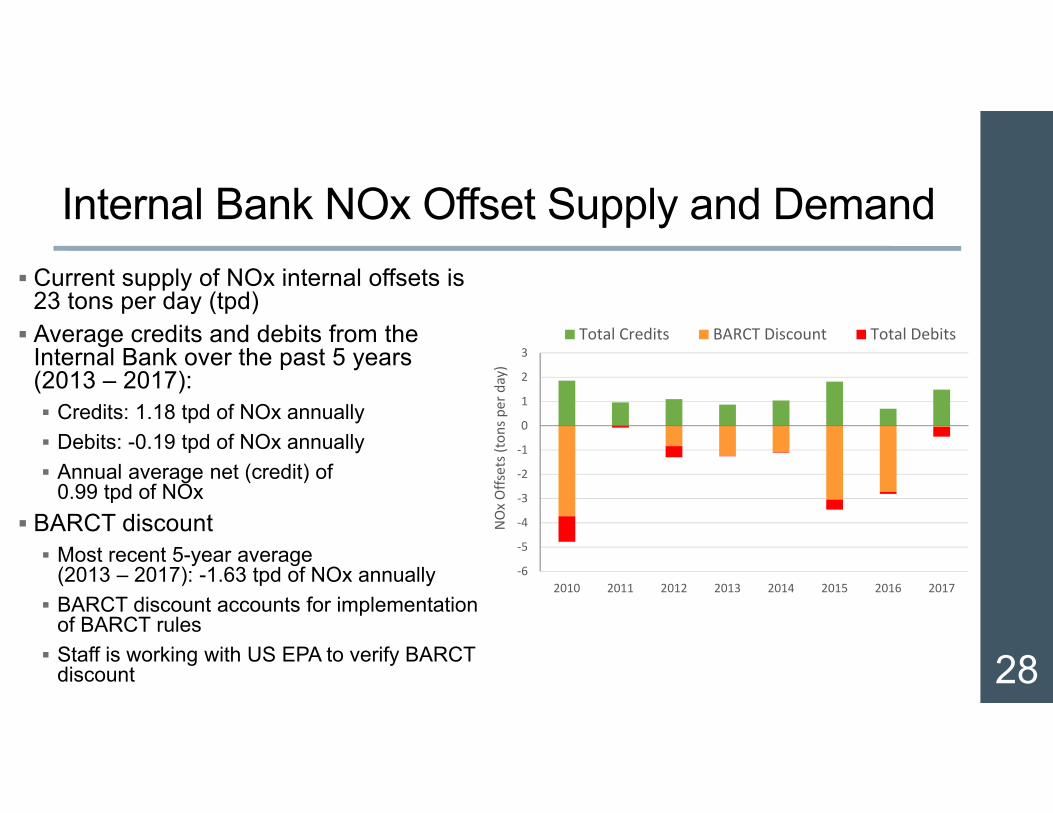
Internal Bank NOx Offset Supply and Demand Current supply of NOx internal offsets is
23 tons per day (tpd) Average credits and debits from the
Internal Bank over the past 5 years (2013 – 2017): Credits: 1.18 tpd of NOx annually Debits: -0.19 tpd of NOx annually Annual average net (credit) of
0.99 tpd of NOx BARCT discount Most recent 5-year average
(2013 – 2017): -1.63 tpd of NOx annually BARCT discount accounts for implementation
of BARCT rules Staff is working with US EPA to verify BARCT
discount 28
‐6
‐5
‐4
‐3
‐2
‐1
0
1
2
3
2010 2011 2012 2013 2014 2015 2016 2017
NOx Offsets (tons per day)
Total Credits BARCT Discount Total Debits
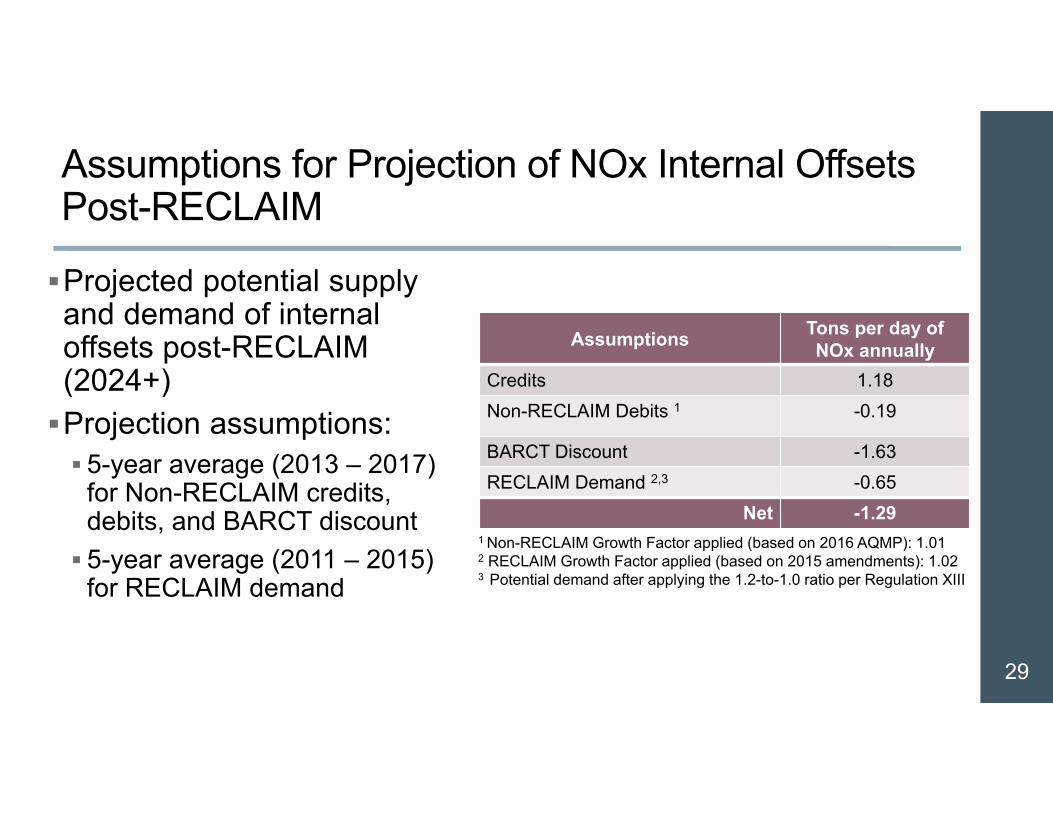
Assumptions for Projection of NOx Internal Offsets Post-RECLAIM
Projected potential supply and demand of internal offsets post-RECLAIM (2024+)Projection assumptions: 5-year average (2013 – 2017)
for Non-RECLAIM credits, debits, and BARCT discount 5-year average (2011 – 2015)
for RECLAIM demand
29
Assumptions Tons per day of NOx annually
Credits 1.18Non-RECLAIM Debits 1 -0.19
BARCT Discount -1.63RECLAIM Demand 2,3 -0.65
Net -1.29 1 Non-RECLAIM Growth Factor applied (based on 2016 AQMP): 1.01 2 RECLAIM Growth Factor applied (based on 2015 amendments): 1.023 Potential demand after applying the 1.2-to-1.0 ratio per Regulation XIII
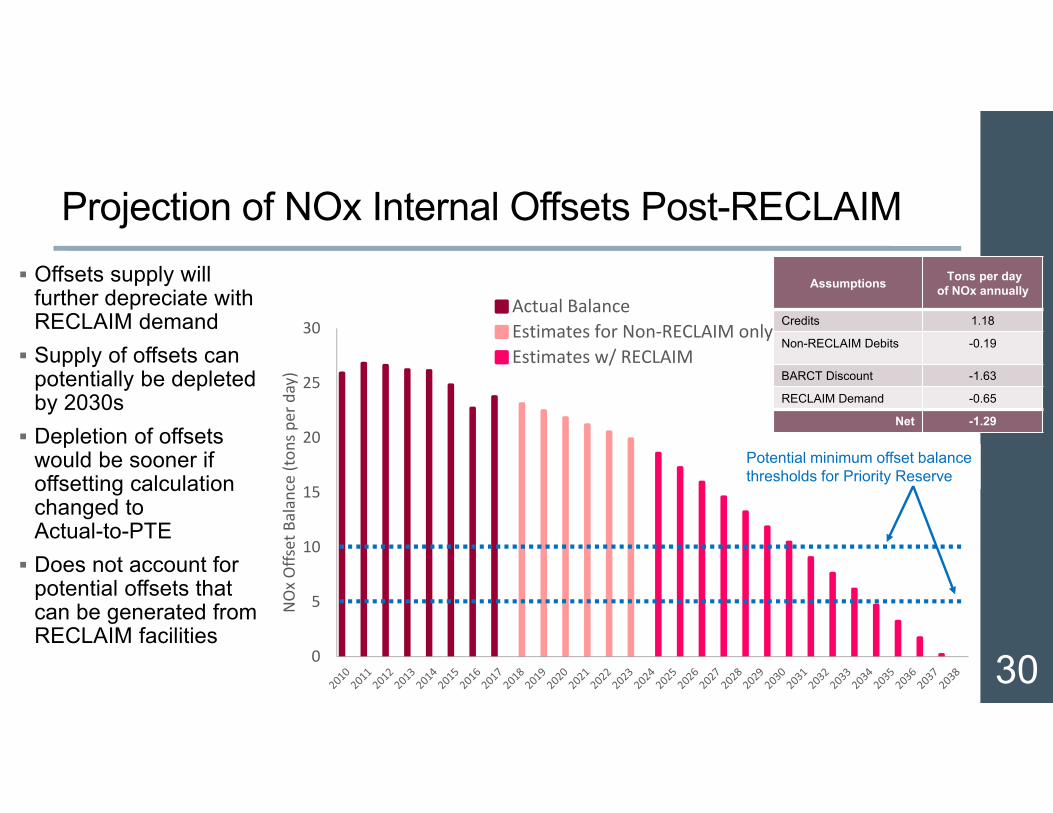
Projection of NOx Internal Offsets Post-RECLAIM Offsets supply will
further depreciate with RECLAIM demand Supply of offsets can
potentially be depleted by 2030s Depletion of offsets
would be sooner if offsetting calculation changed to Actual-to-PTE Does not account for
potential offsets that can be generated from RECLAIM facilities
300
5
10
15
20
25
30
NOx Offs
et Balan
ce (ton
s per day)
Actual BalanceEstimates for Non‐RECLAIM onlyEstimates w/ RECLAIM
Assumptions Tons per day of NOx annually
Credits 1.18
Non-RECLAIM Debits -0.19
BARCT Discount -1.63
RECLAIM Demand -0.65
Net -1.29
Potential minimum offset balance thresholds for Priority Reserve
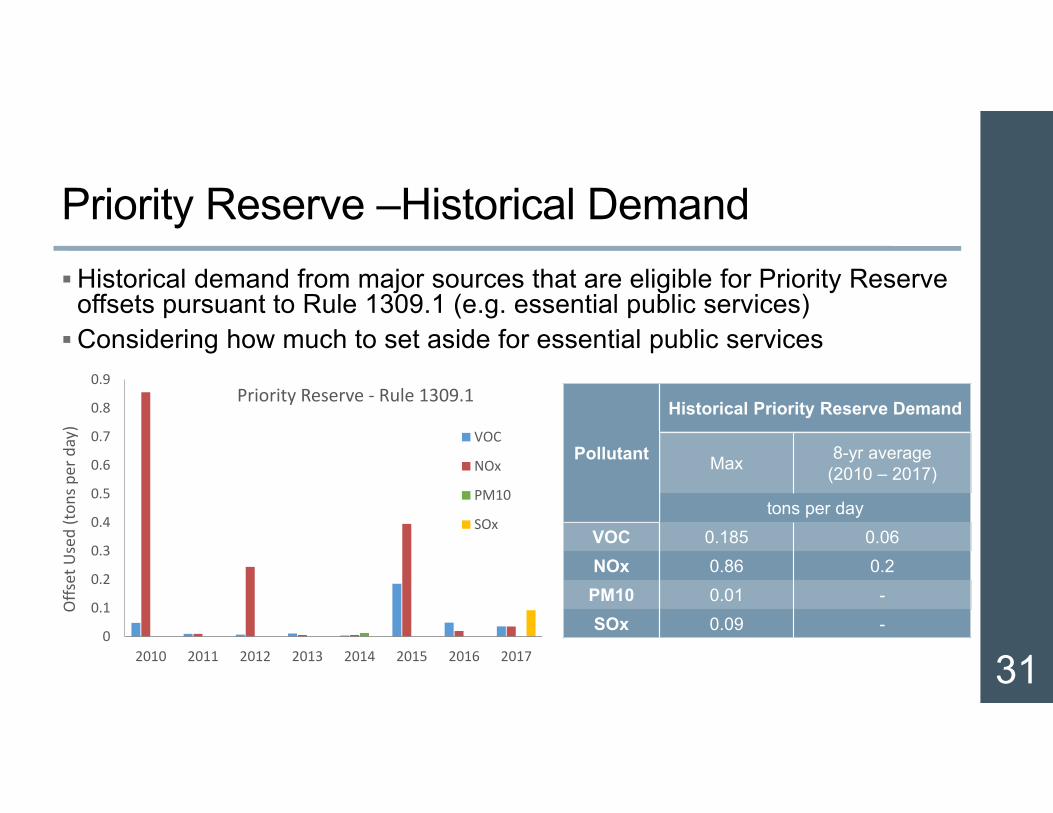
Priority Reserve –Historical DemandHistorical demand from major sources that are eligible for Priority Reserve
offsets pursuant to Rule 1309.1 (e.g. essential public services) Considering how much to set aside for essential public services
310
0.1
0.2
0.3
0.4
0.5
0.6
0.7
0.8
0.9
2010 2011 2012 2013 2014 2015 2016 2017
Offs
et Used (ton
s per day)
Priority Reserve ‐ Rule 1309.1
VOC
NOx
PM10
SOx
Pollutant
Historical Priority Reserve Demand
Max 8-yr average (2010 – 2017)
tons per dayVOC 0.185 0.06NOx 0.86 0.2PM10 0.01 -SOx 0.09 -
Next Steps
Staff will explore options that can reduce the demand and/or increase the supply of NOx, PM10, and possibly SOx offsetsConsider applying BARCT instead of BACT discount for ERCsAnalyze 1304 offset exemptionsExplore with US EPA if some RTCs can be converted back to ERCsProject if future overcontrol of NOx (including shutdowns) will
sufficiently slow rate of depletionStaff will continue to work with US EPA to verify the BARCT adjustment for NOx internal bank
32
Contacts
33
General RECLAIM Questions
•Gary Quinn, P.E.Program Supervisor909‐396‐[email protected]
•Kevin OrellanaProgram Supervisor909‐396‐[email protected]
New Source Review
•Lizabeth GomezAir Quality Specialist909‐396‐[email protected]
•Melissa GamoningAssistant Air Quality Specialist909‐396‐[email protected]
• Michael MorrisPlanning and Rules Manager909‐396‐[email protected]
•Kevin OrellanaProgram Supervisor909‐396‐[email protected]
To receive e-mail notifications for Regulation XIII, sign up at: www.aqmd.gov/sign-up