Embed Size (px)
Citation preview
Plant Physiol. (1979) 64, 99-1030032-0889/79/64/0099/05/$00.50/0
Regulation of the Photosynthesis Rhythm in Euglena gracilisII. INVOLVEMENT OF ELECTRON FLOW THROUGH BOTH PHOTOSYSTEMS'
Received for publication August 21, 1978 and in revised form March 19, 1979
THOMAS A. LONERGAN2 AND MALCOLM L. SARGENTDepartment of Genetics and Development, University of Illinois, Urbana, Illinois 61801
ABSTRACT
Rhythmic changes in the light reactions of Euglena gracilis have beenfound which help to explain the basic reactions effected in the circadianrhythm of 02 evolution. Diurnal changes in the slope of light intensity plotsindicated that the maximal rate of photosynthesis changed throughout thecircadian cycle. No evidence was obtained consistent with the premise thatchanges in chlorophyl content, as measured by total chlorophyl or chlo-rophyUl a/b ratio, or photosynthetic unit size are responsible for thisrhythm.The rate of light-induced electron flow through the entire electron chain
(H20 to methyl viologen) was rhythmic both in whole cells and in isolatedchloroplasts, and the highest rate of electron flow coincided with thehighest rate of 02 evolution. The individual activities of photosystem I(reduced form 2,6-dichlorophenol-indophenol to methyl viologen) and pho-tosystem II (H20 to 2,6"dichlorophenol-indophenol) did not, however,change significantly with time of day, suggesting that the coordination ofthe two photosystems may be the site of circadian control. Evidenceconsistent with this concept was obtained from studies of low temperatureemission from systems I and II folowing preillumination with system I orII light.
A circadian rhythm of photosynthetic 02 evolution has beenobserved in several eukaryotic organisms (16) including Euglena(22). The mechanisms responsible for this rhythm have beeninvestigated but never fully elucidated. Steady-state 02 evolutionin whole cells is a function of both the light reactions and theenzyme activities of the Calvin cycle. The photosynthetic rhythm,however, does not seem attributable to rhythmic changes in theactivity of any Calvin cycle enzyme (8, 15, 22). Therefore, the lightreactions would appear to be the most probable oscillator-con-trolled part of photosynthesis.Many investigators have reported that rhythmic changes in the
light reactions are not responsible for the 02 evolution rhythm ( 15,35, 36, 40). However, there are several indications that someparameters of the light reactions do oscillate in synchronouscultures of Scenedesmus (31-33), Chiamydomonas (30), and Ske-letonema (18). In addition, recent work with Gonyaulax (29) andAcetabularia (38) has cast doubt on the earlier negative findings.Whole cell light intensity plots and studies of whole cell and
chloroplast light-induced electron flow were used in this investi-gation to determine whether or not the light reactions are involvedin the 02 evolution rhythm of Euglena gracilis. The positive
'This work was supported by Grant GM 16541 from the NationalInstitute of General Medical Sciences to M. L. S. and by a NationalInstitutes of Health Traineeship to T. A. L.
2 Present address: Department of Biological Sciences, University ofNewOrleans, New Orleans, Louisiana 70122.
findings of these experiments led to an investigation of pigmentlevel and photosystem coordination as a function of time.
MATERIALS AND METHODS
Culture Conditions. Cultures were maintained and grown aspreviously reported (22) with the one exception that cells wereused at two densities, 90,000 and 150,000 cells/ml. The cells weresynchronized for approximately 7 days b, growth in a light-darkcycle of 10-h light (2.0 x 10⁴ ergs cm s-; 165 ,tE m2 s 10,500lux) and 14-h dark, and then exposed to constant dim light (6.6,tE m-2 s-'; 430 lux) at 25 C. During the entrainment process thecultures displayed a step-like growth curve, but cell division ceasedin constant dim light. Light intensities were measured with a Li-Cor quantum meter (LI-185; LI-190S) that indicates,uE m-2 s-'for photosynthetically active radiation (400-700 nm), and a Li-Cor photometer (LI-185; LI-210S) that indicates lux in relation tothe CIE standard observer curve. The radiometer (Yellow SpringsInstrument model 65) used in our earlier work (22) was notutilized except for monochromatic light sources because the re-sulting values (ergs cm-2 s-1) are misleading because of photosyn-thetically inactive IR radiation.Chloroplast Isolation. Chloroplasts were isolated according to
Forsee and Kahn (13) with the following modifications. Cells weredisrupted either with a French pressure cell (8,000 p.s.i.) if usedfor light reaction assays, or by sonication if used for Chl deter-minations or fluorescence studies. A 30-s sonication pulse resultedin an 80 to 90%o breakage of the cells. The homogenate wascentrifuged at l,OOOg for 45 s in a refrigerated centrifuge. Thesupernatant was decanted and centrifuged at l,OOOg for 4 min tosediment chloroplasts. The chloroplasts were resuspended in iso-lation medium and centrifuged again at l,OOOg for 3 min. Thepellet was then resuspended in isolation medium containing 1%BSA. Chl was determined by the method of Arnon (4).
Light Intensity Plots. Photosynthesis measurements for lightintensity plots were made with the 02 electrode system previouslydescribed (22). The light intensity (unfiltered Koehler UnitronIlluminator) incident on the Gilson jacketed cuvette (95% ethanolflowing around cuvette) was altered with a set of calibrated Balzerneutral density filters and measured with the Li-Cor quantummeter and photometer described above. New cell aliquots fromthe master culture were used for the 02 measurements of eachlight intensity, and all values were corrected for dark respiration.With the cell density used for these experiments (150,000 cells/ml) light saturation occurs at about 230 ,uE m-2 s-1 (about 12,000lux), so all but a few of the data points shown are at intensitiesbelow saturation. These values may be compared to our earlierlight saturation plot (Fig. 2 of ref. 22; abscissa in error; it shouldread 1.9 x 10⁶ ergs cm-2 s-' or 202,tE m-2 s-' full scale ratherthan 5.0 x 10⁶ ergs cm-2 s- ) in which saturation occurred at about100 ,uE m-2 s-' (about 5,300 lux of 1.1 x 10⁶ ergs cm-2 s-) for acell density of 90,000 cells/ml.To lessen the effects of experimental inaccuracies on the deter-
99
www.plantphysiol.orgon May 18, 2018 - Published by Downloaded from Copyright © 1979 American Society of Plant Biologists. All rights reserved.
100LONERGAN AND SARGENT
mination of initial slopes in the standard light intensity plots, thedata were converted from the hyperbolic form to a linear form byplotting the data as intensity/rate (I/V) versus intensity (I) asrecommended by Kok (20) based on the equation transformationsof Hofstee (17). In these linear plots the slope of the line isinversely proportional to Pma. (maximal photosynthetic rate atsaturating light intensity) while they intercept is proportional tothe relative quantum requirement (1/quantum yield). A linearregression program, Stat 1-22A for the Hewlett Packard model 65calculator, was used to calculate they intercept and slope for eachset of data.WholeCell Fluorescence. Fluorescence transient measurements
forChl a were made as described by Munday and Govindjee (24).Thecells (90,000 cells/ml) were centrifuged and resuspended inthe supernatant fraction to give an Awo of 0.2. Thecells were keptin darkness for 1-h while air was bubbled through the suspension,and a second dark adaptation of 3min was allowed after trans-ferring 3 ml of the cell suspension to the instrument.
For fluorescence analysis at low temperatures, cells (90,000cells/ml) were placed in capillary tubes and given either a10-mindark pretreatment, or alO-min preillumination using either a 650± 7 nm or 710 ± 6 nm narrow bandfilter (Pomfret ResearchOptics, Inc.) with a Corning CS1-75 heat-absorbingfilter. Theincidentlight intensity at either wavelength was 10' ergscm- 2 s'I,as determined with a Yellow Springs Instrument model 65 radi-ometer. Cells were frozen inliquidN2 immediately after treatment,and emission of two selected wavelengths was then recorded foreach sample 15 times and averaged. The measurements were madewith an Aminco-Bowman spectrofluorometer using an excitingwavelength of 440 nm (30 nm half-bandwidth) and observationwavelengths of 685 (for PSII) and 720 nm (for PSI).
Photosynthetic Unit Size Determination. Photosynthetic unitsize was determined by titrimetrically monitoring ferricyanidereduction in flashinglight (2). The reaction mixture contained 10mM MgCl2, 100 mm NaCl, 0.5 mm potassium ferricyanide, 100AM gramicidin, and chloroplasts (approximately 5 ig/ml CMfinalconcentration). Saturating flashes(10-tis flashes, 600 flashes/min)were obtained with a General Radio type 1539-A Stroboslavelamp (General Radio Co., Concord, Mass.).
Chl Content and Chi a/b Ratios. Chl content was determinedby the method of Arnon (4). Chl a/b ratios were determined bythe method of Boardman and Thorne (6) for ethanol extracts atliquid N2 temperature. An aliquot of the chloroplast suspension(0.1 ml of 5 jig/ml Chl) was added to 4 ml 95% ethanol, andsamples were placed in capillary tubes and frozen.Whole Chain Electron Flow. The rate of electron flow through
the entire electron transport chain was measured by determin-ing 02 consumption of cells or chloroplasts in the presence ofMV.3 This assay is based on the fact that MV penetrates wholecells as indicated by results whenlight-induced electron transportwas monitored by fluorescence (23). 02 consumption was meas-ured using the same 02 electrode system used for the net photo-synthesis measurements (22) at saturating light intensities.The reaction mixture for whole cells included the cells (90,000
cells/ml) in Cramer and Myers (11) inorganic medium, 400 limMV, and 6 IM gramicidin D. The addition of 6 jAM gramicidin Dmaximally increased the rate of whole chain electron flow indi-cating its effect as an uncoupler. For isolated chloroplasts the finalconcentrations of the reaction components were 1.4 mi MV, 1.4mm sodium azide, 55 mm Na-phosphate (pH 6.7), 8.3 mm NH4Cl,and 5.5 mM MgCl2. The cuvette contained 1.85 ml of the reactionmixture and 0.25 ml of chloroplast suspension.PSII Activity. PSII activity in isolated chloroplasts was esti-
mated by a DCPIP reduction assay described by Stemler and
3Abbreviations: MV: methyl viologen; DCPIP: 2,6-dichlorophenol-in-dophenol.
Govind ee (34) using a saturating light intensity of 1.5 x 16ergcmc2s- The initial rates of DCPIP reduction were recorded upon
illumination. The 2-mi reaction mixture contained about 3,g CMlin 50 mm phosphate buffer (pH 7.8), 10 mm NaCl, 32y lm DCPIP,and 10 mm NH4Cl. An extinction coefficient for DCPIP (3) of2.17 x00'4m1 cm-' at 597 nm (pH 7.8) was used for the ratecalculations. Reduction was completely inhibited by the presenceof100um DCMU.PSI Activity. PSI activity in isolated chloroplasts was measured
using the method of Keck et at. (19). Thefinal concentrations ofthe reactants were 10m mi Tricine (pH 7.8), 100 .Lm DCPIP, 3 mmsodium ascorbate, 400 ILm MV, 500 um sodium azide, 10 l1mgramicidin D, and 10 um DCMU. The saturatinglight intensityand 02 electrode system used for the whole chain assay wereemployed. The chloroplasts (0.2 ml) were added to 1.4 ml ofpremixed reaction mixture.
RESULTS
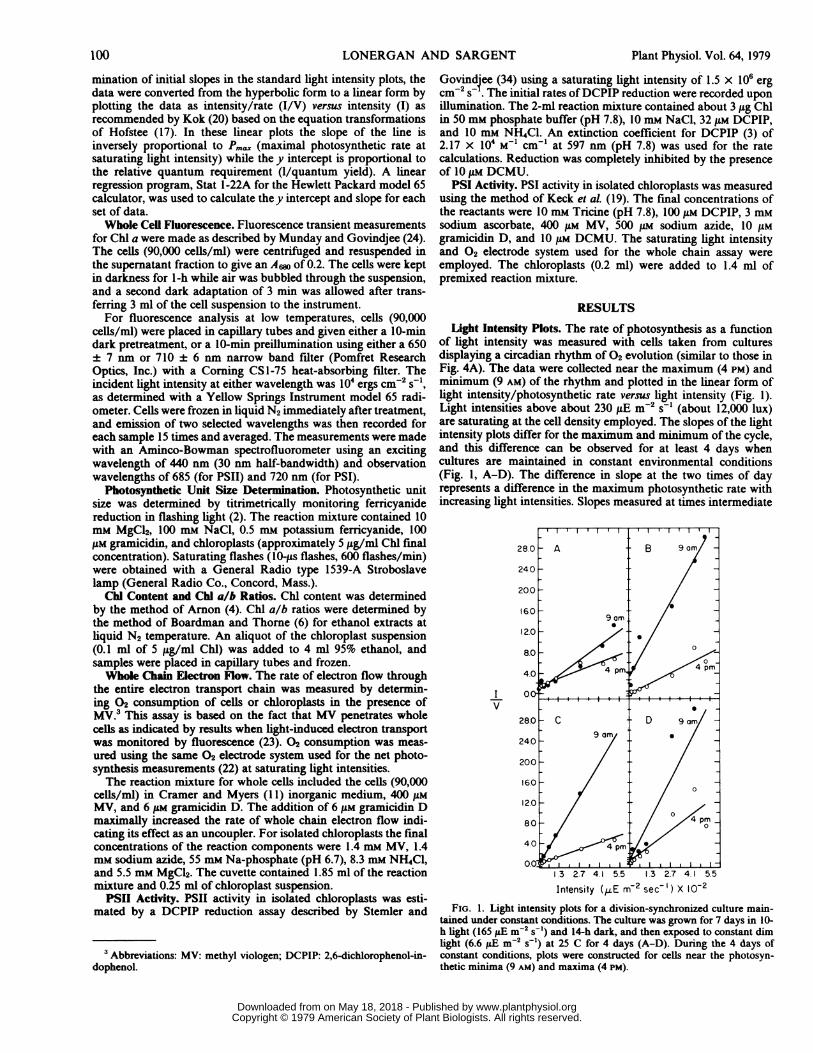
Light Intensity Plots. The rate of photosynthesis as a functionof light intensity was measured with cells taken from culturesdisplaying a circadian rhythmof 02 evolution (similar to those inFig. 4A). The data were collected near the maximum (4 PM) andminimum (9 AM) of the rhythm and plotted in the linear form oflight intensity/photosynthetic rate versuslight intensity (Fig. 1).Light intensities above about 230,uE m-2 s-1 (about 12,000 lux)are saturating at the cell density employed. The slopes of the lightintensity plots differ for the maximum and minimum of the cycle,and this difference can be observed for at least 4 days whencultures are maintained in constant environmental conditions(Fig. 1, A-D). The difference in slope at the two times of dayrepresents a difference in the maximum photosynthetic rate withincreasinglight intensities. Slopes measured at times intermediate
Intensity (-E m-2 sec- ') X 10-2FIG. 1. Light intensity plots for a division-synchronized culture main-
tained under constant conditions. The culture was grown for 7 days in 10-h light (165,uE m-2 s-') and 14-h dark, and then exposed to constant dimlight (6.6 ,uE m-2 s-') at 25 C for 4 days (A-D). During the 4 days ofconstant conditions, plots were constructed for cells near the photosyn-thetic minima (9 AM) and maxima (4 PM).
too Plant Physiol. Vol. 64, 1979
www.plantphysiol.orgon May 18, 2018 - Published by Downloaded from Copyright © 1979 American Society of Plant Biologists. All rights reserved.
PHOTOSYNTHESIS RHYTHM IN EUGLENA
between the maximum and minimum points of the light-darkcycle are intermediate in value (Fig. 2). The y intercepts of themaximum and minimum for any 1 day were frequently very close,indicating little change in the relative quantum requirement.
Chi Content and Chi a/b Ratios. Oscillations in the amount ofChl could explain the rhythm in photosynthetic rate at saturatinglight intensities (1, 28). However, when Euglena is grown inconstant dim light no obvious rhythm in Chl content (total mgChl/cell) could be detected (data not shown). This varies from therhythmicity in Chl content found in light-dark cycles, in whichcondition the cells are synchronously dividing, and the Chl contentper cell approximately doubles before cell division and thenreturns to a basal level (12).The Chl a/b ratio, by use of low temperature fluorescence
techniques (6), was not rhythmic (data not shown) but two con-sistent alterations of this ratio were routinely observed: (a) a dropin the a/b ratio from 15/1 to 10/1 during the light portion of thelight-dark cycle and during the 1st day of dim light conditions;and (b) an increase in the a/b ratio back to 15/1 by the 3rd dayof constant conditions, presumably an adaptation to low lightconditions. It was not determined for either situation which Chlspecies was responsible for the alterations.
Photosynthetic Unit Size. There is no obvious rhythm in pho-tosynthetic unit size as measured by the number of Chl partici-pating in the transfer of one electron from H20 to K3Fe(CN)6(data not shown). An increase in unit size after the 1st day inconstant conditions, from 100 Chl/electron to about 250 ChM/electron, most likely represents an adaptation to growth in the lowlight intensity. The photosynthetic unit size for Euglena is smallerthan that of some higher plants (1).Whole Chain Electron Flow. Changes in the maximum photo-
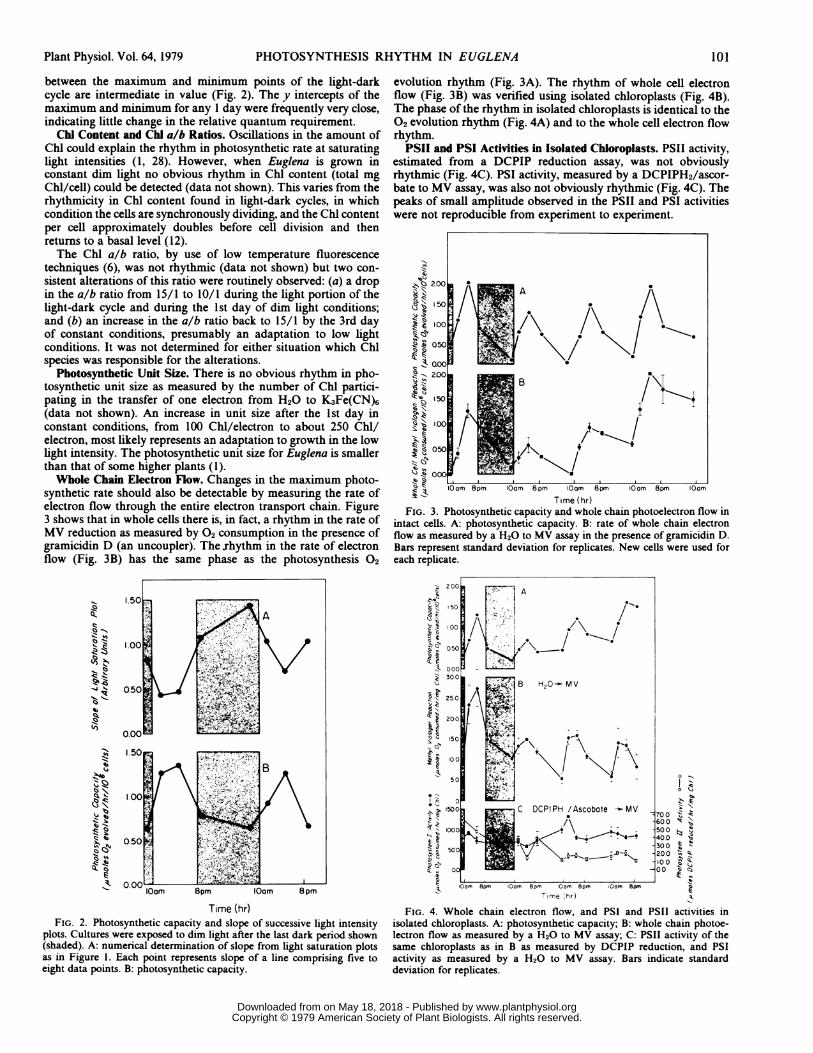
synthetic rate should also be detectable by measuring the rate ofelectron flow through the entire electron transport chain. Figure3 shows that in whole cells there is, in fact, a rhythm in the rate ofMV reduction as measured by 02 consumption in the presence ofgramicidin D (an uncoupler). The rhythm in the rate of electronflow (Fig. 3B) has the same phase as the photosynthesis 02
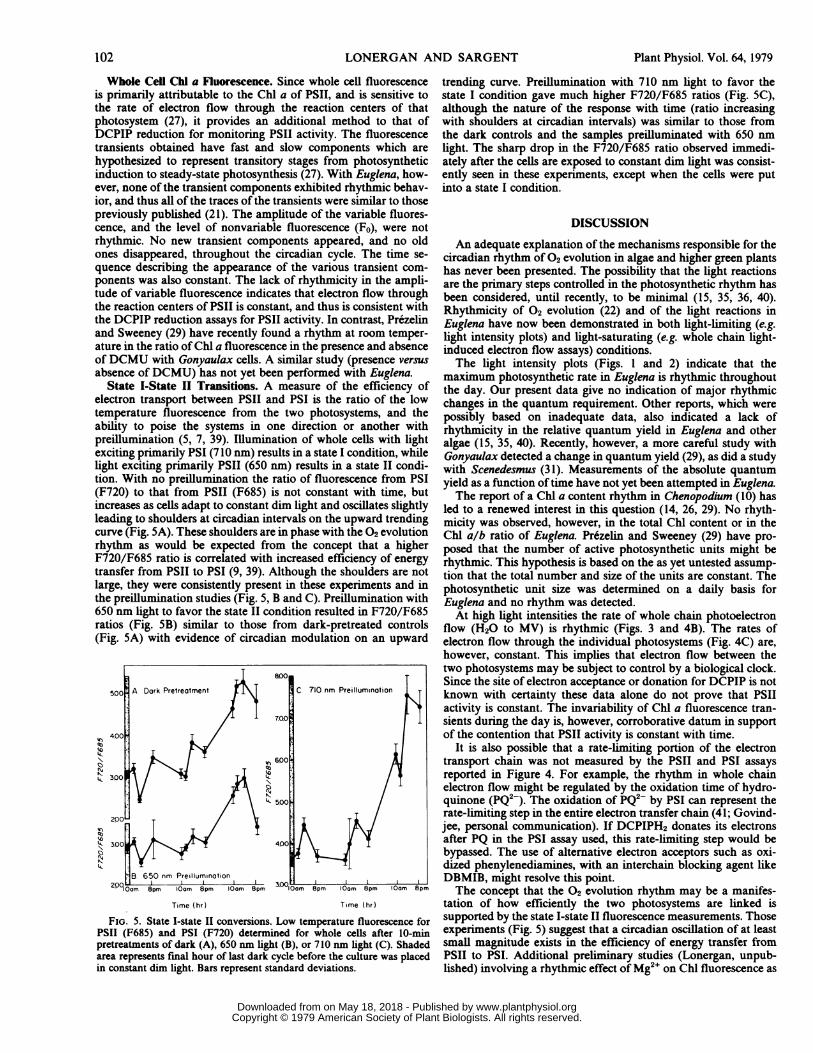
evolution rhythm (Fig. 3A). The rhythm of whole cell electronflow (Fig. 3B) was verified using isolated chloroplasts (Fig. 4B).The phase of the rhythm in isolated chloroplasts is identical to the02 evolution rhythm (Fig. 4A) and to the whole cell electron flowrhythm.PSII and PSI Activities in Isolated Chloroplasts. PSII activity,
estimated from a DCPIP reduction assay, was not obviouslyrhythmic (Fig. 4C). PSI activity, measured by a DCPIPH2/ascor-bate to MV assay, was also not obviously rhythmic (Fig. 4C). Thepeaks of small amplitude observed in the PSII and PSI activitieswere not reproducible from experiment to experiment.
IZ 2100 *
D 050
2.00
o050
lOom 8pm loom 8pm lOam 8pm lOom 8pm lOamTime (hr)
FIG. 3. Photosynthetic capacity and whole chain photoelectron flow inintact cells. A: photosynthetic capacity. B: rate of whole chain electronflow as measured by a H20 to MV assay in the presence of gramicidin D.Bars represent standard deviation for replicates. New cells were used foreach replicate.
1.0
0.50
O*OClOam 8pm lOam 8pm
Time (hr)FIG. 2. Photosynthetic capacity and slope of successive light intensity
plots. Cultures were exposed to dim light after the last dark period shown(shaded). A: numerical determination of slope from light saturation plotsas in Figure 1. Each point represents slope of a line comprising five toeight data points. B: photosynthetic capacity.
, 2 00
'00
250
200
1O50
100"I, 250
z 300
o 215 0
2 00
Time (hr)
I_
, \
Io 'Q
o %
e.,Z Q
11IC
FIG. 4. Whole chain electron flow, and PSI and PSII activities inisolated chloroplasts. A: photosynthetic capacity; B: whole chain photoe-lectron flow as measured by a H20 to MV assay; C: PSII activity of thesame chloroplasts as in B as measured by DCPIP reduction, and PSIactivity as measured by a H20 to MV assay. Bars indicate standarddeviation for replicates.
Plant Physiol. Vol. 64, 1979 101
www.plantphysiol.orgon May 18, 2018 - Published by Downloaded from Copyright © 1979 American Society of Plant Biologists. All rights reserved.
LONERGAN AND SARGENT
Whole Cell Chl a Fluorescence. Since whole cell fluorescenceis primarily attributable to the Chl a of PSII, and is sensitive tothe rate of electron flow through the reaction centers of thatphotosystem (27), it provides an additional method to that ofDCPIP reduction for monitoring PSII activity. The fluorescencetransients obtained have fast and slow components which arehypothesized to represent transitory stages from photosyntheticinduction to steady-state photosynthesis (27). With Euglena, how-ever, none of the transient components exhibited rhythmic behav-ior, and thusall of the traces of the transients were similar to thosepreviously published (21). The amplitude of the variable fluores-cence, and the level of nonvariable fluorescence (Fo), were notrhythmic. No new transient components appeared, and no oldones disappeared, throughout the circadian cycle. The time se-quence describing the appearance of the various transient com-ponents was also constant. The lack of rhythmicity in the ampli-tude of variable fluorescence indicates that electron flow throughthe reaction centers of PSII is constant, and thus is consistent withthe DCPIP reduction assays for PSII activity. In contrast, Prezelinand Sweeney (29) have recently found a rhythm at room temper-ature in the ratio of Chl a fluorescence in the presence and absenceof DCMU with Gonyaulax cells. A similar study (presence versusabsence of DCMU) has not yet been performed with Euglena.
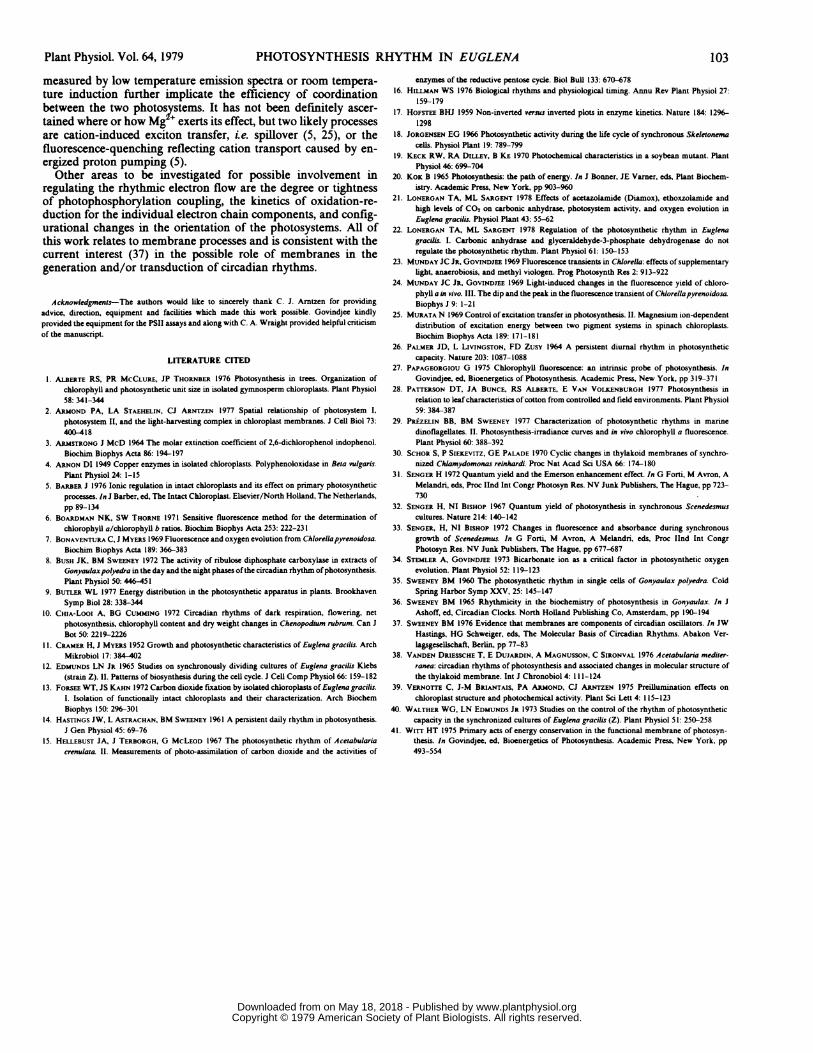
State I-State II Transitions. A measure of the efficiency ofelectron transport between PSII and PSI is the ratio of the lowtemperature fluorescence from the two photosystems, and theability to poise the systems in one direction or another withpreillumination (5, 7, 39). Illumination of whole cells with lightexciting primarily PSI (710 nm) results in a state I condition, whilelight exciting primarily PSII (650nm) results in a stateII condi-tion. With no preillumination the ratio of fluorescence from PSI(F720) to that from PSII (F685) is not constant with time, butincreases as cells adapt to constant dimlight and oscillates slightlyleading to shoulders at circadian intervals on the upward trendingcurve (Fig. 5A). These shoulders are in phase with the 02 evolutionrhythm as would be expected from the concept that a higherF720/F685 ratio is correlated with increased efficiency of energytransfer from PSII to PSI (9, 39). Although the shoulders are notlarge, they were consistently present in these experiments and inthe preillumination studies (Fig. 5, B and C). Preillumination with650 nmlight to favor the stateII condition resulted in F720/F685ratios (Fig. SB) similar to those from dark-pretreated controls(Fig.5A) with evidence of circadian modulation on an upward
8.00500 -A Dark Pretreatment C, 710 nm Preilluminatian
ararpesnsfnl4oro0as0akccl eoeth utrwsp00400.~~~~~~~~~~~60
'0~~~~~~~~~~~~~50
200'
K300 40
B,650nmPrillumKno00.200,
'a p om8mlom8m Om8mlom8mlo p
Brtetet fdr65 (mPeluiAt,io0nm ih B,o mhh C.Sae
pret reatmsents mlhuof lsdark(A,y50nmlgh(b),fore710 cmulght (C). Shadedin constant dim light. Bars represent standard deviations.
trending curve. Preillumination with 710 nmlight to favor thestate I condition gave much higher F720/F685 ratios (Fig.SC),although the nature of the response with time (ratio increasingwith shoulders at circadian intervals) was similar to those fromthe dark controls and the samples preilluminated with 650 nmlight. The sharp drop in the F720/F685 ratio observed immedi-ately after the cells are exposed to constant dimlight was consist-ently seen in these experiments, except when the cells were putinto a state I condition.
DISCUSSION
An adequate explanation of the mechanisms responsible for thecircadian rhythmof 02 evolution in algae and higher green plantshas never been presented. The possibility that the light reactionsare the primary steps controlled in the photosynthetic rhythm hasbeen considered, until recently, to be minimal (15, 35, 36, 40).Rhythmicityof 02 evolution (22) and of the light reactions inEuglena have now been demonstrated in bothlight-limiting (e.g.light intensity plots) andlight-saturating (e.g. whole chain light-induced electron flow assays) conditions.Thelight intensity plots (Figs. 1 and 2) indicate that the
maximum photosynthetic rate in Euglena is rhythmic throughoutthe day. Our present data give no indication of major rhythmicchanges in the quantum requirement. Other reports, which werepossibly based on inadequate data, also indicated a lack ofrhythmicity in the relative quantum yield in Euglena and otheralgae (15, 35, 40). Recently, however, a more careful study withGonyaulax detected a change in quantum yield (29), as did a studywith Scenedesmus (31). Measurements of the absolute quantumyield as a function of time have not yet been attempted in Euglena.The report of a Chl a content rhythm in Chenopodium (10) has
led to a renewed interest in this question (14, 26, 29). No rhyth-micity was observed, however, in the total Chl content or in theChl a/b ratio of Euglena. Prezelin and Sweeney (29) have pro-posed that the number of active photosynthetic units might berhythmic. This hypothesis is based on the as yet untested assump-tion that the total number and size of the units are constant. Thephotosynthetic unit size was determined on a daily basis forEuglena and no rhythm was detected.At high light intensities the rate of whole chain photoelectron
flow (H20 to MV) is rhythmic (Figs. 3 and 4B). The rates ofelectron flow through the individual photosystems (Fig. 4C) are,however, constant. This implies that electron flow between thetwo photosystems may be subject to control by a biological clock.Since the site of electron acceptance or donation for DCPIP is notknown with certainty these data alone do not prove that PSIIactivity is constant. The invariability of Chl a fluorescence tran-sients during the day is, however, corroborative datum in supportof the contention that PSII activity is constant with time.
It is also possible that a rate-limiting portion of the electrontransport chain was not measured by the PSII and PSI assaysreported in Figure 4. For example, the rhythm in whole chainelectron flow might be regulated by the oxidation time of hydro-quinone (pQ2-). The oxidation of PQ2- by PSI can represent therate-limiting step in the entire electron transfer chain (41; Govind-jee, personal communication). If DCPIPH2 donates its electronsafter PQ in the PSI assay used, this rate-limiting step would bebypassed. The use of alternative electron acceptors such as oxi-dized phenylenediamines, with an interchain blocking agent likeDBMIB, might resolve this point.The concept that the O2 evolution rhythm may be a manifes-
tation of how efficiently the two photosystems are linked issupported by the state I-state II fluorescence measurements. Thoseexperiments (Fig. 5) suggest that a circadian oscillation of at leastsmall magnitude exists in the efficiency of energy transfer fromPSII toPiSI. Additional preliminary studies (Lonergan, unpub-lished) involving a rhythmic effect of Mg"~on CMl fluorescence as
102 Plant Physiol. Vol. 64, 1979
www.plantphysiol.orgon May 18, 2018 - Published by Downloaded from Copyright © 1979 American Society of Plant Biologists. All rights reserved.
measured by low temperature emission spectra or room tempera-
ture induction further implicate the efficiency of coordination
between the two photosystems. It has not been defiitely
tained where or how Mg exerts its effect, but two likely processes
are cation-induced exciton transfer, ie. spillover (5, 25), or the
fluorescence-quenching reflecting cation transport caused by
ergized proton pumping (5).
Other areas to be investigated for possible involvement
regulating the rhythmic electron flow are the degree or tightness
of photophosphorylation coupling, the kinetics of oxidation-re-
duction for the individual electron chain components, and config-
urational changes in the orientation of the photosystems. All
this work relates to membrane processes and is consistent with
current interest (37) in the possible role of membranes in
generation and/or transduction of circadian rhythms.
Acknowledgments-The authors would like to sincerely thank J. Amtzen providing
advice, direction, equipment and facilities which made this work possible. kindly
provided the equipment for the PSII assays and along with C. A. Wraight
of the manuscript.
LITERATURE CITED
1. ALBERTE RS, PR MCCLURE, JP THORNRER 1976 Photosynthesis Organization
chlorophyll and photosynthetic unit size in isolated gymnosperm
58: 341-3442. ARMOND PA, LA STAEHELIN, CJ ARNTZEN 1977 Spatial relationship photosystem
photosystemII, and the light-harvesting complex in chloroplast
400-4183. ARMSTRONG J McD 1964 The molar extinction coefficient of 2,6-dichlorophenol
Biochim Biophys Acta 86: 194-197
4. ARNON DI 1949 Copper enzymes in isolated chloroplasts. Polyphenoloxidase Beta
Plant Physiol 24: 1-15
5. BARBER J 1976 Ionic regulation in intact chloroplasts and its effect photosynthetic
processes.In J Barber, ed, The Intact Chloroplast. Elsevier/North
pp 89-1346. BOARDMAN NK, SW THORNE 1971 Sensitive fluorescence method
chlorophyll a/chlorophyll b ratios. Biochim Biophys Acta
7. BONAVENTURA C, J MYERS1969 Fluorescence and oxygen evolution Chlorellapyrenoidosa.
Biochim Biophys Acta 189: 366-383
8. BUSH JK, BM SWEENEY 1972 The activity of ribulose diphosphate
Gonyaulaxpolyedra in the day and the night phases of the circadian
Plant Physiol 50: 446 451
9. BuTLER WL 1977 Energy distribution in the photosynthetic
Symp Biol 28: 338-344
10. CHIA-Looi A, BG CUMMING 1972 Circadian rhythms of
photosynthesis, chlorophyll content and dry weight changes in Chenopodium JBot 50: 2219-2226
11. CRAMER H, J MYERs 1952 Growth and photosynthetic characteristics of Euglena gracilis. Arch
Mikrobiol 17: 384-402
12. EDMUNDs LN JR 1965 Studies on synchronously dividing cultures of Euglena gracilis Klebs
(strain Z). II. Pattems of biosynthesis during the cell cycle. J
13. FORSEE WT, JS KAHN 1972 Carbon dioxide fixation by isolatedchloroplasts of Euglena gracilis.
Isolation of functionally intactchloroplasts and their
Biophys 150: 296-301
14. HASTINGS JW, L ASTRACHAN, BM SWEENEY A persistent daily rhythm in photosynthesis.
J Gen Physiol 45: 69-76I5. HELLEBUST JA, JTERBORGH, G McLEOD 1967 The photosynthetic rhythm of Acetabularia
crenulata II. Measurements of photo-assimilation of carbon
103enzymes of the reductive pentose cycle. Biol Bull 133: 670-678
16. HILLMAN WS 1976 Biological rhythms and physiological timing. Annu Rev Plant Physiol 27:
159-17917. HOFSTEE BHJ 1959 Non-inverted versus inverted plots in enzyme kinetics. Nature 184: 1296-
129818. JORGENSEN EG 1966 Photosynthetic activity during the life cycle of synchronous Skeletonema
cells. Physiol Plant 19: 789-79919. KECK RW, RA DtuLEY, B KE 1970 Photochemical characteristics in a soybean mutant. Plant
Physiol 46: 699-70420. KoIC B 1965 Photosynthesis: the path of energy. In J Bonner, JE Varner, eds, Plant Biochem-
istry. Academic Press, New York, pp 903-96021. LONERGAN TA, ML SARGENT 1978 Effects of acetazolamide (Diamox), ethoxzolamide and
high levelsof CO2 on carbonic anhydrase, photosystem activity, and oxygen evolution in
Euglena gracilis. Physiol Plant 43: 55-6222. LONERGAN TA, ML SARGENT 1978 Regulation of the photosynthetic rhythm in Euglena
gracilis. 1. Carbonic anhydrase and glyceraldehyde-3-phosphate dehydrogenase do not
regulate the photosynthetic rhythm. Plant Physiol 61: 150-15323. MUNDAY JC JR. GOVINDJEE 1969 Fluorescence transients in Chlorella: effects of supplementary
light, anaerobiosis, and methyl viologen. Prog Photosynth Res 2: 913-92224. MUNDAY JC JR, GOVINDJEE 1969 Light-induced changes in the fluorescence yield of chloro-
phyll a in vivo. III. The dip andthe peak in the fluorescence transient of ChlorellapyrenoidosaBiophys J 9: 1-21
25. MURATA N 1969 Control of excitation transfer in photosynthesis. II. Magnesium ion-dependentdistribution of excitation energy between two pigment systems in spinach chloroplasts.
Biochim Biophys Acta 189: 171-18126. PALMER JD, L LIVINGSTON, FD ZusY 1964 A persistent diurnal rhythm in photosynthetic
capacity. Nature 203: 1087-108827. PAPAGEORGIOU G 1975 Chlorophyll fluorescence: an intrinsic probe of photosynthesis. In
Govindjee, ed, Bioenergetics of Photosynthesis. Academic Press, New York, pp 319-37128. PATTERSON DT, JA BUNCE, RS ALBERTE, E VAN VOLKENBURGH 1977 Photosynthesis in
relation to leaf characteristics of cotton from controlled and field environments. Plant Physiol
59: 384-38729. PREZELIN BB, BM SWEENEY 1977 Characterization of photosynthetic rhythms in marine
dinoflagellates. II. Photosynthesis-irradiance curves and in vivo chlorophyll a fluorescence.Plant Physiol 60: 388-392
30. SCHORS, PSIEKEvITz, GE PALADE 1970 Cyclic changes in thylakoid membranes of synchro-nized Chlamydomonas reinhardi. Proc Nat Acad Sci USA 66: 174-180
31. SENGER H 1972 Quantum yield and the Emerson enhancement effect. In G Forti, M Avron, A
Melandri, eds, ProcIInd Int Congr Photosyn Res. NV Junk Publishers, The Hague, pp 723-
73032. SENGER H, NI BISHOP 1967 Quantum yield of photosynthesis in synchronous Scenedesmus
cultures. Nature 214: 140-14233. SENGER, H, NI BISHOP 1972 Changes in fluorescence and absorbance during synchronous
growth of Scenedesmus. In G Forti, M Avron, A Melandri, eds, Proc lIndInt Congr
Photosyn Res. NV Junk Publishers, The Hague, pp677-687
34. STEMLER A,GOVINDJEE 1973 Bicarbonate ion as a critical factor in photosynthetic oxygen
evolution. Plant Physiol 52: 119-12335. SWEENEY BM 1960 The photosynthetic rhythm in single cells of Gonyaulax polyedra. Cold
Spring Harbor Symp XXV, 25: 145-14736. SWEENEY BM1965 Rhythmicity in the biochemistry of photosynthesisin Gonyaulax. In J
Ashoff, ed, Circadian Clocks. North Holland Publishing Co, Amsterdam, pp 190-19437. SWEENEY BM 1976 Evidence that membranes are components of circadian oscillators. In JW
Hastings, HG Schweiger, eds, The Molecular Basis of Circadian Rhythms. Abakon Ver-
lagsgesellschaft, Berlin, pp 77-8338. VANDEN DRIESSCHET, EDU1ARDIN, A MAGNUSSON, C SIRONVAL 1976 Acetabularia mediter-
ranea: circadian rhythms of photosynthesis and associated changes in molecular structure of
the thylakoid membrane. Int J Chronobiol 4:111-12439. VERNOTTE C, J-M BRIANTAIS, PA ARMOND,CJ ARNTZEN 1975 Preillumination effects on
chloroplast structure and photochemical activity. Plant Sci Lett 4:115-123
40. WALTHER WG, LN EDMUNDS JR 1973 Studies on the control of the rhythm of photosynthetic
capacity in the synchronized cultures of Euglena gracilis (Z). Plant Physiol 51: 250-25841.WIrr HT 1975 Primary acts of energy conservation in the functional membrane of photosyn-
thesis. In Govindjee, ed, Bioenergetics of Photosynthesis. Academic Press, New York, pp
493-554
Plant Physiol. Vol. 64, 1979 PHOTOSYNTHESIS RHYTHM IN EUGLENA
www.plantphysiol.orgon May 18, 2018 - Published by Downloaded from Copyright © 1979 American Society of Plant Biologists. All rights reserved.


![Transcriptome, proteome and draft genome of Euglena gracilis · Euglena gracilis, a photosynthetic flagellate, was first de-scribed by van Leeuwenhoek in 1684 [1]. There are over](https://img.pdfslide.us/doc/110x75/60a28268d3ba7c5627551c52/transcriptome-proteome-and-draft-genome-of-euglena-gracilis-euglena-gracilis-a.jpg)