Embed Size (px)
Citation preview

110 111
R E G U L AT I O N O F Q UA L I T Y A N D C O N S U M E R S ’ R I G H T S
Q U A L I T Y R E G U L A T I O N I N T H E E L E C T R I C I T Y S E C T O R
The first regulatory period for commercial quality in the electricity sector, which began in
2000, came to an end in 2003. On this front, in 2003 the Authority for Electricity and Gas
worked mainly along two lines:
• quality of service regulation, in the context of preparations for regulatory period
2004—2007;
• quality of service monitoring, in the context of calculating continuity improve-
ments with respect to 2002.
E l e c t r i c i t y : q u a l i t y s t a n d a r d s
Continuity of service In 2003, the main continuity problems for end customers did not stem from interruptions
originating on the distribution grids, as they had in previous years, but from two high-impact
events: the planned outages that the transmission system operator (GRTN S.p.A.) demanded
of distributors on 26 June, when spiking demand exceeded available production capacity,
and the total blackout the night of 28 September. Thus, continuity of service worsened
markedly from 2002 to 2003. The September blackout, affecting more than 95 percent
of customers, and the planned outages in June, which struck about one customer in four,
entailed estimated average losses of 418 minutes and 24 minutes per customer, respectively.
The total length per customer of all sustained, unannounced interruptions—including the
blackout and the planned outages—rose from 130 minutes lost in 2002 to 567 minutes lost
in 2003 (see Figure 19 and Table 35).
Disregarding the events of 26 June and 28 September, continuity of service on the electricity
distribution grids continued to improve in 2003 thanks to the incentives established by the
Authority with Resolution 202 of 28 December 1999 (later incorporated into the Continuity
of Service Act approved with Resolution 155 of 1 August 2002). Counting only interrup-
tions relating to the distribution grids, continuity of service regulation led to a reduction
in the number and duration of outages per customer and to a narrowing of the continuity
gaps among regions for like concentrations of users. The improvements applied to both Enel
S.p.A. and most of the local distribution firms.
This progress was driven by a reduction in the basic indicator (total duration of sustained,
unannounced interruptions per low-voltage customer), the calculation of which excluded
the September blackout, the planned outages and also interruptions attributable to force
majeure or external causes and those originating on the high-voltage networks or the na-
tional transmission grid. This basic indicator, calculated annually, went from 175 minutes
lost in 1999 to 84 minutes lost in 2003, for an overall improvement of 52 percent during
regulatory period 2000—2003.

110 111
The number of interruptions per customer (Figure 20), including the blackout and planned
outages, was 4.12 in 2003, compared with 2.93 in 2002. Net of the June and September
crises the number of interruptions per customer was 2.89 this year.
One of the main goals of continuity of service regulation is to reduce interregional
gaps. At the macro-level, Figure 21 shows the gradual slimming of the disparity be-
tween North and South in terms of the total length of interruptions (excluding the
June and September crises only).
Fig. 19 DURATION OF INTERRUPTIONS PER LOW-VOLTAGE CUSTOMER
Minutes lost per customer; national average annual figures, Enel Distribuzione and local electric companies with more than 5 000 end customers
1998 1999 2000 2001 2002 2003
COMBINED DURATION OF ALL INTERRUPTIONS SUFFERED BY LV CUSTOMER (including the planned outages and September blackout)
COMBINED DURATION OF INTERRUPTIONS SUFFERED BY LV CUSTOMER (excluding planned outages and blackout)
COMBINED DURATION OF INTERRUPTIONS SUFFERED BY LV CUSTOMER (excluding planned outages, blackout, force majeure, external causes and interruptions originating on HV networks or national transmission grid)
0
100
200
300
400
500
600
228225
188175
157118
9884
209
130
124
567
171
Fig. 20 NUMBER OF SUSTAINED, UNANNOUNCED INTERRUPTIONS PER LOW-VOLTAGE CUSTOMER
National average annual figures, Enel Distribuzione and local electric companies with more than 5.000 end customers
1998 1999 2000 2001 2002 2003
NORTH
SOUTH
ITALY (including planned outages and blackout)
CENTRE
ITALY (excluding planned outages and blackout)
0
1
2
3
4
5
6
7
6.8
2.5
4.64.4
2.6
4.2
5.0
6.0
2.5
3.8
3.9
5.6
2.2
3.2
3.5
5.3
2.0
2.9
4.2 4.34.1
2.7
1.9

112 113
Fig. 19 DURATION OF INTERRUPTIONS PER LOW-VOLTAGE CUSTOMER
Minutes lost per customer; national average annual figures, Enel Distribuzione and local electric companies with more than 5 000 end customers
1998 1999 2000 2001 2002 2003
COMBINED DURATION OF ALL INTERRUPTIONS SUFFERED BY LV CUSTOMER (including the planned outages and September blackout)
COMBINED DURATION OF INTERRUPTIONS SUFFERED BY LV CUSTOMER (excluding planned outages and blackout)
COMBINED DURATION OF INTERRUPTIONS SUFFERED BY LV CUSTOMER (excluding planned outages, blackout, force majeure, external causes and interruptions originating on HV networks or national transmission grid)
0
100
200
300
400
500
600
228225
188175
157118
9884
209
130
124
567
171
Fig. 20 NUMBER OF SUSTAINED, UNANNOUNCED INTERRUPTIONS PER LOW-VOLTAGE CUSTOMER
National average annual figures, Enel Distribuzione and local electric companies with more than 5.000 end customers
1998 1999 2000 2001 2002 2003
NORTH
SOUTH
ITALY (including planned outages and blackout)
CENTRE
ITALY (excluding planned outages and blackout)
0
1
2
3
4
5
6
7
6.8
2.5
4.64.4
2.6
4.2
5.0
6.0
2.5
3.8
3.9
5.6
2.2
3.2
3.5
5.3
2.0
2.9
4.2 4.34.1
2.7
1.9
Fig. 21 DURATION OF INTERRUPTIONS PER LOW-VOLTAGE CUSTOMER, EXCLUDING PLANNED OUTAGES OF 26 JUNE AND BLACKOUT OF 28 SEPTEMBER 2003
National average annual figures, Enel Distribuzione and local electric companies with more than 5 000 end customers
1998 1999 2000 2001 2002 2003
NORTH SOUTH ITALYCENTRE
0
100
50
150
250
200
300
350
400
228
356
224214
225
376
115136 131
10392
111
80
96
124
201
195
130
291
328
209
171188
126
100
150
200
250
On its website the Authority provides an online query service for continuity of service data,
split by company, region, province and type of interruption.

112 113
Tab. 34 AVERAGE NUMBER OF INTERRUPTIONS PER LOW-VOLTAGE CUSTOMER BY REGION
Regional average annual figures, Enel Distribuzione and local electric companies with more than 5 000 end customers, excluding planned outages of 26 June and blackout of 28 September 2003
2002 2003
Piedmont 2.76 2.34
Valle d'Aosta 1.50 1.27
Liguria 2.79 2.18
Lombardy 1.63 1.63
Trentino Alto Adige 2.58 4.16
Veneto 2.08 1.73
Friuli Venezia Giulia 1.65 1.76
Emilia Romagna 1.53 1.95
Tuscany 2.79 2.57
Marches 2.28 2.16
Umbria 2.42 2.28
Lazio 3.27 2.98
Abruzzo 2.87 3.13
Molise 2.88 4.05
Campania 4.11 4.32
Puglia 3.93 3.22
Basilicata 3.82 4.68
Calabria 5.70 5.40
Sicily 4.42 4.74
Sardinia 4.06 4.93
NORTH 2.01 1.95
CENTRE 2.93 2.69
SOUTH 4.20 4.30
ITALY 2.93 2.89

114 115
Tab. 35 DURATION OF INTERRUPTIONS PER LOW-VOLTAGE CUSTOMER PER REGION
Regional average annual figures, Enel Distribuzione and local electric companies with more than 5 000 end customers, excluding planned outages of 26 June and blackout of 28 September 2003
Piedmont 102.68 147.48 62.66 101.80 24.08 176.29
Valle d'Aosta 37.25 62.05 59.58 71.43 4.81 189.13
Liguria 82.80 97.30 52.21 68.42 29.37 193.66
Lombardy 47.86 77.78 38.58 66.53 21.96 166.70
Trentino Alto Adige 50.58 130.51 86.24 223.62 20.67 208.10
Veneto 60.41 87.12 46.94 71.72 17.59 244.80
Friuli Venezia Giulia 54.22 76.37 58.66 115.02 16.50 198.45
Emilia Romagna 47.84 59.29 48.60 64.40 24.65 304.94
Tuscany 81.51 100.83 65.25 87.36 20.96 368.53
Marches 74.41 82.37 64.82 77.33 21.17 689.32
Umbria 62.53 75.57 54.13 75.27 18.42 636.48
Lazio 108.31 130.03 88.19 110.34 17.00 658.79
Abruzzo 96.28 105.42 133.78 164.82 24.29 737.32
Molise 85.04 92.20 122.63 256.14 20.10 677.60
Campania 140.67 159.44 139.06 191.14 23.69 621.51
Puglia 174.31 202.03 105.93 179.06 35.51 694.67
Basilicata 164.39 178.29 209.62 337.95 40.64 647.98
Calabria 190.36 212.38 137.25 196.34 22.37 438.27
Sicily 139.70 258.48 142.86 224.62 36.78 806.18
Sardinia 145.73 163.83 162.17 190.03 24.20 0.00
NORTH 62.64 91.56 49.44 80.47 22.22 208.96
CENTRE 91.82 110.40 75.16 96.02 18.94 564.58
SOUTH 149.43 194.51 136.75 201.50 29.73 619.78
ITALY 97.75 130.06 83.99 124.34 24.10 418.32
2002 2003
BLACKOUTNETCOMBINED DURATION
TOTALCOMBINED DURATION
NETCOMBINED DURATION
TOTALCOMBINED DURATION
PLANNED OUTAGES
Commercial quality The Authority’s commercial quality standards came into force on 1 July 2000. Their purpose

114 115
is twofold: to protect customers in the free and captive markets, and to foster an overall
improvement in the level of service provided by electricity distributors, metering companies
and vendors. The standards establish how quickly operators must address customers’ requests
(for hook-ups, connection of service, estimates, technical inspections, etc.) and respond to
their written complaints.
The national standards instituted by the Authority represent the minimum quality of service
that customers must be guaranteed. Companies can define their own standards only if they
are higher than or in addition to those imposed. By regulating commercial quality, the Au-
thority has put an end to the previous Charter of Service system, which had proved not to
protect customers’ rights enough for two reasons: because distributors set their own stand-
ards, usually with prudence as the rule of thumb and without regular updates, and because
refund systems usually required a direct request from the customer, according to procedures
that were ill publicized or otherwise discouraged action by customers entitled to a refund.
With the Authority’s institution of automatic refunds and new standards, many more refunds
are actually being paid to customers for substandard service than under the old Charter of
Service system (Table 36).
Tab. 36 CASES OF SUBSTANDARD SERVICE AND NUMBER OF REFUNDS PAID BY ELECTRIC COMPANIES
Enel Distribuzione and local electric companies with more than 5 000 end customers since 1 July 2000
Source: Operators’ declarations.’
CHARTER OF SERVICE COMMERCIAL QUALITY REGULATION
1997 1998 1999 2000 2001 2002 2003II SEM.
Cases of substandard service entitling customers to a refund
6 099 4 167 8 418 7 902 25 650 67 34461 881
21 54 22 4 771 12 437 52 229 79 072Refunds actually paid during the year
According to information submitted by operators, in 2003 about 79,000 refunds were paid,
with most of the increase on the previous year due to the fact that refunds were also paid
in 2003 for substandard service occurring in 2002. The number of instances of substandard
service is still rising slightly, a few years since the new regulations were implemented in full.
The failure rate for guaranteed standards of service is still lower than 5 percent, and in some
cases (service restoration after late bill payment; disconnection) it does not reach 2 percent.
The amount of the automatic refunds differs by type of contract (residential or business); it

116 117
doubles if not paid within three months, and quintuples if six months elapse. An analysis of
refunds paid by type of contract shows that in 2003, electric companies in general did not
manage to pay up by the three month deadline, since the average refund paid was higher
than the amount due in the event of settlement within three months.
For some services, the Authority has decided not to set guaranteed standards associ-
ated with automatic refunds. For these, it has established general standards that allow
it to monitor progress in quality of service. Most of the goals set with these standards
have been met, but in 2003, the goals for billing adjustments and requests for voltage
checks were not (Figure 22)
.
FIG.. 22 RATE OF COMPLIANCE WITH GENERAL STANDARDS OF SERVICE IN 2003
Enel Distribuzione and local electric companies with more than 5 000 end customers
65%
70%
80%
85%
90%
95%
75%
100%
Standard set by Authority
Source: Operators’ declarations.
Punctuality at appointments for simple job
estimates (standard: 90% within announced
three-hour range)
Estimate for complex technical work (standard: 85% in 40 days)
Execution of complex technical work (standard: 85% in 60 days)
Billing adjustments (standard:
90% in 15 days)
Meter inspection (standard:
90% in 10 days)
Voltage check
(standard: 90% in 10 days)
Reply to complaints (standard:
90% in 20 days)
The Authority calculates the average actual time for the rendering of all services subject to
guaranteed or general standards. Many of these were performed in 2003 in about two thirds
of the maximum time permitted; billing adjustments and voltage checks, however, took
longer than allowed (Figure 23).

116 117
Fig. 23 COMPARISON OF ACTUAL AVERAGE TIME AND GENERAL QUALITY STANDARDS FOR ALL SERVICES RENDERED TO LOW-VOLTAGE CUSTOMERS
2003; Enel Distribuzione and local electric companies with more than 5 000 end customers
0 10 20 30 40 50 60working days
Source: Operators’ declarations.
DEADLINE (standard for LV customers)
ACTUAL AVERAGE TIME, 2003 (LV customers)
Reply to complaints
Voltage check
Meter inspection
Billing adjustments
Execution of complex technical work
Estimate for complex technical work
Disconnection of service
Connection of service
Execution of simple technical work
Estimate for simple technical work
E l e c t r i c i t y : q u a l i t y i n c e n t i v e s a n d p e n a l t i e s
The Authority focused its quality control activities on continuity of service and on the defini-
tion of applicable incentives and penalties. A cornerstone of the regulation of service qual-
ity is the payment of benefits to distributors that achieve quality improvements above and
beyond their targets, and the charging of fines to those that fail to improve as they should.
Neither penalties nor benefits apply to distributors whose actual degree of continuity over a
two-year period is within 5 percent of the target.
On the basis of its inspections, the Authority issued Resolution 140 of 4 December 2003,
which authorized the payment of benefits totalling 104 million for 183 catchment areas
(out of 312) that outdid their quality targets in 2002 (the 104 million is net of 32 million
in penalties, charged to 57 areas where quality was worse than targeted), as well as 10.4
million in benefits for 26 catchment areas where actual quality in 2002 was the same as or
better than the national standard of reference.
Resolution 140 also granted preliminary approval to the requests submitted for 2003 by 12 dis-
tributors whose actual continuity level in 2002 was equal to or better than the national standard
of reference. Before the requests for 2003 were definitively approved, the companies had to keep
their continuity levels at or better than the national standard for all 12 months of the year.
118 119
The impact on tariffs of the 115 million for quality improvements in 2003 was absorbed by
the fund for continuity of service gains, which is run by the Electricity Equalization Fund
and financed by the portion of 2003 tariffs dedicated to improvements in continuity, as per
Resolution 152 of 1 August 2002.
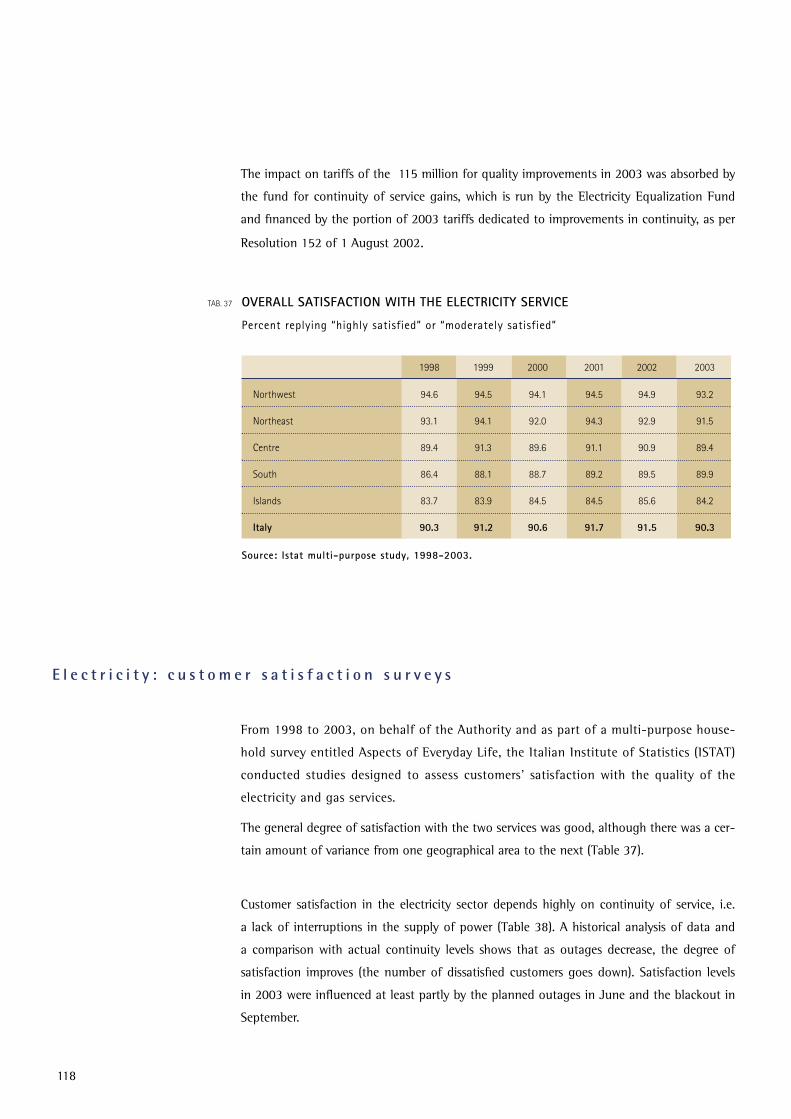
TAB. 37 OVERALL SATISFACTION WITH THE ELECTRICITY SERVICE
Percent replying “highly satisfied” or “moderately satisfied”
Northwest 94.6 94.5 94.1 94.5 94.9 93.2
Northeast 93.1 94.1 92.0 94.3 92.9 91.5
Centre 89.4 91.3 89.6 91.1 90.9 89.4
South 86.4 88.1 88.7 89.2 89.5 89.9
Islands 83.7 83.9 84.5 84.5 85.6 84.2
Italy 90.3 91.2 90.6 91.7 91.5 90.3
1998 1999 2000 2001 2002 2003
Source: Istat multi-purpose study, 1998-2003.
E l e c t r i c i t y : c u s t o m e r s a t i s f a c t i o n s u r v e y s
From 1998 to 2003, on behalf of the Authority and as part of a multi-purpose house-
hold survey entitled Aspects of Everyday Life, the Italian Institute of Statistics (ISTAT)
conducted studies designed to assess customers’ satisfaction with the quality of the
electricity and gas services.
The general degree of satisfaction with the two services was good, although there was a cer-
tain amount of variance from one geographical area to the next (Table 37).
Customer satisfaction in the electricity sector depends highly on continuity of service, i.e.
a lack of interruptions in the supply of power (Table 38). A historical analysis of data and
a comparison with actual continuity levels shows that as outages decrease, the degree of
satisfaction improves (the number of dissatisfied customers goes down). Satisfaction levels
in 2003 were influenced at least partly by the planned outages in June and the blackout in
September.

118 119
TAB. 38 SATISFACTION WITH CONTINUITY OF THE ELECTRIC SERVICE Percent replying “highly satisfied” or “moderately satisfied”
Northwest
95.4 95.4 95.1 94.5 95.6 94.1
Northeast
94.2 94.8 93.9 95.8 95.0 93.1
Centre 89.5 90.6 89.0 91.9 91.7 89.9
South
85.9 87.5 88.3 88.5 89.2 89.6
Islands
85.0 83.1 85.8 85.9 88.4 86.4
Italy
90.8 91.1 91.2 92.0 92.5 91.1
1998 1999 2000 2001 2002 2003
Source: Istat multi-purpose study, 1998-2003.
R e g u l a t i n g t e r m s o f s e r v i c e i n t h e e l e c t r i c i t y s e c t o r : r e g u l a t o r y p e r i o d 2 0 0 4 - 2 0 0 7
In 2003 the Authority began the process of defining commercial quality regulations for the
second regulatory period. The process was completed with the adoption of Resolution 4 of
30 January 2004, which approved the consolidated provisions of the Authority for Electric-
ity and Gas regarding quality of service in electricity distribution, metering and vending for
regulatory period 2004—2007.
Continuity of service The resolution is aimed at confirming and reinforcing the current rules on the duration of
interruptions, at a time when many local continuity of service levels are still far from the
national average and that average itself is still behind with respect to the major countries
of the European Union. As before, the duration of interruptions is regulated according to
annual targets set by the Authority and the subsequent verification of the results obtained
by distributors, so as to pay out benefits to overachievers and charge penalties to those who
fail to meet their targets. To accelerate improvement in the areas where service is worst, the
Authority has changed its method of calculating target levels, now requiring all high-, me-
dium- and low-density catchment areas to reach the same standards of quality (known as
“target levels”) within three regulatory periods. It has also adjusted the system for calculating
incentives due to distributors whose targets are surpassed, making it consistent with custom-
ers’ willingness to pay and especially attractive with regard to investments carried out in the
economically underdeveloped parts of the country.

120 121
The Authority has proposed that the duration of interruptions due to damage caused by
third parties be regulated on an optional basis, starting in 2005. In addition to further im-
proving continuity of service, this could lead to a more rapid convergence toward the targets
laid down in the resolution.
The regulation of blackout duration has been accompanied by new rules on the maximum
number of interruptions for larger customers. These serve a dual purpose: to protect the
worst served customers, through a system of automatic refunds in the event of substandard
service (Table 39), and to encourage distributors to invest in ways of reducing the number
of interruptions, which they might not do if regulations concerned the duration of blackouts
only. The Authority now identifies the approximately 10 percent of customers in Italy that
suffer a higher-than-standard number of interruptions, regardless of their voltage or con-
tracted power, most of whom are in Southern Italy. Regulation of the number of interrup-
tions, a first in Europe, will take effect in 2006 for high-voltage customers and medium-volt-
age customers with available power of more than 500 kW, and will gradually be extended to
all users supplied with medium voltage. The main expected benefit is a substantial decrease
in the number of interruptions suffered by larger customers and thus a smaller number of
clients qualifying for the status of “worst-served”.
TAB 39
GUARANTEED CONTINUITY STANDARDS FOR LARGER CUSTOMERS
High-voltage customers
1
Medium-voltage customers in densely populated zones
3
Medium-voltage customers in moderately populated zones
4
Medium-voltage customers in sparsely populated zones
5
TYPE OF LARGER CUSTOMER
MAX. NO. OF SUSTAINED INTERRUPTIONS PER YEAR (A)
(A) Excluding announced interruptions, interruptions originating on the national transmission network, blackouts, planned outages, interruptions caused by force majeure or third parties, and those originating on the high-voltage grid serving medium-voltage customers.
One effect of the gradual liberalization of the electricity market is that customers are increas-
ingly sensitive to quality of service. So that customers can express their needs, market initia-
tives known as quality contracts have been developed allowing electricity distributors and
their largest customers to officialize quality standards that are better than those mandated
by the Authority. Quality contracts can also be extended to quality of voltage parameters as
defined in EN50160, which are presently not regulated at all.

120 121
Commercial quality The Authority has bolstered the protection of consumers’ rights by introducing new com-
mercial quality standards, and has also instituted rules aimed at simplifying and streamlining
the regulation of quality of service.
With regard to consumers’ rights, commercial quality regulation has been extended to utili-
ties with 1,000 to 5,000 end customers. The standard for the correction of billing errors has
been adjusted, since as originally conceived, the electric company could refuse to return
undue sums paid by their customers without compromising their quality standing. A new
standard concerns the deadline by which service has to be restored after being cut off due
to meter failure. Every year, in fact, individual customers suffer more than 100,000 interrup-
tions of this kind, which are excluded from the power companies’ continuity of service rat-
ings. Service for medium-voltage customers must be activated within a standard of five days,
rather than 10. The quality of call-centre service is currently being monitored with a view to
introducing new quality standards and thus providing better treatment of customers.
As for the simplification and streamlining of commercial quality regulation, utilities with
fewer than 1,000 end customers have been exonerated from regulation as the cost of
compliance would exceed the benefits. There is now a simplified procedure for estimating
and performing jobs whose costs are pre-established in the current regulations on hook-up
TAB. 40 ELECTRICITY DISTRIBUTION, METERING AND VENDING SERVICES REGULATED BY GUARANTEED QUALITY STANDARDS DURING REGULATORY PERIOD 2004—2007
Deadlines for low-voltage customers
SERVICE METERING SALE
DISTRIBUTION
Provision of estimates forwork on low-voltage network 20 working days
Execution of simple technical work 15 working days
Connection of service 5 working days
Disconnection at customer’s request 5 working days
Restoration of service after late bill payment 1 weekday
Arrival at appointments withrequesting parties
Within specified 3-hour range
Restoration of service after meter failure3 hours 4 hours
(A)
90 calendar days
(B)
Billing adjustments
(A) Requests received on business days between 8 a.m. and 6 p.m.(B) Requests received on weekends/holidays or on business days between 6 p.m. and 8 a.m.
TAB. 41
ELECTRICITY DISTRIBUTION, METERING AND VENDING SERVICES REGULATED BY OVERALL QUALITY STANDARDS DURING REGULATORY PERIOD 2004—2007
Minimum percentage of requests to be satisfied within stated deadline (low-voltage customers)
SERVICE DISTRIBUTION
METERING SALE
Execution of complex technical work 85% within 60 business days
90% within10 business days
90% within 20 business days
90% within 20 business days
90% within 20 business days
95% withinonce a year
90% within10 business days
Voltage check
Comprehensive reply to complaints and written queries
Frequency of meter readingand self-reading per end customer
Meter inspections
Quality of call-centre service Monitoring in
effect since firsthalf of 2004

122 123
charges. Also simplified are the rules on punctuality at appointments which, for the pe-
riod2000—2003, concerned only “customized appointments” between the electric company
and the customer or other party requiring service. These are appointments made at the
request of individual customers who, for their own reasons, need the work completed by a
later deadline than that set by the Authority’s guaranteed standards.
TAB. 40 ELECTRICITY DISTRIBUTION, METERING AND VENDING SERVICES REGULATED BY GUARANTEED QUALITY STANDARDS DURING REGULATORY PERIOD 2004—2007
Deadlines for low-voltage customers
SERVICE METERING SALE
DISTRIBUTION
Provision of estimates forwork on low-voltage network 20 working days
Execution of simple technical work 15 working days
Connection of service 5 working days
Disconnection at customer’s request 5 working days
Restoration of service after late bill payment 1 weekday
Arrival at appointments withrequesting parties
Within specified 3-hour range
Restoration of service after meter failure3 hours 4 hours
(A)
90 calendar days
(B)
Billing adjustments
(A) Requests received on business days between 8 a.m. and 6 p.m.(B) Requests received on weekends/holidays or on business days between 6 p.m. and 8 a.m.
TAB. 41
ELECTRICITY DISTRIBUTION, METERING AND VENDING SERVICES REGULATED BY OVERALL QUALITY STANDARDS DURING REGULATORY PERIOD 2004—2007
Minimum percentage of requests to be satisfied within stated deadline (low-voltage customers)
SERVICE DISTRIBUTION
METERING SALE
Execution of complex technical work 85% within 60 business days
90% within10 business days
90% within 20 business days
90% within 20 business days
90% within 20 business days
95% withinonce a year
90% within10 business days
Voltage check
Comprehensive reply to complaints and written queries
Frequency of meter readingand self-reading per end customer
Meter inspections
Quality of call-centre service Monitoring in
effect since firsthalf of 2004
Services have been divided into electricity distribution, metering and sale to take account of
the separation of those businesses in keeping with the gradual liberalization of the markets
(Tables 40 and 41).
The automatic refunds due to customers for the failure to meet guaranteed standards have
been updated as follows: 30 for low-voltage customers for residential use; 60 for low-volt-
age customers for non-residential use; and 120 for medium-voltage customers.
Lastly, the Authority has ruled that if electric companies receive requests from wholesale
customers on behalf of end users in the free market, they must pay the automatic refunds
to the wholesaler.

122 123
Q U A L I T Y R E G U L A T I O N I N T H E G A S S E C T O R
In 2003 the Authority continued to evaluate the gas service provided to end customers and
to assess how well utilities have implemented its rulings on commercial quality (Resolution
47 of 2 March 2000) and on the safety and continuity of natural gas distribution (Resolution
236 of 28 December 2000).
Regulatory efforts were focused mainly on new safety regulations applicable downstream
from the delivery point: Resolution 152 of 12 December 2003 on insurance for household
customers receiving gas over local pipelines, and Resolution 40 of 18 March 2004 on safety
inspections of users’ gas installations.
During the year the Authority also stayed in contact with the energy standards agencies and
technical associations, with a view to completing the Guidelines that need to be published
before Resolution 236/00 can be fully implemented.
The Authority feels that the regulation of service quality in the gas sector has been generally
successful and produced overall benefits for end customers. Specifically, the definition of
mandatory safety and continuity guaranteed standards for distributors and the institution of
automatic customer refunds for substandard service have been quite effective indeed.
The main results of quality of service regulation in the gas sector are discussed below in the
section on safety regulation downstream from the delivery point.
G a s : q u a l i t y s t a n d a r d s
Safety and continuity
of service
Safety in the gas sector refers to the protection of people and property from injury or dam-
age due to explosions, bursts and fires caused by distributed gas. Key safety features include
the artificial odourization of gas so that its presence in the air can be detected; the reduction
of gas leaks through the inspection of distribution networks and the cathode protection of
steel pipes; and the establishment of an emergency response service.
Continuity of service is defined as a lack of interruptions in the supply of gas to customers.
Ideally, gas should be provided continually, since interruptions in the service not only damage
customers’ interests and inconvenience them, but also expose them to risks when the service
is restored. However, it is not technically possible to eliminate interruptions altogether.
With Resolution 236/00, the Authority established guaranteed and overall standards—as
well as service, registration and notification duties—for the safety and continuity of the gas
distribution service. Within this system of obligations and controls, national minimums have
been set for each of the relevant indicators.

124 125
The Authority has chosen the individual distribution system as the catchment area for meas-
uring safety and continuity. The publication, in comparative form, of individual distributors’
safety and continuity data encourages distributors to strive for excellence.
The safety and continuity regulations for the gas distribution service require each distributor
to define operating procedures for the handling of emergencies (malfunction of power sup-
ply sub-stations or entire stretches of medium- or low-pressure network, etc.) and incidents
caused by the use of distributed gas. Distributors are required to inform the Comitato Italiano
Gas (Italian Gas Committee – CIG) of each emergency or incident in which they have been
involved.
The new regulations have been phased in gradually, as follows:
• for all distributors, the obligation to provide emergency intervention including in re-
sponse to calls reporting gas leaks in customers’ installations took effect in 2001;
• all distributors with more than 5,000 users (and each plant they manage with more than
1,000 users connected):
– were required to have an updated floor plan by 1 July 2001;
– have had to comply with all of the Authority’s new safety and continuity regulations
since 1 January 2002.
Information on the technical quality of the service that supplies gas for civil use by way of
urban networks is collected by the Authority each year, from the gas utilities themselves, and
published on the Authority’s Web site.
Since 2003, utilities with more than 5,000 connected customers have been required to sub-
mit data on the safety and continuity of the gas distribution service to the Authority by 31
March of each year. Utilities with up to 5,000 connected customers must only report data
on emergency calls received. The Authority, to make it faster for the utilities to submit data
and easier for it to perform its supervisory function, has set up a system for the electronic
transmission of data and the direct, on-line accrediting of each utility.
On the basis of data submitted by the utilities for 2002 and 2003, we can conclude that
Resolution 236/00 has produced the following benefits:
• a significant increase in the number of networks subject to scheduled inspections, and
distributors’ more widespread use of a particular leakage location system on the occasion
of both inspections and emergency calls;
• distributors who are more sensitive to odourization control and to monitoring the state
of cathode protection on steel pipes;
• the definition of new emergency response obligations and, more generally, a recognition

124 125
of the importance of that service as the foundation of all efforts to promote safety in gas
distribution;
• continuity of service measurement;
• in general, the definition of national guidelines for the fair and uniform implementation
of the principal safety measures.
Completion of standards
and guidelines
nother priority in 2003 was to complete the guidelines for activities related to safety and
continuity of service. Taking initiative from the Authority, the CIG, the Association for Pro-
tection from Electrolytic Corrosion (APCE) and the Italian Technical Gas Association (ATIG)
drew up the Guidelines necessary for implementing Resolution 236/00, in accordance with
Art. 28 thereof.
The Guidelines explain how the industry must carry out the activities regulated by the resolu-
tion on the aspects of gas safety and continuity of service that are not covered or sufficiently
regulated by national or European technical standards. The Guidelines will be reviewed and up-
dated periodically to take account of technical advances and regulatory changes in the field.
Commercial quality The Authority’s commercial quality standards came into force on 1 January 2001. Their
purpose is twofold: to protect end customers and to foster an overall improvement in the
level of service provided by gas distributors and vendors. The standards establish how quickly
operators must respond to requests from customers or from other parties requesting services
on their behalf (such as a vendor that sells gas to a distributor). The commercial quality reso-
lution also regulates punctuality in connection with user-requested appointments, giving
customers a choice between prompt standard fulfilment of their requests and on-time arrival
at the appointments they make with the utility for the performance of certain tasks.
The Authority has introduced automatic penalties for utilities that fail to meet guaranteed
standards of service, as well as overall standards and registration and notification duties that
differ according to the utility’s size.
By regulating commercial quality, the Authority has put an end to the previous Charter of
Service system, which had proved not to protect customers’ rights enough for two reasons:
because distributors set their own standards, usually with prudence as the rule of thumb and
without regular updates, and because refund systems usually required a direct request from
the customer, according to procedures that were ill publicized or otherwise discouraged ac-
tion by customers entitled to a refund.

126 127
The national standards instituted by the Authority represent the minimum commercial qual-
ity that customers must be guaranteed. Companies can define their own standards only if
they are higher than or in addition to those imposed.
With the Authority’s institution of guaranteed standards and automatic refunds, many more
refunds are actually being paid to customers for substandard service than under the old
Charter of Service system (Table 42).
TAB. 42 CASES OF SUBSTANDARD SERVICE IN COMMERCIAL QUALITY AND NUMBER OF REFUNDS PAID BY GAS COMPANIES
Operators with more than 5 000 end customers
Cases of substandard serviceentitling customers to a refund
14 265 12 366 11 212 14 635 16 424 14 651 11 766
Refunds actually paid during the year
1 237 707 1 640 3 709 12 086 13 368 8 535
CHARTER OF SERVICE AUTHORITY RESOLUTION 47/00
1997 1998 1999 2000 2001 2002 2003
Source: Operators’ declarations.
The number of requests for services subject to guaranteed standards tops 1.5 million per
year, far exceeding the number of requests for services to which general standards apply. The
most frequent request is for connection of service, which alone amounts to nearly 40 percent
of the total. Almost all requests came from customers with meters up to class G6 (residential
users), who thus constitute the category best protected by these regulations.
A comparison between 2003 figures and those from 1997, when the Charter of Service sys-
tem was in effect, shows that certain services are now being performed much faster, in par-
ticular the execution of technical work. A precise quantification is only possible since 2001,
however, when Resolution 47/00 came into force. Figures from 2001 to 2003 demonstrate
a clear improvement in the amount of time taken to render services subject to guaranteed
standards: the number of instances of substandard service decreased despite an increase in
services requested (Figure 24).
For some services, the Authority has decided not to set guaranteed standards associated with
automatic refunds. For these, it has established overall standards that allow it to monitor
progress in commercial quality. Most of the goals set with these standards have been met for
all categories of service. The Authority monitors the actual amount of time taken to provide
all services subject to guaranteed or overall standards. On average, services subject to guar-
anteed standards are performed in half the amount of time allowed by the Authority. For the
estimation and execution of technical work, the gap is even wider (Figure 25).

126 127
FIG. 25 AVERAGE ACTUAL TIME COMPARED WITH AUTHORITY’S COMMERCIAL QUALITY STANDARDS FOR CUSTOMERS WITH METERS UP TO G6
Operators with more than 5 000 end customers
0 2.0
20.9
5
5
4.0 6.0 8.0 10.0 12.0 14.0 16.0
Restoration of service after late bill payment
Disconnection of service
Execution of simple technical work
Estimate for simple technical work
2.2
2.2
6.6
5.4
15
15
Source: Operators' declaration.
AUTHORITY’S STANDARD (days) AVERAGE ACTUAL TIME (days)
Connection of service
FIG. 24 SERVICES SUBJECT TO AUTOMATIC REFUNDS IN 2002—2003
Operators with more than 5 000 end customers
0
100 000
200 000
300 000
400 000
500 000
600 000
Estimate for simple
technical work
Executionof simple
technical work
Connection of service
Disconnection of service
Restoration of service after
late bill payment
Punctuality at customized
appointments
1.5 %
1.0 %
0.5 %
0.0 %
1.7 %
2.3 %
1.8 %
0.6 %
0.5 %0.5 %
0.8 %
0.3 %
0.2 %
0.4 %
0.9 %
Source: Operators’ declarations.
No. of requests in 2002 No. of requests in 2003
Average noncompliance in 2002 (%)
Average noncompliance in 2003 (%)

128 129
G a s : c u s t o m e r s a t i s f a c t i o n s u r v e y s
From 1998 to 2003, on behalf of the Authority and as part of a multi-purpose household
survey entitled Aspects of Everyday Life, the Italian Institute of Statistics (ISTAT) conducted
studies designed to assess customers’ satisfaction with the quality of services in the electric-
ity and gas sectors.
The general degree of satisfaction with the gas service was good, although there was a cer-
tain amount of variance from one geographical area to the next (Table 43).
Less significant is the historical progression of figures concerning customers’ satisfaction
with safety levels. In the gas sector, it is difficult for consumers to have an accurate percep-
tion of safety, which can only be assessed with a degree of technical knowledge uncommon
among the general public.
TAB. 43 OVERALL SATISFACTION WITH THE GAS SERVICE
Percent replying “highly satisfied” or “moderately satisfied”
Northwest
95.0 95.0 94.6 94.7 95.5 95.1
Northeast
94.5 94.7 94.5 94.7 93.1 94.7
Centre
94.5 95.7 95.1 93.7 95.1 94.4
South
94.5 95.1 95.2 95.1 94.0 94.8
Islands
89.8 95.6 95.0 96.6 94.4 93.5
Italy
94.5 95.2 94.8 94.6 94.6 94.7
1998 1999 2000 2001 2002 2003
Source: Istat multi-purpose study. 1998-2003.
R e g u l a t i o n o f s a f e t y p o s t - d e l i v e r y
Insurance for
household users
For end customers supplied with gas for domestic use, it is important that there be insurance
coverage against injury, fire and liability in connection with gas-related accidents.
With Resolution 152/03, the Authority instituted mandatory minimum insurance for injury
and fire caused by the household use of gas. Such a system had already been in place, on
a voluntary basis, since 1991 and was due to expire on 31 December 2003. The resolution
defined the content of insurance coverage, extending it to customers using network-distrib-
uted gas other than methane, such as LPG. The policy covers all civil end customers

128 129
supplied via a distribution network (thus excluding gas purchased in cylinders) and all
of their installations for domestic or other use.
The cost, charged to consumers in their gas bills, is unchanged at 40 eurocents per
year. With the gas market now liberalized, vendors can offer their customers better or
additional terms (e.g. higher maximum payouts) without prejudice to the minimum
coverage required by the Authority.
The new system will come into force on 1 October 2004 and the validity of the old one
has been extended until that date.
Rules for assuring the
safety of users’ gas
installations
Resolution 40/04 institutes new rules and procedures for assuring the safety of users’ gas in-
stallations. It applies to installations receiving all kinds of gas distributed via networks (mostly
methane, but also LPG). The aim of the resolution is to achieve as safe a gas service as pos-
sible, since although accidents caused directly by the malfunctioning of user installations have
fallen steadily since 1995, they are still frequent enough to warrant close surveillance.
During the first phase of implementation, i.e. over the next five years, the installations of more
than six million households will be checked for proper mounting and functioning through the
examination of documents filled in by installers on the basis of applicable laws. Information
that is already available will be given due credit and unnecessary paperwork will be avoided.
In some cases (roughly 0.5 percent of the total), the paperwork analysis will be followed up
by physical on-site inspections, although these will not duplicate the inspections already
provided for by current standards. By regulation, these, too, will be performed by the mu-
nicipalities, which along with the provinces are already invested by law with similar tasks. The
regulations state that municipalities will be paid for a maximum of 5 percent of the on-site
inspections they perform on installations that have already been inspected by the distributor.
The Authority has put distributors in charge of examining the paperwork.
Resolution 40/04 will be phased in gradually so that all parties will have time to pre-
pare. As such, new hookups will be subject to inspection as from 1 October 2004; re-
activated and modified installations as from 1 October 2005; and all systems in service
as from 1 October 2006.
The cost of examining paperwork for modified and in-service installations and
of the inspections performed by municipalities will be covered as part of the gas
distribution tariff, starting in 2006, for a maximum charge to end users of just
over 2 euros per year.
Each year, the Authority will publish a report on the state of implementation of the
new rules, including the number and results of paperwork checks and on-site inspec-
tions performed.
130 131
P R O T E C T I O N O F G A S A N D E L E C T R I C I T Y C O N S U M E R S ’ R I G H T S
Examination
of complaints,
queriesand comments
In 2003 the Authority continued to examine a growing number of complaints, queries and
comments from both individuals and consumers’ associations.
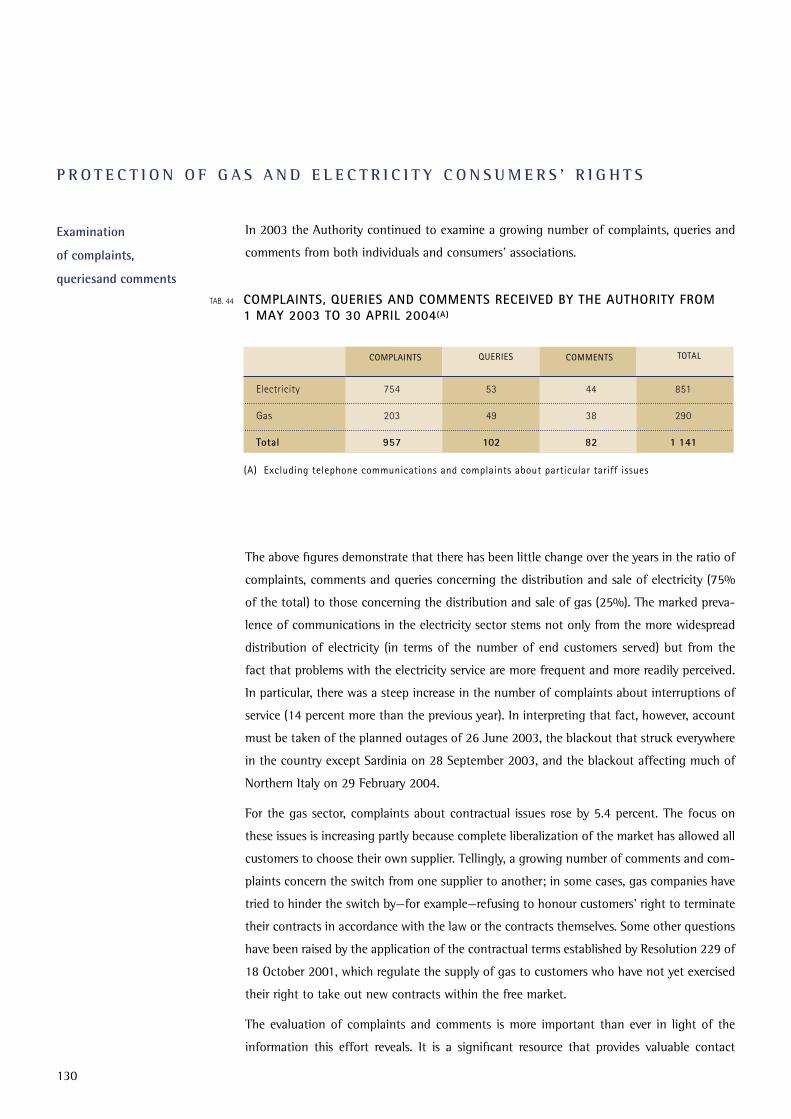
TAB. 44 COMPLAINTS, QUERIES AND COMMENTS RECEIVED BY THE AUTHORITY FROM 1 MAY 2003 TO 30 APRIL 2004(A)
Electricity
754 53 44 851
Gas 203 49 38 290
Total 957 102 82 1 141
COMPLAINTS
TOTALQUERIES
(A) Excluding telephone communications and complaints about particular tariff issues
COMMENTS
The above figures demonstrate that there has been little change over the years in the ratio of
complaints, comments and queries concerning the distribution and sale of electricity (75%
of the total) to those concerning the distribution and sale of gas (25%). The marked preva-
lence of communications in the electricity sector stems not only from the more widespread
distribution of electricity (in terms of the number of end customers served) but from the
fact that problems with the electricity service are more frequent and more readily perceived.
In particular, there was a steep increase in the number of complaints about interruptions of
service (14 percent more than the previous year). In interpreting that fact, however, account
must be taken of the planned outages of 26 June 2003, the blackout that struck everywhere
in the country except Sardinia on 28 September 2003, and the blackout affecting much of
Northern Italy on 29 February 2004.
For the gas sector, complaints about contractual issues rose by 5.4 percent. The focus on
these issues is increasing partly because complete liberalization of the market has allowed all
customers to choose their own supplier. Tellingly, a growing number of comments and com-
plaints concern the switch from one supplier to another; in some cases, gas companies have
tried to hinder the switch by—for example—refusing to honour customers’ right to terminate
their contracts in accordance with the law or the contracts themselves. Some other questions
have been raised by the application of the contractual terms established by Resolution 229 of
18 October 2001, which regulate the supply of gas to customers who have not yet exercised
their right to take out new contracts within the free market.
The evaluation of complaints and comments is more important than ever in light of the
information this effort reveals. It is a significant resource that provides valuable contact

130 131
with the market and its real mechanisms, providing the proper basis for the Authority
to orient its regulatory and supervisory functions in a manner that best responds to
existing needs and problems.
TAB. 45 MAIN ISSUES ADDRESSED BY COMPLAINTS. COMMENTS AND QUERIES RECEIVED BY THE AUTHORITY FROM 1 MAY 2003 TO 30 APRIL 2004
ISSUE ADDRESSED TOTAL CASES (NUMBER) TOTAL CASES (%)
ELECTRICITY
Interruptions 375 44.0
Hook-ups 107 12.6
Billing procedures 103 12.1
Contracts 92 10.8
Voltage 48 5.6
Quality of service (commercial and technical) 30 3.5
Meters 25 2.9
Tariffs 21 2.6
Bills 12 1.4
Other 38 4.5
GAS
Contracts 97 33.4
Billing procedures 72 24.8
Hook-ups 48 16.5
Bills 15 5.2
Quality of service (commercial and technical) 11 3.8
Tariffs 8 2.8
Meters 8 2.8
Other 31 10.7
Information One of the Authority’s key responsibilities is to make sure gas and electricity consumers are
kept properly and thoroughly informed. Generally speaking, the need for information is
amplified by the rapidity of the liberalization process and the changes that inevitably follow,
including in terms of new possibilities for the consumer.

132 133
Of the Authority’s various efforts to promote better informed consumers, one activity of
note is the publication, on its website, of writeups providing basic explanations of the most
significant changes in the electricity and natural gas markets.
The website also describes the procedures for making a complaint to the Authority.
Relations with consumers’
associations; Protocol of
understanding with the CNCU
In the context of the working relationships that the Authority maintains with consumers’
associations, in October 2001 it entered into a protocol of understanding with the National
Council of Consumers and Users (CNCU) aimed at developing ways of keeping gas and elec-
tricity customers informed, especially with regard to market liberalization.
One of the aims specified in the protocol was to make sure consumers’ associations were
equipped to provide effective, thorough support and information to all consumers who seek
their help in person or by phone. So many people were interested in this sort of training that
the course had to be organized in stages, in a “top-down” configuration. Thus, the first stage
was addressed to consumer association staffers who would then pass on the material learned
to all other interested parties, through the organization of local training sessions. The first
stage consisted of two courses, one in Bologna in July and the other in Caserta in September,
attended by delegates from the consumers’ associations.
This project bears witness to the Authority’s growing concern for consumers’ associations,
which it involves as extensively as possible in the consultation process, the evaluation of
proposals and measures affecting consumers’ rights, the promotion of initiatives entailing
study, research and dialogue into consumer problems, and informational campaigns. The
Authority is also making a greater effort than ever to profit from the associations’ experience
in their individual sectors.
In early 2004, the Authority and the CNCU looked into the development of an ongoing e-
learning programme that would keep operators up-to-date and enhance interaction between
the Authority and the consumers’ associations on the issue of information and training.
Code of conduct
for the sale of natural
gas to consumers
The complete liberalization of the gas market has raised the need to bolster protection of the
end customer, who must be able to make informed selections from the range of contracts
available on the market.
One of the means the Authority has identified in pursuit of that goal is the Commercial
Code of Conduct for the Sale of Gas, whose adoption was already provided for by Art. 18 of
Legislative Decree 164 of 23 May 2000. Therefore, in July 2003, the Authority launched the
consultation process for code of conduct proposals. The purpose of such a tool is to make

132 133
sure the promotion of commercial offers in relation to the sale of gas to consumers is subject
to uniform rules of conduct that will ensure such offers are fair and transparent. The reason
why this is a top priority is that the liberalized gas market is tending toward an increasingly
elaborate range of contracts being marketed to consumers, who need to be able to evaluate
and compare the offers and make as informed a decision as possible.
Once the new code of conduct is in place for vendors, the distributors’ code of conduct—in-
troduced by Resolution 237 of 28 December 2000—will be repealed. During the transition
phase entailing the separation of the vending and distribution businesses and full liberaliza-
tion of sales, that earlier code had made distributors responsible for informing and assisting
customers with regard to basic and special tariff options for distribution.
Out-of-court conflict
resolution: conciliation
According to Law 481 of 14 November 1995, one of the Authority’s tasks is to arrange
for conciliation procedures on the basis of regulations issued by the prime minister, in the
interests of swift and effective out-of-court conflict resolution. These procedures can help
reduce conflict between customers and gas and electric utilities. Conciliation in particular is
a flexible tool, since the parties work actively toward a solution either directly or through a
third party. It can thus help the parties establish a very important dialogue in cases where
the conflict lies within a contractual relationship that will not necessarily be terminated as a
result of the dispute.
In the development of initiatives that can offer real opportunities for out-of-court conflict
resolution, a key role is played by the utilities, whose willingness to sit down at a table to
attempt to solve customer disputes is fundamental to the initiative’s success—just as it is in
other sectors. In order to raise the utilities’ awareness, inform them of the available proce-
dures and ensure the proper training of conciliators and of any personnel in charge of the
more technical aspects of the process, the Authority has urged all interested parties, includ-
ing through specific encounters, to gain experience with alternative conflict resolution.
134 135
E N E R G Y E F F I C I E N C Y A N D C O N S E R V A T I O N
G u i d e l i n e s f o r c o n s e r v a t i o n p r o j e c t s a n d c o n s u l t a t i o n s w i t h t h e r e -
g i o n s a n d s e l f - g o v e r n i n g p r o v i n c e s
Resolution 28 of 1 April 2003 is entitled “Draft guidelines for the design, execution and
evaluation of projects as per Art. 5, par. 1 of the Ministerial Decrees of 24 April 2001 and
for the determination of criteria and procedures for earning energy efficiency certificates as
per Art. 10 of said decrees”. With its approval, the guidelines were sent to the regions and
self-governing provinces for their comments and opinions in accordance with Article 5, para-
graph 5 of the aforementioned Ministerial Decrees.
On 16 July 2003, the Conference of Presidents of the Regions and Self-Governing Provinces
submitted its comments and recommendations. Taking these into account, on 18 September
2003 the Authority passed Resolution 103, “Guidelines for the design, execution and evalu-
ation of projects as per Art. 5, par. 1 of the Ministerial Decrees of 24 April 2001 and for the
determination of criteria and procedures for earning energy efficiency certificates”.
C o n t e n t s o f t h e G u i d e l i n e s
The Ministerial Decrees of 24 April 2001 make the Guidelines the main tool to be used by all
decision-makers involved for whatever reason in the processes the Guidelines address, with
regard to the design and execution of energy conservation projects.
Project design, execution
and evaluation
To make it easier to quantify the amount of energy saved through allowable projects, limit
the cost of measuring and verifying those savings and make sure such measurements are
accurate and reliable, the Authority has defined three methods of evaluation: standardized,
analytical and comparative.
All three methods are designed to count only energy savings in addition to those that would
have been achieved anyway as a result of advances in technology and the market (including
those brought about by legal obligations). They also consider the impact of technical and
behavioural factors on how long the savings will last.
For projects that meet the acceptability criteria and involve training campaigns, informa-
tional and promotional campaigns and campaigns to raise awareness in end customers, as a
means of supporting one or more interventions included in a single project the Guidelines
state that additional savings will be recognized in the amount of 5 percent of the total net
savings applicable to the intervention to which the campaign refers.

134 135
To prevent interventions from being overly fragmented, permit economies of scale and
purpose in the realization of conservation projects, and thus optimize the use of available
resources, the Guidelines envisage a minimum project size1 as detailed below:
• for standardized projects:
– primary energy savings of at least 25 TOE/year;
• for analytical projects:
– for companies bound by law (distributors that supplied 100,000 or more end users as
of 31 December 2001): primary energy savings of at least 100 TOE achieved during
the first 12 months of system functioning post-intervention;
- for companies not bound by law (distributors that supplied fewer than 100,000
end users as of 31 December 2001 and energy service companies2): primary en-
ergy savings of at least 50 TOE achieved during the first 12 months of system
functioning post-intervention;
• for comparative projects:
– for companies bound by law: primary energy savings of at least 200 TOE achieved
during the first 12 months of system functioning post-intervention, evaluated on the
basis of the measuring programme approved in advance by the inspection and certi-
fication body;
- for companies not bound by law: primary energy savings of at least 100 TOE achieved
during the first 12 months of system functioning post-intervention, evaluated on the
basis of the measuring programme approved in advance by the inspection and certi-
fication body.
In addition, companies interested in developing energy conservation projects can now ask
the Authority, or a party delegated thereby, to check the projects in advance and make sure
they satisfy the required conditions. This applies only to kinds of projects for which the Au-
thority has not published technical specifications for standardized or analytical evaluation.
__________________________________________________
1 A project is any activity or set of activities that generates certain, quantifiable primary energy sav-ings through the realization, at the premises of one or more participating customers, of one or more interventions assessable with the same evaluation method or through the realization at the premises of a single participating customer of interventions assessable with different evaluation methods.2 Energy service companies are businesses of any size and configuration whose registered purpose, as of the date the project begins, includes the provision of integrated services for the realization and possibly the subsequent management of energy conservation interventions.

136 137
Inspection and certification
of energy savings
The energy savings for which inspection and certification can be requested are those achieved
through projects that are acceptable as per the Ministerial Decrees and the Guidelines and
that are launched as from 1 January 2002.
Consistently with the Ministerial Decrees, the Guidelines call for spot checks and other forms
of inspection of the documents that project operators are required to keep on file. These
documents must demonstrate that the project was carried out in accordance with the Guide-
lines and with what the project operator declared in submitted paperwork.
The minimum documentation to be stored is specified for each type of project and for train-
ing campaigns, informational and promotional campaigns and campaigns to raise awareness
in end customers. These records have to be kept for the useful life acknowledged for the
kinds of intervention included in the project.
White certificates One of the most innovative aspects of the system introduced by the Ministerial Decrees is the
possibility to sell energy efficiency certificates (“white certificates”) earned in exchange for
certified energy savings. The purpose here is to combine the advantage of achieving definite
quantitative targets for national energy conservation (typical of the more administrative
kinds of regulation) with the advantage of economic efficiency guaranteed by the use of
market instruments.
To that end, the Ministerial Decrees call for the introduction of certificates representing
the units of primary energy saved. Following certification of the savings achieved by each
project, they are issued in a quantity covering the extent of the certified savings.
White certificates are the only instrument by which companies bound by law can prove they have
attained the energy savings targets imposed by the Ministerial Decrees. They are tradable, either
through bilateral contracts or on the white certificates market organized by the market operator
(GME S.p.A.), the latter according to rules established jointly by GME and the Authority.
The development of a white certificates market would reduce the total cost of achieving
the quantitative targets established by the decrees, for both the country as a whole and the
individual distributors required to reach them, and would thus mitigate the impact on tariffs
if distributors were to recover the expense of conservation projects.
Each white certificate represents certified energy savings of one TOE.
Since the Ministerial Decrees require electricity and gas distributors to reach at least 50 per-
cent of their own yearly targets through interventions conserving the form of energy they
supply3, and satisfaction of that condition by target-bound distributors needs to be verified,
the Guidelines provide for three different kinds of white certificate:
__________________________________________________
3 Electricity for electricity distributors and gas for gas distributors.

136 137
• type I, which attests to certified primary energy savings through a decrease in electricity
consumption;
• type II, attesting to certified primary energy savings through a decrease in natural gas
consumption;
• type III, attesting to certified primary energy savings through a decrease in consumption
of other fossil fuels.
What this means is that electricity distributors have to meet their own annual target by
presenting the Authority with type I white certificates amounting to at least half of their
obligation, while gas distributors have to present type II certificates covering at least half
of their requirement. The certificates can be earned from projects carried out directly by the
distributor, or by the distributor in conjunction with third parties, or else purchased through
bilateral contracts or on the certificates market set up by GME.
White certificates are valid for five calendar years as from the year the energy savings are
achieved. The fact that they are valid for more than one year allows target-bound distribu-
tors to use any certificates they hold in excess of their yearly quota to satisfy their targets for
the next four years (in other words, the certificates are “bankable”). To discourage strategies
that would wind up distorting competition, only 40 percent of the target for a given year
can be met with the use of certificates older than one year.
White certificates can be issued to electricity and gas distributors, their subsidiaries, and en-
ergy service companies. This is meant to open the certificates market to as many participants
as possible, so that the efficiency gains generated by the market mechanism can be exploited
to the fullest extent.
Lastly, regions and self-governing provinces that finance acceptable interventions according
to the terms of the Ministerial Decrees and the Guidelines can retain a portion of the white
certificates granted to the company in whose name the project is registered.

138 139

138 139
S T A T U S O F L I T I G A T I O N
On the subject of legal proceedings conducted in connection with petitions against the Au-
thority’s rulings (during the period 1997—2003), developments in 2003 and as far as April
2004 confirm the positive trend reported in previous years. Of all petitions for the suspension
of rulings filed with the Lombardy Regional Court (Table 46), 116 have been rejected, 22
have been fully granted and 12 have been granted in part. Of all first-instance petitions on
the merits, 104 have been rejected, 70 granted in full and 20 granted in part; and in second-
instance proceedings, the Authority has successfully appealed those decisions in 19 cases and
been partially victorious in another four. The outcome of appeals filed against first-instance
rejection of petitions has also been favourable: the Council of State has rejected 31 such
appeals, and granted 10 in full and 5 in part.
By themselves, however, these figures do not sufficiently illustrate a crucial point: the
increased stability brought about by the Authority’s administrative action. A better under-
standing of this is provided by Table 48, which shows how dispute management has pro-
duced far more significant results, at the institutional level, than the already considerable
progress denoted by the statistics on court proceedings. During its first seven years of opera-
tion (1997—2003), the Authority has issued 1,557 rulings, of which no fewer than 140 have
been contested (usually in joint form by several adverse parties; see Table 49). The final legal
judgments, i.e. court decisions beyond recall, have wound up invalidating only nine rulings
in full and seven rulings in part. With almost none of the total invalidations concerning the
regulatory and general rulings on which the very structure of electricity and gas regulation
is founded, it is clear that the Authority—despite the unusual proliferation of disputes—is a
major stabilizing factor. Over 99 percent of all its rulings, and over 88 percent of those con-
tested, have passed the test of the courts.

140 141
TAB. 47 SUMMARY OF SECOND-INSTANCE PETITIONS BY YEAR Decisions on petitions filed during the year indicated
APPEALS BY THE AUTHORITY APPEALS BY ADVERSE PARTIES
YEAR
(A) Up to 30 April.
1997 3 - 1 - - 5
1998 - - 1 2 - 1
1999 - - - - - 10
2000 10 3 1 1 - 8
2001 4 1 14 4 5 5
2002 - - 3 - 1
2003 1
1
- 1 - - 1
2004(A) - - - - - -
TOTALE 19 4 18 10 5 31
TA B. 46 SUMMARY OF FIRST-INSTANCE PETITIONS BY YEAR
Decisions on petitions filed during the year indicated
1997 14 - 2 7 - 1 6
1998 29 - 4 11 3 4 9
1999 68 - - 24 - 4 25
2000 46 2 - 23 16 - 18
2001 92 2 - 16 29 3 19
2002 94 13 5 6 21 8 21
2003 25 5 1 21 1 - 6
2004(A) 21 - - 8 - - -
TOTALE 389 22 12 116 70 20 104
PETITIONS FOR SUSPENSION PETITIONS ON THE MERITS
YEAR NO.PETITION
GRANTED
GRANTEDIN PART
GRANTEDIN PART
GRANTEDREJECTED REJECTED
(A) Up to 30 April.
GRANTEDGRANTEDIN PART
GRANTEDIN PART
GRANTEDREJECTED REJECTED

140 141
Electric companies 11 21 32 16 52 44 5 8 189
Gas companies 1 1 3 11 28 46 19 12 121
Other companies 0 0 30 15 9 2 2 1 59
Individuals 0 2 0 0 3 1 0 0 6
Associations 2 5 3 4 0 0 0 0 14
Government agencies 0 0 0 0 0 0 0 0 0
Total 14 29 68 46 92 93 26 21 389
No. of rulings contested 7 14 17 18 25 32 17 10 140
NO. OF PETITIONERSI
1997 1998 1999 2000 2001 2002 2003 2004(A) TOTAL
TAB. 48 EFFECTS OF LITIGATION ON ADMINISTRATIVE ACTION YEAR
1997 152 6 resolutions + 1 note - -
1998 168 11 resolutions + 3 notes 1 1
1999 209 15 resolutions + 2 notes - 1
2000 250 16 resolutions+ 2 notes 3 2
20011 334 12 resolutions+ 2 notes 2 2
2002 234 27 resolutions + 5 notes 3 1
2003 169 17 resolutions
10 resolutions
- -
2004 (A) 41 - -
TOTALE 1 557 140 9 7
YEAR RULINGS ISSUED BY THE AUTHORITY
RULINGS CONTESTED RULINGS COMPLETELY INVALIDATED
RULINGS PARTIALLY INVALIDATED
TAB.49 CONTESTED AUTHORITY RULINGS BY TYPE OF PETITIONER
(A) Up to 30 April.
(A) Up to 30 April.