Embed Size (px)
Citation preview

October 2, 2017 1October 2, 2017 1
Regulation of Modernizing Power
Distributors: Lessons From Research
on Performance-Based Regulation
Pacific Economics Group Research, LLC
Distribution Systems and Planning Training
for New England Conference of Public Utility Commissioners, Sept. 27-29, 2017
Mark Newton Lowry

October 2, 2017 2October 2, 2017 2
Introduction
This presentation discusses the regulatory context for distribution system
planning
Traditional cost of service regulation (COSR) is problematic for distributors
engaged in accelerated grid modernization
State engagement in distribution system planning is warranted
Performance-Based Regulation (PBR) of distributor services may be a
sensible complement
This presentation considers lessons for power distributor regulation of my
recent PBR research for Berkeley Lab, State Performance-Based
Regulation Using Multiyear Rate Plans for U.S. Electric Utilities

October 2, 2017 3October 2, 2017 3
Cost of Service Regulation
COSR Basics
• Base rates adjusted in rate cases that are often irregularly timed
• Tracker/rider treatment of energy expenses
• Usage (e.g., volumetric and demand) charges collect many “fixed” costs
Sensitivity to Business Conditions
• Utility performance and regulatory cost vary with business conditions (e.g., inflation and average use trends)
• When conditions are favorable to utilities, rate cases are infrequent so regulatory cost is low and performance incentives are strong
• When conditions are chronically unfavorable, rate cases are frequent. Regulatory cost is high, performance incentives are weakened, and operating flexibility is restricted
• Performance can deteriorate just when good performance is crucial
October 2, 2017 4October 2, 2017 4
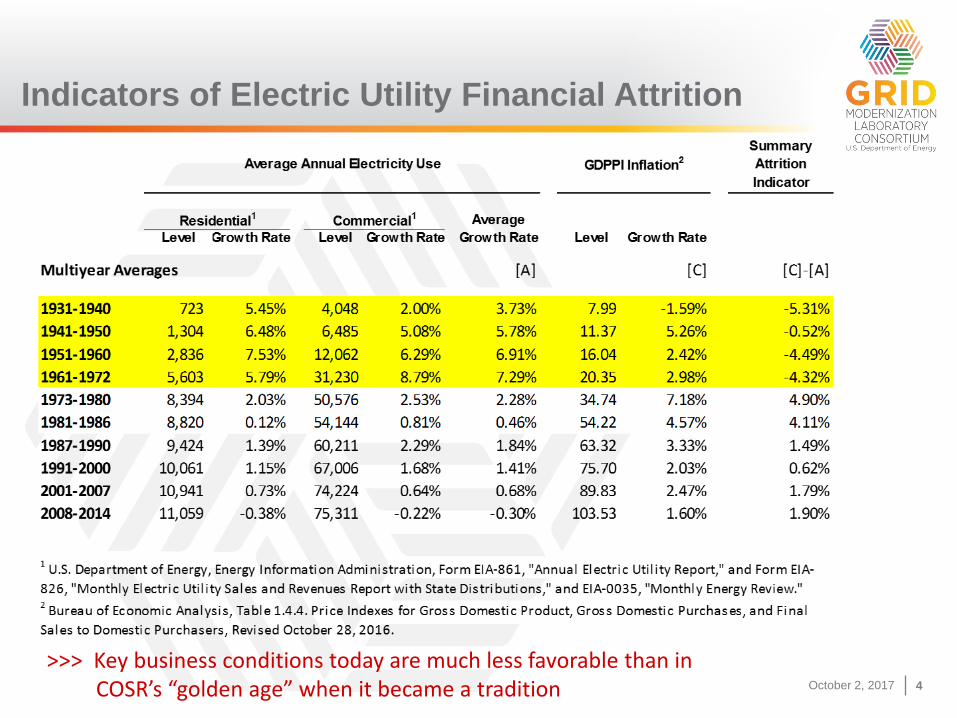
Indicators of Electric Utility Financial Attrition
>>> Key business conditions today are much less favorable than in COSR’s “golden age” when it became a tradition

October 2, 2017 5October 2, 2017 5
Capex Requirements
Many utilities today seek sustained high distribution capex • Replace aging facilities• Improve reliability and resiliency • Improve system capabilities
This capex doesn’t automatically trigger new revenue
Attrition impact greatest for utility distribution companies (UDCs)
October 2, 2017 6October 2, 2017 6
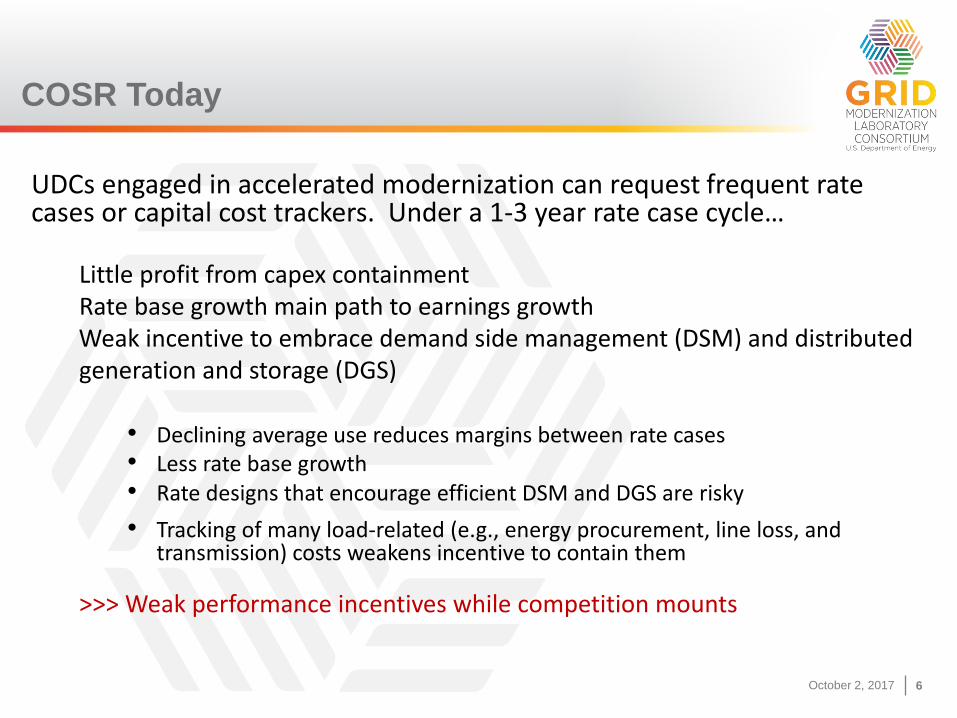
COSR Today
UDCs engaged in accelerated modernization can request frequent rate cases or capital cost trackers. Under a 1-3 year rate case cycle…
Little profit from capex containment Rate base growth main path to earnings growthWeak incentive to embrace demand side management (DSM) and distributedgeneration and storage (DGS)
• Declining average use reduces margins between rate cases• Less rate base growth• Rate designs that encourage efficient DSM and DGS are risky
• Tracking of many load-related (e.g., energy procurement, line loss, and transmission) costs weakens incentive to contain them
>>> Weak performance incentives while competition mounts
October 2, 2017 7October 2, 2017 7
COSR Today (cont’d)
Review of capex prudence is challenging in era of rapid technical change and shifting demand for distributor services
>>> weak incentives + prudence concerns= need for distribution system planning
Rate cases divert regulatory resources from other worthwhile activities (e.g., generic proceedings on rate design, distribution system planning)
October 2, 2017 8October 2, 2017 8
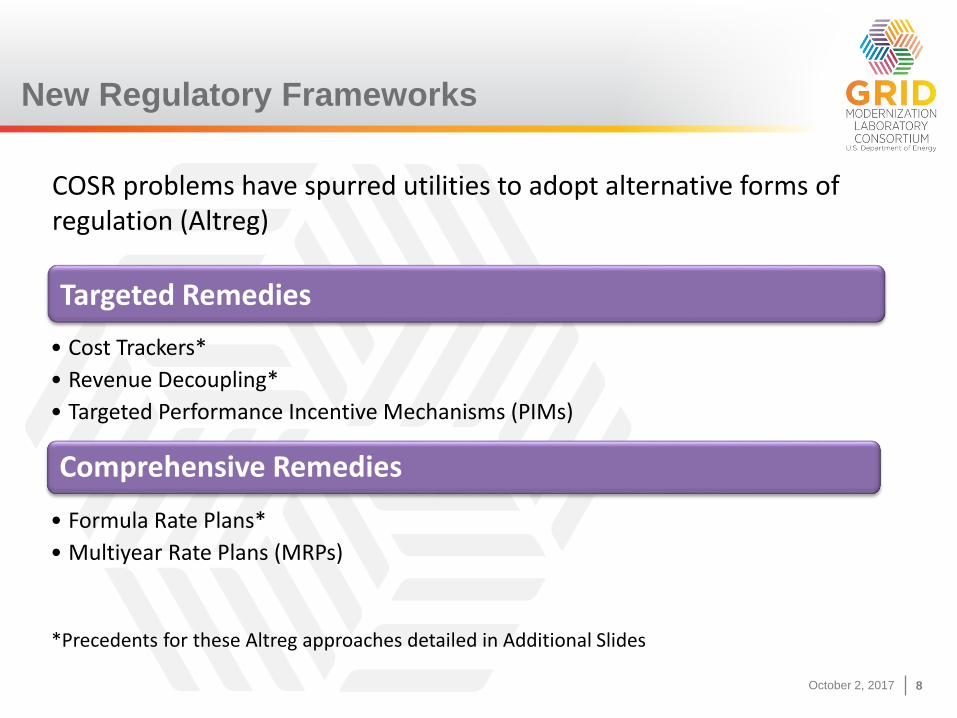
New Regulatory Frameworks
Targeted Remedies
• Cost Trackers*
• Revenue Decoupling*
• Targeted Performance Incentive Mechanisms (PIMs)
Comprehensive Remedies
• Formula Rate Plans*
• Multiyear Rate Plans (MRPs)
COSR problems have spurred utilities to adopt alternative forms of regulation (Altreg)
*Precedents for these Altreg approaches detailed in Additional Slides

October 2, 2017 9October 2, 2017 9
Performance-Based Regulation
Targeted Performance Metrics and Incentive Mechanisms
Multiyear Rate Plans (MRPs)
Incentivized Cost Trackers
PBR: Regulation designed to improve utility performance with
stronger incentives
3 established approaches (can be used in combination):
October 2, 2017 10October 2, 2017 10
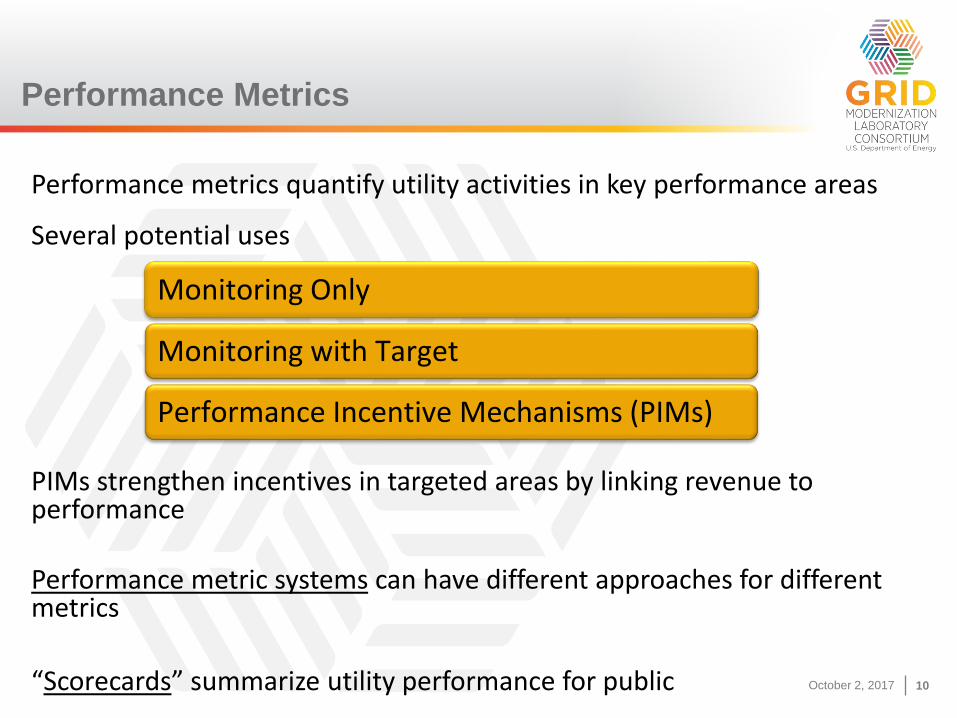
Performance Metrics
Performance metrics quantify utility activities in key performance areas
Several potential uses
PIMs strengthen incentives in targeted areas by linking revenue to performance
Performance metric systems can have different approaches for different metrics
“Scorecards” summarize utility performance for public
Monitoring Only
Monitoring with Target
Performance Incentive Mechanisms (PIMs)
October 2, 2017 11October 2, 2017 11
What do PIMs Target?
PIMs most commonly target service quality and energy efficiency
Need for new performance metrics and incentive mechanisms is focus of recent “utility of the future” proceedings
Peak load management
• System load peak• Non-wire alternatives to local grid investments
Utilization of advanced metering infrastructure capabilities
Quality of service to DGS customers
MRP practitioners (e.g., Britain, New York, Ontario) are also PIM innovators

October 2, 2017 12October 2, 2017 12
Ontario Scorecard Metrics
October 2, 2017 13October 2, 2017 13
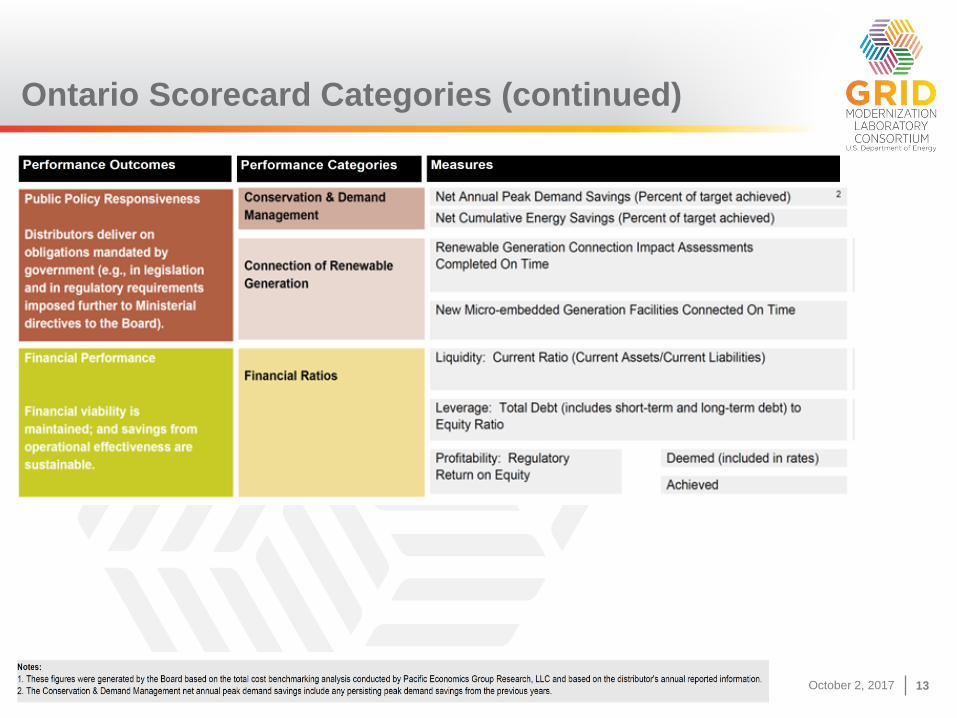
Ontario Scorecard Categories (continued)

October 2, 2017 14October 2, 2017 14
Multiyear Rate Plans
Key Components
• Reduced rate case frequency (e.g., 4-10 year cycle)
• Attrition relief mechanism (ARM) provides automatic relief for cost pressures based on forecast or business condition index with a productivity growth commitment — not a cost tracker or “formula rate”
• Trackers for some costs (e.g., energy)
• PIMs link earnings to reliability and customer service quality
Optional Components
• Revenue decoupling*
• Earnings sharing and off-ramp mechanisms
• Marketing flexibility (e.g., optional rates and services)*
• Additional PIMs (e.g., demand-side management)
• Integrated resource and distribution system planning
* Marketing flexibility discussed further in Additional Slides

October 2, 2017 15October 2, 2017 15
MRP Rationale
Streamlined regulation
Fewer, less overlapping rate cases free resources for other uses
(e.g., distribution system planning)
Stronger performance incentives
Fourth “leg” for the DSM (and DGS) “stool”
1) Revenue decoupling
2) Tracking of DSM Expenses
3) DSM (and DGS) Performance Incentive Mechanisms
4) MRP strengthens incentive to use DSM (and DGS) to cut costs
(e.g., time-varying pricing)
October 2, 2017 16October 2, 2017 16
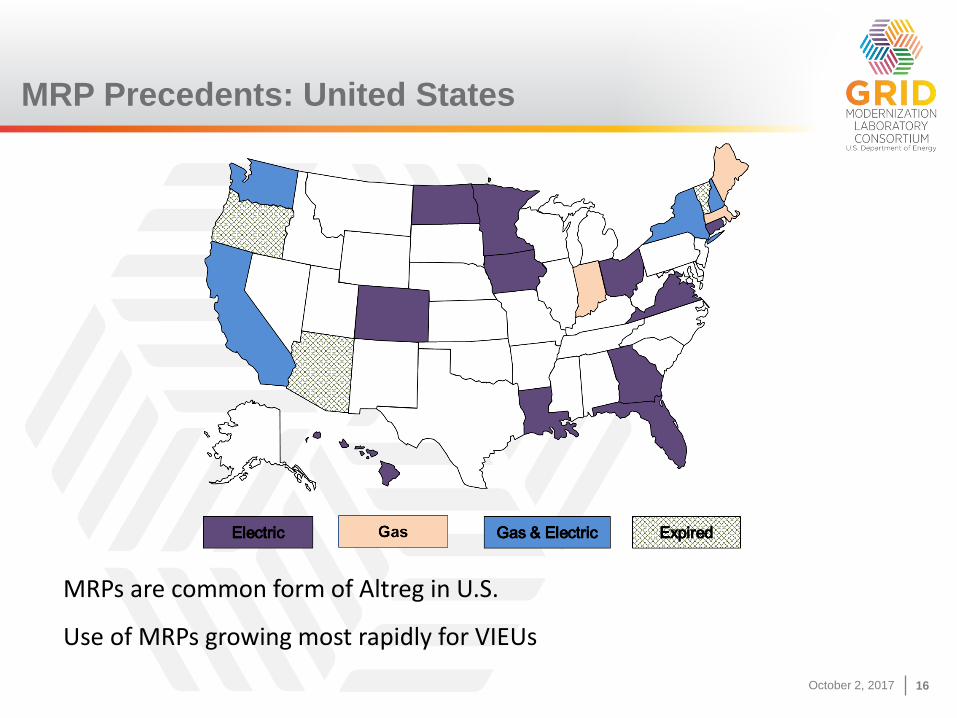
MRP Precedents: United States
MRPs are common form of Altreg in U.S.
Use of MRPs growing most rapidly for VIEUs

October 2, 2017 17October 2, 2017 17
MRP Precedents: Canada
MRPs mandatory for distributors in populous Canadian provinces and many
countries overseas (e.g., Australia and RIIO in Great Britain)

October 2, 2017 18October 2, 2017 18
ARM Design
ARM design key issue in MRP proceedings
Several well-established approaches
Indexing
e.g. growth Revenue = growth Input Prices – X + growth Customers
X Factor = Industry Productivity Trend + Stretch Factor
Stretch factor sometimes based on statistical benchmarking
Forecasting
Hybrid
October 2, 2017 19October 2, 2017 19
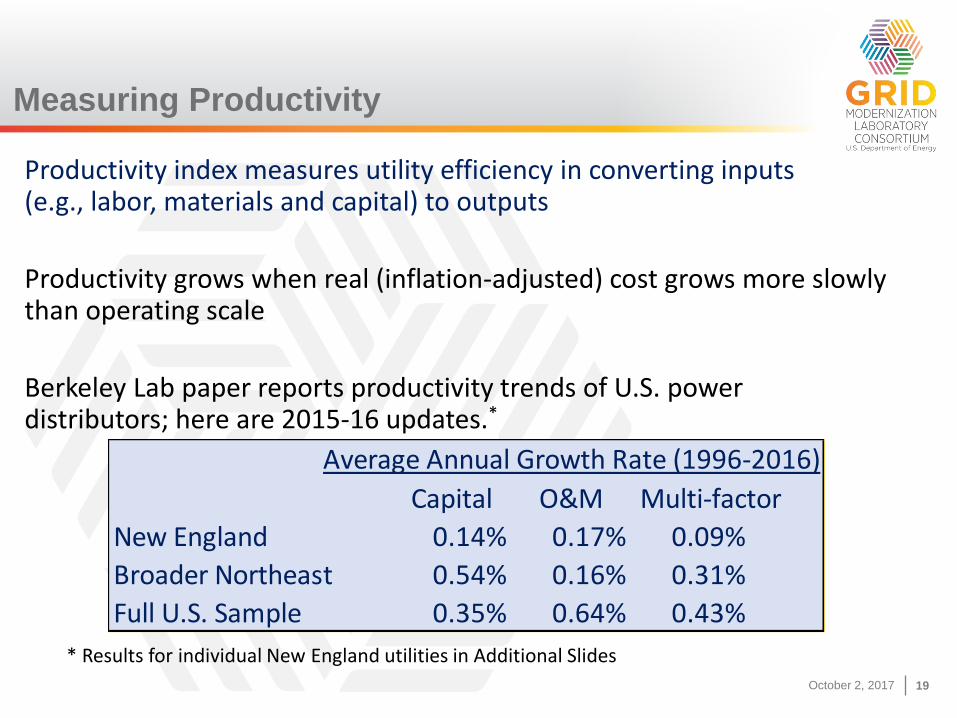
Measuring Productivity
Productivity index measures utility efficiency in converting inputs (e.g., labor, materials and capital) to outputs
Productivity grows when real (inflation-adjusted) cost grows more slowly than operating scale
Berkeley Lab paper reports productivity trends of U.S. power distributors; here are 2015-16 updates.*
* Results for individual New England utilities in Additional Slides
Capital O&M Multi-factor
New England 0.14% 0.17% 0.09%
Broader Northeast 0.54% 0.16% 0.31%
Full U.S. Sample 0.35% 0.64% 0.43%
Average Annual Growth Rate (1996-2016)
October 2, 2017 20October 2, 2017 20
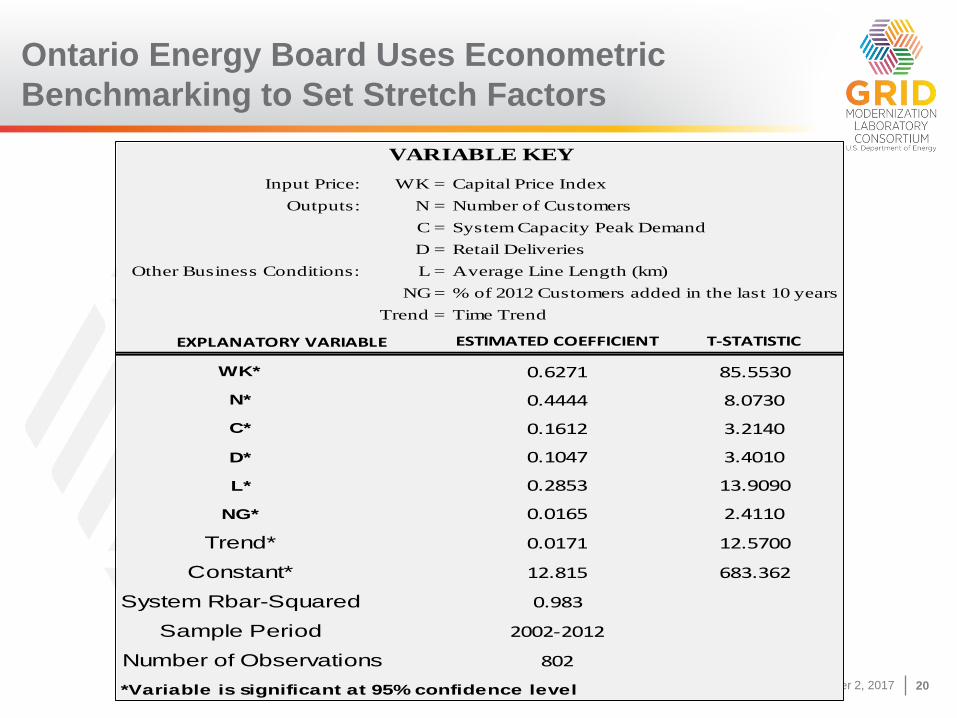
Ontario Energy Board Uses Econometric
Benchmarking to Set Stretch Factors
Input Price: WK = Capital Price Index
Outputs: N = Number of Customers
C = System Capacity Peak Demand
D = Retail Deliveries
Other Business Conditions: L = Average Line Length (km)
NG = % of 2012 Customers added in the last 10 years
Trend = Time Trend
ESTIMATED COEFFICIENT T-STATISTIC
WK* 0.6271 85.5530
N* 0.4444 8.0730
C* 0.1612 3.2140
D* 0.1047 3.4010
L* 0.2853 13.9090
NG* 0.0165 2.4110
Trend* 0.0171 12.5700
Constant* 12.815 683.362
System Rbar-Squared 0.983
Sample Period 2002-2012
Number of Observations 802
*Variable is significant at 95% confidence level
VARIABLE KEY
EXPLANATORY VARIABLE
October 2, 2017 21October 2, 2017 21
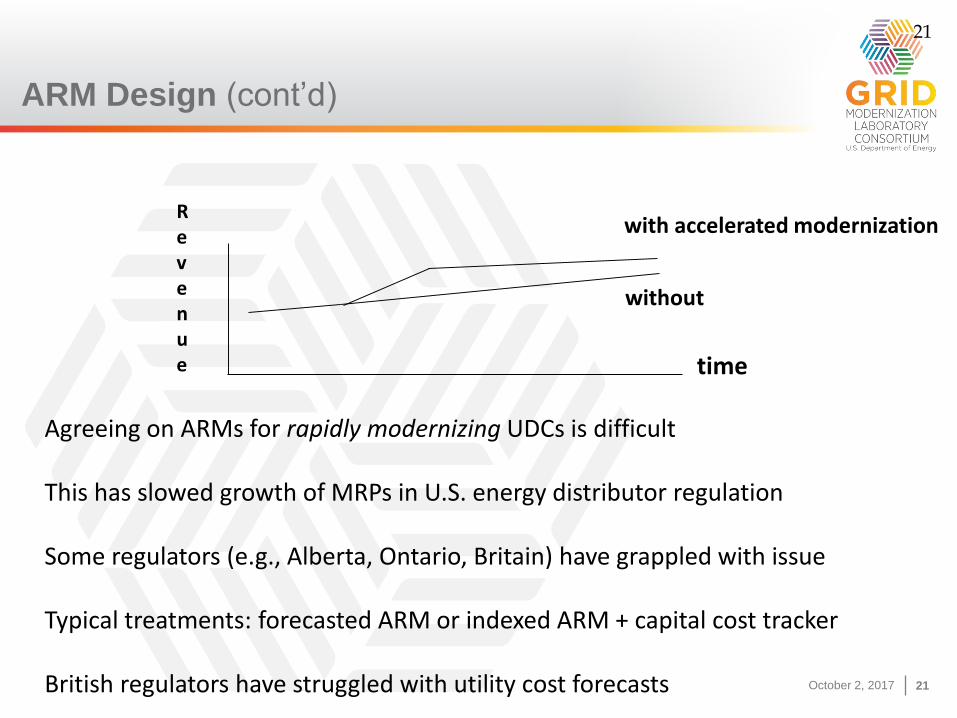
ARM Design (cont’d)
Revenue time
21
with accelerated modernization
without
Agreeing on ARMs for rapidly modernizing UDCs is difficult
This has slowed growth of MRPs in U.S. energy distributor regulation
Some regulators (e.g., Alberta, Ontario, Britain) have grappled with issue
Typical treatments: forecasted ARM or indexed ARM + capital cost tracker
British regulators have struggled with utility cost forecasts
October 2, 2017 22October 2, 2017 22
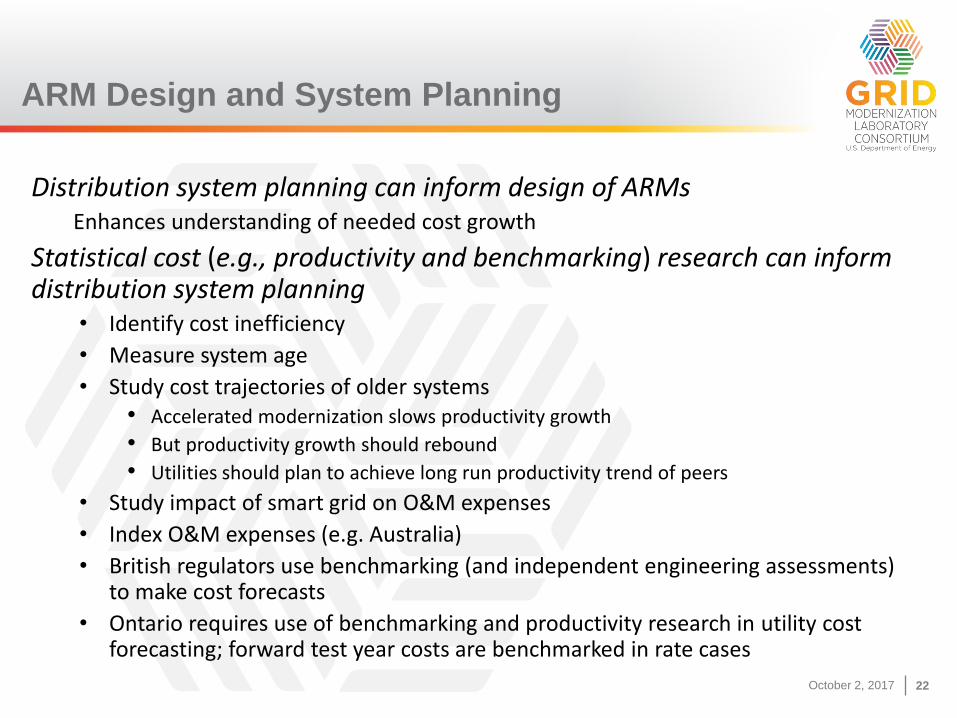
ARM Design and System Planning
Distribution system planning can inform design of ARMsEnhances understanding of needed cost growth
Statistical cost (e.g., productivity and benchmarking) research can inform distribution system planning
• Identify cost inefficiency
• Measure system age
• Study cost trajectories of older systems• Accelerated modernization slows productivity growth
• But productivity growth should rebound
• Utilities should plan to achieve long run productivity trend of peers
• Study impact of smart grid on O&M expenses
• Index O&M expenses (e.g. Australia)
• British regulators use benchmarking (and independent engineering assessments) to make cost forecasts
• Ontario requires use of benchmarking and productivity research in utility cost forecasting; forward test year costs are benchmarked in rate cases

October 2, 2017 23October 2, 2017 23
Case Study: Central Maine Power
Impetus for MRPs in Maine came from Commission3 successive plans (here is the last)
Attrition Relief Mechanism: growth Rates = growth GDPPI – X (X=1%)
Capital Cost Tracker: Automated metering infrastructure
Earning Sharing: Asymmetric sharing of surplus earnings
Plan term: 5 years (2009-2013)
Service Quality: Multi-indicator penalty mechanism
Marketing Flexibility: Light-handed regulation of optional rate schedules and rate discounts
Reference: Maine Public Utilities Commission, “ARP 2008 Settlement,” June 2008
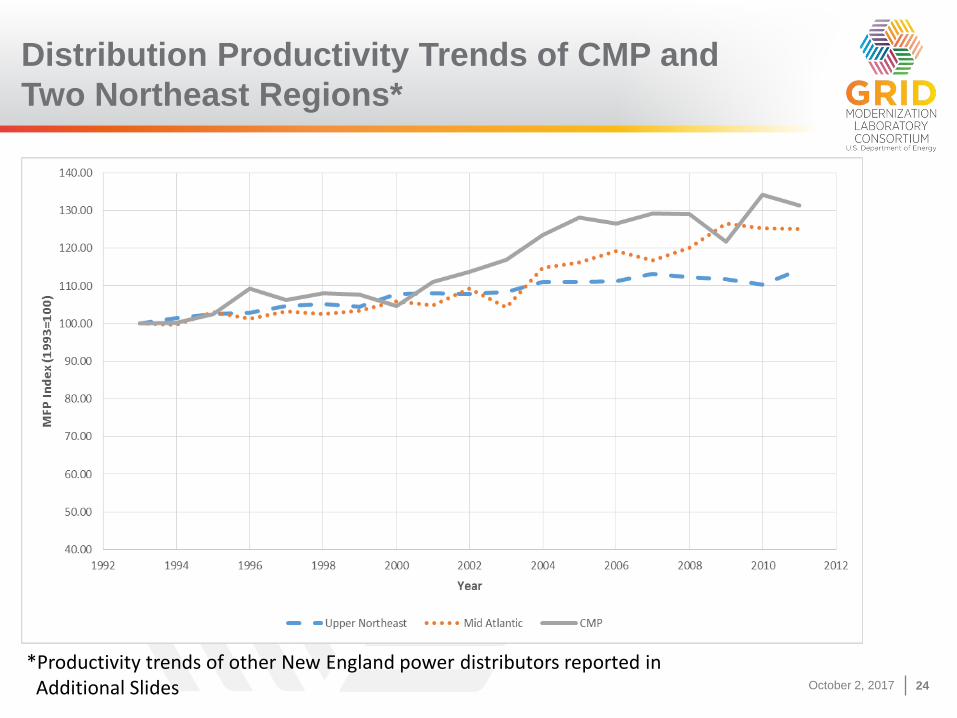
October 2, 2017 24October 2, 2017 24
Distribution Productivity Trends of CMP and
Two Northeast Regions*
*Productivity trends of other New England power distributors reported inAdditional Slides
October 2, 2017 25October 2, 2017 25
Conclusions
Accelerated distribution system modernization weakens performance incentives and raises regulatory cost under COSR
State engagement in distribution system planning needed
Expansive cost trackers and formula rates are dubious alternatives
PBR can complement distribution system planning
o Stronger incentives reduce prudence concernso Streamlined regulation can free resources for planningo MRP design tools like productivity and benchmarking research can aid
planningo Planning facilitates MRP design

October 2, 2017 26October 2, 2017 26
Additional Slides
October 2, 2017 27October 2, 2017 27
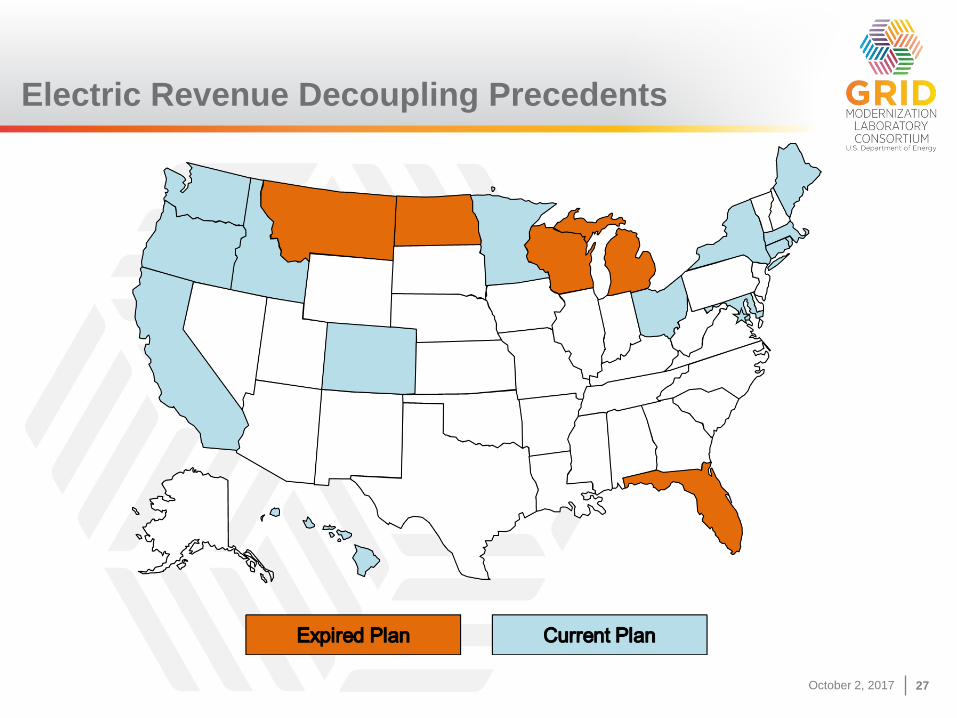
Electric Revenue Decoupling Precedents

October 2, 2017 28October 2, 2017 28
Capital Cost Tracker Precedents
Cost trackers are a common way to finance capex surges
Trackers in a few states track substantially all distribution capex
October 2, 2017 29October 2, 2017 29
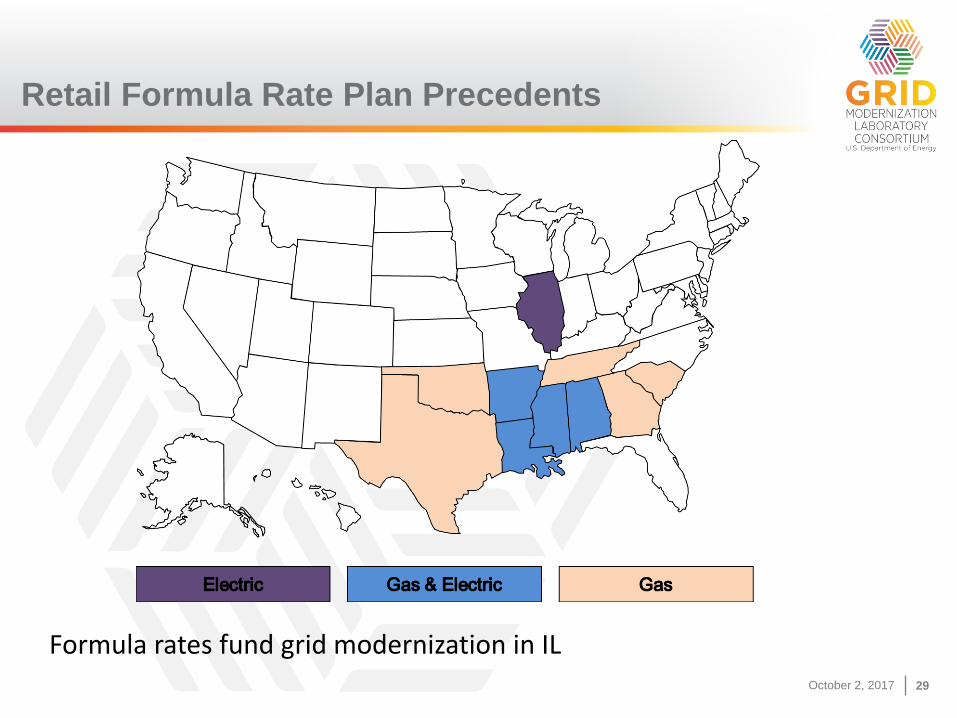
Retail Formula Rate Plan Precedents
Formula rates fund grid modernization in IL

October 2, 2017 30October 2, 2017 30
Marketing Flexibility
• MRPs can afford utilities more marketing flexibility by reducing rate case frequency and opportunities for cross-subsidization
e.g., “Streamlined regulation” of optional tariffs and services
Special contracts
Green power packages (utility scale and distributed)
Energy transformation services (e.g., EV charging, heat pump leasing)
Reliability-differentiated services
Other smart-grid-enabled services
• MRPs have been popular in utility industries facing competition, technical change, and complex, changing demand
October 2, 2017 31October 2, 2017 31
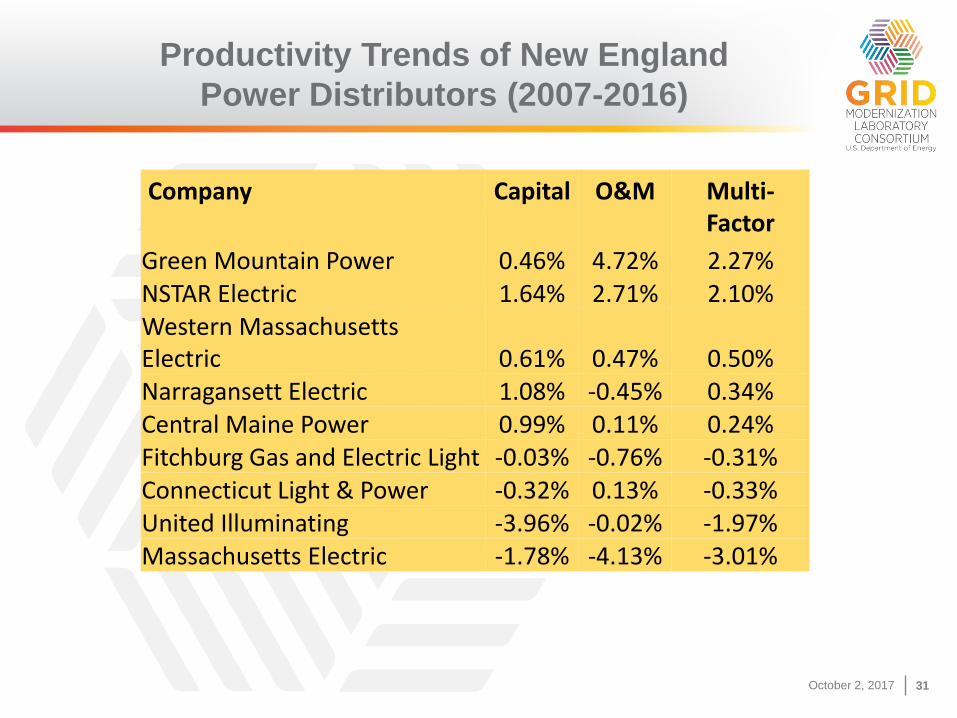
Company Capital O&M Multi-Factor
Green Mountain Power 0.46% 4.72% 2.27%NSTAR Electric 1.64% 2.71% 2.10%Western Massachusetts Electric 0.61% 0.47% 0.50%Narragansett Electric 1.08% -0.45% 0.34%Central Maine Power 0.99% 0.11% 0.24%Fitchburg Gas and Electric Light -0.03% -0.76% -0.31%Connecticut Light & Power -0.32% 0.13% -0.33%United Illuminating -3.96% -0.02% -1.97%Massachusetts Electric -1.78% -4.13% -3.01%
Productivity Trends of New England
Power Distributors (2007-2016)
October 2, 2017 32October 2, 2017 32
Suggestions for Further Reading
California Public Utilities Commission (2016), Decision Addressing Competitive Solicitation Framework and Utility Regulatory Incentive Pilot, R-14-10-003, December. http://docs.cpuc.ca.gov/SearchRes.aspx?DocFormat=ALL&DocID=171555623
Ken Costello, Multiyear Rate Plans and the Public Interest, National Regulatory Research Institute, 2016 http://nrri.org/download/nrri-16-08-multiyear-rate-plans/
e21 Initiative (2016), Phase II Report On implementing a framework for a 21st century electric system in Minnesota, www.betterenergy.org/e21-PhaseII
Mark Newton Lowry, Matt Makos, and Gretchen Waschbusch (2015), Performance Based Regulation for Emerging Utility Challenges: 2015 Update, published by the Edison Electric Institute.
http://www.eei.org/issuesandpolicy/stateregulation/Documents/innovative_regulation_survey.pdf
Mark Newton Lowry, Matt Makos and Kaja Rebane (2016), Performance Metrics and PBR for US Electric Utilities, prepared for Edison Electric Institute and a consortium of US electric utilities.

October 2, 2017 33October 2, 2017 33
Suggestions for Further Reading (continued)
Mark Newton Lowry and Tim Woolf (2016), Performance-Based Regulation in a High Distributed Energy Resources Future, prepared for Lawrence Berkeley National Laboratory. https://emp.lbl.gov/sites/all/files/lbnl-1004130_0.pdf
Mark Newton Lowry, Matthew Makos, and Jeff Deason (2017), State Performance-Based Regulation Using Multiyear Rate Plans for U.S. Electric Utilities, prepared for Lawrence Berkeley National Laboratory. https://eta.lbl.gov/sites/default/files/publications/multiyear_rate_plan_gmlc_1.4.29_final_report071217.pdf
New York Public Service Commission (2017), Order Approving Shareholder Incentives, New York Public Service Commission Case 15-E-0229.
New York Public Service Commission (2017), Order Extending Brooklyn/Queens Demand Management Program, New York Public Service Commission Case 14-E-0302.
Ontario Energy Board (2016), Handbook for Utility Rate Applications.

October 2, 2017 34October 2, 2017 34
Mark Newton Lowry
President, Pacific Economics Group Research LLC (PEG)
• Active in PBR since 1990s
• Specialties: multi-year rate plans, productivity and benchmarking research, revenue decoupling
• Recent clients: Alberta Utilities Consumer Advocate, Association Quebecoise des Consommateurs d’Electricite Industriels, Commercial Energy Consumers of British Columbia, Edison Electric Institute, Green Mountain Power, Ontario Energy Board, Berkeley Lab, Xcel Energy
• Former Penn State University energy economics professor
• PhD Applied Economics, University of Wisconsin
• Ohio native, Wisconsin resident

October 2, 2017 35October 2, 2017 35
Speaker Contact Information
Mark Newton Lowry, PhD
President
Pacific Economics Group (PEG) LLC
www.pacificeconomicsgroup.com
44 East Mifflin St., Suite 601, Madison, WI 608-257-1522 ext. 23
35