Embed Size (px)
DESCRIPTION
A new study for the Mercatus Center at George Mason University finds that regulations intended to improve the quality of child care often focus on easily observable measures, such as group sizes or child–staff ratios, that do not necessarily affect the quality of care but do increase the cost of care. These regulations can have unintended consequences, including increasing the cost of child care while decreasing the wages of child care workers. Eliminating regulatory standards that do not affect the quality of care while focusing on those that do, such as teacher training, will improve the quality of child care while making it more affordable to low-income families.
Citation preview
Regulation and the Cost of Child Care
Diana W. Thomas and Devon Gorry
August 2015
MERCATUS WORKING PAPER
Diana W. Thomas and Devon Gorry. “Regulation and the Cost of Child Care.” Mercatus Working Paper, Mercatus Center at George Mason University, Arlington, VA, August 2015. Abstract Female labor market choices depend on the availability, affordability, and quality of child care. In this paper, we evaluate different regulatory measures and their effect on both the quality and the cost of child care. First, we analyze data on regulations and costs to estimate the effect of regulatory measures on the cost of child care. Next, we summarize the existing literature on the effect of regulation on child care quality. We find that regulation intended to improve quality often focuses on easily observable measures of the care environment that do not necessarily affect the quality of care but that do increase the cost. Thus, we find that the regulatory environment could be improved by eliminating costly measures that do not affect quality of care. JEL codes: L51, K20 Keywords: economics of regulation, regulation and business law: general, child care Author Affiliation and Contact Information
Diana W. Thomas Associate Professor of Economics and Associate Director of the Creighton Economic Institute Heider College of Business, Creighton University [email protected] Devon Gorry Assistant Professor of Economics Utah State University [email protected] All studies in the Mercatus Working Paper series have followed a rigorous process of academic evaluation, including (except where otherwise noted) at least one double-blind peer review. Working Papers present an author’s provisional findings, which, upon further consideration and revision, are likely to be republished in an academic journal. The opinions expressed in Mercatus Working Papers are the authors’ and do not represent official positions of the Mercatus Center or George Mason University.
3
Regulation and the Cost of Child Care
Diana W. Thomas and Devon Gorry
1. Introduction
Nonparental child care options are increasingly important as female labor force participation
rates continue to rise. The labor force participation rate for single women with children increased
from roughly 52 percent in 1980 to 72 percent in 2009. Similarly, the rate for married women
with children rose from 54.1 percent in 1980 to 69.8 percent in 2009.1
With large numbers of women participating in the labor force, many children are
spending time in nonparental care. In 2011, 61 percent of children younger than five spent on
average 33 hours per week in child care. Children with employed mothers spent on average 15
more hours in child care than children with mothers who were not employed: 36 hours versus 21
hours (Laughlin 2013, figure 2).
Among children with employed mothers, those who lived below the poverty line (about
15 percent) were more likely to be cared for by an unlicensed relative other than the father or
grandparent (sibling or other relative) than were those who lived above the poverty line (20.7
percent versus 9 percent). In turn, children from households living above the poverty line were
more likely to be cared for by nonrelatives in a licensed day care center, nursery, or preschool
(37.9 percent versus 26.9 percent) or a licensed family day care home, where a nonrelative cares
for two or more children outside the children’s home (8.1 percent versus 4.3 percent), than were
those living in households below the poverty line (Laughlin 2013, table 2).
1 Data are from the Statistical Abstract of the 2012 Census, table 599, https://www.census.gov/compendia/statab/cats /labor_force_employment_earnings/labor_force_status.html.
4
As children spend more time in nonparental care, concerns over the quality of such out-
of-home care have risen. To address those concerns, states have established licensing
requirements and regulations that are intended to improve the quality of care. However, those
regulations and licensing requirements are costly. In this paper, we show that regulations on
child–staff ratios, group size restrictions, and education requirements are all associated with
higher care prices.
With prices on the rise, families have to spend ever-larger shares of their income on child
care. That is especially true for low-income families. Recent data show that the cost of center-
based infant care ranges from 25 percent of income for a family of three living at the federal
poverty level in Mississippi to 86 percent of income for a similar family in Massachusetts (Child
Care Aware of America 2013). Child care is a considerable part of the budget even for a family
of three earning twice the federal poverty level. For center-based infant care, it ranges from 12.7
percent of income in Mississippi up to 43 percent of family income in Massachusetts (Child Care
Aware of America 2013). In the face of high costs, parents turn to informal care arrangements
that include grandparents or other relatives, as well as friends, neighbors, and unlicensed day
care homes. Use of such informal care providers is accordingly higher among low-income and
single-parent households (Brown-Lyons, Robertson, and Layzer 2001).
For parents without those alternatives, the cost of formal child care providers becomes
the deciding factor in a family’s determination about whether to rely on welfare or to seek
employment. Working makes sense only if the wage that one makes in the workforce exceeds the
marginal cost of child care by more than forgone welfare received when not working. Empirical
evidence suggests that all women—and single mothers in particular—base their decision about
5
whether to seek employment or to apply for welfare on the price of child care.2 Connelly and
Kimmel (2003) find, for example, that the price of child care has a significant influence on a
woman’s decision to enter the labor force. More specifically, they find that a 1 percent increase
in the price of child care results in a decrease in employment of single mothers of between 0.3
percent and 1.1 percent. They furthermore find evidence that the probability of a single mother’s
being a welfare recipient increases with increasing child care costs.3 Baker, Gruber, and
Mulligan (2008) find similar results with a subsidy program in Canada. They find that when
child care is subsidized, both the use of care and the employment of women increase. If child
care is relatively cheap, a single mother might be able to earn enough income to pay for child
care and sustain her family. As child care becomes more costly, single mothers are more likely to
apply for welfare and stay home to care for their children. Regulatory burdens that drive up
prices of child care can therefore condemn whole sections of the population to a dependence on
welfare. Even for families that keep their children in formal child care settings, “the economic
pressures associated with poverty [and higher cost of care] impair parent psychological well-
being, thereby decreasing positive parenting behaviors” (Dearing, Taylor, and McCartney 2009,
1330).
Although families pay more, child care providers constitute one of the lowest wage-
earning groups in the country. Again, regulation intended to improve the quality of out-of-home
care has been shown to be at least partially at fault. Because parents respond strongly to
increases in the cost of care, child care providers have been unable to raise prices enough to fully
2 Anderson and Levine (1999) and Blau (2000a) summarize the empirical literature on the effect of child care costs on employment. Overall, the evidence suggests a strong and significant negative effect of child care costs on women’s employment. 3 Previous studies on the empirical relationship between child care costs and welfare recipience found either a small negative effect or a near zero effect. For more information see Connelly (1990), Kimmel (1995), and Houser and Dickert-Conlin (1998).
6
cover the cost of regulations when regulatory burdens have increased. Increasing regulatory
compliance costs therefore results partially in lower staff wages (Blau 2007). Low wages result
in high staff turnover4 and a low commitment level, which can negatively affect the quality of
child care. Concerns over differential quality and the impact of societal status on child care
outcomes therefore remain.
Federal subsidy programs, such as the child care tax credit, the Child Care Development
Block Grant, Temporary Assistance for Needy Families, and Head Start, are intended to make
child care more affordable for low-income families. Many of the state subsidy programs are
plagued with long waiting lists, however, and at best provide partial relief. Because regulation
impacts how private and public funds are spent, it is imperative to take a critical look at existing
regulation and its effect on price and quality. Some types of regulation might significantly affect
the price of care without contributing much to quality at the same time. Identifying regulations
with those unintended effects would be a first step in the right direction of providing affordable
child care to low-income families.
In this paper, we identify the most costly and least effective regulatory requirements in an
effort to provide guidance for policymakers who seek to provide affordable child care options for
low-income families without compromising the quality of care. In section 2, we estimate the
relationship between different child care regulations and the cost of care at the state level. We
find that maximum child–staff ratios, group size limits, and training requirements significantly
increase the cost of child care. Section 3 reviews the existing literature on the relationship
between regulatory requirements and the quality of care. The existing literature suggests that
structural measures of child care quality, such as group size limits or child–staff ratios, do not
4 Gormley (1990) reports that annual staff turnover rates for child care providers are 40 percent.
7
actually enhance child care outcomes or safety, whereas other measures relating to teacher
training have a positive effect on outcomes. Our analysis of costs and quality of care suggests
that a number of existing regulatory requirements could be relaxed to provide cost savings to
low-income families without significantly reducing the quality of child care.
2. Regulation and Costs
In this paper, we use data on the average cost of center-based care by state in 2012, as well as
state-level regulation data in the same year, to measure the association between different
regulatory requirements and the cost of child care.
2.1. Data and Summary Statistics
Data on regulations and cost of care come from Child Care Aware of America, the primary
advocacy group for regulating child care quality in the United States. Regulation data include
information regarding mandated child–staff ratios, the presence of group size regulations,
specific group size caps, and education requirements for lead staff members and center directors.
Child Care Aware of America’s information on the education requirements for lead staff
members and center directors distinguishes among eight different levels of educational
prerequisites, ranging from less than a high school diploma to a bachelor’s degree in early
childhood education or a related field. To incorporate that information, we create a dummy
variable, which is equal to one for states that require more than a high school diploma and equal
to zero for states that require only a high school diploma or less. We also include data on income
for each state to help control for state-level variation in prices that are not attributable to child
care regulations. Our final sample includes information for 50 states for 2012.

8
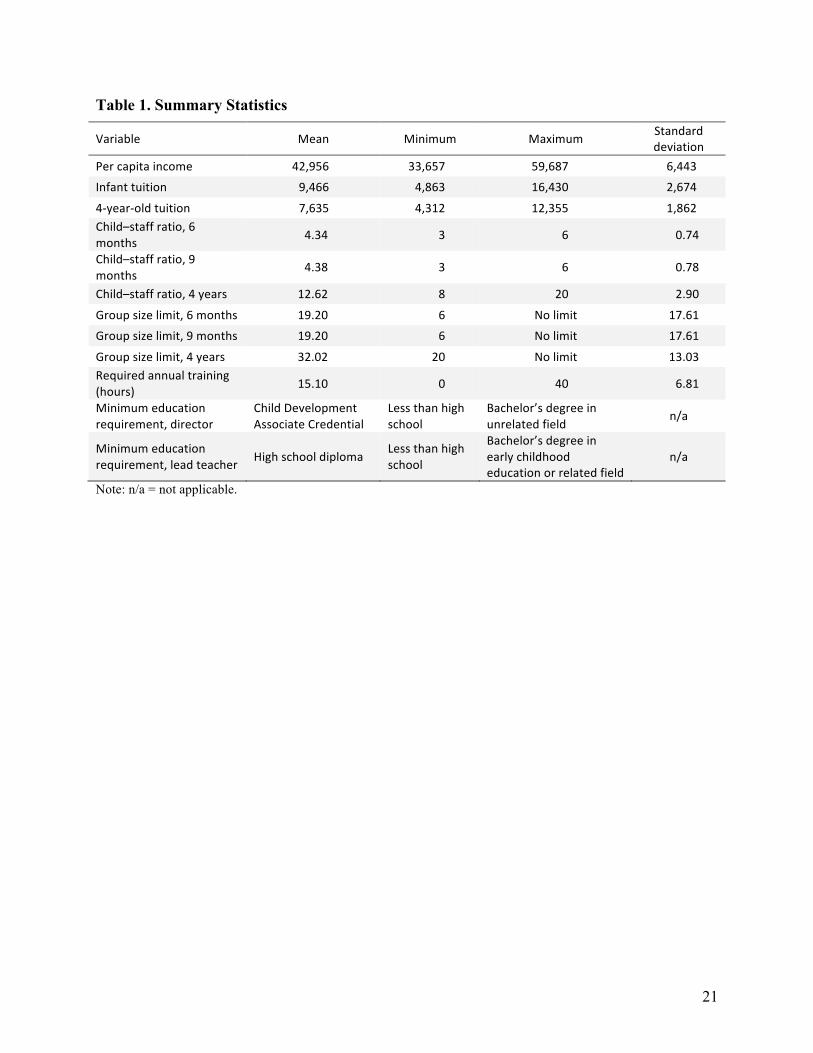
Table 1 (page 21) reports the summary statistics of the data. The average annual cost of
full-time child care for infants in center-based child care facilities ranges from $4,863 in
Mississippi to $16,430 in Massachusetts, with an average of $9,466 for all states. Full-time
tuition for a four-year-old child ranges from $4,312 in Mississippi to $12,355 in New York. The
average child–staff ratio for six-month-old infants is 4.3 children per staff member, with a low of
3 children per staff member in Kansas, Maryland, and Massachusetts, and a high of 6 children
per staff member in Arkansas, Georgia, Idaho, Louisiana, and New Mexico. The average child–
staff ratio for children four years old and older is 12.6 children per staff member, with a low of 8
in New York and a high of 20 in Florida and North Carolina. The average group size limit across
all states for six-month-old infants is 19.2, with a low of 6 infants per group in Maryland and no
maximum group size requirement in 12 other states. Group size limits for children four years old
and older are not regulated in many states, but where they are regulated, they range from 20 in a
number of states, including Alaska, Connecticut, and Illinois, to a high of 35 and 36 in Texas and
Georgia, respectively.
The median education requirement for center directors across all states is a Child
Development Associate Credential, whereas lead teachers are required to have only a high school
diploma (median). The states with the lowest education requirements (less than a high school
diploma) for center directors are Connecticut, Idaho, Montana, and Oregon. The state with the
highest education requirement for center directors (a bachelor’s degree in an unrelated field) is
New Jersey. Seventeen states do not require their lead teachers in child care centers to have a
high school diploma or general equivalency diploma, whereas Rhode Island requires the highest
level of education requirement for their lead teachers (a bachelor’s degree in early childhood
education or a related field).
9
2.2. Results
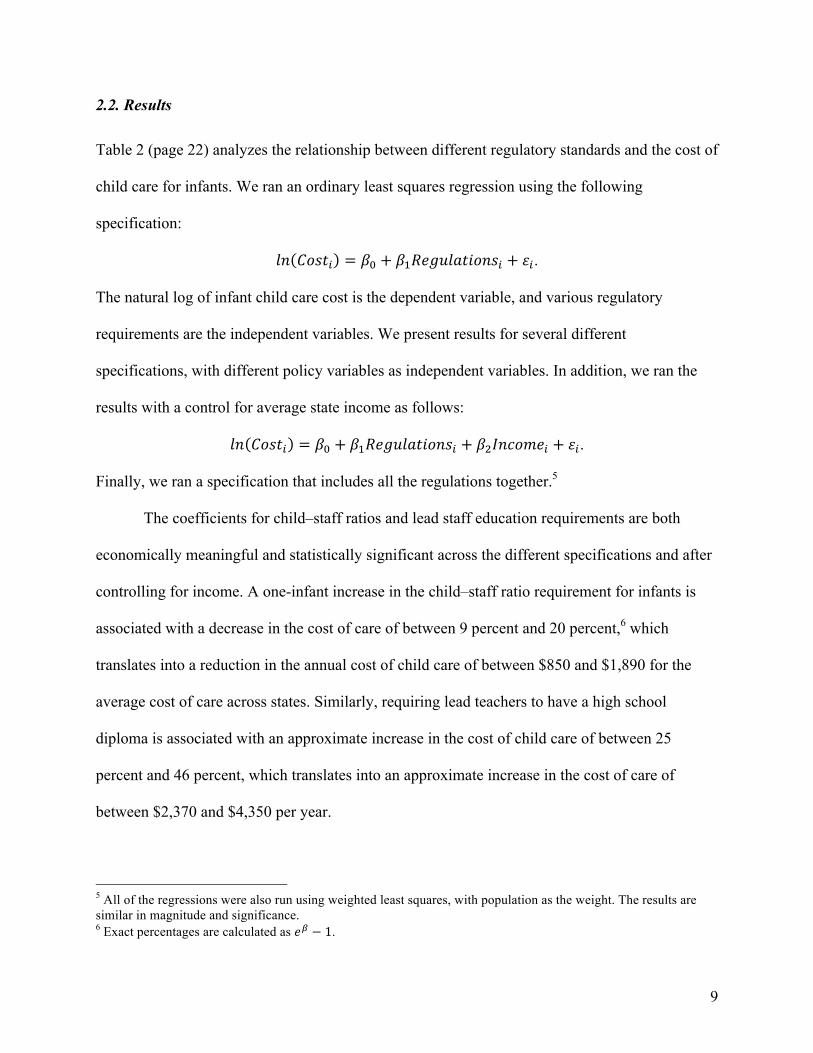
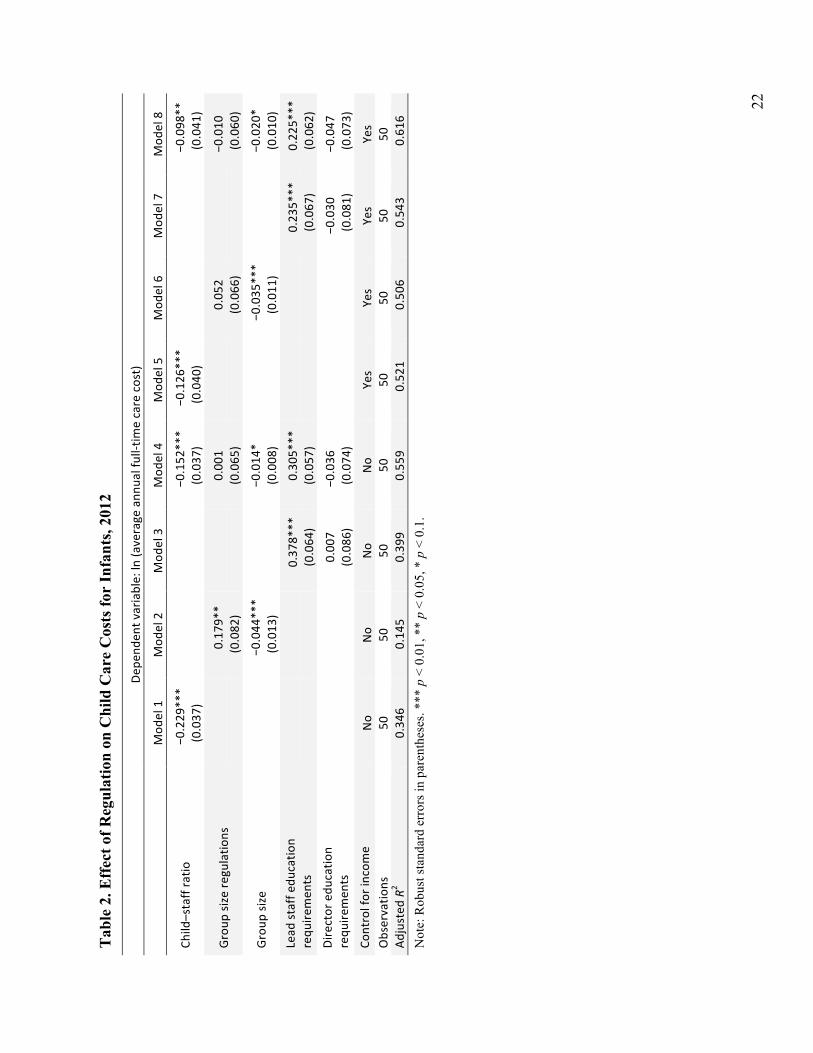
Table 2 (page 22) analyzes the relationship between different regulatory standards and the cost of
child care for infants. We ran an ordinary least squares regression using the following
specification:
𝑙𝑛 𝐶𝑜𝑠𝑡! = 𝛽! + 𝛽!𝑅𝑒𝑔𝑢𝑙𝑎𝑡𝑖𝑜𝑛𝑠! + 𝜀!.
The natural log of infant child care cost is the dependent variable, and various regulatory
requirements are the independent variables. We present results for several different
specifications, with different policy variables as independent variables. In addition, we ran the
results with a control for average state income as follows:
𝑙𝑛 𝐶𝑜𝑠𝑡! = 𝛽! + 𝛽!𝑅𝑒𝑔𝑢𝑙𝑎𝑡𝑖𝑜𝑛𝑠! + 𝛽!𝐼𝑛𝑐𝑜𝑚𝑒! + 𝜀!.
Finally, we ran a specification that includes all the regulations together.5
The coefficients for child–staff ratios and lead staff education requirements are both
economically meaningful and statistically significant across the different specifications and after
controlling for income. A one-infant increase in the child–staff ratio requirement for infants is
associated with a decrease in the cost of care of between 9 percent and 20 percent,6 which
translates into a reduction in the annual cost of child care of between $850 and $1,890 for the
average cost of care across states. Similarly, requiring lead teachers to have a high school
diploma is associated with an approximate increase in the cost of child care of between 25
percent and 46 percent, which translates into an approximate increase in the cost of care of
between $2,370 and $4,350 per year.
5 All of the regressions were also run using weighted least squares, with population as the weight. The results are similar in magnitude and significance. 6 Exact percentages are calculated as 𝑒! − 1.
10
The dummy variable measuring the presence of group size regulation is statistically
significant for only one of the specifications reported and becomes insignificant when we control
for child–staff ratios. The measure for group size is statistically significant and negative. The
dummy variable measuring director education requirements is not statistically significant in any
of the specifications reported.
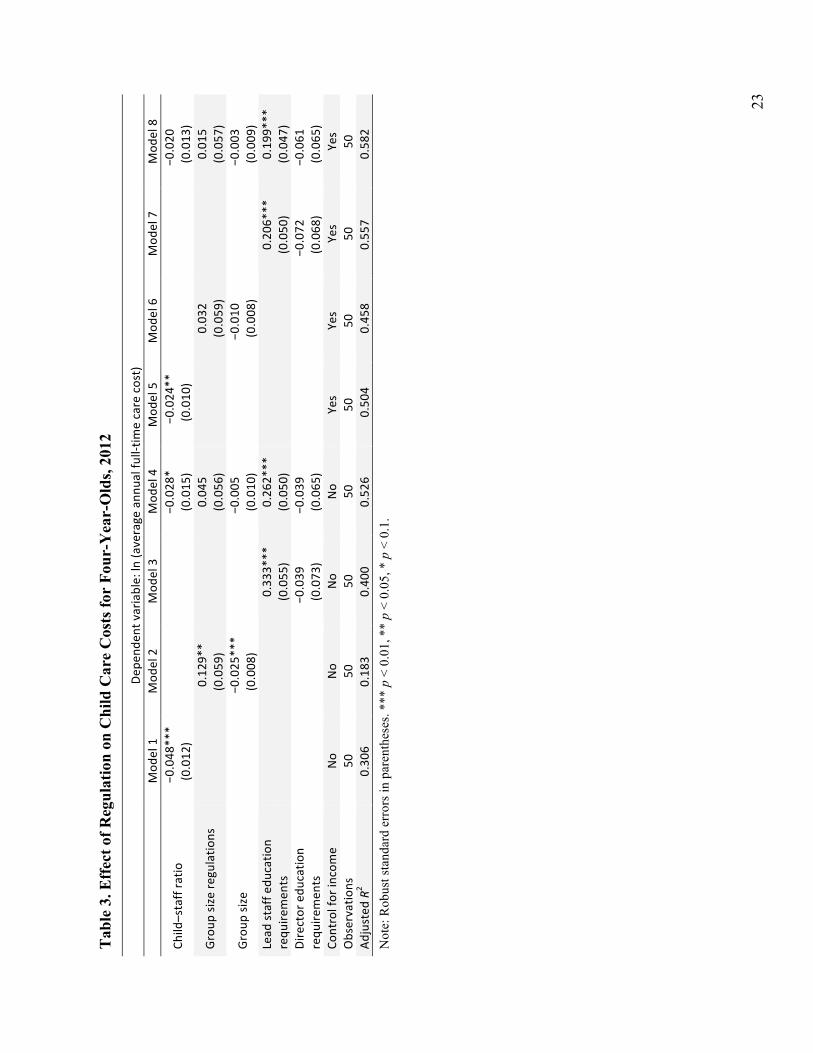
Table 3 (page 23) analyzes the relationship between regulatory requirements and the cost
of child care for four-year-old children. As for infants, the child–staff ratio requirements are
statistically significant, but they are much smaller in economic magnitude. A one-child increase
in the number of children per staff member for four-year-old care is associated with a reduction
in the cost of child care by only 2 percent to 4.7 percent.
As before, education requirements for lead staff members are statistically and
economically significant across the different specifications. Requiring a lead teacher to hold at
least a high school degree is associated with an increase in the cost of child care for four-year-
olds of between 22 percent and 40 percent. One would expect that outcome because more
educated workers have higher opportunity costs in the labor market and therefore require higher
wages. Those higher wages result in higher costs of care.
3. Regulation and Quality of Care
The foregoing analysis suggests that regulation of child care may have a significant economic
effect on the cost of care. A higher cost of care may be justifiable if regulation also improves the
quality of child care. The relationship between regulation and the quality of care is more difficult
to discern, however.
11
Existing research suggests that quality of care is particularly important in an early
childhood setting, because it affects children’s cognitive and social competence (NICHD
ECCRN 1999, 2000). Cognitive and noncognitive skills are strong predictors of a variety of
labor market and behavioral outcomes (Heckman, Stixrud, and Urzua 2006), and early childhood
investments are critical for the development and accumulation of those skills (Cunha and
Heckman, 2007, 2008). In this section, we review the literature on the relationship between
regulation and the quality of child care to gain a better understanding of the expected effect that
regulatory measures might have on the quality of care.
3.1. Measuring and Regulating Quality of Care
The literature in child psychology measures child care quality either for the structural
characteristics of the care environment or for process features, which measure the quality of the
interactions between teachers and children.7 Structural measures evaluate easily observable
features of a care environment, such as group size, child–staff ratio, teacher education and
training, safety, staff turnover, and program administration. Process measures, however, are
more difficult to observe, because they are based on the actual interactions between the child and
his or her caregiver, the program administration, and other children.8 The theoretical and
empirical literature in child psychology suggests that although structural measures of quality may
7 For reviews of the literature on child care quality, see Lamb (1998) and Love, Schochet, and Meckstroth (1996). 8 Love, Schochet, and Meckstroth (1996, 5) characterize high process quality as follows: “Caregivers encourage children to be actively engaged in a variety of activities; have frequent, positive interactions with children that include smiling, touching, holding, and speaking at children’s eye level; promptly respond to children’s questions or requests; and encourage children to talk about their experience, feelings, and ideas.”

12
facilitate good interactions, process measures are more closely related to positive child outcomes
and are therefore better indicators of actual quality.9
Because process quality is difficult to observe and therefore difficult to regulate,
regulation is usually based on structural measures of child care, however. Indeed, most states
base their licensing requirements on specific child–staff ratios, group sizes, and teacher
education. Regulation will have a positive effect on outcomes as long as structural measures of
quality affect development outcomes either directly or indirectly through their effect on process
measures of quality.
3.2. Structural Quality Measures and Child Outcomes
The empirical literature on this topic suggests that the link between regulated structural measures
of quality and child outcomes is weak at best. Scarr, Eisenberg, and Deater-Deckard (1994) show
that no measures of child care that can be regulated, except teacher wage, have any effect on
observable measures of child care quality. In a study published in the Journal of Public Health,
the National Institute of Child Health and Human Development Early Child Care Research
Network (NICHD ECCRN 1999) concludes that the differences in children’s performance that
were associated with whether their center classes met recommendations for class size, child–staff
ratio, caregiver education, and caregiver training were only modest.
In a meta-study of the relationship between different structural characteristics of care
environment and child-specific outcomes, Blau (2001) confirms this earlier result. He finds that
9 Existing evidence suggests that lower child–staff ratios, smaller group sizes, and better caregiver education (i.e., structural measures of quality) are correlated with better child–caregiver interactions (i.e., process quality). However, cross-country evidence (Cryer et al. 1999) suggests that although many of the same structural features affect process measures of quality, identifying a particular type of structural quality measure that contributes consistently to process quality is difficult. Among structural measures, teacher education and wages seem to be the most important (Pessanha, Aguiar, and Bairrão 2007; Phillipsen et al. 1997).

13
most existing studies fail to control for center-specific characteristics and home inputs (i.e.,
family-specific characteristics). Reanalyzing the data, he finds that when he relies only on
within-center variation (by comparing classrooms within each center rather than classrooms
between centers) and when he controls for home inputs, many of the structural measures of
quality turn out to be both weakly related to quality and statistically insignificant. The only
variable that remains important across studies after the inclusion of the relevant controls is
teacher training in early childhood education. More specifically, Blau (1997, 2000b) finds that
the only educational measure that consistently matters for quality care is that the caregiver has
taken a college course in early childhood education in the past year. No other measure of teacher
training is statistically significant or economically meaningful.
Mashburn et al. (2008) confirm this result in a more recent study of prekindergarten
programs. Their empirical results suggest that none of the nine structural measures of quality
related to the program infrastructure that they include in their analysis (all subjects of minimum
standard of quality recommendations issued by the National Institute for Early Education
Research) have a significant effect on children’s development of language and academic skills
during pre-K, on their social competence, or on problem behavior. Conversely, process measures
that capture the quality of teacher–child interactions according to the Classroom Assessment
Scoring System, a standard measure of process quality, as well as capturing child
characteristics—such as race, socioeconomic status, and the level of the mother’s education—all
matter for child outcomes.
More recent studies of the relationship between quality of care and child care outcomes
usually focus on process measures of quality. The majority of such studies find that the process
quality of care is an important predictor of development. Because they focus on process
14
measures of quality, however, those studies can inform the debate on the relationship between
regulation and the quality of care only to the extent that the regulated structural measures are
correlated with the process measures of quality that actually affect outcomes.
3.3. Structural Quality and Process Quality
Studies that attempt to provide an estimate of the link between structural and process measures
of the quality of child care are often used to justify regulation based on structural measures. The
most comprehensive study on this link finds that while maternal caregiving is a much stronger
predictor of both social and cognitive competence, among the different characteristics of the
nonmaternal caregiving environment, caregiver training is a much more important input into
quality than child–staff ratios (NICHD ECCRN 2002).
Burchinal, Cryer, and Clifford (2002) provide support for the idea that among structural
measures of quality, teacher training is most effective at improving process quality. They provide
evidence that the extent of both formal and informal caregiver training is associated with higher-
quality care environments. In a study of Portuguese toddler child care quality, Pessanha, Aguiar,
and Bairrão (2007) confirm that better-paid teachers—who are usually also better educated—
provide better-quality care, whereas other structural variables, such as a measure of space per
child, were not statistically significant predictors of the quality of care.
Currie and Hotz (2004) analyze another dimension of quality: safety. They find that only
the education of directors has any effect on the safety of children. Although having more
educated directors is associated with fewer accidents, regulations on child–staff ratios and
inspections have no significant effects.
15
3.4. Unintended Consequences of Regulating Structural Measures of Quality
Our review of the literature suggests that, at best, regulation of nonmaternal child care has a
small effect on overall child development outcomes. Tighter standards have a limited ability to
increase child outcomes. That finding does not mean that regulation is inappropriate for setting
minimum standards for nonmaternal care.
However, because regulation increases the cost of care significantly (both statistically
and economically), regulators should be mindful of the tradeoff between quality and price.
Mothers should not be placed in a position where the quality of their care suffers because they
cannot afford nonmaternal care or because they experience financial distress from the high cost
of child care.
Blau (2007) argues that an additional unintended consequence of regulating group size
limits and child–staff ratios is that they reduce staff wages at child care centers, which may
actually have a negative effect on child development, because lower wages deter the most
qualified teachers from working at child care centers and result in greater staff turnover (also
associated with a lower quality of care). As previously discussed studies have shown, caregiver
training is a much more important predictor of child development than group size or child–staff
ratios. Regulation of the latter two aspects of child care may therefore have a detrimental effect
on the overall quality of care.
Recent work by Hotz and Xiao (2011) provides additional evidence for the presence of
unintended consequences from the regulation of child care quality. They find that although
regulation can increase the number of day care centers that are licensed and that comply with the
higher standards required by private accreditation agencies, such as the National Association for
16
the Education of Young Children,10 it also leads to a reduction in the overall availability of child
care centers, particularly in low-income markets. Hence, although regulation increases the quality
of some existing centers, it forces low-income families, in particular, to resort to other types of
care, such as nonrelative home-based care, which is typically found to be of lower quality than
center-based care.11 Currie and Hotz (2004) similarly note that regulation of child care, even when
it improves quality, crowds kids out into nonformal care, which tends to be less safe.
Overall, these results suggest that relaxing regulatory requirements for group size and
child–staff ratios, while maintaining quality through training requirements for teachers, might
lower the cost of providing child care without significantly affecting quality. If one provider is
allowed to care for a larger number of children, that provider can earn a higher wage. Higher
wages would attract better-educated providers and reduce staff turnover rates overall.
4. Conclusion
We show in this paper that regulation of child care facilities is significantly associated with the
cost of care. Because female labor market choices depend importantly on the availability and
affordability of child care options, regulation should be limited and focused on variables that
have the greatest possible effect on the quality of care. The literature on early childhood
development, psychology, and education suggests that the quality of child care depends most 10 Hotz and Xiao (2011) do not look at the effects of regulation on direct quality measures. 11 Being placed in lower-quality care settings can have significant detrimental effects on child development and learning outcomes, especially for children from lower-income households. Dearing, Taylor, and McCartney (2009, 1329) report that “low income was less strongly predictive of underachievement for children who had been in higher quality care than for those who had not.” O’Connell and Farran (1982) report that infants from low-income households in high-quality center-based care demonstrate better language development than do home-reared infants from low-income households. Conversely, Melhuish et al. (1990) find that language development for infants from middle-class families was poorer when those infants were in low-quality child care settings compared with better-quality home care. Studying the effect of day care participation on the cognitive development of 867 children from the National Longitudinal Survey, Caughy, DiPietro, and Strobino (1994) find that entering day care before the first birthday is associated with higher reading recognition scores for children from impoverished home environments.

17
importantly on the level of education of immediate care providers—that is, lead teachers and
child care center staff. Child–staff ratios and group size limits, which are also regulated, are
less effective in improving quality. They are significantly related to the cost of child care,
however, and therefore make child care less affordable, especially for low-income families.
Prudent regulatory reform should focus on deregulating those aspects of child care that are
least cost-effective.
18
Bibliography
Anderson, Patricia M., and Phillip B. Levine. 1999. “Child Care Costs and Mother’s Employment Decisions.” In Finding Jobs: Work and Welfare reform, edited by David Card and Rebecca Blank, 420–62. New York: Russell Sage.
Baker, Michael, Jonathan Gruber, and Kevin Mulligan. 2008. “Universal Child Care, Maternal Labor Supply, and Family Well-Being.” Journal of Political Economy 116 (4): 709–45.
Blau, David M. 1997. “The Production of Quality in Child Care Centers.” Journal of Human Resources 32 (2): 354–87.
———. 2000a. “Child Care Subsidy Programs.” NBER Working Paper 7806, National Bureau of Economic Research, Cambridge, MA.
———. 2000b. “The Production of Quality in Child Care Centers: Another Look.” Applied Development Science 4 (3): 136–48.
———. 2001. The Child Care Problem: An Economic Analysis. New York: Russel Sage Foundation.
———. 2007. “Unintended Consequences of Child Care Regulations.” Labour Economics 14 (3): 513–38.
Brown-Lyons, Melanie, Anne Robertson, and Jean Layzer. 2001. “Kith and Kind: Informal Child Care—Highlights from Recent Research.” National Center for Children in Poverty, Columbia University, New York.
Burchinal, Margaret R., Debby Cryer, and Richard M. Clifford. 2002. “Caregiver Training and Classroom Quality in Child Care Centers.” Applied Developmental Science 6 (1): 2–11.
Caughy, Margaret O’Brien, Janet A. DiPietro, and Donna M. Strobino. 1994. “Day-Care Participation as a Protective Factor in the Cognitive Development of Low-Income Children.” Child Development 65 (2): 457–71.
Child Care Aware of America. 2013.Parents and the High Cost of Child Care 2013 Report. Arlington, VA: Child Care Aware of America.
Connelly, Rachel. 1990. “The Cost of Child Care for Single Mothers: Its Effect on LFP and AFDC Participation.” Discussion Paper 920-90, Institute for Research on Poverty, Madison, WI.
Connelly, Rachel, and Jean Kimmel. 2003. “The Effect of Child Care Costs on the Employment and Welfare Recipiency of Single Mothers.” Southern Economic Journal 69 (3): 498–519.
19
Cryer, Debby, Wolfgang Tietze, Margaret Burchinal, Teresa Leal, and Jesus Palacios. 1999. “Predicting Process Quality from Structural Quality in Preschool Programs: A Cross-Country Comparison.” Early Childhood Research Quarterly 14 (3): 339–61.
Cunha, Flavio, and James Heckman. 2007. “The Technology of Skill Formation.” American Economic Review 97 (2): 31–47.
———. 2008. “Formulating, Identifying and Estimating the Technology of Cognitive and Noncognitive Skill Formation.” Journal of Human Resources 43 (4): 738–82.
Currie, Janet, and V. Joseph Hotz. 2004. “Accidents Will Happen? Unintended Childhood Injuries and the Effects of Child Care Regulations.” Journal of Health Economics 23 (1): 25–59.
Dearing, Eric, Beck A. Taylor, and Kathleen McCartney. 2009. “Does Higher Quality Early Child Care Promote Low-Income Children’s Math and Reading Achievement in Middle School?” Child Development 80 (5): 1329–49.
Gormley, William T. 1990. “Regulating Mister Rogers’ Neighborhood: The Dilemmas of Day Care Regulation.” Brookings Review 8 (4): 21–28.
———. 1995. Everybody’s Children: Child Care as a Public Problem. Washington, DC: Brookings Institution.
Heckman, James J., Jora Stixrud, and Sergio Urzua. 2006. “The Effects of Cognitive and Noncognitive Abilities on Labor Market Outcomes and Social Behavior.” Journal of Labor Economics 24 (3): 411–82.
Hotz, V. Joseph, and Mo Xiao. 2011. “The Impact of Regulations on the Supply and Quality of Care in Child Care Markets.” American Economic Review 101 (5): 1775–805.
Houser, Scott, and Stacy Dickert-Conlin. 1998. “The Effects of After-Tax Wages, Transfer Payments, and Child Care Expenses on Labor Market and Transfer Program Participation.” Working Paper 7, Joint Center for Poverty Research, Northwestern University and University of Chicago.
Kimmel, Jean. 1995. “The Effectiveness of Child-Care Subsidies in Encouraging the Welfare-to-Work Transition of Low-Income Single Mothers.” American Economic Review 85 (2): 271–75.
Lamb, Michael E. 1998. Nonparental Child Care: Context, Quality, Correlates, and Consequences. Vol. 4 of Child Psychology in Practice, edited by Irving E. Sigel and K. Ann Renninger. Chichester, UK: John Wiley.
Laughlin, Lynda. 2013. “Who’s Minding the Kids? Child Care Arrangements: Spring 2011.” Current Population Reports, US Census Bureau,Washington, DC.
20
Love, John M., Peter Z. Schochet, and Alicia L. Meckstroth. 1996. “Are They in Any Real Danger? What Research Does—and Doen’t—Tell Us about Child Care Quality and Children’s Well-Being.” Mathematica Policy Research, Princeton, NJ.
Mashburn, Andrew J., Robert C. Pianta, Oscar A. Barbarin, Donna Bryant, Bridget K. Hamre, Jason T. Downer, Margaret Burchinal, Diane M. Early, and Carollee Howes. 2008. “Measures of Classroom Quality in Prekindergarten and Children’s Development of Academic Language, and Social Skills.” Child Development 79 (3): 732–49.
Melhuish, Edward C., Eva Lloyd, Susan Martin, and Ann Mooney. 1990. “Type of Child Care at 18 Months: II. Relations with Cognitive and Language Development.” Journal of Child Psychology and Psychiatry and Allied Disciplines 31 (6): 861–70.
NICHD ECCRN (National Institute of Child Health and Human Development Early Child Care Research Network). 1999. “Child Outcomes When Child Care Center Classes Meet Recommended Standards for Quality.” American Journal of Public Health 89 (7): 1072–77.
———. 2000. “The Relation of Child Care to Cognitive and Language Development.” Child Development 71(4): 960–80.
———. 2002. “Child-Care Structure à Process à Outcome: Direct and Indirect Effects of Child-Care Quality on Young Children’s Development.” Psychological Science 13: 199–206.
O’Connell, Joanne C., and Dale C. Farran. 1982. “Effects of Day-Care Experience on the Use of Intentional Communicative Behaviors in a Sample of Socioeconomically Depressed Infants.” Developmental Psychology 18: 22–29.
Pessanha, Manuela, Cecilia Aguiar, and Joaquim Bairrão. 2007. “Influence of Structural Features on Portuguese Toddler Child Care Quality.” Early Childhood Research Quarterly 22 (2): 204–14.
Phillipsen, Leslie C., Margaret R. Burchinal, Carollee Howes, and Debby Cryer. 1997. “The Prediction of Process Quality from Structural Features of Child Care.” Early Childhood Research Quarterly 12 (3): 281–303.
Scarr, Sandra, Marlene Eisenberg, and Kirby Deater-Deckard. 1994. “Measurement of Quality in Child Care Centers.” Early Childhood Research Quarterly 9 (2): 131–51.
21
Table 1. Summary Statistics
Variable Mean Minimum Maximum Standard deviation
Per capita income 42,956 33,657 59,687 6,443
Infant tuition 9,466 4,863 16,430 2,674
4-‐year-‐old tuition 7,635 4,312 12,355 1,862 Child–staff ratio, 6 months 4.34 3 6 0.74
Child–staff ratio, 9 months
4.38 3 6 0.78
Child–staff ratio, 4 years 12.62 8 20 2.90
Group size limit, 6 months 19.20 6 No limit 17.61
Group size limit, 9 months 19.20 6 No limit 17.61
Group size limit, 4 years 32.02 20 No limit 13.03 Required annual training (hours) 15.10 0 40 6.81
Minimum education requirement, director
Child Development Associate Credential
Less than high school
Bachelor’s degree in unrelated field
n/a
Minimum education requirement, lead teacher High school diploma
Less than high school
Bachelor’s degree in early childhood education or related field
n/a
Note: n/a = not applicable.
22
Tab
le 2
. Eff
ect o
f Reg
ulat
ion
on C
hild
Car
e C
osts
for
Infa
nts,
2012
Depe
nden
t variable: ln (a
verage ann
ual full-‐tim
e care cost)
Mod
el 1
Mod
el 2
Mod
el 3
Mod
el 4
Mod
el 5
Mod
el 6
Mod
el 7
Mod
el 8
Child–staff ratio
−0
.229
***
−0.152
***
−0.126
***
−0.098
**
(0.037
)
(0.037
) (0.040
)
(0.041
)
Group
size re
gulatio
ns
0.17
9**
0.00
1
0.05
2
−0.010
(0.082
)
(0.065
)
(0.066
)
(0.060
)
Group
size
−0
.044
***
−0
.014
*
−0.035
***
−0
.020
*
(0.013
)
(0.008
)
(0.011
)
(0.010
) Lead
staff e
ducatio
n requ
iremen
ts
0.37
8***
0.30
5***
0.23
5***
0.22
5***
(0.064
) (0.057
)
(0.067
) (0.062
) Director edu
catio
n requ
iremen
ts
0.00
7 −0
.036
−0
.030
−0
.047
(0.086
) (0.074
)
(0.081
) (0.073
) Co
ntrol for income
No
No
No
No
Yes
Yes
Yes
Yes
Observatio
ns
50
50
50
50
50
50
50
50
Adjusted
R2
0.34
6 0.14
5 0.39
9 0.55
9 0.52
1 0.50
6 0.54
3 0.61
6 N
ote:
Rob
ust s
tand
ard
erro
rs in
par
enth
eses
. ***
p <
0.0
1, *
* p
< 0.
05, *
p <
0.1
.
23
Tab
le 3
. Eff
ect o
f Reg
ulat
ion
on C
hild
Car
e C
osts
for
Four
-Yea
r-O
lds,
2012
Depe
nden
t variable: ln (a
verage ann
ual full-‐tim
e care cost)
Mod
el 1
Mod
el 2
Mod
el 3
Mod
el 4
Mod
el 5
Mod
el 6
Mod
el 7
Mod
el 8
Child–staff ratio
−0
.048
***
−0.028
* −0
.024
**
−0.020
(0.012
)
(0.015
) (0.010
)
(0.013
)
Group
size re
gulatio
ns
0.12
9**
0.04
5
0.03
2
0.01
5
(0.059
)
(0.056
)
(0.059
)
(0.057
)
Group
size
−0
.025
***
−0
.005
−0.010
−0.003
(0.008
)
(0.010
)
(0.008
)
(0.009
) Lead
staff e
ducatio
n requ
iremen
ts
0.33
3***
0.26
2***
0.20
6***
0.19
9***
(0.055
) (0.050
)
(0.050
) (0.047
) Director edu
catio
n requ
iremen
ts
−0.039
−0
.039
−0
.072
−0
.061
(0.073
) (0.065
)
(0.068
) (0.065
) Co
ntrol for income
No
No
No
No
Yes
Yes
Yes
Yes
Observatio
ns
50
50
50
50
50
50
50
50
Adjusted
R2
0.30
6 0.18
3 0.40
0 0.52
6 0.50
4 0.45
8 0.55
7 0.58
2 N
ote:
Rob
ust s
tand
ard
erro
rs in
par
enth
eses
. ***
p <
0.0
1, *
* p
< 0.
05, *
p <
0.1
.


![Measures of Child Knowledge and Regulation of Cognition[2002]](https://img.pdfslide.us/doc/110x75/577cc0361a28aba7118f416a/measures-of-child-knowledge-and-regulation-of-cognition2002.jpg)