Embed Size (px)
Citation preview
Regulated Sports Betting In Indiana: Landscape, Analysis, And
Recommendations October 2018
18
2 Indiana Sports Betting Report
Regulated Sports Betting In Indiana: By The Numbers
$256MM Total amount of annual revenue generated by regulated sports betting in Indiana by Year 5, per our forecast.
57% Share of market accounted forby mobile sports betting in Year 1.
68% Share of market accounted forby mobile sports betting in Year 5.
$87MM Total revenue from regulated sports betting that flows to the state via taxes and license fees in first five years of operation.
33% Percentage of active sports bettors in Indiana who bet at least weekly. 10% of active bettors wager more than once a week.
53% Percentage of active sports bettors in Indiana who would be more likely to place bets if sports betting was legalized.
85% Percentage of active sports bettors in Indiana who would be willing to drive an hour or less to place a sports bet at a casino.
Total annual in-state economic impacts from regulated sports betting by Year 5.
In the first five years, regulated sports betting will produce nearly $1.7bn in direct and indirect economic impacts for Indiana.
$466MM
3 Indiana Sports Betting Report
Eilers & Krejcik Gaming was engaged by the Indiana Gaming Commission to produce a report containing a broad analysis of regulated sports betting. In constructing our analysis, we drew upon existing data and research, extensive consultation with industry experts, customized economic impact models, and our professional expertise. There are three key aspects to our report, detailed below.
Market Forecast
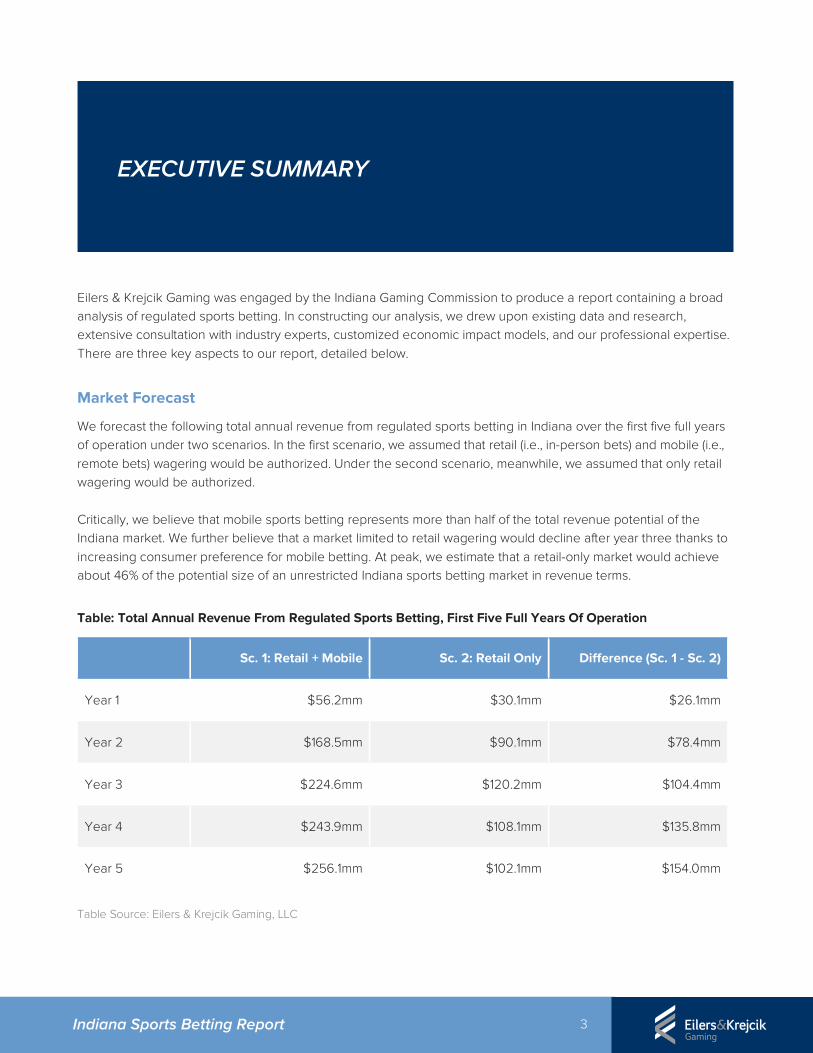
We forecast the following total annual revenue from regulated sports betting in Indiana over the first five full years of operation under two scenarios. In the first scenario, we assumed that retail (i.e., in-person bets) and mobile (i.e., remote bets) wagering would be authorized. Under the second scenario, meanwhile, we assumed that only retail wagering would be authorized. Critically, we believe that mobile sports betting represents more than half of the total revenue potential of the Indiana market. We further believe that a market limited to retail wagering would decline after year three thanks to increasing consumer preference for mobile betting. At peak, we estimate that a retail-only market would achieve about 46% of the potential size of an unrestricted Indiana sports betting market in revenue terms.
Table: Total Annual Revenue From Regulated Sports Betting, First Five Full Years Of Operation
Sc. 1: Retail + Mobile Sc. 2: Retail Only Difference (Sc. 1 - Sc. 2)
Year 1 $56.2mm $30.1mm $26.1mm
Year 2 $168.5mm $90.1mm $78.4mm
Year 3 $224.6mm $120.2mm $104.4mm
Year 4 $243.9mm $108.1mm $135.8mm
Year 5 $256.1mm $102.1mm $154.0mm
Table Source: Eilers & Krejcik Gaming, LLC
EXECUTIVE SUMMARY
4 Indiana Sports Betting Report
The forecasts reflect a baseline maturity state at Year 3 (i.e., the market has exited its rapid growth stage) and assume that all neighboring states also authorize sports betting in the near term.
In addition to the above base case forecasts, we also constructed more conservative and aggressive cases for both scenarios based on a number of key variables. Those forecasts, along with a full discussion of our underlying assumptions and methodology, are presented in Section 2 (Market Forecast).
Our forecasts are based on the performance of sports betting in various domestic and international markets, Indiana's current market for regulated gambling, Indiana's current economic conditions, and a custom survey of regional residents conducted by Eilers & Krejcik Gaming. Results of the survey are detailed in Section 3 (Demographic Study).
Macroeconomic Analyses, Estimated Economic Impacts, And Estimated Tax Impacts
We evaluated various scenarios discussed in our market forecast to address the economic impacts to the state. Below, we have provided a core estimate of those impacts that 1) utilizes our base case market forecast (retail + mobile scenario, presented above) and 2) assumes sports betting expansion in Indiana is implemented in accordance with the licensing and tax provisions of Rep. Morrison’s H 1325 (2018). According to that bill:
• Operator licensure would be limited to the state’s 13 commercial casinos
• Casinos would be eligible to offer retail betting, as well as mobile betting
• Casinos would be required to pay a $75,000 initial license fee, along with $5,000 annual administrative fees
• Interactive platform providers would be required to pay a $10,000 initial license fee, along with $5,000annual fees
• Sports betting gross gaming revenue would be taxed at a flat 9.25% rate
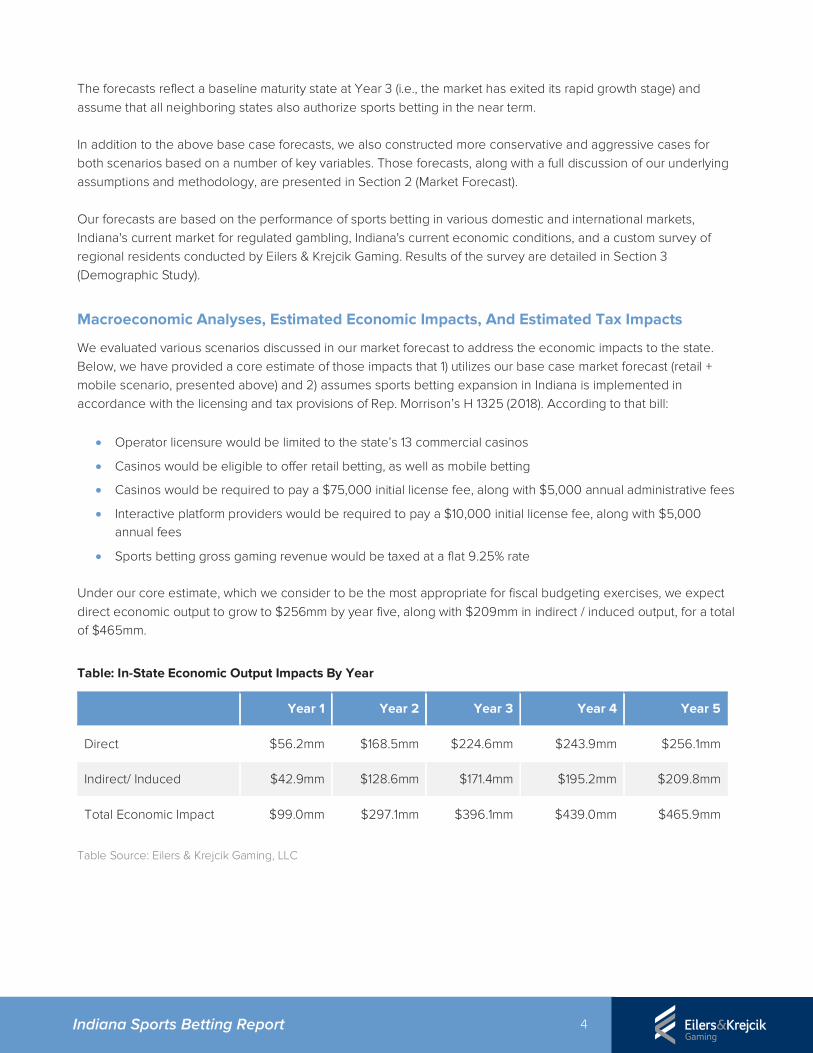
Under our core estimate, which we consider to be the most appropriate for fiscal budgeting exercises, we expect direct economic output to grow to $256mm by year five, along with $209mm in indirect / induced output, for a total of $465mm.
Table: In-State Economic Output Impacts By Year
Year 1 Year 2 Year 3 Year 4 Year 5
Direct $56.2mm $168.5mm $224.6mm $243.9mm $256.1mm
Indirect/ Induced $42.9mm $128.6mm $171.4mm $195.2mm $209.8mm
Total Economic Impact $99.0mm $297.1mm $396.1mm $439.0mm $465.9mm
Table Source: Eilers & Krejcik Gaming, LLC
5 Indiana Sports Betting Report
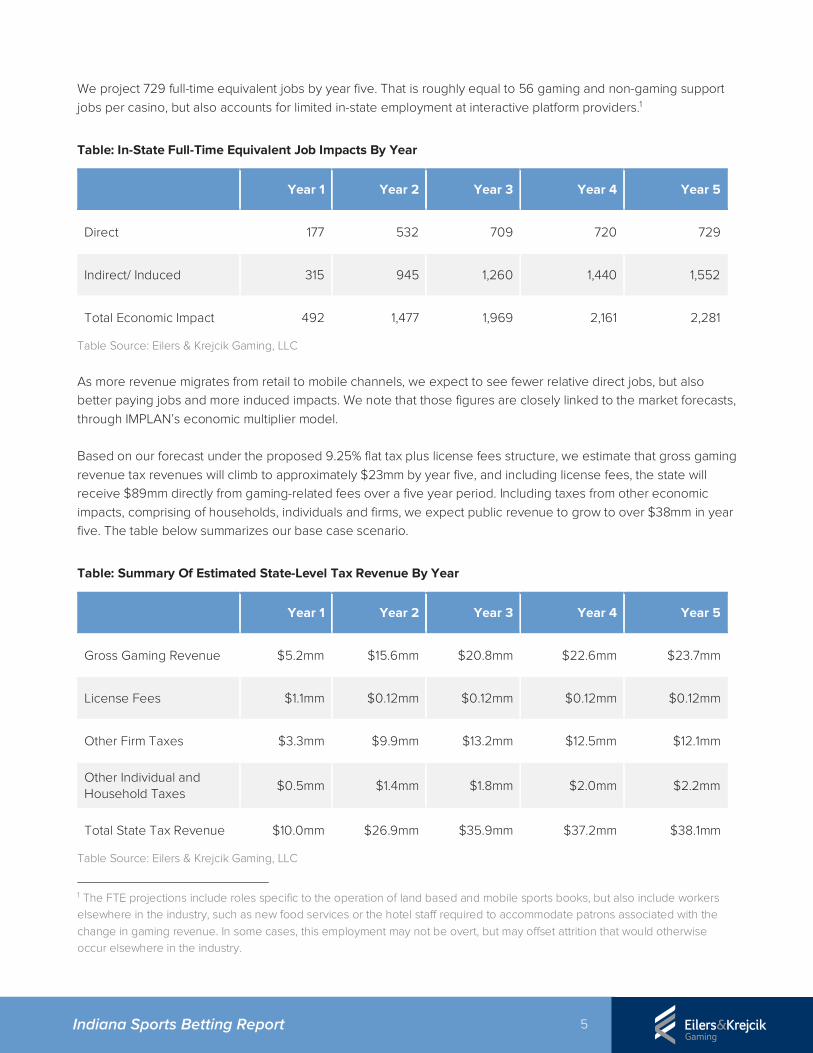
We project 729 full-time equivalent jobs by year five. That is roughly equal to 56 gaming and non-gaming support jobs per casino, but also accounts for limited in-state employment at interactive platform providers.1
Table: In-State Full-Time Equivalent Job Impacts By Year
Year 1 Year 2 Year 3 Year 4 Year 5
Direct 177 532 709 720 729
Indirect/ Induced 315 945 1,260 1,440 1,552
Total Economic Impact 492 1,477 1,969 2,161 2,281
Table Source: Eilers & Krejcik Gaming, LLC
As more revenue migrates from retail to mobile channels, we expect to see fewer relative direct jobs, but also better paying jobs and more induced impacts. We note that those figures are closely linked to the market forecasts, through IMPLAN’s economic multiplier model.
Based on our forecast under the proposed 9.25% flat tax plus license fees structure, we estimate that gross gaming revenue tax revenues will climb to approximately $23mm by year five, and including license fees, the state will receive $89mm directly from gaming-related fees over a five year period. Including taxes from other economic impacts, comprising of households, individuals and firms, we expect public revenue to grow to over $38mm in year five. The table below summarizes our base case scenario.
Table: Summary Of Estimated State-Level Tax Revenue By Year
Year 1 Year 2 Year 3 Year 4 Year 5
Gross Gaming Revenue $5.2mm $15.6mm $20.8mm $22.6mm $23.7mm
License Fees $1.1mm $0.12mm $0.12mm $0.12mm $0.12mm
Other Firm Taxes $3.3mm $9.9mm $13.2mm $12.5mm $12.1mm
Other Individual and Household Taxes
$0.5mm $1.4mm $1.8mm $2.0mm $2.2mm
Total State Tax Revenue $10.0mm $26.9mm $35.9mm $37.2mm $38.1mm
Table Source: Eilers & Krejcik Gaming, LLC
1 The FTE projections include roles specific to the operation of land based and mobile sports books, but also include workers elsewhere in the industry, such as new food services or the hotel staff required to accommodate patrons associated with the change in gaming revenue. In some cases, this employment may not be overt, but may offset attrition that would otherwise occur elsewhere in the industry.
6 Indiana Sports Betting Report
A comprehensive estimate of economic impacts under our retail-only base case scenario can be found in Appendix C of this report.
Policy Considerations
The bulk of the report focuses on a comprehensive assessment of the major policy decisions facing Indiana as it considers regulated sports betting.
• Section 5 (Key Policy Considerations) summarizes core issues related to sports betting regulation, captures the position of other states on those issues, and analyzes the implications for Indiana's market arising from each decision.
• Section 6 (Black Market Capture) takes a deeper dive into the topic of how the regulated market can effectively capture the maximum amount of demand currently flowing to black market sports betting operators.
• Section 7 (Responsible Gaming) provides additional detail on the emerging framework accompanying the spread of regulated sports betting in the U.S. market.
• Section 8 (Case Studies) investigates the New Jersey and Nevada sports betting and online gambling markets for lessons that Indiana can apply to its sports betting market.
• Section 9 (Impacts On Other Forms Of Betting) draws upon our survey and existing research to provide analysis of how regulated sports betting will intersect with Indiana's existing regulated gambling verticals.
• Section 10 (Impacts Of Delaying Sports Betting) provides a pro / con analysis of pushing legislative action on sports betting into a future session.
7 Indiana Sports Betting Report
Table Of Contents
1. MARKET OVERVIEW………………………………………………………………………………………………………….8
2. INDIANA MARKET FORECAST……………………………………………………………………………………….12
3. INDIANA SPORTS BETTING DEMOGRAPHIC STUDY……………………………………………….25
4. MACROECONOMIC ANALYSES……………………………………………………………………………………41
5a. KEY POLICY CONSIDERATIONS: INTRODUCTION………………………………………………...55
5b. KEY POLICY CONSIDERATIONS: DISTRIBUTION MODEL…………………………………….56
5c. KEY POLICY CONSIDERATIONS: REGULATION OF SKINS……………………………………60
5d. KEY POLICY CONSIDERATIONS: LIMITING BETTING MARKETS………………………….65
5e. KEY POLICY CONSIDERATIONS: DATA SOURCES………………………………………………..70
5f. KEY POLICY CONSIDERATIONS: ROYALTY OR INTEGRITY FEES……………………….75
5g. KEY POLICY CONSIDERATIONS: TAX RATE…………………………………………………………..80
5h. KEY POLICY CONSIDERATIONS: LICENSING FEE…………………………………………………86
5i. OTHER KEY POLICY CONSIDERATIONS…………………………………………………………………..91
5j. KEY POLICY CONSIDERATIONS: SUMMARY TABLE………………………………………………95
6. IN FOCUS: BLACK MARKET CAPTURE RATE……………………………………………………………97
7. IN FOCUS: RESPONSIBLE GAMING…………………………………………………………………………..108
8a. CASE STUDY: NEVADA SPORTS BETTING…………………………………………………………….115
8b. CASE STUDY: NEW JERSEY ONLINE GAMBLING…………………………………………………119
9. IMPACT OF SPORTS BETTING ON CHARITABLE GAMING, LOTTERIES AND
CASINOS IN INDIANA………………………………………………………………………………………………………123
10. RISK-REWARD ANALYSIS OF DELAYING SPORTS BETTING LEGISLATION…….127
APPENDICES A-E……………………………………………………………………………………………………………..130
ABOUT US / PROJECT TEAM BIOGRAPHIES………………………………………………………………140
8 Indiana Sports Betting Report
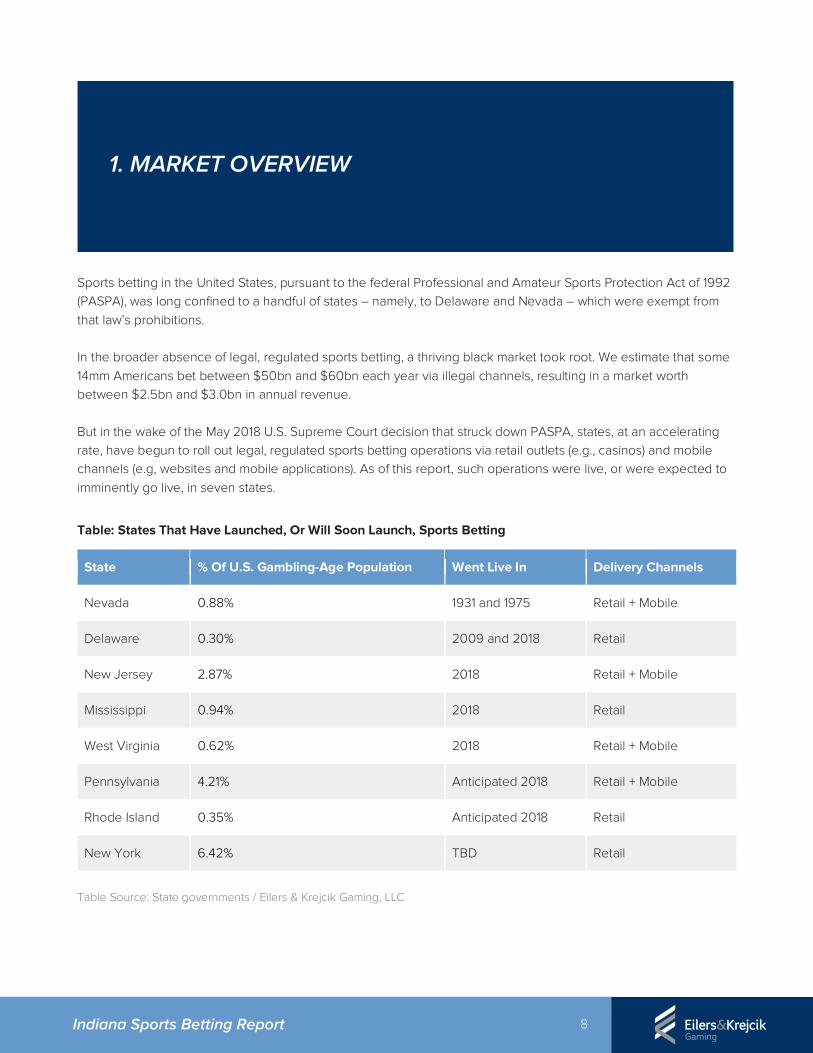
Sports betting in the United States, pursuant to the federal Professional and Amateur Sports Protection Act of 1992 (PASPA), was long confined to a handful of states – namely, to Delaware and Nevada – which were exempt from that law’s prohibitions. In the broader absence of legal, regulated sports betting, a thriving black market took root. We estimate that some 14mm Americans bet between $50bn and $60bn each year via illegal channels, resulting in a market worth between $2.5bn and $3.0bn in annual revenue. But in the wake of the May 2018 U.S. Supreme Court decision that struck down PASPA, states, at an accelerating rate, have begun to roll out legal, regulated sports betting operations via retail outlets (e.g., casinos) and mobile channels (e.g, websites and mobile applications). As of this report, such operations were live, or were expected to imminently go live, in seven states.
Table: States That Have Launched, Or Will Soon Launch, Sports Betting
State % Of U.S. Gambling-Age Population Went Live In Delivery Channels
Nevada 0.88% 1931 and 1975 Retail + Mobile
Delaware 0.30% 2009 and 2018 Retail
New Jersey 2.87% 2018 Retail + Mobile
Mississippi 0.94% 2018 Retail
West Virginia 0.62% 2018 Retail + Mobile
Pennsylvania 4.21% Anticipated 2018 Retail + Mobile
Rhode Island 0.35% Anticipated 2018 Retail
New York 6.42% TBD Retail
Table Source: State governments / Eilers & Krejcik Gaming, LLC
1. MARKET OVERVIEW
9 Indiana Sports Betting Report
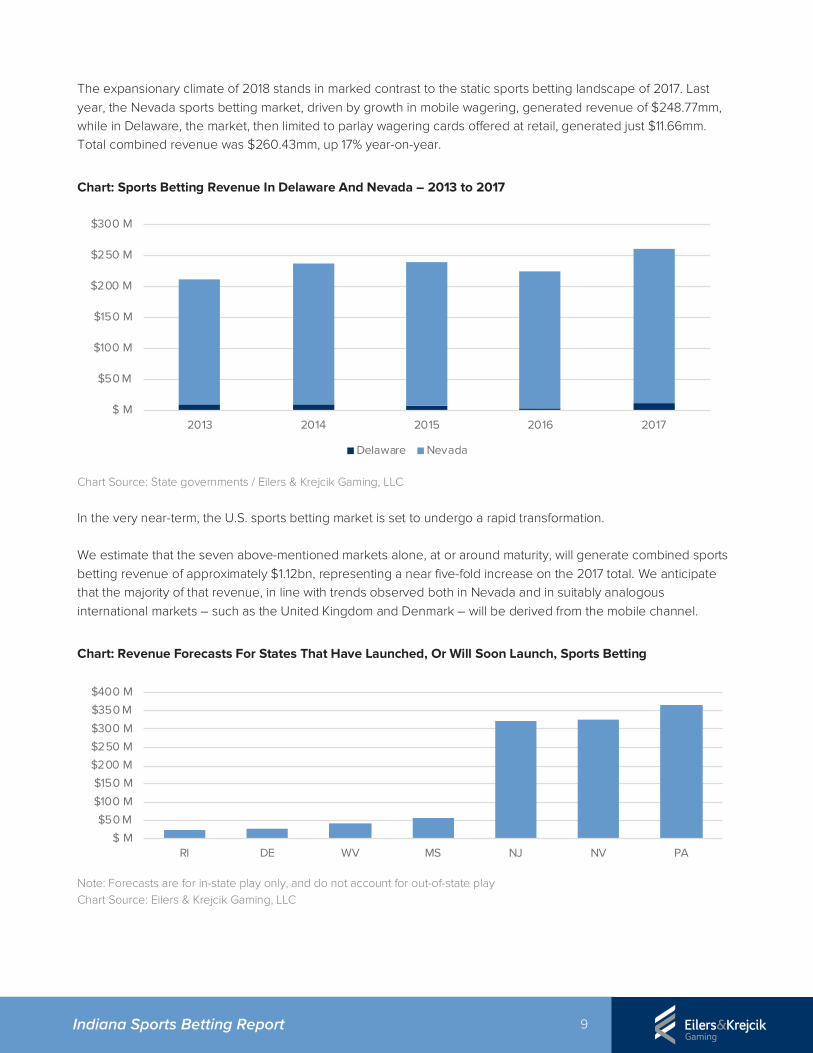
The expansionary climate of 2018 stands in marked contrast to the static sports betting landscape of 2017. Last year, the Nevada sports betting market, driven by growth in mobile wagering, generated revenue of $248.77mm, while in Delaware, the market, then limited to parlay wagering cards offered at retail, generated just $11.66mm. Total combined revenue was $260.43mm, up 17% year-on-year.
Chart: Sports Betting Revenue In Delaware And Nevada – 2013 to 2017
Chart Source: State governments / Eilers & Krejcik Gaming, LLC In the very near-term, the U.S. sports betting market is set to undergo a rapid transformation. We estimate that the seven above-mentioned markets alone, at or around maturity, will generate combined sports betting revenue of approximately $1.12bn, representing a near five-fold increase on the 2017 total. We anticipate that the majority of that revenue, in line with trends observed both in Nevada and in suitably analogous international markets – such as the United Kingdom and Denmark – will be derived from the mobile channel.
Chart: Revenue Forecasts For States That Have Launched, Or Will Soon Launch, Sports Betting
Note: Forecasts are for in-state play only, and do not account for out-of-state play Chart Source: Eilers & Krejcik Gaming, LLC
$ M
$50 M
$100 M
$150 M
$200 M
$250 M
$300 M
2013 2014 2015 2016 2017
Delaware Nevada
$ M
$50 M
$100 M
$150 M
$200 M
$250 M
$300 M
$350 M
$400 M
RI DE WV MS NJ NV PA
10 Indiana Sports Betting Report
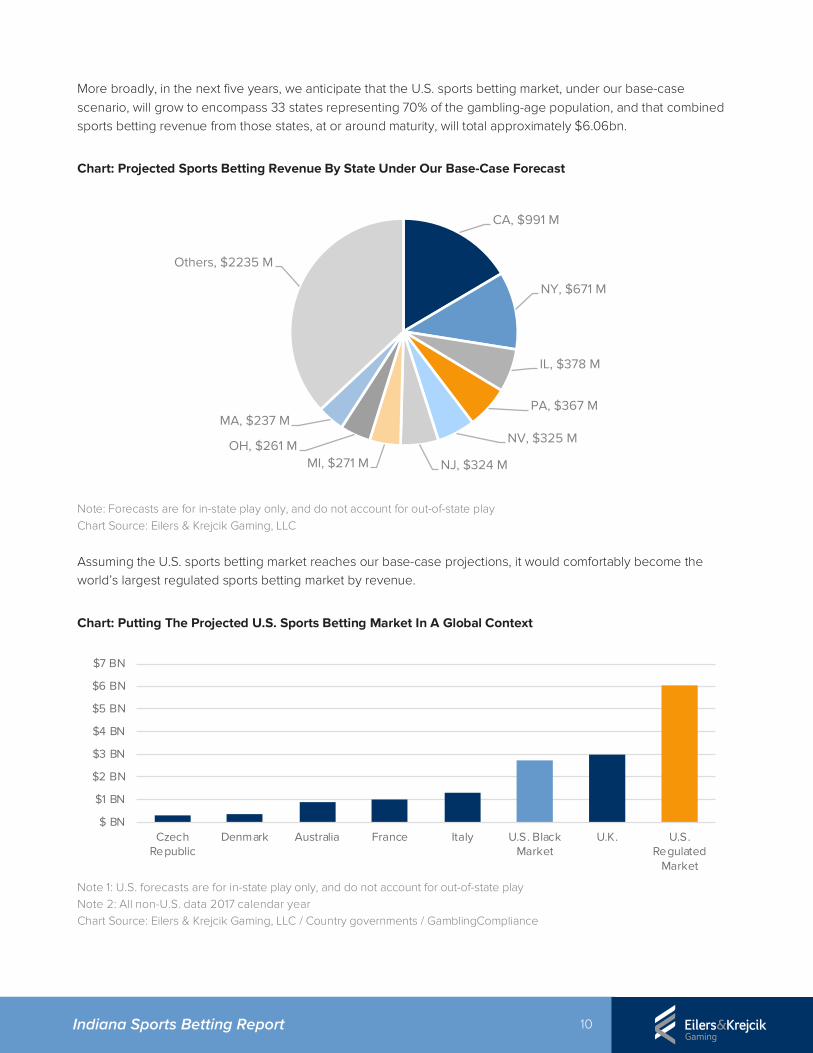
More broadly, in the next five years, we anticipate that the U.S. sports betting market, under our base-case scenario, will grow to encompass 33 states representing 70% of the gambling-age population, and that combined sports betting revenue from those states, at or around maturity, will total approximately $6.06bn.
Chart: Projected Sports Betting Revenue By State Under Our Base-Case Forecast
Note: Forecasts are for in-state play only, and do not account for out-of-state play Chart Source: Eilers & Krejcik Gaming, LLC
Assuming the U.S. sports betting market reaches our base-case projections, it would comfortably become the world’s largest regulated sports betting market by revenue.
Chart: Putting The Projected U.S. Sports Betting Market In A Global Context
Note 1: U.S. forecasts are for in-state play only, and do not account for out-of-state play Note 2: All non-U.S. data 2017 calendar year Chart Source: Eilers & Krejcik Gaming, LLC / Country governments / GamblingCompliance
CA, $991 M
NY, $671 M
IL, $378 M
PA, $367 M
NV, $325 M
NJ, $324 MMI, $271 MOH, $261 M
MA, $237 M
Others, $2235 M
$ BN
$1 BN
$2 BN
$3 BN
$4 BN
$5 BN
$6 BN
$7 BN
CzechRepublic
Denmark Australia France Italy U.S. BlackMarket
U.K. U.S.Regulated
Market
11 Indiana Sports Betting Report
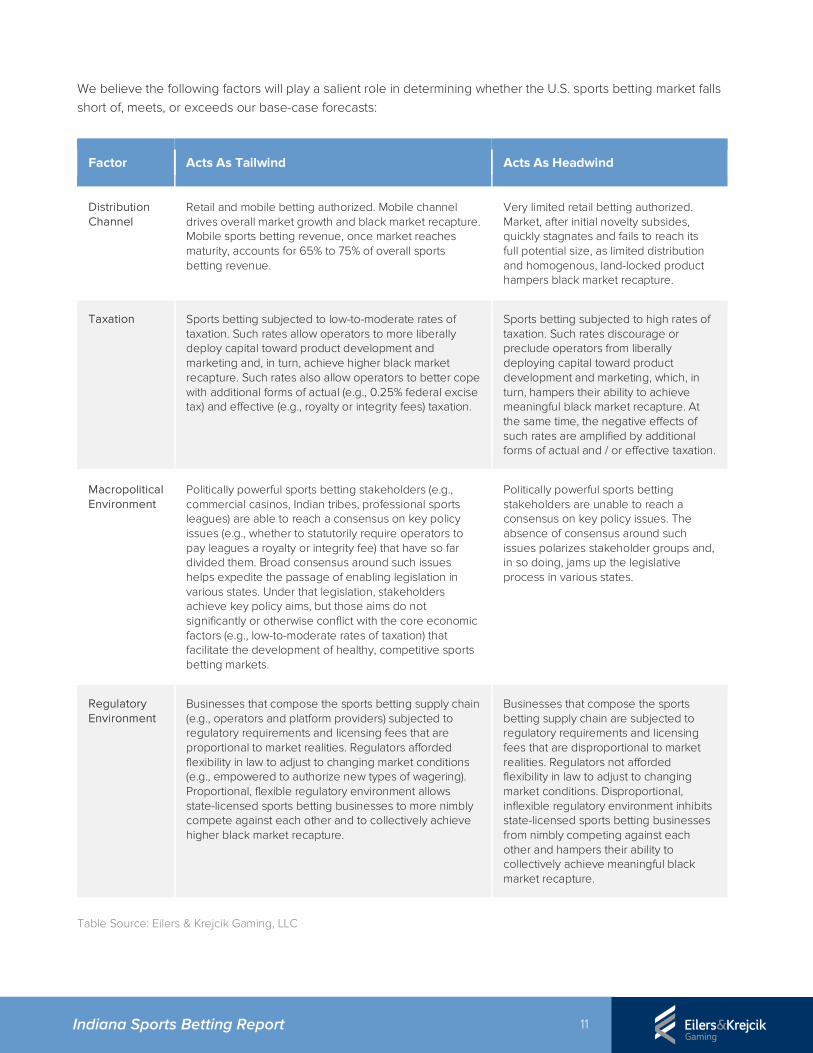
We believe the following factors will play a salient role in determining whether the U.S. sports betting market falls short of, meets, or exceeds our base-case forecasts:
Factor Acts As Tailwind Acts As Headwind
Distribution Channel
Retail and mobile betting authorized. Mobile channel drives overall market growth and black market recapture. Mobile sports betting revenue, once market reaches maturity, accounts for 65% to 75% of overall sports betting revenue.
Very limited retail betting authorized. Market, after initial novelty subsides, quickly stagnates and fails to reach its full potential size, as limited distribution and homogenous, land-locked product hampers black market recapture.
Taxation Sports betting subjected to low-to-moderate rates of taxation. Such rates allow operators to more liberally deploy capital toward product development and marketing and, in turn, achieve higher black market recapture. Such rates also allow operators to better cope with additional forms of actual (e.g., 0.25% federal excise tax) and effective (e.g., royalty or integrity fees) taxation.
Sports betting subjected to high rates of taxation. Such rates discourage or preclude operators from liberally deploying capital toward product development and marketing, which, in turn, hampers their ability to achieve meaningful black market recapture. At the same time, the negative effects of such rates are amplified by additional forms of actual and / or effective taxation.
Macropolitical Environment
Politically powerful sports betting stakeholders (e.g., commercial casinos, Indian tribes, professional sports leagues) are able to reach a consensus on key policy issues (e.g., whether to statutorily require operators to pay leagues a royalty or integrity fee) that have so far divided them. Broad consensus around such issues helps expedite the passage of enabling legislation in various states. Under that legislation, stakeholders achieve key policy aims, but those aims do not significantly or otherwise conflict with the core economic factors (e.g., low-to-moderate rates of taxation) that facilitate the development of healthy, competitive sports betting markets.
Politically powerful sports betting stakeholders are unable to reach a consensus on key policy issues. The absence of consensus around such issues polarizes stakeholder groups and, in so doing, jams up the legislative process in various states.
Regulatory Environment
Businesses that compose the sports betting supply chain (e.g., operators and platform providers) subjected to regulatory requirements and licensing fees that are proportional to market realities. Regulators afforded flexibility in law to adjust to changing market conditions (e.g., empowered to authorize new types of wagering). Proportional, flexible regulatory environment allows state-licensed sports betting businesses to more nimbly compete against each other and to collectively achieve higher black market recapture.
Businesses that compose the sports betting supply chain are subjected to regulatory requirements and licensing fees that are disproportional to market realities. Regulators not afforded flexibility in law to adjust to changing market conditions. Disproportional, inflexible regulatory environment inhibits state-licensed sports betting businesses from nimbly competing against each other and hampers their ability to collectively achieve meaningful black market recapture.
Table Source: Eilers & Krejcik Gaming, LLC
12 Indiana Sports Betting Report
Introduction
Most observers agree that regulated sports betting offers a material opportunity for both Indiana's gaming stakeholders and the state itself. Estimating the likely size of the opportunity is a complex exercise that involves significant amounts of uncertainty, but also a necessary exercise to ensure that policymakers can move forward with a rational framework for authorization and regulation.
In this section, we provide a five-year market size forecast for regulated sports betting in Indiana, an explanation of our forecasting methodology, and some notes and caveats regarding our forecast.
Five Year Forecast Scenario 1: Retail And Mobile Sports Betting
We estimate that an Indiana regulated sports betting market where both retail (i.e., in-person bets) and mobile (i.e., remote bets) are permitted will generate $225mm in total annual revenue at baseline maturity (i.e., when the market has completed its initial ramp up and enters a phase of more gradual growth).
We believe that the market can reach this level of total annual revenue during the third full year of operations, assuming a smooth rollout and full commitment from operators.
By "revenue," we are referring to total amount wagered by customers less total amounts paid out to winning customers. Our report does not consider or address the question of operator profit. We do consider the question of the economic return to the state in Section 4 of this report.
Critically, we believe that mobile sports betting represents more than half of the total revenue potential of the Indiana market. In the table below, and throughout this report, "retail" refers to sports betting that takes place directly at a physical outlet, while "mobile" refers to sports betting that takes place over the internet from within Indiana's borders.
For the purposes of this scenario, we assume that Indiana policymakers adopt tax and license fees similar to the structure provided in Rep. Morrison’s H 1325 (2018) and take a similar approach to New Jersey on other key policy and regulatory questions.
2. INDIANA MARKET FORECAST
13 Indiana Sports Betting Report
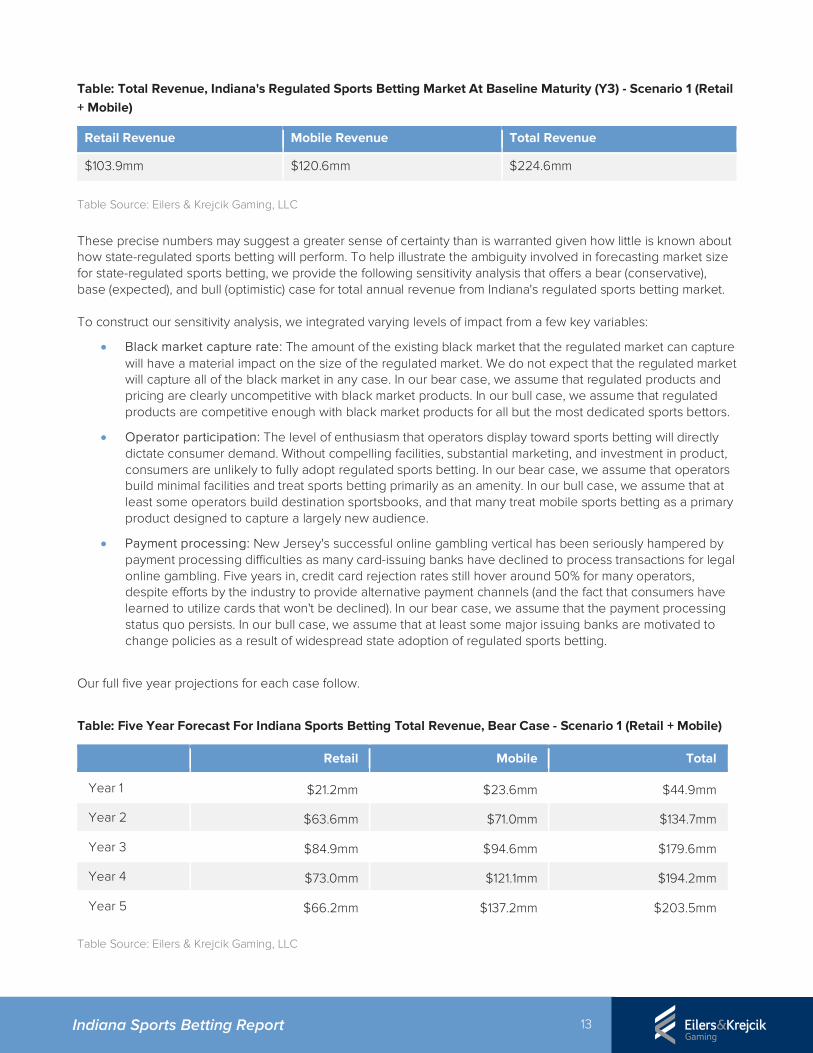
Table: Total Revenue, Indiana's Regulated Sports Betting Market At Baseline Maturity (Y3) - Scenario 1 (Retail + Mobile)
Retail Revenue Mobile Revenue Total Revenue
$103.9mm $120.6mm $224.6mm
Table Source: Eilers & Krejcik Gaming, LLC
These precise numbers may suggest a greater sense of certainty than is warranted given how little is known about how state-regulated sports betting will perform. To help illustrate the ambiguity involved in forecasting market size for state-regulated sports betting, we provide the following sensitivity analysis that offers a bear (conservative), base (expected), and bull (optimistic) case for total annual revenue from Indiana's regulated sports betting market. To construct our sensitivity analysis, we integrated varying levels of impact from a few key variables:
• Black market capture rate: The amount of the existing black market that the regulated market can capture will have a material impact on the size of the regulated market. We do not expect that the regulated market will capture all of the black market in any case. In our bear case, we assume that regulated products and pricing are clearly uncompetitive with black market products. In our bull case, we assume that regulated products are competitive enough with black market products for all but the most dedicated sports bettors.
• Operator participation: The level of enthusiasm that operators display toward sports betting will directly dictate consumer demand. Without compelling facilities, substantial marketing, and investment in product, consumers are unlikely to fully adopt regulated sports betting. In our bear case, we assume that operators build minimal facilities and treat sports betting primarily as an amenity. In our bull case, we assume that at least some operators build destination sportsbooks, and that many treat mobile sports betting as a primary product designed to capture a largely new audience.
• Payment processing: New Jersey's successful online gambling vertical has been seriously hampered by payment processing difficulties as many card-issuing banks have declined to process transactions for legal online gambling. Five years in, credit card rejection rates still hover around 50% for many operators, despite efforts by the industry to provide alternative payment channels (and the fact that consumers have learned to utilize cards that won't be declined). In our bear case, we assume that the payment processing status quo persists. In our bull case, we assume that at least some major issuing banks are motivated to change policies as a result of widespread state adoption of regulated sports betting.
Our full five year projections for each case follow.
Table: Five Year Forecast For Indiana Sports Betting Total Revenue, Bear Case - Scenario 1 (Retail + Mobile)
Retail Mobile Total
Year 1 $21.2mm $23.6mm $44.9mm
Year 2 $63.6mm $71.0mm $134.7mm
Year 3 $84.9mm $94.6mm $179.6mm
Year 4 $73.0mm $121.1mm $194.2mm
Year 5 $66.2mm $137.2mm $203.5mm Table Source: Eilers & Krejcik Gaming, LLC
14 Indiana Sports Betting Report
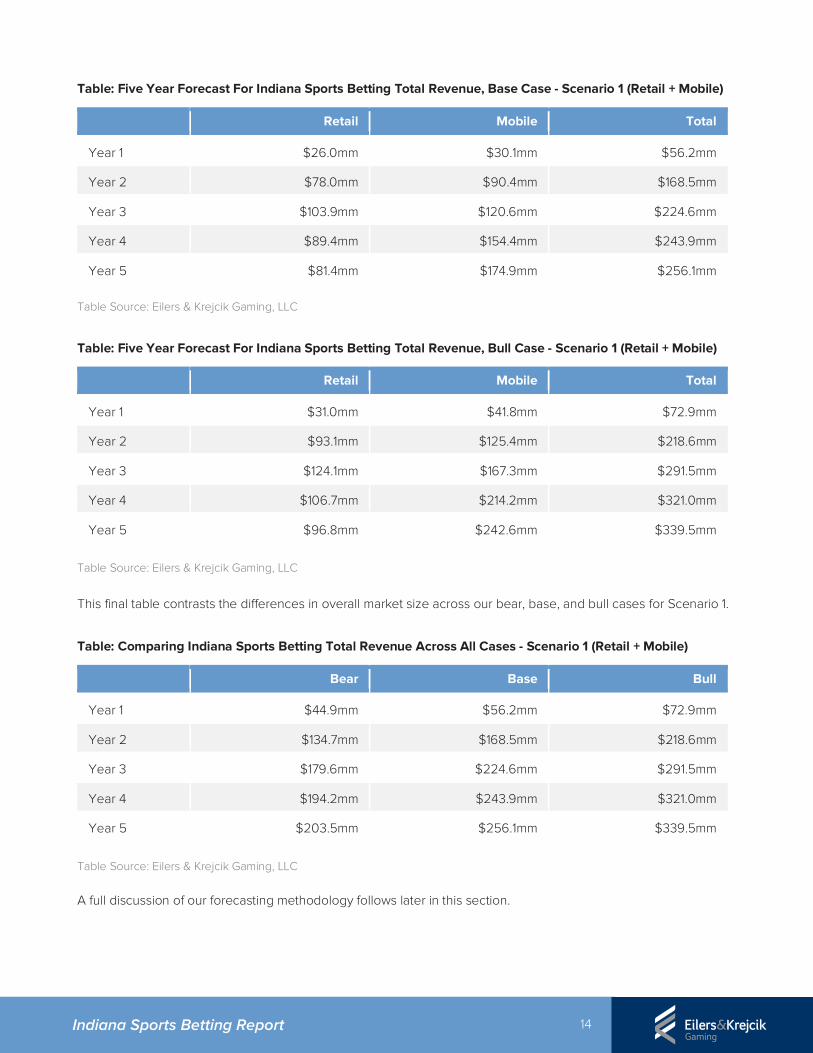
Table: Five Year Forecast For Indiana Sports Betting Total Revenue, Base Case - Scenario 1 (Retail + Mobile)
Retail Mobile Total
Year 1 $26.0mm $30.1mm $56.2mm
Year 2 $78.0mm $90.4mm $168.5mm
Year 3 $103.9mm $120.6mm $224.6mm
Year 4 $89.4mm $154.4mm $243.9mm
Year 5 $81.4mm $174.9mm $256.1mm Table Source: Eilers & Krejcik Gaming, LLC
Table: Five Year Forecast For Indiana Sports Betting Total Revenue, Bull Case - Scenario 1 (Retail + Mobile)
Retail Mobile Total
Year 1 $31.0mm $41.8mm $72.9mm
Year 2 $93.1mm $125.4mm $218.6mm
Year 3 $124.1mm $167.3mm $291.5mm
Year 4 $106.7mm $214.2mm $321.0mm
Year 5 $96.8mm $242.6mm $339.5mm
Table Source: Eilers & Krejcik Gaming, LLC
This final table contrasts the differences in overall market size across our bear, base, and bull cases for Scenario 1.
Table: Comparing Indiana Sports Betting Total Revenue Across All Cases - Scenario 1 (Retail + Mobile)
Bear Base Bull
Year 1 $44.9mm $56.2mm $72.9mm
Year 2 $134.7mm $168.5mm $218.6mm
Year 3 $179.6mm $224.6mm $291.5mm
Year 4 $194.2mm $243.9mm $321.0mm
Year 5 $203.5mm $256.1mm $339.5mm
Table Source: Eilers & Krejcik Gaming, LLC
A full discussion of our forecasting methodology follows later in this section.
15 Indiana Sports Betting Report
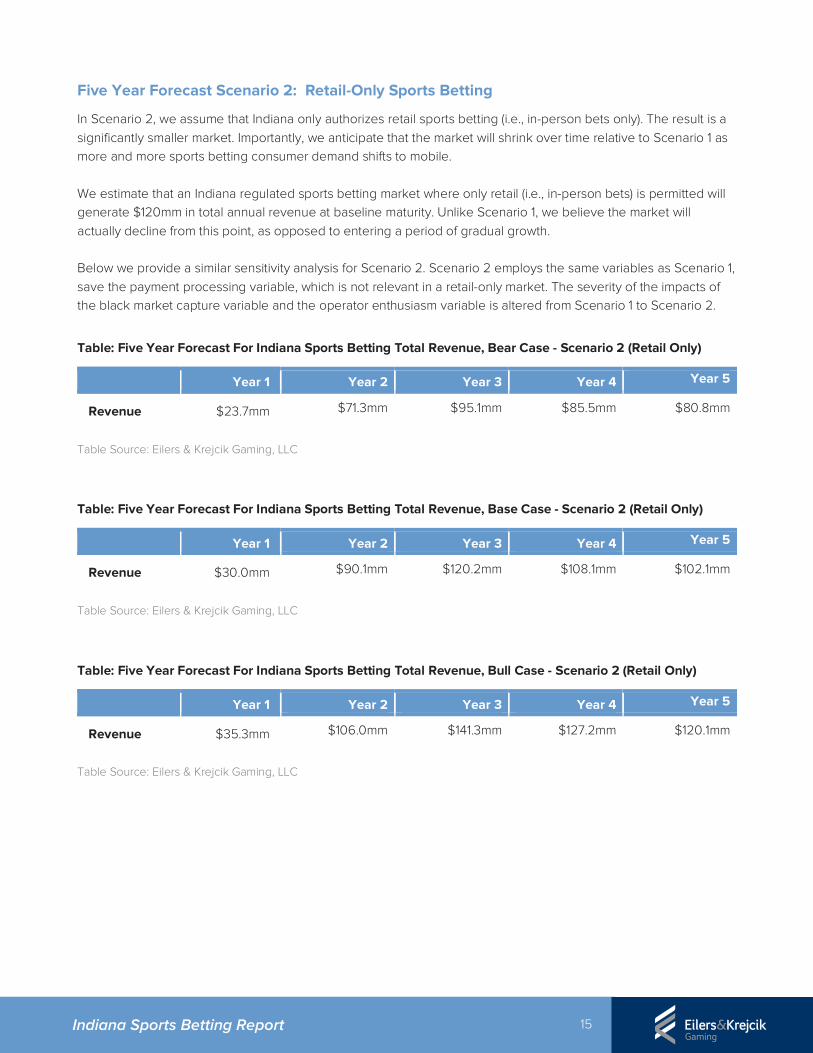
Five Year Forecast Scenario 2: Retail-Only Sports Betting
In Scenario 2, we assume that Indiana only authorizes retail sports betting (i.e., in-person bets only). The result is a significantly smaller market. Importantly, we anticipate that the market will shrink over time relative to Scenario 1 as more and more sports betting consumer demand shifts to mobile. We estimate that an Indiana regulated sports betting market where only retail (i.e., in-person bets) is permitted will generate $120mm in total annual revenue at baseline maturity. Unlike Scenario 1, we believe the market will actually decline from this point, as opposed to entering a period of gradual growth. Below we provide a similar sensitivity analysis for Scenario 2. Scenario 2 employs the same variables as Scenario 1, save the payment processing variable, which is not relevant in a retail-only market. The severity of the impacts of the black market capture variable and the operator enthusiasm variable is altered from Scenario 1 to Scenario 2.
Table: Five Year Forecast For Indiana Sports Betting Total Revenue, Bear Case - Scenario 2 (Retail Only)
Year 1 Year 2 Year 3 Year 4 Year 5
Revenue $23.7mm $71.3mm $95.1mm $85.5mm $80.8mm
Table Source: Eilers & Krejcik Gaming, LLC
Table: Five Year Forecast For Indiana Sports Betting Total Revenue, Base Case - Scenario 2 (Retail Only)
Year 1 Year 2 Year 3 Year 4 Year 5
Revenue $30.0mm $90.1mm $120.2mm $108.1mm $102.1mm
Table Source: Eilers & Krejcik Gaming, LLC
Table: Five Year Forecast For Indiana Sports Betting Total Revenue, Bull Case - Scenario 2 (Retail Only)
Year 1 Year 2 Year 3 Year 4 Year 5
Revenue $35.3mm $106.0mm $141.3mm $127.2mm $120.1mm
Table Source: Eilers & Krejcik Gaming, LLC
16 Indiana Sports Betting Report
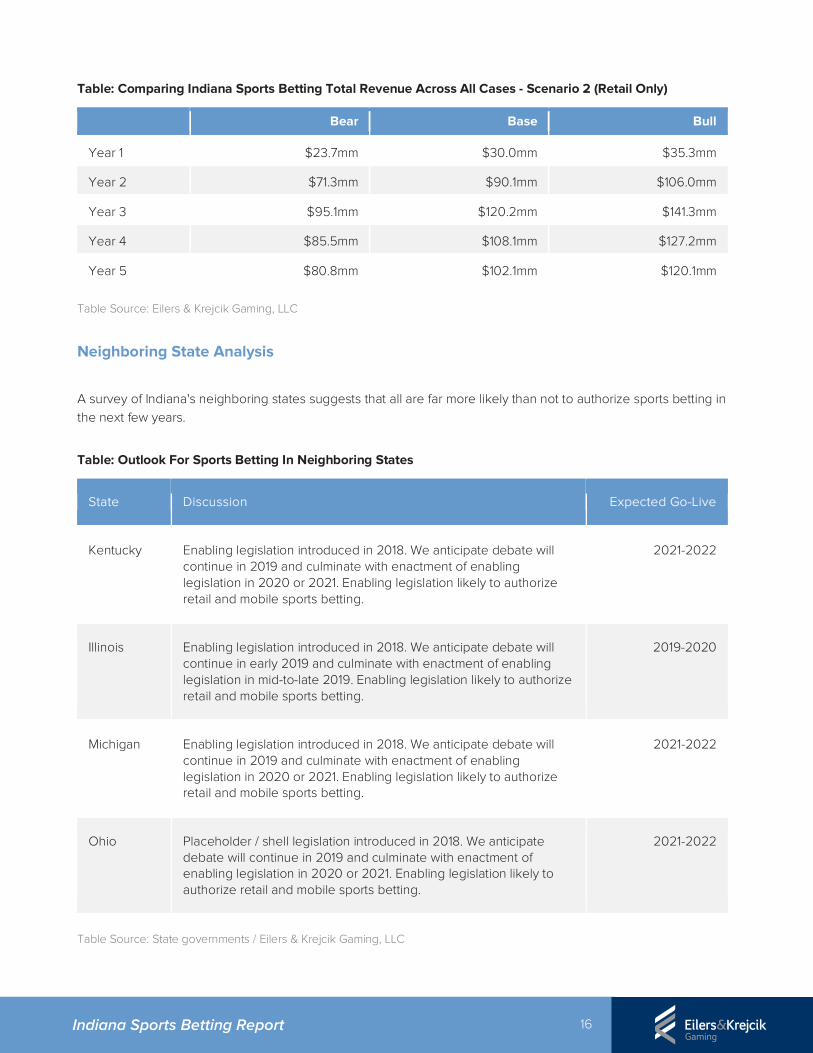
Table: Comparing Indiana Sports Betting Total Revenue Across All Cases - Scenario 2 (Retail Only)
Bear Base Bull
Year 1 $23.7mm $30.0mm $35.3mm
Year 2 $71.3mm $90.1mm $106.0mm
Year 3 $95.1mm $120.2mm $141.3mm
Year 4 $85.5mm $108.1mm $127.2mm
Year 5 $80.8mm $102.1mm $120.1mm Table Source: Eilers & Krejcik Gaming, LLC
Neighboring State Analysis
A survey of Indiana's neighboring states suggests that all are far more likely than not to authorize sports betting in the next few years.
Table: Outlook For Sports Betting In Neighboring States
State Discussion Expected Go-Live
Kentucky Enabling legislation introduced in 2018. We anticipate debate will continue in 2019 and culminate with enactment of enabling legislation in 2020 or 2021. Enabling legislation likely to authorize retail and mobile sports betting.
2021-2022
Illinois Enabling legislation introduced in 2018. We anticipate debate will continue in early 2019 and culminate with enactment of enabling legislation in mid-to-late 2019. Enabling legislation likely to authorize retail and mobile sports betting.
2019-2020
Michigan Enabling legislation introduced in 2018. We anticipate debate will continue in 2019 and culminate with enactment of enabling legislation in 2020 or 2021. Enabling legislation likely to authorize retail and mobile sports betting.
2021-2022
Ohio Placeholder / shell legislation introduced in 2018. We anticipate debate will continue in 2019 and culminate with enactment of enabling legislation in 2020 or 2021. Enabling legislation likely to authorize retail and mobile sports betting.
2021-2022
Table Source: State governments / Eilers & Krejcik Gaming, LLC
17 Indiana Sports Betting Report
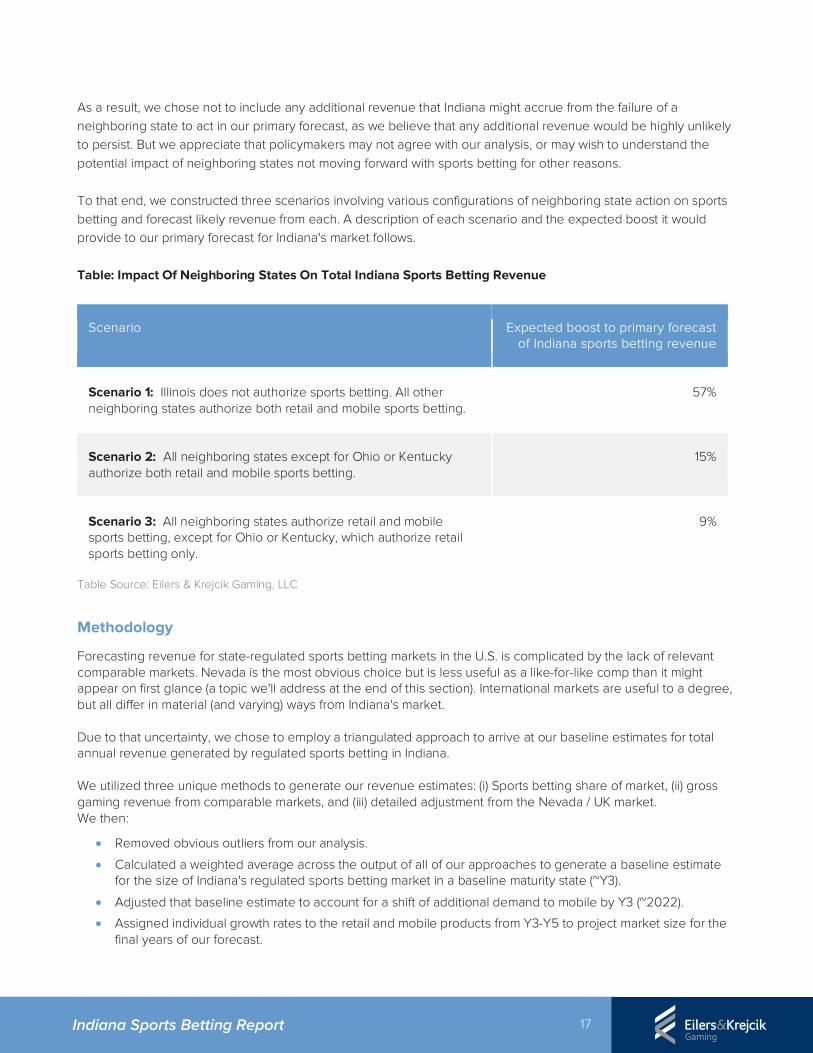
As a result, we chose not to include any additional revenue that Indiana might accrue from the failure of a neighboring state to act in our primary forecast, as we believe that any additional revenue would be highly unlikely to persist. But we appreciate that policymakers may not agree with our analysis, or may wish to understand the potential impact of neighboring states not moving forward with sports betting for other reasons. To that end, we constructed three scenarios involving various configurations of neighboring state action on sports betting and forecast likely revenue from each. A description of each scenario and the expected boost it would provide to our primary forecast for Indiana's market follows. Table: Impact Of Neighboring States On Total Indiana Sports Betting Revenue
Scenario Expected boost to primary forecast of Indiana sports betting revenue
Scenario 1: Illinois does not authorize sports betting. All other neighboring states authorize both retail and mobile sports betting.
57%
Scenario 2: All neighboring states except for Ohio or Kentucky authorize both retail and mobile sports betting.
15%
Scenario 3: All neighboring states authorize retail and mobile sports betting, except for Ohio or Kentucky, which authorize retail sports betting only.
9%
Table Source: Eilers & Krejcik Gaming, LLC
Methodology
Forecasting revenue for state-regulated sports betting markets in the U.S. is complicated by the lack of relevant comparable markets. Nevada is the most obvious choice but is less useful as a like-for-like comp than it might appear on first glance (a topic we'll address at the end of this section). International markets are useful to a degree, but all differ in material (and varying) ways from Indiana's market. Due to that uncertainty, we chose to employ a triangulated approach to arrive at our baseline estimates for total annual revenue generated by regulated sports betting in Indiana. We utilized three unique methods to generate our revenue estimates: (i) Sports betting share of market, (ii) gross gaming revenue from comparable markets, and (iii) detailed adjustment from the Nevada / UK market. We then:
• Removed obvious outliers from our analysis.
• Calculated a weighted average across the output of all of our approaches to generate a baseline estimate for the size of Indiana's regulated sports betting market in a baseline maturity state (~Y3).
• Adjusted that baseline estimate to account for a shift of additional demand to mobile by Y3 (~2022).
• Assigned individual growth rates to the retail and mobile products from Y3-Y5 to project market size for the final years of our forecast.
18 Indiana Sports Betting Report
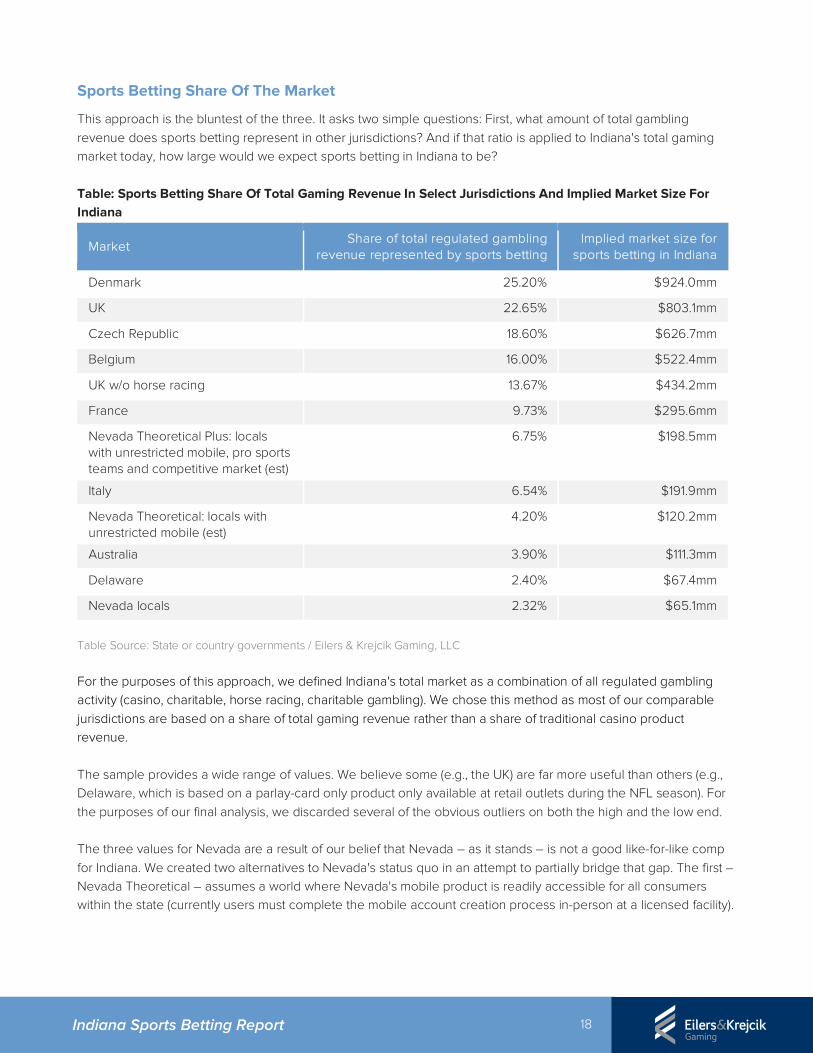
Sports Betting Share Of The Market
This approach is the bluntest of the three. It asks two simple questions: First, what amount of total gambling revenue does sports betting represent in other jurisdictions? And if that ratio is applied to Indiana's total gaming market today, how large would we expect sports betting in Indiana to be? Table: Sports Betting Share Of Total Gaming Revenue In Select Jurisdictions And Implied Market Size For Indiana
Market Share of total regulated gambling
revenue represented by sports betting Implied market size for
sports betting in Indiana
Denmark 25.20% $924.0mm
UK 22.65% $803.1mm
Czech Republic 18.60% $626.7mm
Belgium 16.00% $522.4mm
UK w/o horse racing 13.67% $434.2mm
France 9.73% $295.6mm
Nevada Theoretical Plus: locals with unrestricted mobile, pro sports teams and competitive market (est)
6.75% $198.5mm
Italy 6.54% $191.9mm
Nevada Theoretical: locals with unrestricted mobile (est)
4.20% $120.2mm
Australia 3.90% $111.3mm
Delaware 2.40% $67.4mm
Nevada locals 2.32% $65.1mm
Table Source: State or country governments / Eilers & Krejcik Gaming, LLC
For the purposes of this approach, we defined Indiana's total market as a combination of all regulated gambling activity (casino, charitable, horse racing, charitable gambling). We chose this method as most of our comparable jurisdictions are based on a share of total gaming revenue rather than a share of traditional casino product revenue. The sample provides a wide range of values. We believe some (e.g., the UK) are far more useful than others (e.g., Delaware, which is based on a parlay-card only product only available at retail outlets during the NFL season). For the purposes of our final analysis, we discarded several of the obvious outliers on both the high and the low end. The three values for Nevada are a result of our belief that Nevada – as it stands – is not a good like-for-like comp for Indiana. We created two alternatives to Nevada's status quo in an attempt to partially bridge that gap. The first – Nevada Theoretical – assumes a world where Nevada's mobile product is readily accessible for all consumers within the state (currently users must complete the mobile account creation process in-person at a licensed facility).
19 Indiana Sports Betting Report
The second – Nevada Theoretical Plus – assumes a world where Nevada's mobile product is readily accessible as described above, is competitive with mobile offerings in international markets, and where the Nevada locals market is hotly contested by multiple operators. Finally, we note that this method also provides a useful sanity check for our primary forecasts. One would reasonably expect that our forecast for Indiana would generate a share of market for sports betting that would fall in between the extremes of the sample, likely leaning toward the lower end of the spectrum. Our final primary market estimate results in sports betting representing a 7.8% share of Indiana's total gaming market.
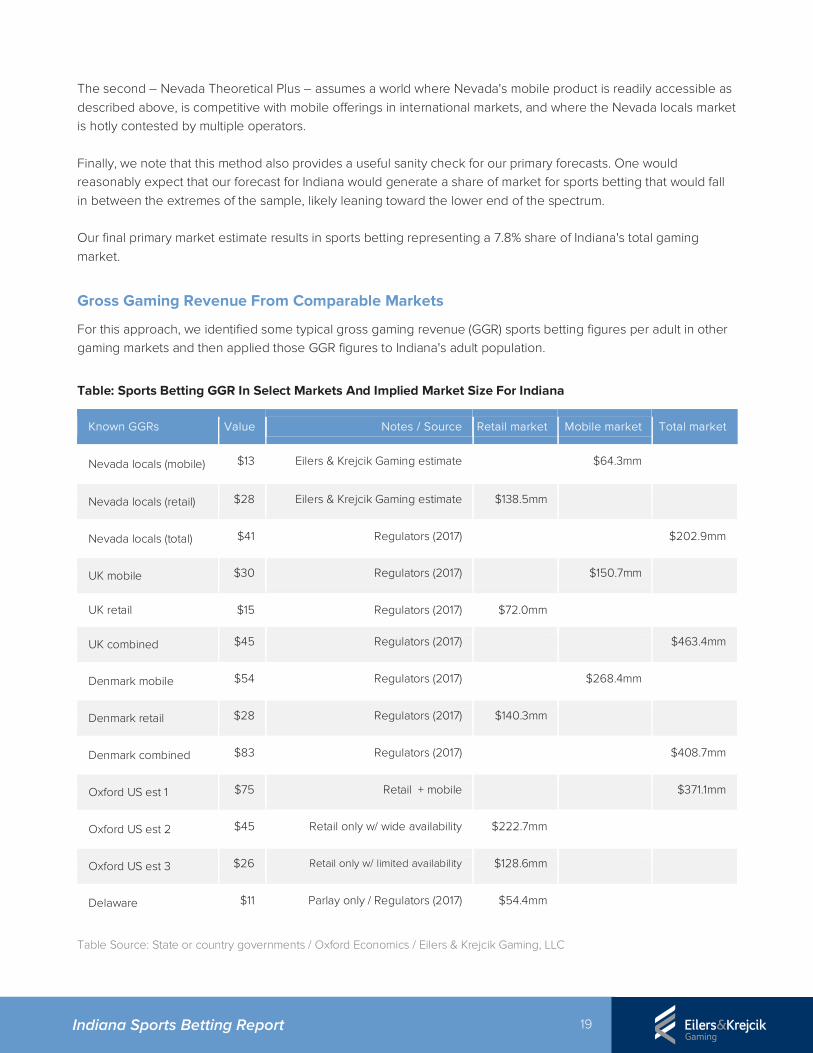
Gross Gaming Revenue From Comparable Markets
For this approach, we identified some typical gross gaming revenue (GGR) sports betting figures per adult in other gaming markets and then applied those GGR figures to Indiana's adult population.
Table: Sports Betting GGR In Select Markets And Implied Market Size For Indiana
Known GGRs Value Notes / Source Retail market Mobile market Total market
Nevada locals (mobile) $13 Eilers & Krejcik Gaming estimate $64.3mm
Nevada locals (retail) $28 Eilers & Krejcik Gaming estimate $138.5mm
Nevada locals (total) $41 Regulators (2017) $202.9mm
UK mobile $30 Regulators (2017) $150.7mm
UK retail $15 Regulators (2017) $72.0mm
UK combined $45 Regulators (2017) $463.4mm
Denmark mobile $54 Regulators (2017) $268.4mm
Denmark retail $28 Regulators (2017) $140.3mm
Denmark combined $83 Regulators (2017) $408.7mm
Oxford US est 1 $75 Retail + mobile $371.1mm
Oxford US est 2 $45 Retail only w/ wide availability $222.7mm
Oxford US est 3 $26 Retail only w/ limited availability $128.6mm
Delaware $11 Parlay only / Regulators (2017) $54.4mm
Table Source: State or country governments / Oxford Economics / Eilers & Krejcik Gaming, LLC
20 Indiana Sports Betting Report
As with the sports betting share of market approach, we discarded obvious outliers (e.g., Denmark mobile) for the purpose of our final forecast. But we do believe all GGR figures are useful in terms of providing broader context for Indiana's sports betting opportunity and have left them in the table for reference.
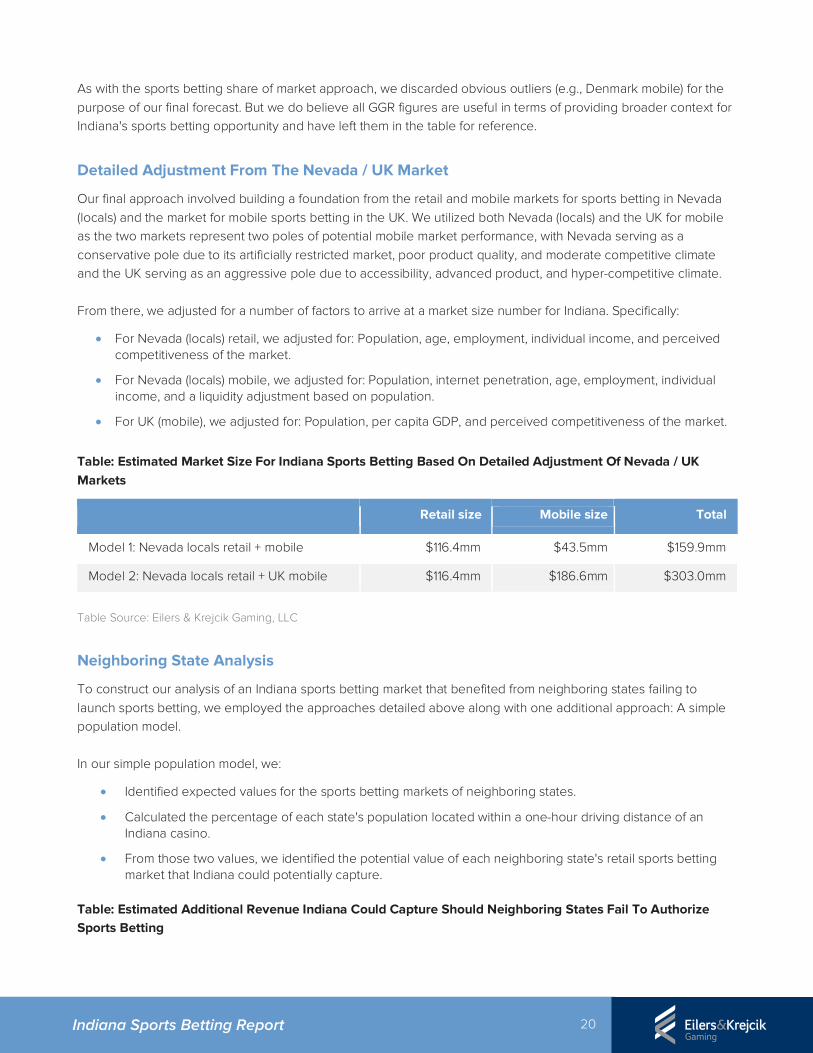
Detailed Adjustment From The Nevada / UK Market
Our final approach involved building a foundation from the retail and mobile markets for sports betting in Nevada (locals) and the market for mobile sports betting in the UK. We utilized both Nevada (locals) and the UK for mobile as the two markets represent two poles of potential mobile market performance, with Nevada serving as a conservative pole due to its artificially restricted market, poor product quality, and moderate competitive climate and the UK serving as an aggressive pole due to accessibility, advanced product, and hyper-competitive climate. From there, we adjusted for a number of factors to arrive at a market size number for Indiana. Specifically:
• For Nevada (locals) retail, we adjusted for: Population, age, employment, individual income, and perceived competitiveness of the market.
• For Nevada (locals) mobile, we adjusted for: Population, internet penetration, age, employment, individual income, and a liquidity adjustment based on population.
• For UK (mobile), we adjusted for: Population, per capita GDP, and perceived competitiveness of the market.
Table: Estimated Market Size For Indiana Sports Betting Based On Detailed Adjustment Of Nevada / UK Markets
Retail size Mobile size Total
Model 1: Nevada locals retail + mobile $116.4mm $43.5mm $159.9mm
Model 2: Nevada locals retail + UK mobile $116.4mm $186.6mm $303.0mm
Table Source: Eilers & Krejcik Gaming, LLC
Neighboring State Analysis
To construct our analysis of an Indiana sports betting market that benefited from neighboring states failing to launch sports betting, we employed the approaches detailed above along with one additional approach: A simple population model. In our simple population model, we:
• Identified expected values for the sports betting markets of neighboring states.
• Calculated the percentage of each state's population located within a one-hour driving distance of an Indiana casino.
• From those two values, we identified the potential value of each neighboring state's retail sports betting market that Indiana could potentially capture.
Table: Estimated Additional Revenue Indiana Could Capture Should Neighboring States Fail To Authorize Sports Betting
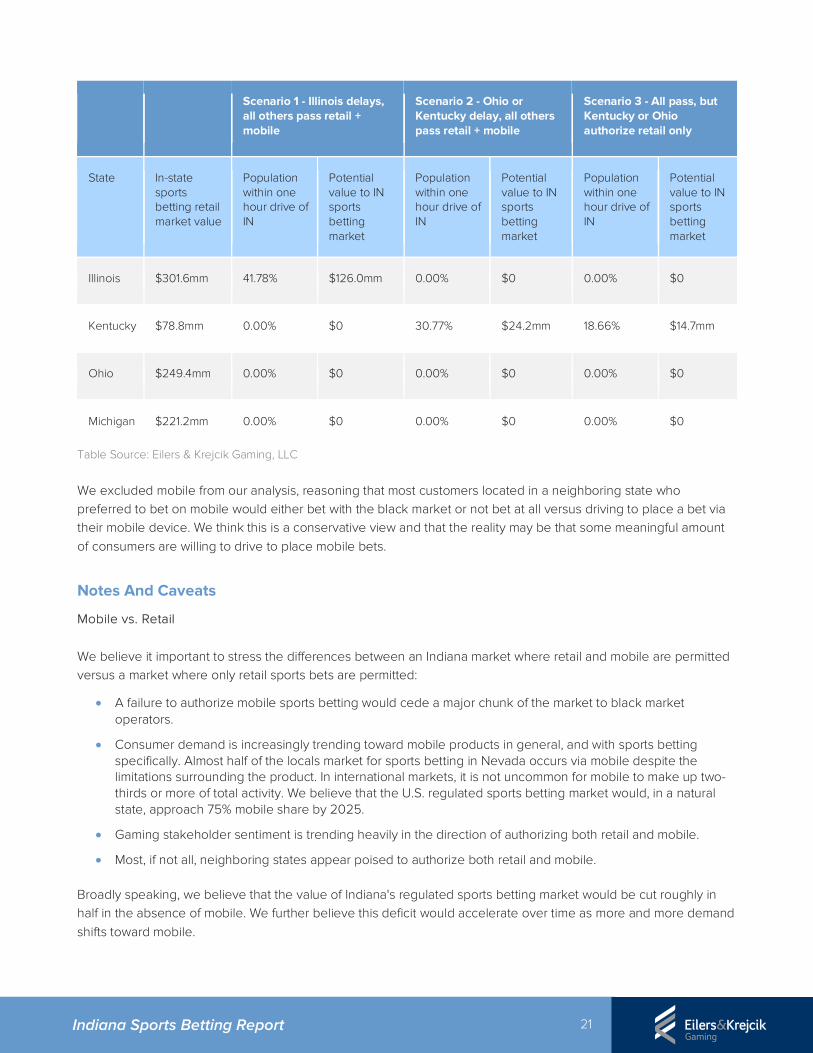
21 Indiana Sports Betting Report
Scenario 1 - Illinois delays, all others pass retail + mobile
Scenario 2 - Ohio or Kentucky delay, all others pass retail + mobile
Scenario 3 - All pass, but Kentucky or Ohio authorize retail only
State In-state sports betting retail market value
Population within one hour drive of IN
Potential value to IN sports betting market
Population within one hour drive of IN
Potential value to IN sports betting market
Population within one hour drive of IN
Potential value to IN sports betting market
Illinois $301.6mm 41.78% $126.0mm 0.00% $0 0.00% $0
Kentucky $78.8mm 0.00% $0 30.77% $24.2mm 18.66% $14.7mm
Ohio $249.4mm 0.00% $0 0.00% $0 0.00% $0
Michigan $221.2mm 0.00% $0 0.00% $0 0.00% $0
Table Source: Eilers & Krejcik Gaming, LLC We excluded mobile from our analysis, reasoning that most customers located in a neighboring state who preferred to bet on mobile would either bet with the black market or not bet at all versus driving to place a bet via their mobile device. We think this is a conservative view and that the reality may be that some meaningful amount of consumers are willing to drive to place mobile bets.
Notes And Caveats
Mobile vs. Retail We believe it important to stress the differences between an Indiana market where retail and mobile are permitted versus a market where only retail sports bets are permitted:
• A failure to authorize mobile sports betting would cede a major chunk of the market to black market operators.
• Consumer demand is increasingly trending toward mobile products in general, and with sports betting specifically. Almost half of the locals market for sports betting in Nevada occurs via mobile despite the limitations surrounding the product. In international markets, it is not uncommon for mobile to make up two-thirds or more of total activity. We believe that the U.S. regulated sports betting market would, in a natural state, approach 75% mobile share by 2025.
• Gaming stakeholder sentiment is trending heavily in the direction of authorizing both retail and mobile.
• Most, if not all, neighboring states appear poised to authorize both retail and mobile.
Broadly speaking, we believe that the value of Indiana's regulated sports betting market would be cut roughly in half in the absence of mobile. We further believe this deficit would accelerate over time as more and more demand shifts toward mobile.
22 Indiana Sports Betting Report
While mobile betting does present new policy, regulatory, and social challenges, we believe the experience of other markets with mobile gambling – especially the experience Nevada and New Jersey – should provide Indiana policymakers with both confidence that mobile gambling can be deployed responsibly and effectively and a useful template for accomplishing that aim. The Nevada Locals Sports Betting Market It is tempting to utilize the Nevada locals sports betting market as a shortcut for appreciating the potential of regulated sports betting in Indiana. But there are key differences between the markets that complicate a direct comparison, including:
• The lack of professional sports teams in Nevada (the inaugural season for the Golden Knights sparked a surge in betting).
• Restrictions on the mobile account creation process.
• The relatively immature mobile product from markets and features perspectives.
• The comparatively small size of the market, which diminishes competition.
• The absence of significant bordering state population within a short drive. We think the Nevada locals market is certainly instructive when forecasting Indiana's market, and we leaned heavily upon the market in our model. But the differences above caused us to integrate a range of other markets into our model with the goal of creating a more robust picture of how Indiana's sports betting market might ultimately perform. A common approach to a back-of-the-envelope estimate for a state's sports betting market is to take the share sports betting represents of total gaming revenue in Nevada (roughly 2.4% for both overall and locals) and then apply that percentage to a given state's total gaming revenue. While this approach is useful in terms of providing a floor for a market, we think it is insufficient for capturing the upper bound of a state's sports betting potential. It is worth noting that a nearly identical ratio exists between sports betting revenue and total casino revenue in Delaware during the last few years, despite the fact that, until June 2018, Delaware's sports betting product was limited to parlay cards that were only sold at retail during NFL season.
Other Notes And Caveats
• Regulated sports betting in the U.S. is largely uncharted territory. Predicting performance in any new market is always a speculative exercise, but predicting performance for regulated sports betting is even more so thanks to the virtual lack of useful precedent.
• American consumer preferences for sports betting have yet to be established. The black market gives us a sense of how the American consumer prefers to bet on sports, but it's an incomplete picture at best. It may take time for operators to hone in on the product and presentation that triggers the greatest demand among American sports bettors. We also lack direct answers to some critical questions. For example, will consumers be willing to travel in order to place a sports bet, and, if so, how far? Existing parallels in casino and lottery products, along with Nevada's sports betting market and early performance in New Jersey, all strongly suggest that consumers will be willing to regularly travel to place sports bets, but we won't know for sure until more regulated sports betting markets are established.
• Limiting the black market is crucial to the success of the regulated market. The single biggest way to limit the black market is to create an environment where the regulated product can be as competitive as possible with black market products. But policymakers can, and should, take other steps to limit the black
23 Indiana Sports Betting Report
market, including funding law enforcement, pursuing entities that promote black market sites, and educating consumers on the differences between the black market and the regulated market.
The Connection Between Tax Rate And Revenue
Alternative Tax Scenarios As a matter of providing increased due diligence around the most effective tax rate, we performed a sensitivity analysis, modeled as a variation of Scenario 1 (retail + mobile authorized and implemented in accordance with the licensing and taxation provisions in Rep. Morrison’s H 1325).
While Scenario 1 assumes a 9.25% state tax on GGR, along with license fees for both operators and interactive platform providers, we conducted a stress test on how consumer demand might respond to an increase in the GGR tax rate. Against our effective tax rate of 14.25% (a 9.25% state GGR tax and a 1% federal handle tax), we estimated the impact of a 5% increase in the state GGR tax, establishing an effective rate of 19.25%.
We note that above 15%, there is substantially more uncertainty in the demand impacts. We expect that somewhere above 15-20%, there is a “cliff” or non-continuous change in market size, as some games become unprofitable (e.g., in-game wagering) and are no longer offered, and substantial traffic moves to the unregulated market.
While higher tax revenue may be feasible with a rate above 19.25%, there will be substantially increased risk in terms of market supply and consumer demand. Therefore, Scenario 1 should be seen as a rate that is close to what could reasonably be estimated without a substantial increase in uncertainty.
Considerations: Tax Pass-Through And Elasticity Of Demand When estimating the change in the overall market effects from a tax change, there are two key considerations:
1. Tax Pass-Through: How much of the increase in tax costs from the higher rate (or decrease from a lowerrate) will be passed through operators to consumers, in the form of higher prices or lower quality, and howmuch will be absorbed by the firm without a change in consumer prices or quality?
2. Elasticity of Demand: Elasticity of demand is a measure of how much consumer demand will change inresponse to a change in price. Specifically, elasticity of demand is the percentage change in demand from agiven percentage change in price.
Tax Pass-Through The pass-through of a value-added tax like a GGR tax can be a function of many different business and market variables, but ultimately is related to the level of competition in the market.
In a perfectly competitive market, the entire tax rate increase or decrease will be passed on to consumers, whereas in a market where one or more firms have some level of market power, most, or potentially all, of the impact will be born by the firm, with minimal change to market prices. This occurs because consumers are already being charged a price that is near the monopoly price, rather than the competitive market clearing price.
Firms may alter prices by offering worse odds, such as a -120 betting line rather than -110, or if prices are challenging to modify due to competition, regulation, game design, or other circumstances, firms may modify effective prices by offering worse or fewer promotions.
24 Indiana Sports Betting Report
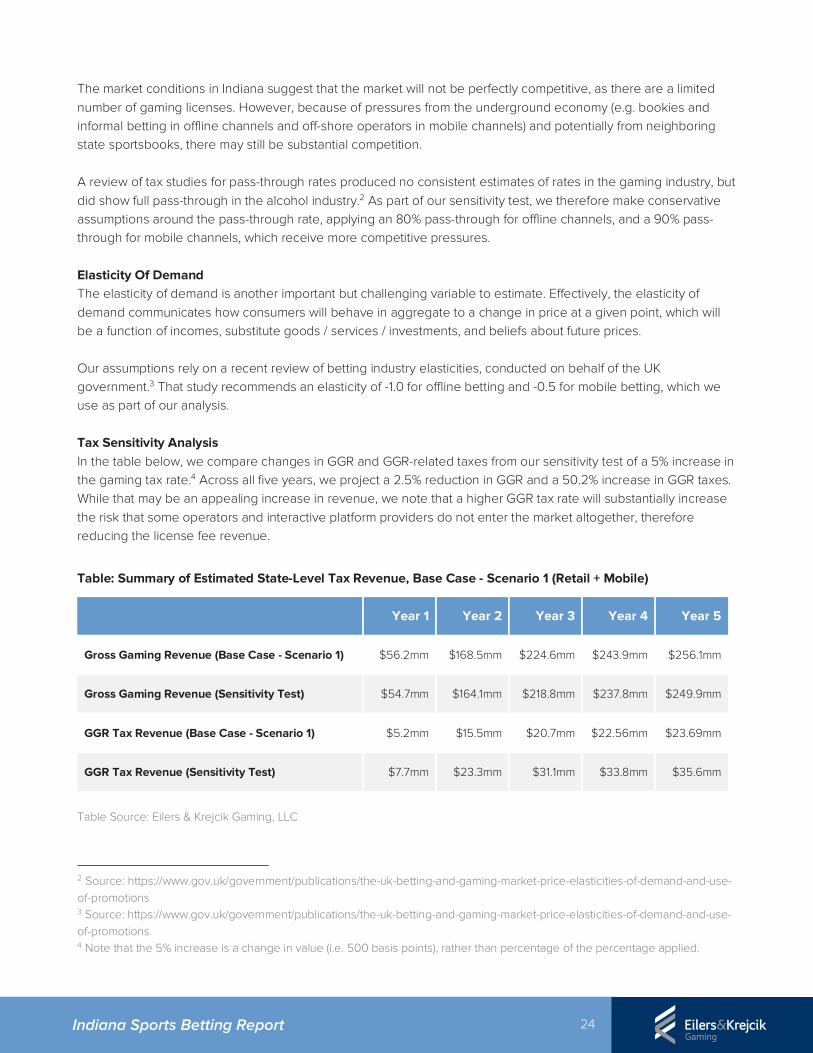
The market conditions in Indiana suggest that the market will not be perfectly competitive, as there are a limited number of gaming licenses. However, because of pressures from the underground economy (e.g. bookies and informal betting in offline channels and off-shore operators in mobile channels) and potentially from neighboring state sportsbooks, there may still be substantial competition. A review of tax studies for pass-through rates produced no consistent estimates of rates in the gaming industry, but did show full pass-through in the alcohol industry.2 As part of our sensitivity test, we therefore make conservative assumptions around the pass-through rate, applying an 80% pass-through for offline channels, and a 90% pass-through for mobile channels, which receive more competitive pressures. Elasticity Of Demand The elasticity of demand is another important but challenging variable to estimate. Effectively, the elasticity of demand communicates how consumers will behave in aggregate to a change in price at a given point, which will be a function of incomes, substitute goods / services / investments, and beliefs about future prices. Our assumptions rely on a recent review of betting industry elasticities, conducted on behalf of the UK government.3 That study recommends an elasticity of -1.0 for offline betting and -0.5 for mobile betting, which we use as part of our analysis. Tax Sensitivity Analysis In the table below, we compare changes in GGR and GGR-related taxes from our sensitivity test of a 5% increase in the gaming tax rate.4 Across all five years, we project a 2.5% reduction in GGR and a 50.2% increase in GGR taxes. While that may be an appealing increase in revenue, we note that a higher GGR tax rate will substantially increase the risk that some operators and interactive platform providers do not enter the market altogether, therefore reducing the license fee revenue.
Table: Summary of Estimated State-Level Tax Revenue, Base Case - Scenario 1 (Retail + Mobile)
Year 1 Year 2 Year 3 Year 4 Year 5
Gross Gaming Revenue (Base Case - Scenario 1) $56.2mm $168.5mm $224.6mm $243.9mm $256.1mm
Gross Gaming Revenue (Sensitivity Test) $54.7mm $164.1mm $218.8mm $237.8mm $249.9mm
GGR Tax Revenue (Base Case - Scenario 1) $5.2mm $15.5mm $20.7mm $22.56mm $23.69mm
GGR Tax Revenue (Sensitivity Test) $7.7mm $23.3mm $31.1mm $33.8mm $35.6mm
Table Source: Eilers & Krejcik Gaming, LLC
2 Source: https://www.gov.uk/government/publications/the-uk-betting-and-gaming-market-price-elasticities-of-demand-and-use-of-promotions 3 Source: https://www.gov.uk/government/publications/the-uk-betting-and-gaming-market-price-elasticities-of-demand-and-use-of-promotions 4 Note that the 5% increase is a change in value (i.e. 500 basis points), rather than percentage of the percentage applied.
25 Indiana Sports Betting Report
Study Background
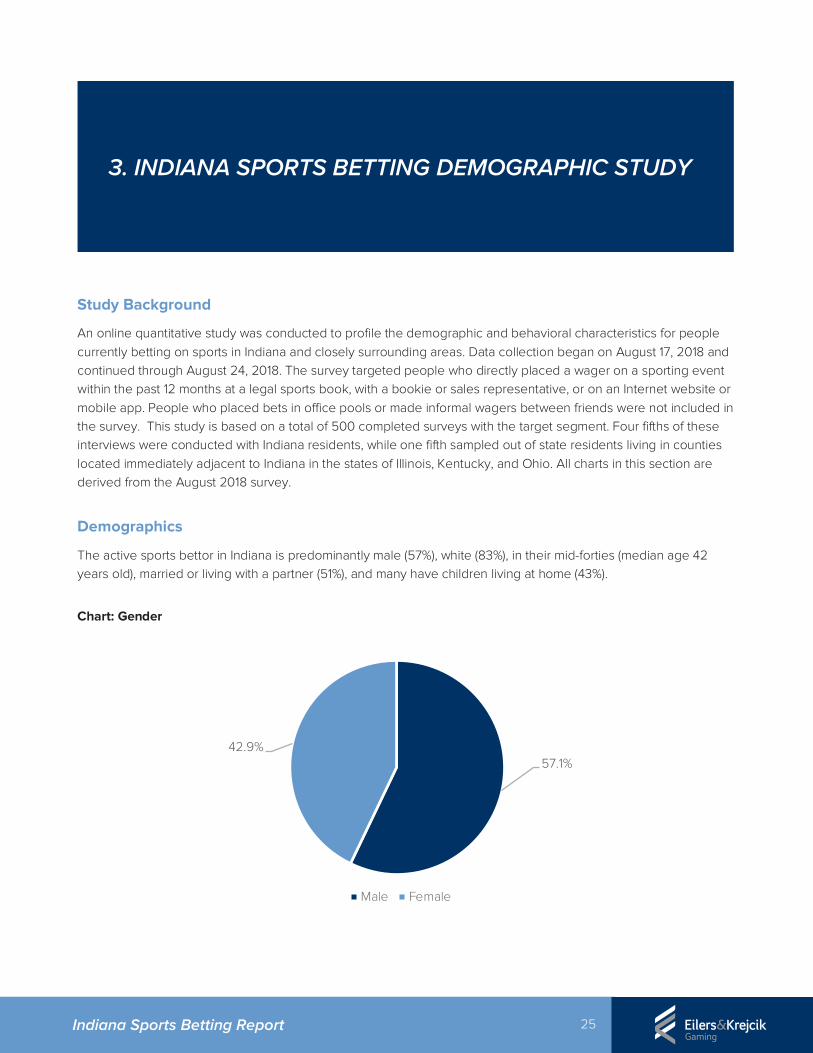
An online quantitative study was conducted to profile the demographic and behavioral characteristics for people currently betting on sports in Indiana and closely surrounding areas. Data collection began on August 17, 2018 and continued through August 24, 2018. The survey targeted people who directly placed a wager on a sporting event within the past 12 months at a legal sports book, with a bookie or sales representative, or on an Internet website or mobile app. People who placed bets in office pools or made informal wagers between friends were not included in the survey. This study is based on a total of 500 completed surveys with the target segment. Four fifths of these interviews were conducted with Indiana residents, while one fifth sampled out of state residents living in counties located immediately adjacent to Indiana in the states of Illinois, Kentucky, and Ohio. All charts in this section are derived from the August 2018 survey.
Demographics
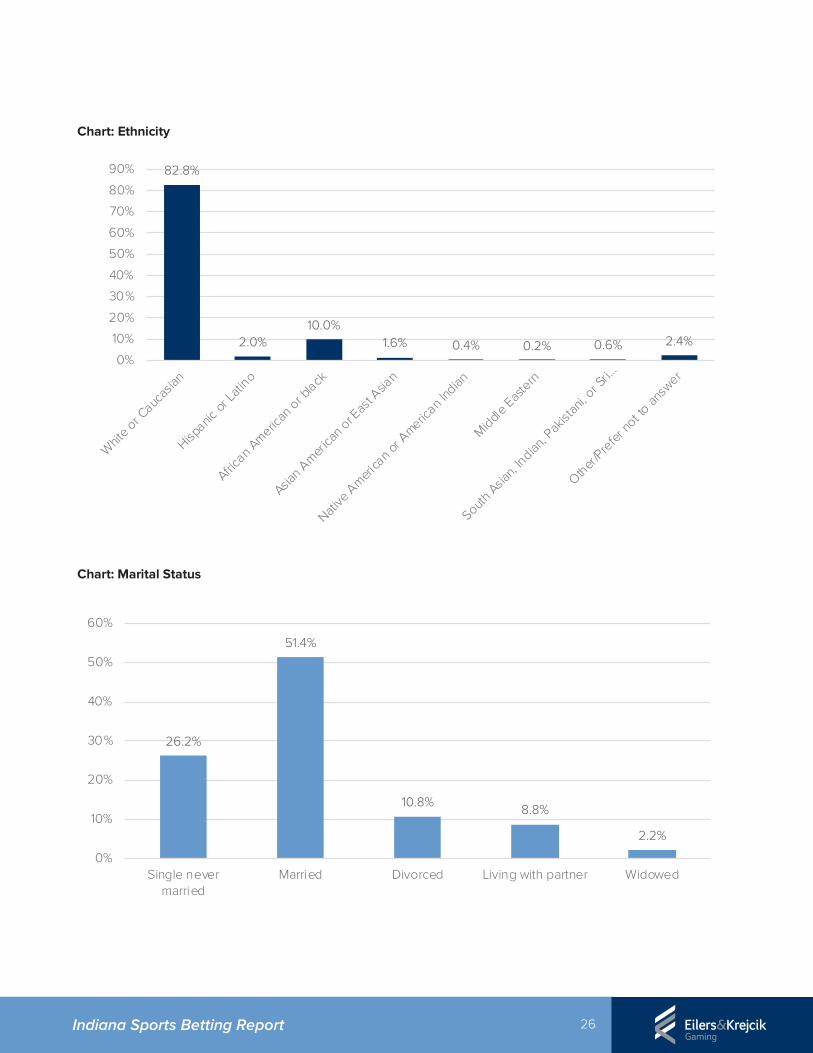
The active sports bettor in Indiana is predominantly male (57%), white (83%), in their mid-forties (median age 42 years old), married or living with a partner (51%), and many have children living at home (43%).
Chart: Gender
57.1%42.9%
Male Female
3. INDIANA SPORTS BETTING DEMOGRAPHIC STUDY
26 Indiana Sports Betting Report
Chart: Ethnicity
Chart: Marital Status
82.8%
2.0%10.0%
1.6% 0.4% 0.2% 0.6% 2.4%0%
10%
20%
30%
40%
50%
60%
70%
80%
90%
Whit
e or Cauc
asian
Hispanic
or La
tino
African A
merican
or b
lack
Asian A
merica
n or E
ast A
sian
Native
Ameri
can o
r Americ
an Ind
ian
Middle E
aste
rn
South A
sian,
Indian, P
akist
ani, o
r Sri…
Other/Pre
fer no
t to an
swer
26.2%
51.4%
10.8% 8.8%
2.2%
0%
10%
20%
30%
40%
50%
60%
Single nevermarried
Married Divorced Living with partner Widowed
27 Indiana Sports Betting Report
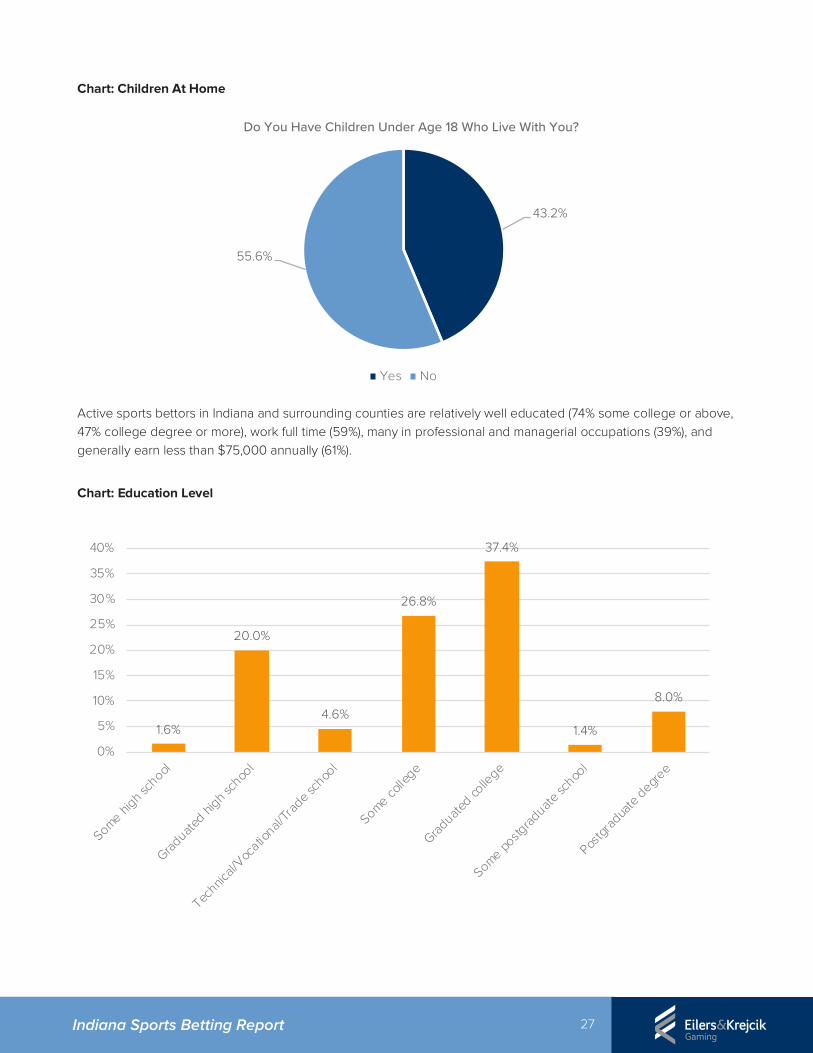
Chart: Children At Home
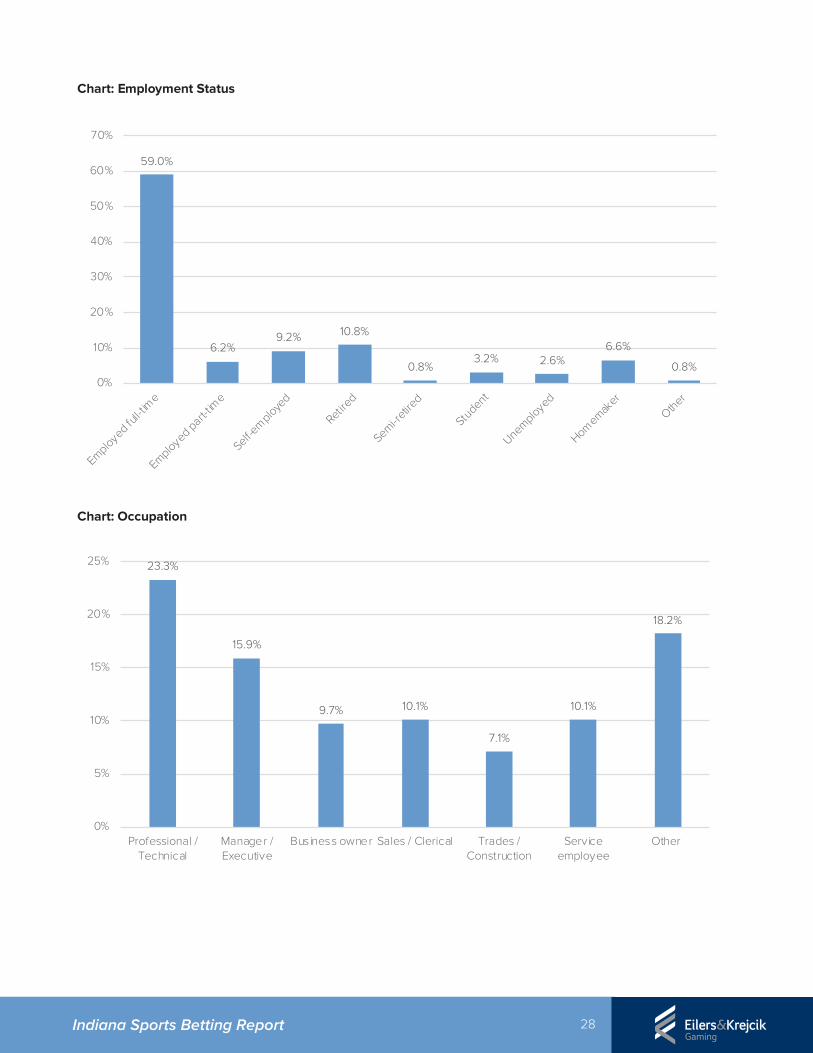
Active sports bettors in Indiana and surrounding counties are relatively well educated (74% some college or above, 47% college degree or more), work full time (59%), many in professional and managerial occupations (39%), and generally earn less than $75,000 annually (61%).
Chart: Education Level
43.2%
55.6%
Do You Have Children Under Age 18 Who Live With You?
Yes No
1.6%
20.0%
4.6%
26.8%
37.4%
1.4%
8.0%
0%
5%
10%
15%
20%
25%
30%
35%
40%
Some high s
chool
Graduate
d high s
choo
l
Technic
al/Voc
ational/
Trad
e sch
ool
Some colle
ge
Graduate
d colle
ge
Some postg
raduate
schoo
l
Postgr
adua
te degre
e
28 Indiana Sports Betting Report
Chart: Employment Status
Chart: Occupation
59.0%
6.2%9.2% 10.8%
0.8%3.2% 2.6%
6.6%
0.8%0%
10%
20%
30%
40%
50%
60%
70%
Employed full-t
ime
Employed part-tim
e
Self-em
ployed
Retired
Semi-retire
d
Student
Unemployed
Homemak
er
Other
23.3%
15.9%
9.7% 10.1%
7.1%
10.1%
18.2%
0%
5%
10%
15%
20%
25%
Professional /Technical
Manager /Executive
Business owner Sales / Clerical Trades /Construction
Serviceemployee
Other
29 Indiana Sports Betting Report
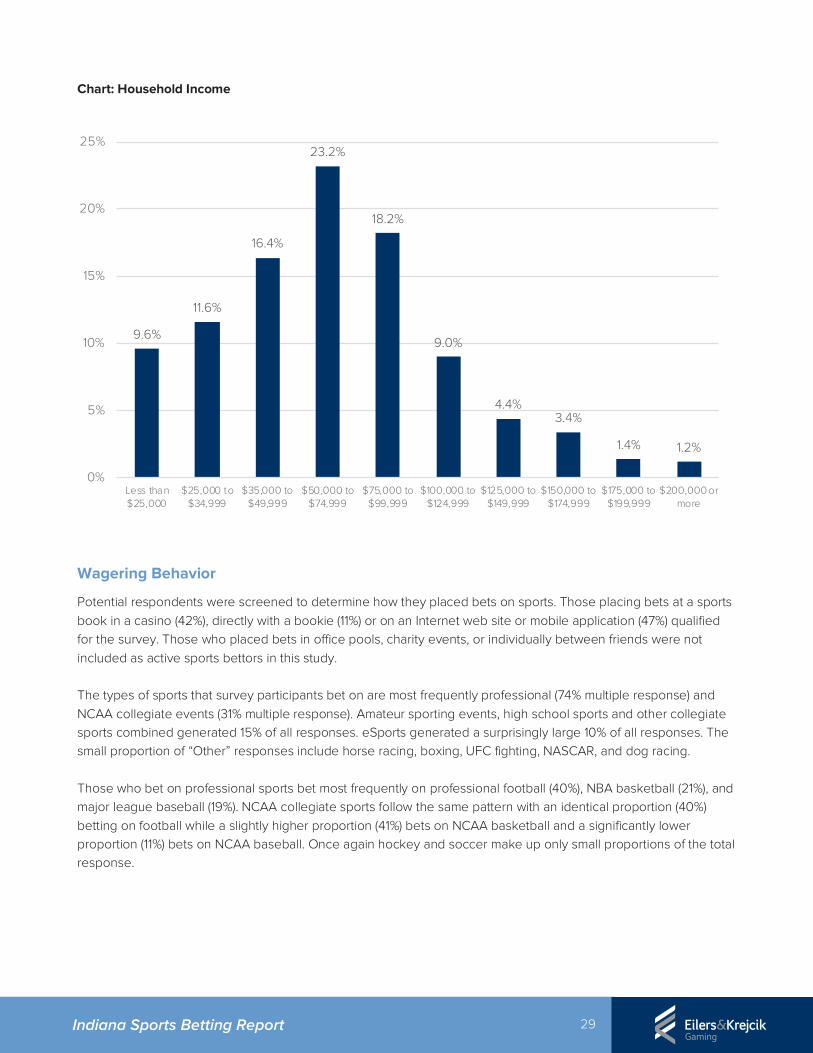
Chart: Household Income
Wagering Behavior
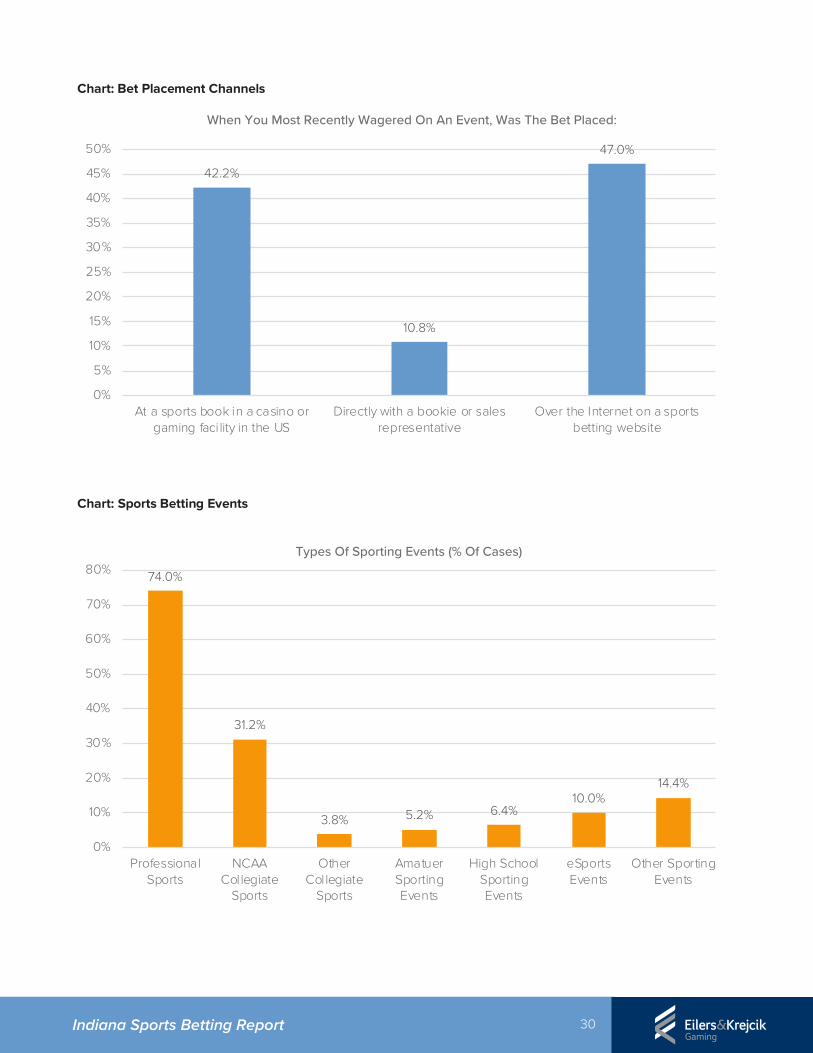
Potential respondents were screened to determine how they placed bets on sports. Those placing bets at a sports book in a casino (42%), directly with a bookie (11%) or on an Internet web site or mobile application (47%) qualified for the survey. Those who placed bets in office pools, charity events, or individually between friends were not included as active sports bettors in this study.
The types of sports that survey participants bet on are most frequently professional (74% multiple response) and NCAA collegiate events (31% multiple response). Amateur sporting events, high school sports and other collegiate sports combined generated 15% of all responses. eSports generated a surprisingly large 10% of all responses. The small proportion of “Other” responses include horse racing, boxing, UFC fighting, NASCAR, and dog racing.
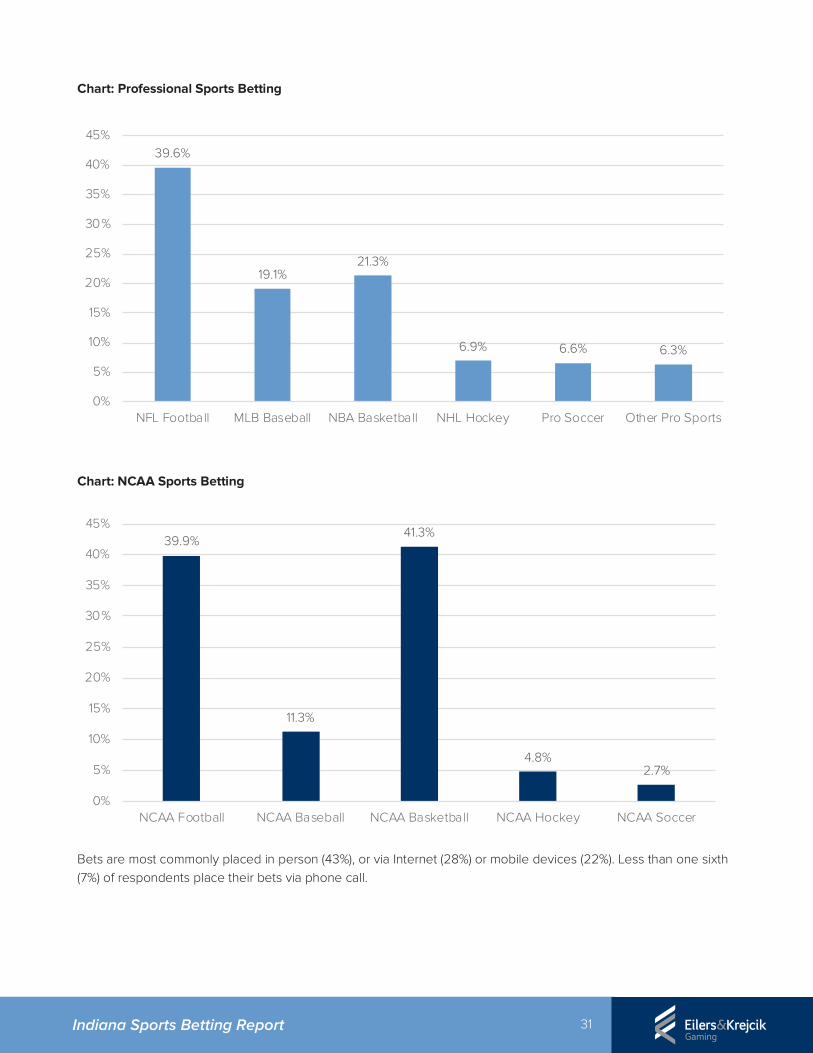
Those who bet on professional sports bet most frequently on professional football (40%), NBA basketball (21%), and major league baseball (19%). NCAA collegiate sports follow the same pattern with an identical proportion (40%) betting on football while a slightly higher proportion (41%) bets on NCAA basketball and a significantly lower proportion (11%) bets on NCAA baseball. Once again hockey and soccer make up only small proportions of the total response.
9.6%
11.6%
16.4%
23.2%
18.2%
9.0%
4.4%3.4%
1.4% 1.2%
0%
5%
10%
15%
20%
25%
Less than$25,000
$25,000 to$34,999
$35,000 to$49,999
$50,000 to$74,999
$75,000 to$99,999
$100,000 to$124,999
$125,000 to$149,999
$150,000 to$174,999
$175,000 to$199,999
$200,000 ormore
30 Indiana Sports Betting Report
Chart: Bet Placement Channels
Chart: Sports Betting Events
42.2%
10.8%
47.0%
0%
5%
10%
15%
20%
25%
30%
35%
40%
45%
50%
At a sports book in a casino orgaming faci lity in the US
Directly with a bookie or salesrepresentative
Over the Internet on a sportsbetting website
When You Most Recently Wagered On An Event, Was The Bet Placed:
74.0%
31.2%
3.8% 5.2% 6.4%10.0%
14.4%
0%
10%
20%
30%
40%
50%
60%
70%
80%
ProfessionalSports
NCAACollegiate
Sports
OtherCollegiate
Sports
AmatuerSportingEvents
High SchoolSportingEvents
eSportsEvents
Other SportingEvents
Types Of Sporting Events (% Of Cases)
31 Indiana Sports Betting Report
Chart: Professional Sports Betting
Chart: NCAA Sports Betting
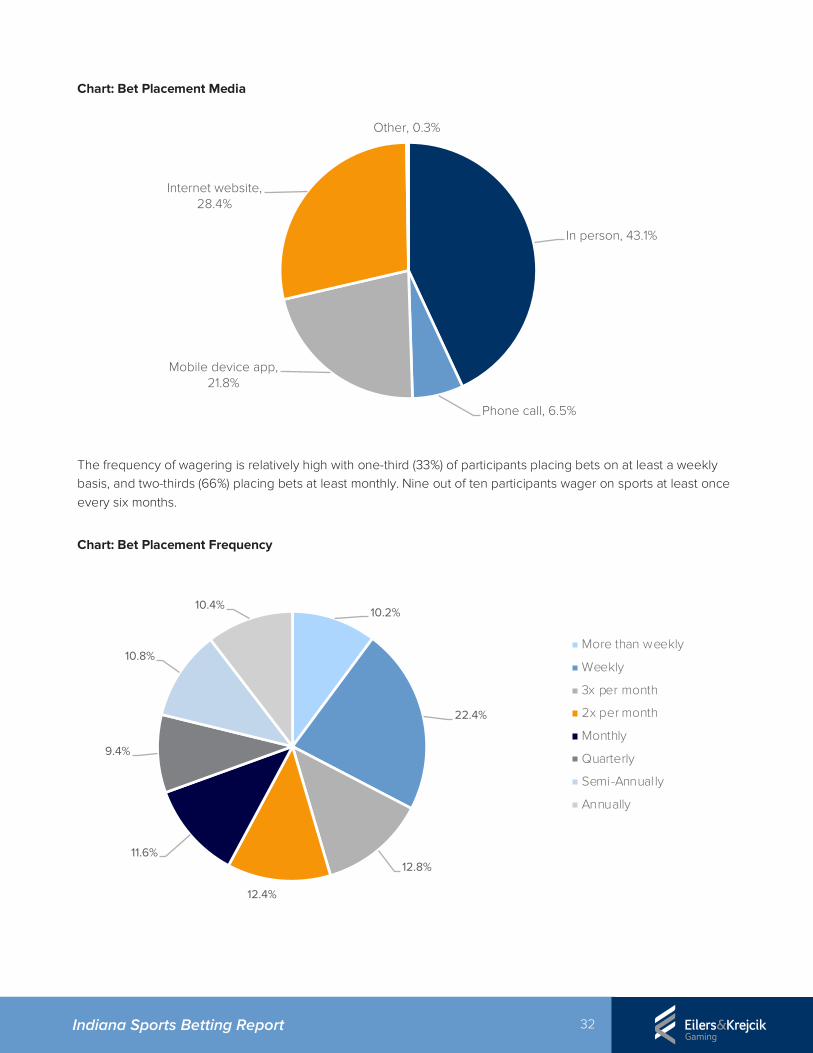
Bets are most commonly placed in person (43%), or via Internet (28%) or mobile devices (22%). Less than one sixth (7%) of respondents place their bets via phone call.
39.6%
19.1%21.3%
6.9% 6.6% 6.3%
0%
5%
10%
15%
20%
25%
30%
35%
40%
45%
NFL Football MLB Baseball NBA Basketball NHL Hockey Pro Soccer Other Pro Sports
39.9%
11.3%
41.3%
4.8%2.7%
0%
5%
10%
15%
20%
25%
30%
35%
40%
45%
NCAA Football NCAA Baseball NCAA Basketball NCAA Hockey NCAA Soccer
32 Indiana Sports Betting Report
Chart: Bet Placement Media
The frequency of wagering is relatively high with one-third (33%) of participants placing bets on at least a weekly basis, and two-thirds (66%) placing bets at least monthly. Nine out of ten participants wager on sports at least once every six months.
Chart: Bet Placement Frequency
In person, 43.1%
Phone call, 6.5%
Mobile device app, 21.8%
Internet website, 28.4%
Other, 0.3%
10.2%
22.4%
12.8%
12.4%
11.6%
9.4%
10.8%
10.4%
More than weekly
Weekly
3x per month
2x per month
Monthly
Quarterly
Semi-Annually
Annually
33 Indiana Sports Betting Report
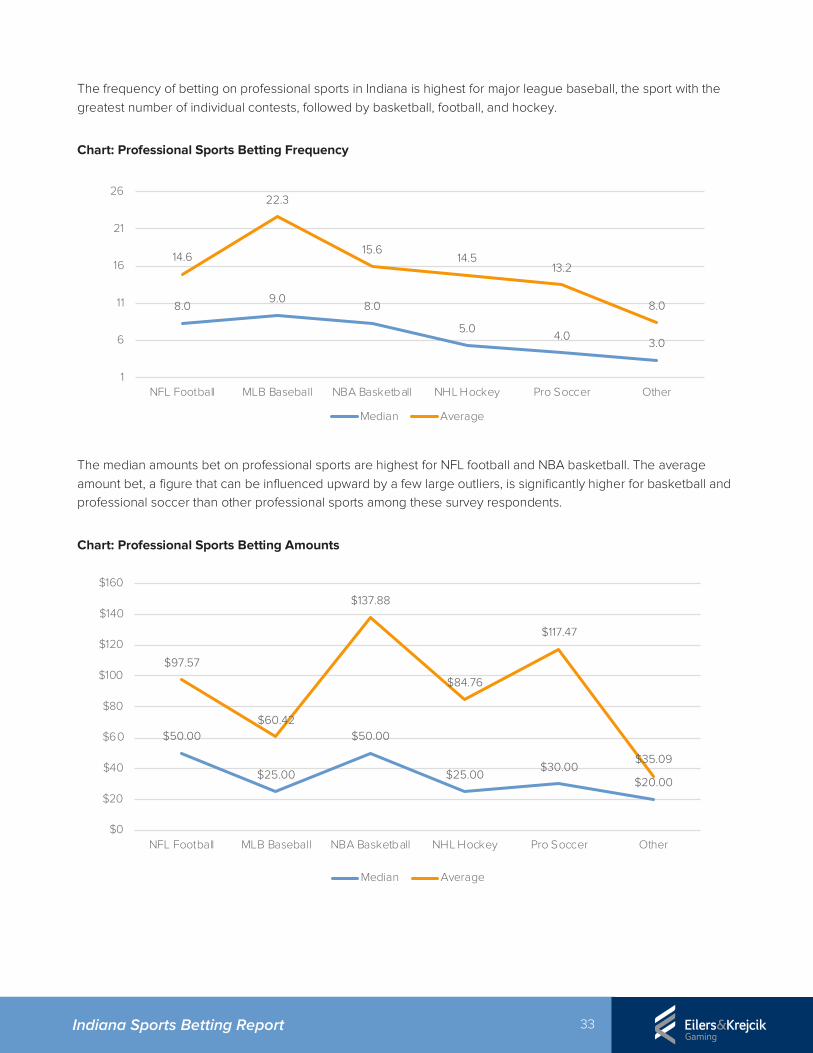
The frequency of betting on professional sports in Indiana is highest for major league baseball, the sport with the greatest number of individual contests, followed by basketball, football, and hockey.
Chart: Professional Sports Betting Frequency
The median amounts bet on professional sports are highest for NFL football and NBA basketball. The average amount bet, a figure that can be influenced upward by a few large outliers, is significantly higher for basketball and professional soccer than other professional sports among these survey respondents.
Chart: Professional Sports Betting Amounts
8.09.0
8.0
5.04.0
3.0
14.6
22.3
15.614.5
13.2
8.0
1
6
11
16
21
26
NFL Football MLB Baseball NBA Basketball NHL Hockey Pro Soccer Other
Median Average
$50.00
$25.00
$50.00
$25.00$30.00
$20.00
$97.57
$60.42
$137.88
$84.76
$117.47
$35.09
$0
$20
$40
$60
$80
$100
$120
$140
$160
NFL Football MLB Baseball NBA Basketball NHL Hockey Pro Soccer Other
Median Average
34 Indiana Sports Betting Report
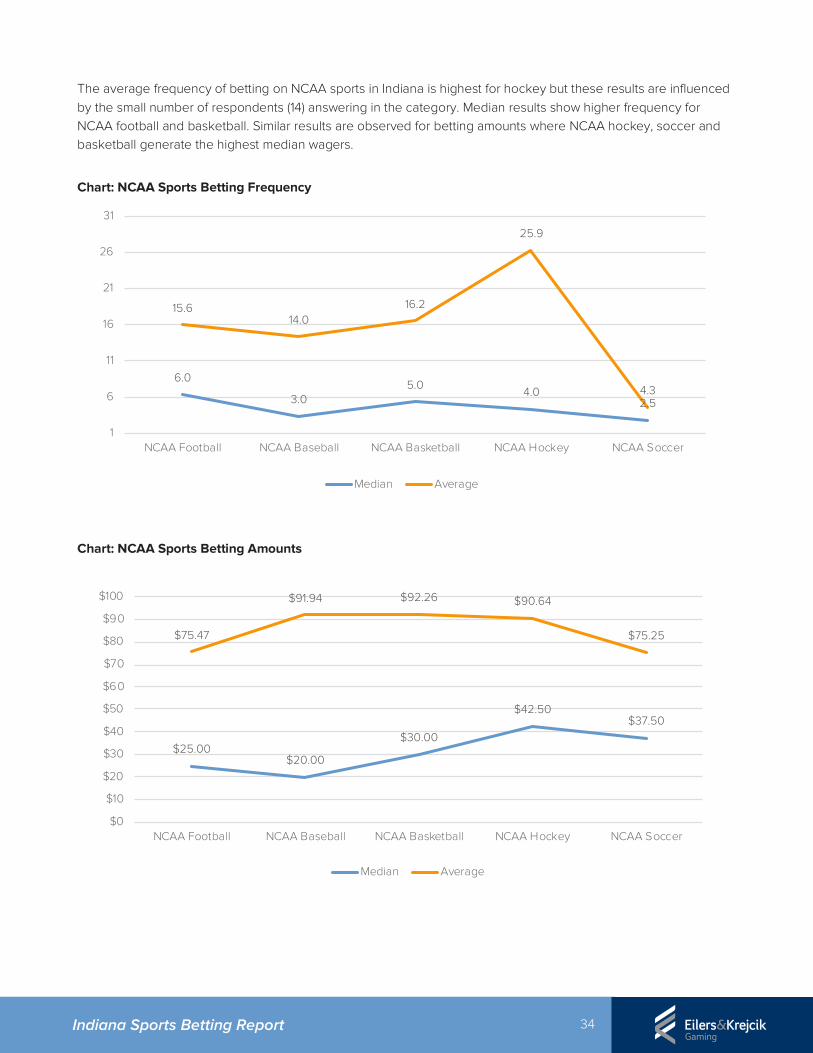
The average frequency of betting on NCAA sports in Indiana is highest for hockey but these results are influenced by the small number of respondents (14) answering in the category. Median results show higher frequency for NCAA football and basketball. Similar results are observed for betting amounts where NCAA hockey, soccer and basketball generate the highest median wagers.
Chart: NCAA Sports Betting Frequency
Chart: NCAA Sports Betting Amounts
6.0
3.05.0
4.02.5
15.614.0
16.2
25.9
4.3
1
6
11
16
21
26
31
NCAA Football NCAA Baseball NCAA Basketball NCAA Hockey NCAA Soccer
Median Average
$25.00$20.00
$30.00
$42.50$37.50
$75.47
$91.94 $92.26 $90.64
$75.25
$0
$10
$20
$30
$40
$50
$60
$70
$80
$90
$100
NCAA Football NCAA Baseball NCAA Basketball NCAA Hockey NCAA Soccer
Median Average
35 Indiana Sports Betting Report
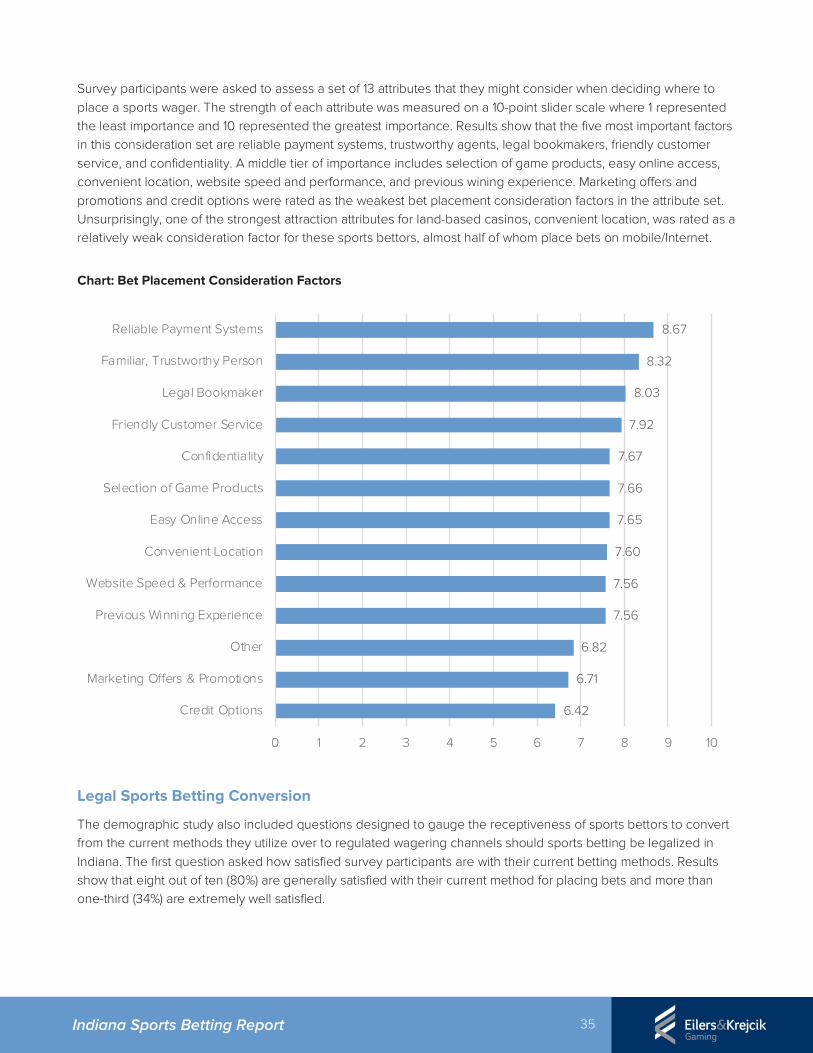
Survey participants were asked to assess a set of 13 attributes that they might consider when deciding where to place a sports wager. The strength of each attribute was measured on a 10-point slider scale where 1 represented the least importance and 10 represented the greatest importance. Results show that the five most important factors in this consideration set are reliable payment systems, trustworthy agents, legal bookmakers, friendly customer service, and confidentiality. A middle tier of importance includes selection of game products, easy online access, convenient location, website speed and performance, and previous wining experience. Marketing offers and promotions and credit options were rated as the weakest bet placement consideration factors in the attribute set. Unsurprisingly, one of the strongest attraction attributes for land-based casinos, convenient location, was rated as a relatively weak consideration factor for these sports bettors, almost half of whom place bets on mobile/Internet.
Chart: Bet Placement Consideration Factors
Legal Sports Betting Conversion
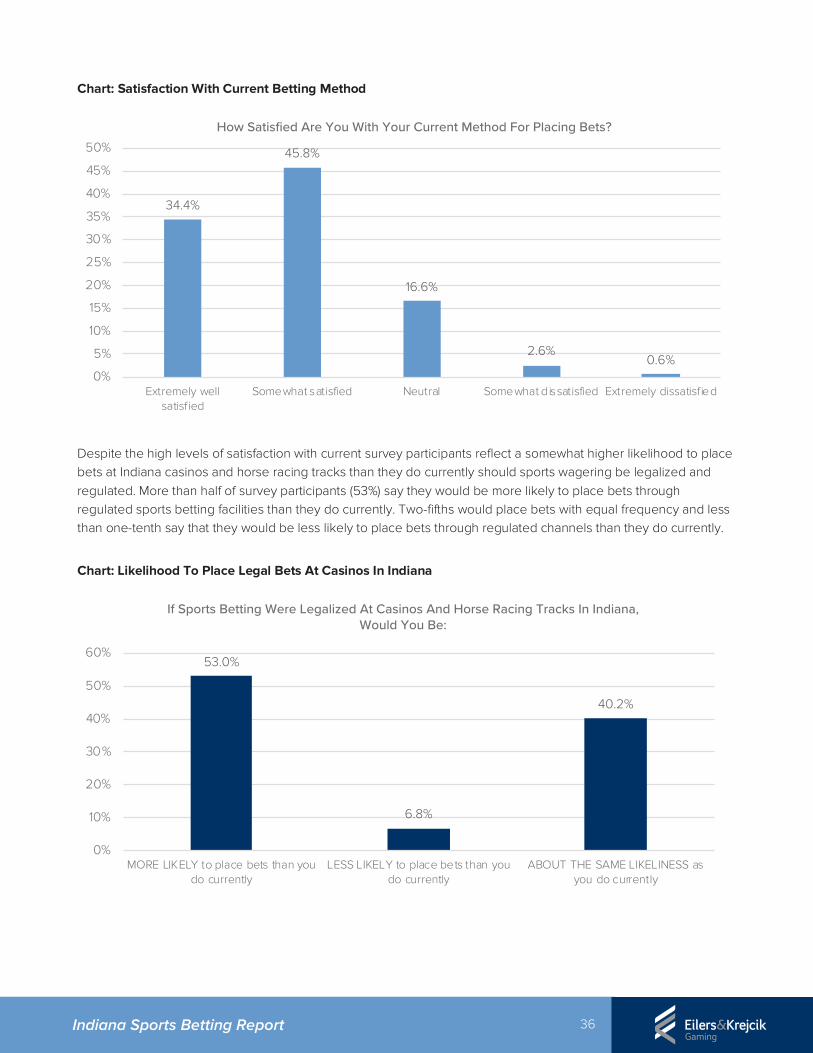
The demographic study also included questions designed to gauge the receptiveness of sports bettors to convert from the current methods they utilize over to regulated wagering channels should sports betting be legalized in Indiana. The first question asked how satisfied survey participants are with their current betting methods. Results show that eight out of ten (80%) are generally satisfied with their current method for placing bets and more than one-third (34%) are extremely well satisfied.
6.42
6.71
6.82
7.56
7.56
7.60
7.65
7.66
7.67
7.92
8.03
8.32
8.67
0 1 2 3 4 5 6 7 8 9 10
Credit Options
Marketing Offers & Promotions
Other
Previous Winning Experience
Website Speed & Performance
Convenient Location
Easy Online Access
Selection of Game Products
Confidentiality
Friendly Customer Service
Legal Bookmaker
Familiar, Trustworthy Person
Reliable Payment Systems
36 Indiana Sports Betting Report
Chart: Satisfaction With Current Betting Method
Despite the high levels of satisfaction with current survey participants reflect a somewhat higher likelihood to place bets at Indiana casinos and horse racing tracks than they do currently should sports wagering be legalized and regulated. More than half of survey participants (53%) say they would be more likely to place bets through regulated sports betting facilities than they do currently. Two-fifths would place bets with equal frequency and less than one-tenth say that they would be less likely to place bets through regulated channels than they do currently.
Chart: Likelihood To Place Legal Bets At Casinos In Indiana
34.4%
45.8%
16.6%
2.6%0.6%
0%
5%
10%
15%
20%
25%
30%
35%
40%
45%
50%
Extremely wellsatisfied
Somewhat satisfied Neutral Somewhat dissatisfied Extremely dissatisfied
How Satisfied Are You With Your Current Method For Placing Bets?
53.0%
6.8%
40.2%
0%
10%
20%
30%
40%
50%
60%
MORE LIKELY to place bets than youdo currently
LESS LIKELY to place bets than youdo currently
ABOUT THE SAME LIKELINESS asyou do currently
If Sports Betting Were Legalized At Casinos And Horse Racing Tracks In Indiana, Would You Be:
37 Indiana Sports Betting Report
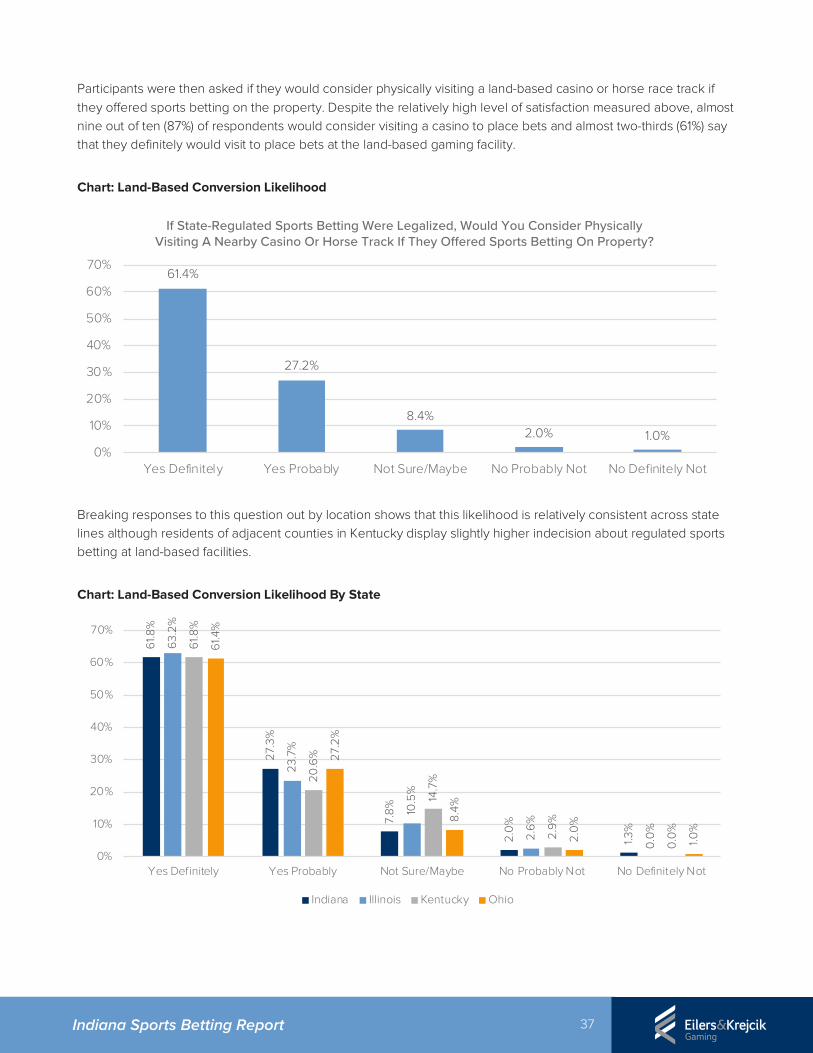
Participants were then asked if they would consider physically visiting a land-based casino or horse race track if they offered sports betting on the property. Despite the relatively high level of satisfaction measured above, almost nine out of ten (87%) of respondents would consider visiting a casino to place bets and almost two-thirds (61%) say that they definitely would visit to place bets at the land-based gaming facility.
Chart: Land-Based Conversion Likelihood
Breaking responses to this question out by location shows that this likelihood is relatively consistent across state lines although residents of adjacent counties in Kentucky display slightly higher indecision about regulated sports betting at land-based facilities.
Chart: Land-Based Conversion Likelihood By State
61.4%
27.2%
8.4%2.0% 1.0%
0%
10%
20%
30%
40%
50%
60%
70%
Yes Definitely Yes Probably Not Sure/Maybe No Probably Not No Definitely Not
If State-Regulated Sports Betting Were Legalized, Would You Consider Physically Visiting A Nearby Casino Or Horse Track If They Offered Sports Betting On Property?
61.8
%
27.3
%
7.8%
2.0
%
1.3%
63.2
%
23.7
%
10.5
%
2.6%
0.0
%
61.8
%
20.6
%
14.7
%
2.9%
0.0
%
61.4
%
27.2
%
8.4%
2.0
%
1.0%
0%
10%
20%
30%
40%
50%
60%
70%
Yes Definitely Yes Probably Not Sure/Maybe No Probably Not No Definitely Not
Indiana Illinois Kentucky Ohio
38 Indiana Sports Betting Report
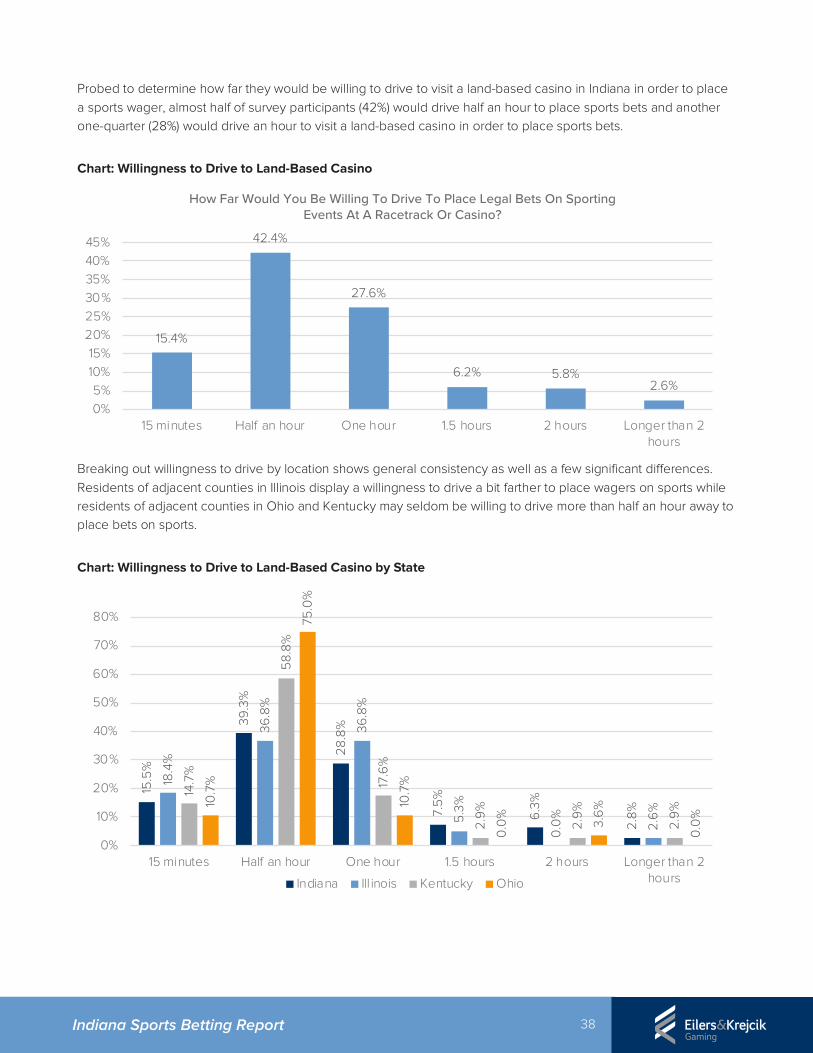
Probed to determine how far they would be willing to drive to visit a land-based casino in Indiana in order to place a sports wager, almost half of survey participants (42%) would drive half an hour to place sports bets and another one-quarter (28%) would drive an hour to visit a land-based casino in order to place sports bets.
Chart: Willingness to Drive to Land-Based Casino
Breaking out willingness to drive by location shows general consistency as well as a few significant differences. Residents of adjacent counties in Illinois display a willingness to drive a bit farther to place wagers on sports while residents of adjacent counties in Ohio and Kentucky may seldom be willing to drive more than half an hour away to place bets on sports.
Chart: Willingness to Drive to Land-Based Casino by State
15.4%
42.4%
27.6%
6.2% 5.8%2.6%
0%5%
10%15%
20%25%30%35%40%45%
15 minutes Half an hour One hour 1.5 hours 2 hours Longer than 2hours
How Far Would You Be Willing To Drive To Place Legal Bets On Sporting Events At A Racetrack Or Casino?
15.5
%
39.3
%
28.8
%
7.5%
6.3%
2.8%
18.4
%
36.8
%
36.8
%
5.3%
0.0
%
2.6%
14.7
%
58.8
%
17.6
%
2.9%
2.9%
2.9%
10.7
%
75.0
%
10.7
%
0.0
%
3.6%
0.0
%
0%
10%
20%
30%
40%
50%
60%
70%
80%
15 minutes Half an hour One hour 1.5 hours 2 hours Longer than 2hoursIndiana Ill inois Kentucky Ohio
39 Indiana Sports Betting Report
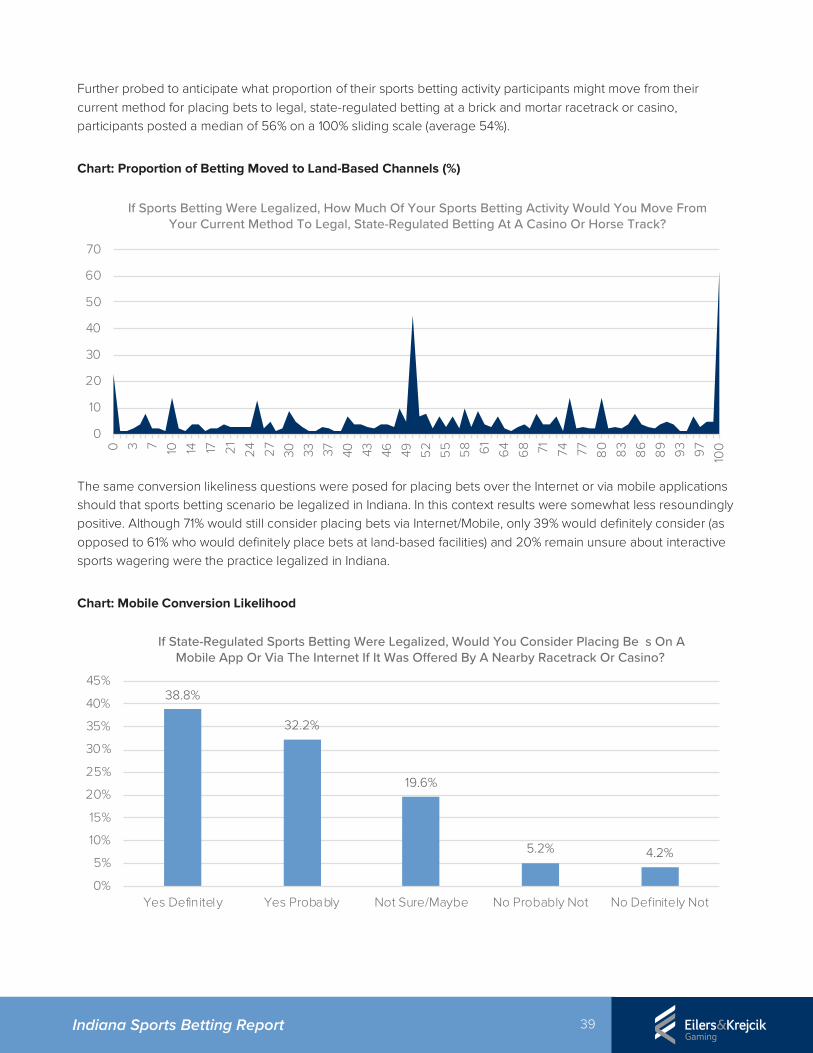
Further probed to anticipate what proportion of their sports betting activity participants might move from their current method for placing bets to legal, state-regulated betting at a brick and mortar racetrack or casino, participants posted a median of 56% on a 100% sliding scale (average 54%).
Chart: Proportion of Betting Moved to Land-Based Channels (%)
The same conversion likeliness questions were posed for placing bets over the Internet or via mobile applications should that sports betting scenario be legalized in Indiana. In this context results were somewhat less resoundingly positive. Although 71% would still consider placing bets via Internet/Mobile, only 39% would definitely consider (as opposed to 61% who would definitely place bets at land-based facilities) and 20% remain unsure about interactive sports wagering were the practice legalized in Indiana.
Chart: Mobile Conversion Likelihood
0
10
20
30
40
50
60
70
0 3 7 10 14 17 21
24 27
30 33 37 40 43 46 49 52
55 58 61
64
68 71 74 77 80 83
86
89 93 97
100
If Sports Betting Were Legalized, How Much Of Your Sports Betting Activity Would You Move From Your Current Method To Legal, State-Regulated Betting At A Casino Or Horse Track?
38.8%
32.2%
19.6%
5.2% 4.2%
0%
5%
10%
15%
20%
25%
30%
35%
40%
45%
Yes Definitely Yes Probably Not Sure/Maybe No Probably Not No Definitely Not
If State-Regulated Sports Betting Were Legalized, Would You Consider Placing Bets On A Mobile App Or Via The Internet If It Was Offered By A Nearby Racetrack Or Casino?
40 Indiana Sports Betting Report
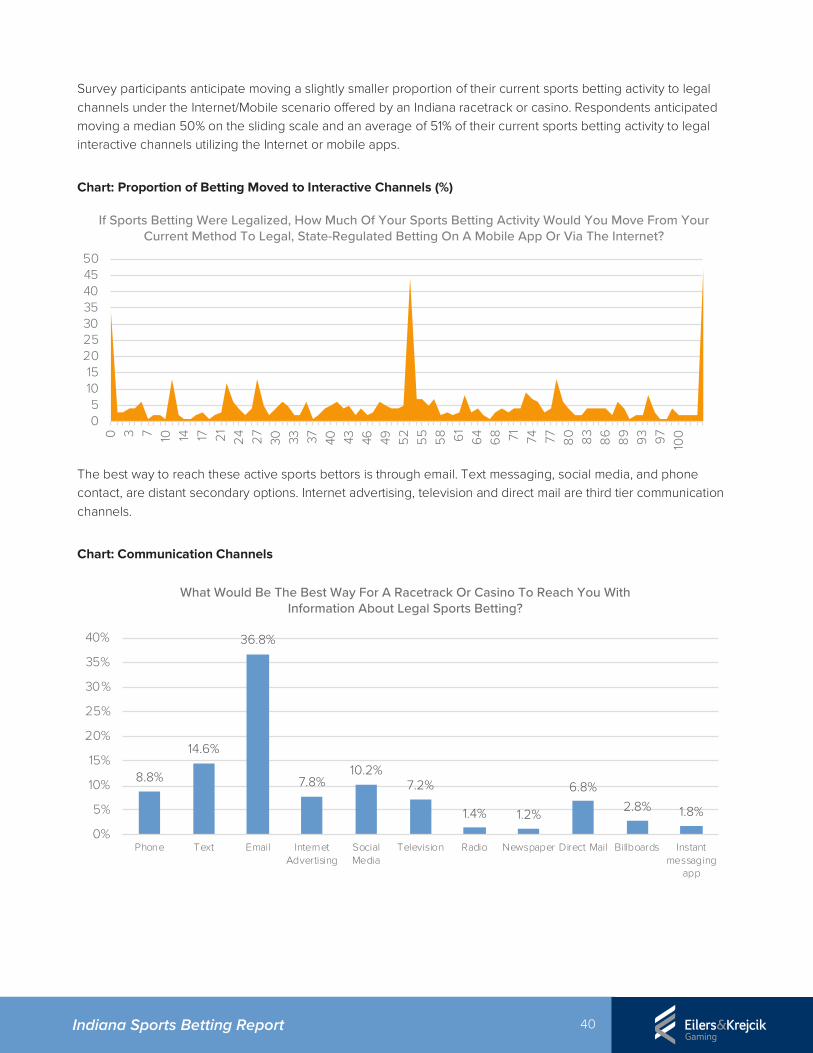
Survey participants anticipate moving a slightly smaller proportion of their current sports betting activity to legal channels under the Internet/Mobile scenario offered by an Indiana racetrack or casino. Respondents anticipated moving a median 50% on the sliding scale and an average of 51% of their current sports betting activity to legal interactive channels utilizing the Internet or mobile apps.
Chart: Proportion of Betting Moved to Interactive Channels (%)
The best way to reach these active sports bettors is through email. Text messaging, social media, and phone contact, are distant secondary options. Internet advertising, television and direct mail are third tier communication channels.
Chart: Communication Channels
05
1015
20253035404550
0 3 7 10 14 17 21
24 27
30 33 37 40 43 46 49 52
55
58 61
64
68 71 74 77 80 83
86
89 93 97
100
If Sports Betting Were Legalized, How Much Of Your Sports Betting Activity Would You Move From Your Current Method To Legal, State-Regulated Betting On A Mobile App Or Via The Internet?
8.8%
14.6%
36.8%
7.8%10.2%
7.2%
1.4% 1.2%
6.8%2.8% 1.8%
0%
5%
10%
15%
20%
25%
30%
35%
40%
Phone Text Email InternetAdvertising
SocialMedia
Television Radio Newspaper Direct Mail Billboards Instantmessaging
app
What Would Be The Best Way For A Racetrack Or Casino To Reach You With Information About Legal Sports Betting?
41 Indiana Sports Betting Report
1.1 Introduction
This section of the report expands on the financial analysis in Section 2 (Indiana Market Forecast), providing a wider view of how sports wagering will impact the Indiana economy. As part of this analysis, we examine how expansion of sports wagering may impact key economic indicators, including jobs, wages, economic output, and contributions to gross state product (GSP or value-added).5 Tax estimates are provided below in subsection 3.3.
Our analysis is based on the development of an economic impact methodology that accounts for Indiana’s unique economic structure, as well as a review of relevant gaming and tourism studies. We provide a general background on economic literature to assist the reader in interpreting the scale of impacts.
In all analyses, we have an ordered preference for data sources. We first attempt to inform our analyses using government and/or private sector data. Where relevant figures are not available, we then pursue information (in order) from academic sources, non-governmental organizations (NGOs), and then the expert judgment of the research team.
In the next subsections, we provide an overview of the methodology and outline research relevant to the present study. Findings from the literature review helped shape the approach to calculating economic impacts, and should help the reader interpret the figures. Next, we provide our estimates of the direct, indirect, and induced impacts from sports wagering expansion, accounting for potential scenarios. Last, we provide a detailed look into likely tax impacts from the scenarios.
1.2 Economic Impacts
1.2.1 What Is Economic Impact? Economic impact is a measure of the spending and employment associated with a business, a sector of the economy, a specific project (such as the construction of a new facility), or a change in government policy or regulation. Economic impact can be measured in various ways. Two of the most popular ways to assess economic impact are in terms of the dollar value of output produced or in terms of person years (also known as full-time equivalents - FTEs) of employment generated. These figures typically attempt to assess the gross level of activity or expenditure. As such, they are not “net” measures that weigh benefits against costs, but nevertheless these measures can be useful in developing an appreciation of businesses, projects, investments and economic sectors.
5 GSP is the market value of the goods and services produced in a state. It is the state equivalent to the national gross domestic product (GDP) measure.
4. MACROECONOMIC ANALYSES
42 Indiana Sports Betting Report
In our modeling procedures, we report economic impact as gross effects in order to maintain consistency with other studies to which readers may have already been exposed, but did perform robustness tests to ensure that net effects are positive across the scenarios we examined. In this report, we measure the economic impact of sports wagering expansion in a number of ways:
• Economic Output
• Value-added or GSP
• Full-Time Equivalent Employment (FTE)
• Employee Compensation
• Taxes As part of our calculations, we use economic impact modeling software, IMPLAN. IMPLAN is discussed at several points in this subsection. We include economic activity of the gaming impacts through three layers of effects: direct, indirect and induced economic impacts.
• Direct economic impact is employment or economic output that can be attributed to the operation and management of the sports book within the operator’s business. This includes all economic impacts of jobs directly at the book, but also includes spillover needs from dealers, supervisors, management, restaurant and hotel workers, and other professionals required to operate the facility.6
• Indirect economic impact is employment, value-added or economic output created in industries that supply goods and services to the operator. For example, this may be a local trucking company that ships supplies to the casinos or an instate office supplies store, that furnishes back of the house spaces.
• Induced economic impact is employment, value-added or economic output generated because of expenditures by individuals employed directly or indirectly by the operators. For example, employees hired at the sports book would have downstream impacts by doing things like spending their wages at an Indiana restaurant.
• Total economic impact is the sum of direct, indirect and induced effects. The multiplier (indirect and induced) economic impacts represent the maximum potential stimulus to the economy resulting from activity gaming related businesses.
1.3 Catalytic Impacts
In general, total economic impacts are referred to as the sum of direct, indirect, and induced effects. However, some sectors/industries are also capable of producing what are often labeled as catalytic impacts. These are cases of economic growth that are enabled by another sector/industry/firm. For example, aviation is often referred to as a
6 There may be scenarios where there would be limited ongoing employment within the borders of Indiana by mobile gaming operations. Most of the key services from mobile gambling companies (e.g. customer support, development, marketing, etc.) can be provided by firms located outside the country. To compel the development of employment, some jurisdictions have required in their legislation that certain digital/mobile gaming jobs be located domestically. For example, New Jersey legislation requires: “All employees of an Internet gaming operator who perform activities such as Internet casino accounting, patron identification and verification, problem gaming detection, anti-money laundering detection, fraud prevention or other similar functions requiring access to confidential patron account or gaming system information shall be physically present in New Jersey.” Given that sportsbooks will be co-located with casino operations, similar requirements may be feasible.
43 Indiana Sports Betting Report
source of catalytic impacts, as it allows imports/exports to occur in cases where such trade my otherwise not be possible (e.g. air cargo transport of perishable goods).7 In Indiana, expansion of sports wagering could be seen as facilitating catalytic economic impacts occurring in the region. For example, if sports wagering attracts new players to the state, hospitality/tourism businesses may benefit from secondary-purpose trip spending – e.g. an out-of-state sports betting consumer could be an incremental visitor that would also spend money at Indiana hotels and restaurants. Hypothetically, without the on-site wagering, there would be no draw for those incremental travelers to other parts of the economy. With a typical conservative economic impact methodology, those types of potential catalytic impacts are not measured. While we considered inclusion of estimates, those figures would require significant assumptions around consumer behavior that significantly increase the margin of error on our projections. Also, based on our reading of peer-reviewed literature, there is only moderate support for a measurable effect. That said, we are comfortable asserting that the impacts on surrounding businesses will be net positive and note that our figures and methodology reflect a conservative approach. There are plausible reasons to think that there will be more impacts to the Indiana economy than those specifically measured in this study.
1.3.1 Evidence Of Impacts On Surrounding Businesses A commonly occurring public policy question is whether gaming revenue will cannibalize other businesses in the area – in particular, businesses in the hospitality and tourism sector. Fortunately, that topic has received extensive study in academic research, and that has consistently pointed to a non-negative impact. Surrounding businesses either see no impact to the revenue, or a small boost, as a result of gaming expansion.8 One of the important questions in assessing whether economic impact figures can be trusted for policymaking is whether there is a negative impact occurring elsewhere in the economy. As noted above, gaming economics literature suggests that aggregate effects will be positive or nil (not cannibalistic). While we expect this is that case for total impacts, we have made assumptions around changes in household discretionary spending by Indiana residents in particular. We assume that revenue from Indiana residents is diverted from other spending, based on their existing spending patterns.9 This is a conservative approach to economic impact modeling, as some spending may be incremental through a reduction in savings or substitution of out-of-state consumption.
1.4 Economic Multipliers
Economic multipliers are a critical component of economic impact studies. Though we are able to directly estimate some economic impacts, measurement of indirect and induced economic activity is difficult. While it might be possible to conduct a survey of upstream (indirect) and downstream (induced) firms, the survey would need to reach thousands of businesses and account for many different decisions by consumers and firms. In fact, for induced employment, the entire regional economy would need to be measured in some way. In addition to the time and financial resources needed to conduct such surveys, the quality of responses relative to actual impacts would be poor.
7 Source: Economic Impacts of Aviation: Catalytic Impacts. ACED Conference. Available at: http://www.intervistas.com/downloads/presentations/Economic_Impacts_of_Aviation_Catalytic_Impacts_MTR_20Sep2010.pdf 8 For a more thorough discussion of this literature, see ‘Informing the Public Debate: Cannibalization – The Effect of New Casinos on Gaming and Non-Gaming Businesses’ at http://www.unlv.edu/sites/default/files/24/InformingThePublicDebate-Cannibalization.pdf 9 See IMPLAN Social Accounts Reports for spending details.

44 Indiana Sports Betting Report
As an alternative to costly and inaccurate surveys, indirect and induced effects are typically measured by the use of economic multipliers. Multipliers are derived from economic/statistical/accounting models of the general economy. They come in a variety of forms and differ greatly in definition and application. Great care must be exercised in choosing the appropriate set of multipliers to use. The use of multiplier analysis is limited by a number of factors, including:
• The accuracy of the structure and parameters of the underlying model, such as the economic accounts data;
• The application of multipliers to industries “grouped together”, e.g. consider whether indirect gamingimpacts are similar to other tourism industries;
• The level of unemployment in the economy;10
• The assumption of constant returns to scale in production;
• The assumption that the economy's structure is static over time; and
• The assumption that there are no displacement effects.
Further details about the multipliers used as part of this study are provided in subsection 3.1.2.
1.5 Final Methodological Notes
Economic impacts are derived from scenarios described in subsection 1. We note that these projections are sensitive to the assumptions of those forecasts, including the modality of delivery (mobile vs. retail) and the policies of neighboring states. In addition, the figures are sensitive to the assumptions of the economic impact modeling software, IMPLAN, which is an economic model built primarily with U.S. government data and economic theory.11 We rely on standardized economic impact methodologies where feasible, and conservative assumptions around multipliers where standard approaches are not possible.
2. Estimated Impacts
In the tables that follow, we summarize the estimated annual economic impacts associated with sports wagering expansion in Indiana. For purposes of our analysis, we assumed that such expansion would be implemented in accordance with the licensing and tax provisions in Rep. Morrison’s H 1325 (2018). Under that bill:
• Operator licensure would be limited to the state’s 13 commercial casinos
• Casinos would be eligible to offer retail betting, as well as mobile betting
• Casinos would be required to pay a $75,000 initial license fee, along with $5,000 annual administrativefees
• Interactive platform providers would be required to pay a $10,000 initial license fee, along with $5,000annual fees
• Sports betting gross gaming revenue would be taxed at a flat 9.25% rate
10 Multiplier impacts must be interpreted with caution since they may be misleading when the economy experiences high employment and output near industry capacity. 11 More information on the underlying methodologies of IMPLAN are available at: https://implanhelp.zendesk.com/hc/en-us/categories/115001507908-Knowledge-Base
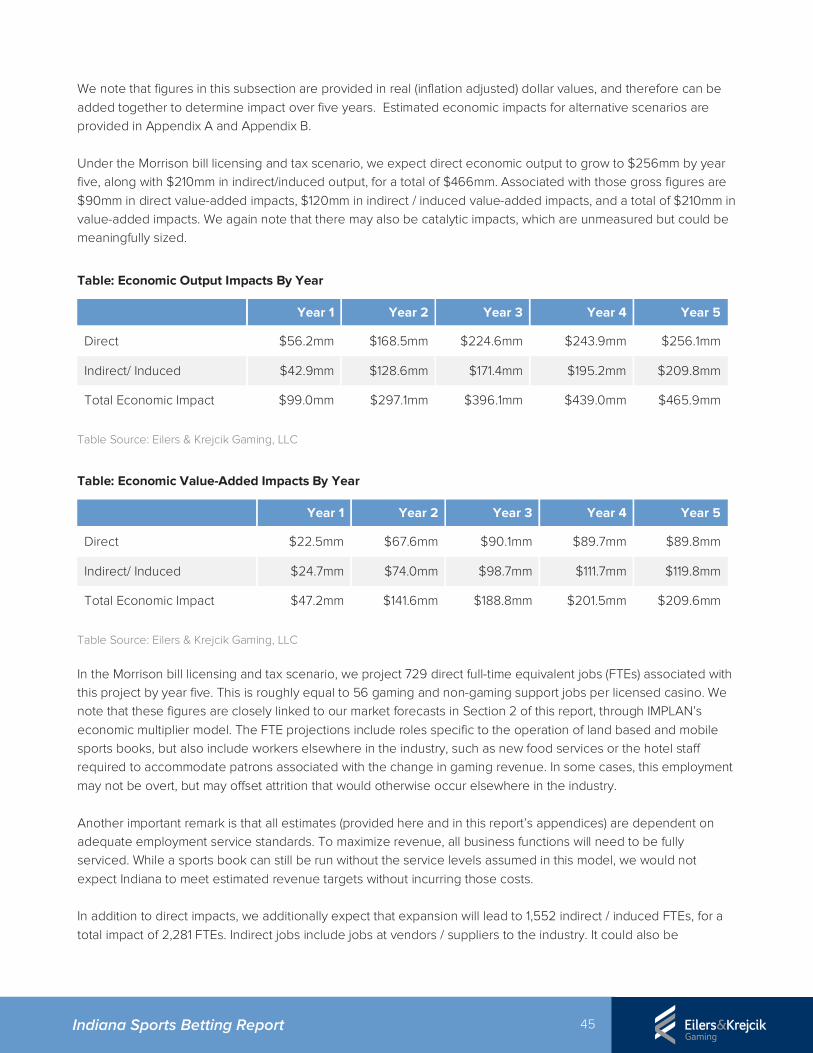
45 Indiana Sports Betting Report
We note that figures in this subsection are provided in real (inflation adjusted) dollar values, and therefore can be added together to determine impact over five years. Estimated economic impacts for alternative scenarios are provided in Appendix A and Appendix B. Under the Morrison bill licensing and tax scenario, we expect direct economic output to grow to $256mm by year five, along with $210mm in indirect/induced output, for a total of $466mm. Associated with those gross figures are $90mm in direct value-added impacts, $120mm in indirect / induced value-added impacts, and a total of $210mm in value-added impacts. We again note that there may also be catalytic impacts, which are unmeasured but could be meaningfully sized.
Table: Economic Output Impacts By Year
Year 1 Year 2 Year 3 Year 4 Year 5
Direct $56.2mm $168.5mm $224.6mm $243.9mm $256.1mm
Indirect/ Induced $42.9mm $128.6mm $171.4mm $195.2mm $209.8mm
Total Economic Impact $99.0mm $297.1mm $396.1mm $439.0mm $465.9mm
Table Source: Eilers & Krejcik Gaming, LLC
Table: Economic Value-Added Impacts By Year
Year 1 Year 2 Year 3 Year 4 Year 5
Direct $22.5mm $67.6mm $90.1mm $89.7mm $89.8mm
Indirect/ Induced $24.7mm $74.0mm $98.7mm $111.7mm $119.8mm
Total Economic Impact $47.2mm $141.6mm $188.8mm $201.5mm $209.6mm
Table Source: Eilers & Krejcik Gaming, LLC
In the Morrison bill licensing and tax scenario, we project 729 direct full-time equivalent jobs (FTEs) associated with this project by year five. This is roughly equal to 56 gaming and non-gaming support jobs per licensed casino. We note that these figures are closely linked to our market forecasts in Section 2 of this report, through IMPLAN’s economic multiplier model. The FTE projections include roles specific to the operation of land based and mobile sports books, but also include workers elsewhere in the industry, such as new food services or the hotel staff required to accommodate patrons associated with the change in gaming revenue. In some cases, this employment may not be overt, but may offset attrition that would otherwise occur elsewhere in the industry. Another important remark is that all estimates (provided here and in this report’s appendices) are dependent on adequate employment service standards. To maximize revenue, all business functions will need to be fully serviced. While a sports book can still be run without the service levels assumed in this model, we would not expect Indiana to meet estimated revenue targets without incurring those costs. In addition to direct impacts, we additionally expect that expansion will lead to 1,552 indirect / induced FTEs, for a total impact of 2,281 FTEs. Indirect jobs include jobs at vendors / suppliers to the industry. It could also be
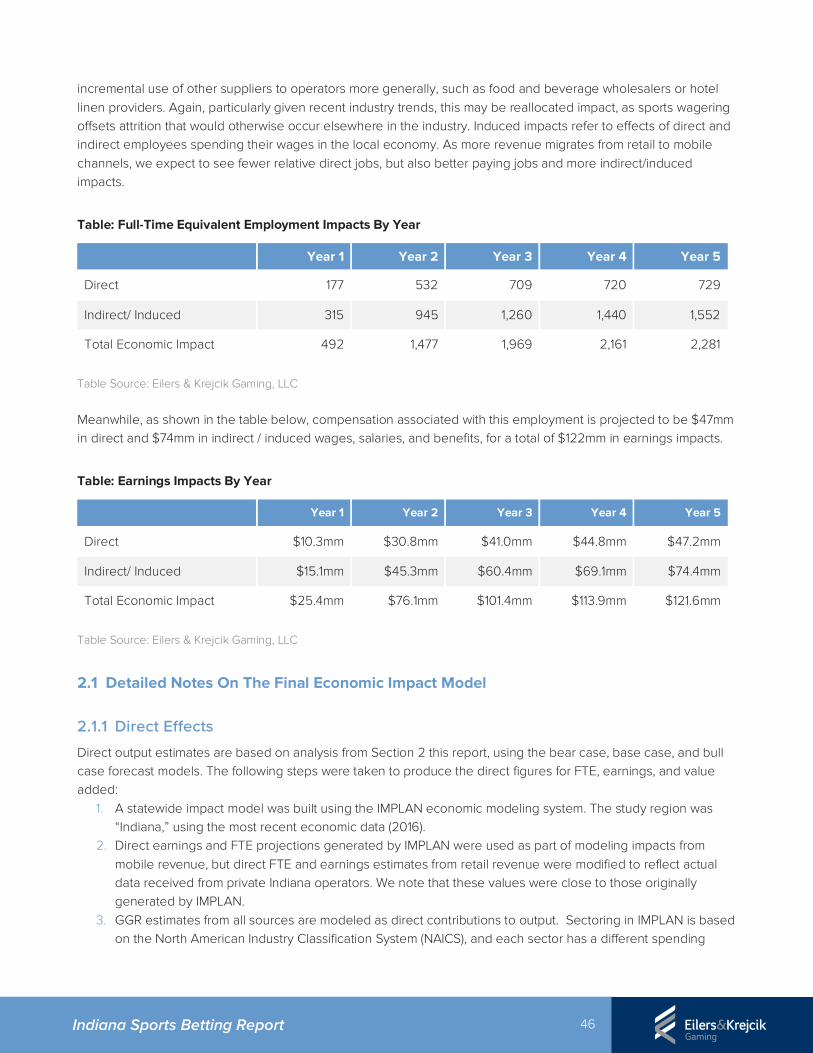
46 Indiana Sports Betting Report
incremental use of other suppliers to operators more generally, such as food and beverage wholesalers or hotel linen providers. Again, particularly given recent industry trends, this may be reallocated impact, as sports wagering offsets attrition that would otherwise occur elsewhere in the industry. Induced impacts refer to effects of direct and indirect employees spending their wages in the local economy. As more revenue migrates from retail to mobile channels, we expect to see fewer relative direct jobs, but also better paying jobs and more indirect/induced impacts.
Table: Full-Time Equivalent Employment Impacts By Year
Year 1 Year 2 Year 3 Year 4 Year 5
Direct 177 532 709 720 729
Indirect/ Induced 315 945 1,260 1,440 1,552
Total Economic Impact 492 1,477 1,969 2,161 2,281
Table Source: Eilers & Krejcik Gaming, LLC
Meanwhile, as shown in the table below, compensation associated with this employment is projected to be $47mm in direct and $74mm in indirect / induced wages, salaries, and benefits, for a total of $122mm in earnings impacts.
Table: Earnings Impacts By Year
Year 1 Year 2 Year 3 Year 4 Year 5
Direct $10.3mm $30.8mm $41.0mm $44.8mm $47.2mm
Indirect/ Induced $15.1mm $45.3mm $60.4mm $69.1mm $74.4mm
Total Economic Impact $25.4mm $76.1mm $101.4mm $113.9mm $121.6mm
Table Source: Eilers & Krejcik Gaming, LLC
2.1 Detailed Notes On The Final Economic Impact Model
2.1.1 Direct Effects Direct output estimates are based on analysis from Section 2 this report, using the bear case, base case, and bull case forecast models. The following steps were taken to produce the direct figures for FTE, earnings, and value added:
1. A statewide impact model was built using the IMPLAN economic modeling system. The study region was “Indiana,” using the most recent economic data (2016).
2. Direct earnings and FTE projections generated by IMPLAN were used as part of modeling impacts from mobile revenue, but direct FTE and earnings estimates from retail revenue were modified to reflect actual data received from private Indiana operators. We note that these values were close to those originally generated by IMPLAN.
3. GGR estimates from all sources are modeled as direct contributions to output. Sectoring in IMPLAN is based on the North American Industry Classification System (NAICS), and each sector has a different spending
47 Indiana Sports Betting Report
pattern based on data from the Bureau of Economic Analysis. We used NAICS code 495 (“Gambling industries except casino hotels”) to model land-based spending impacts and NAICS code 432 (“Internet publishing and broadcasting and web search portals”) to model digital/mobile based wagers. These are similar sector choices as have been used by recent gaming economic impact models using IMPLAN.12
2.1.2 Multipliers Typically, multipliers used in economic impact methodologies are derived from general equilibrium analysis of the local economy using Input-Output (I-O) analysis. While such methods are not without limitation (such as a static interpretation of industries relative effects on one another), I-O analysis provides a robust and elegant solution to estimating secondary impacts. As part of this study’s due diligence, the research team reviewed economic models/multipliers from multiple organizations. Most I-O or general equilibrium models of the U.S. economy are fundamentally based off similar data collected by the Bureau of Economic Analysis, the Bureau of Labor Statistics, and other government agencies. We chose IMPLAN based on its reputation, longevity, transparent methodology, and widespread use for gambling-related studies. Indirect and induced multipliers are modeled as given by IMPLAN’s methodology. IMPLAN provides several methodological notes as part of its multiplier descriptions, which may be of interest to some readers:13
• Constant Returns to Scale: This means that the same quantity of inputs is needed per unit of output, regardless of the level of production. In other words, if output increases by 10%, input requirements will also increase by 10%.
• No Supply Constraints: I-O assumes there are no restrictions to raw materials and employment and assumes there is enough to produce an unlimited amount of product. It is up to the user to decide whether this is a reasonable assumption for their study area and analysis, especially when dealing with large-scale impacts.
• Fixed Input Structure: This structure assumes that changes in the economy will affect the industry's output level but not the mix of commodities and services it requires to produce that output. In other words, there is no input substitution in response to a change in output.
• Industry Technology Assumption: An industry will always produce the same mix of commodities regardless of the level of production. In other words, an industry will not increase the output of one product without proportionately increasing the output of all its other products. Industry by-product coefficients are constant.
• Commodity Technology Assumption: The commodity technology assumption comes into play when data are collected on an industry-by-commodity basis and then converted to industry-by-industry matrices. It assumes that an industry uses the same technology to produce each of its products. In other words, an industry's production function is a weighted average of the inputs required for the production of the primary product and each of the by-products, weighted by the output of each of the products.
• The Model is Static: No price changes are built in. The underlying data and relationships are not affected by
impact runs. The relationships for a given year do not change unless another data year is purchased.
12 E.g. Economic Impact of New Jersey Online Gaming: Lessons Learned by Nathan Associates Inc. and Victor-Strategies. 13 Source: Key Assumptions of IMPLAN & Input/Output Analysis
48 Indiana Sports Betting Report
2.1.3 Other Methodological Notes The research team made many considerations that do not directly appear in the economic analysis methodology. These cover several areas that may be of interest to the reader:
• Historical growth and gaming performance were examined. The review captured the fundamental changes that could not have been predicted prior to their occurrence. This informs the understanding of potential magnitudes of impacts that future changes could be expected to absorb.
• The research team closely monitored public policy debates at a federal and state level to develop the potential outcome scenarios; however, we note that there is a high degree of uncertainty with these scenarios.
• The research team recognized that present population demographics of Indiana and surrounding areas visitors may not reflect the future state. We assume no remarkable changes over a five-year period.
• The gaming industry is highly sensitive to broader changes in the general economy. These forecasts assume a relatively stable period of economic growth. Economic growth within industries tends to occur in cycles, which may include declines or prolonged periods of reduced growth rates. Attempts to predict when cycles will occur have historically been unreliable and any effort to do so would be highly subjective and less useful (in terms of overall accuracy) than analysis that attempts to understand fundamental or structural reasons for decision making
• The project assumes linearity in the secondary impacts of direct activity. Economies of scale in production or “trigger points” that require proportionally more capital / support services were not modeled, aside from a ramp-up period across the first three years of operation.
• The research team’s analyses are adjusted based on the assumption that structural components of the industry’s gambling industry will support industry development if needed – e.g. expansion of hospitality services.
3. Fiscal Analysis
3.1 Revenue Impacts
3.1.1 Principles Of An Effective Tax System Tax systems are complex policy considerations, which must balance competing interests. Professor Larry DeBoer, an economist at Purdue University, describes five key principles to an effective tax system: Economic Competitiveness; Equity or Fairness; Stability or Predictability; Adequacy or Revenue Yield; and Administrative Efficiency.14 These principles generally align with other experts in the field, and are discussed below in the context of sports betting reform:
I. Efficiency: In typical economic approaches to tax policy, a central objective is to have taxes change behavior as little as possible, while still raising revenue. The objective is to have the tax framework be “non-distortive”. This enables the maximum economic impact – marginal consumers are served, which increases firm profits, increases employment, and maximizes consumer surplus. In most gambling markets, a shifted outlook is also
14 Source: https://www.agecon.purdue.edu/crd/localgov/essays/goodtax.htm
49 Indiana Sports Betting Report
needed, since there are typically limits on the number of available casino licenses that already distort firm and consumer behavior. The market is not completely open. Since licenses are restricted, the gaming economy is not perfectly competitive, and a gambling tax that is sufficiently small may actually be non-distortive. This occurs because the government can simply recapture some monopoly-related profit back from the operators through the GGR tax. Policymakers must still be cautious because, if the tax is too large, even more distortions will occur, leading to a less efficient economic outcome.
II. Equality or Fairness: Principles of equality and fairness generally refer to the idea that taxes should have
similar impacts on similar groups of taxpayers, and that the system as a whole should reflect, to some extent, ability to pay. While this is generally a concept that is more relevant to income tax structures than firm profit or gross revenue taxes, it is still a relevant consideration in terms of firms’ ability to compete with one another, and the downstream impact of taxes on the final consumers of the good/service.
III. Revenue Adequacy: Apart from incidence and efficiency, tax systems as a whole need to sufficiently fund
the needs of government spending. In periods of gaming expansion, this includes adequately funding the costs of regulation, administration, and other public costs, such as funding for problem gambling treatment programs.
IV. Stability or Predictability: In addition to funding typical appropriations in stable economic periods, tax policies
must consider the ability for revenues to remain stable (or at least, predictable) in periods of increased instability. As GGR taxes will vary proportionally with consumer spending, which tends to move closely with business cycles, some fixed revenue sources should be considered. For example, it may be reasonable to use license fees as the primary revenue source for any commission costs associated with offering sports wagering.
V. Simplicity and Accountability: Last, effective tax systems retain a design that is as simple and transparent as
possible. This reduces burden to the taxpayer and builds public trust through improved understanding of the system.
A moderately sized tax can raise public revenue without affecting economic efficiency if it occurs in a market where there are a limited number of licenses.
3.1.2 Relationship Between Employment, Capital Investment, And Tax Rates
Since gross gaming revenue (GGR) taxes are applied to revenue rather than net income, they have a significant impact on operating profit. High tax rates reduce or eliminate the profitability of serving many casual gamblers, as the margins on these players may already be small, particularly for low margin games like sports wagering. We see the effects of these influences by changes in casino investment in capital expenditures and employment. In addition to affecting initial capital investment, GGR tax rates have been linked to changes in casino employment. It has been estimated that a 1% increase in direct gross gaming tax revenue is related to a 0.6% decrease in direct casino employment.15 One reason for this change may be a change in focus by gaming companies. With high tax rates, the marginal (typically casual) gamblers become unprofitable to serve, due to their lower gambling volume and higher need for marketing spending. This distortion of firm behavior results in a reduced staffing and a lower
15 See: The impact of casino tax policy on short-run gaming development, by Kahlil Philander. http://www.sciencedirect.com/science/article/pii/S0161893815000095
50 Indiana Sports Betting Report
overall economic impact. Increases in direct revenue from gaming taxes must be balanced against wider impacts on employment and the economy.
3.1.3 High Inter-Jurisdiction Competition
One of the key issues with supporting a regulated sports wagering industry is competing with unregulated gaming companies and potential offerings from other states. However, if taxes are too high at the margin, the resulting high prices will drive consumers toward illegal operations with more competitive pricing and products. For example, a 2014 report by PwC provides a cautionary case of an overly onerous tax rate on the regulated digital / mobile gaming market:
“[We] believe that the relatively high rate of tax in the French market (i.e. compared to Denmark and Italy) has been the cause of the relatively low rate of regulated market growth of 1% p.a. between 2011 and 2013 and has held back the proportion of the market which is [regulated] compared to the higher rates achieved in Italy and Denmark.”16
Similar situations have occurred in the legal domestic casino market. For example, during the early 2000s, Illinois increased its top casino tax rate from 20% to 70%, and then saw revenues drop significantly, as much of their traffic migrated to Indiana. The state then lowered the tax rate to 50% in response to the unanticipated change in demand. Evidence showed that casinos in the bordering U.S. states of Illinois and Indiana shifted their marketing spending in response to tax rate changes, in order to encourage players to gamble in the state with the lower tax rate.17 Gaming companies operating in multiple jurisdictions may also change their focus, depending on the available tax rates in those jurisdictions. As the gaming industry continues to grow globally, the role of government in providing a competitive policy framework has become as important to visitor attraction as the role of the operators themselves. A higher tax rate will reduce investment by gaming firms in marginal customers, and therefore make the market less attractive for visitors deciding on a tourism or gaming destination.
3.1.4 Other Tax Policy Considerations
While tax rates can be transferred on to consumers in the form of higher prices, they also can get passed on as lower product quality, thereby reducing benefits to consumers. The long-run impact may be reduced demand / revenue over time. A recent study by the UK government explored the potential impact of changes in taxes, and as part of interviews with operators, several interesting insights into decisions that can be made were provided.18 One large terrestrial betting firm suggested that because free bets were included in revenues (and so subject to General Betting Duty), their use was reduced, contrasting the use of free bets on machines (where they are not subject to tax). The firm
16 Online betting and gaming regulation 2014, by PWC: https://www.pwc.se/sv_SE/se/media/assets/online-betting-and-gaming-regulation-2014.pdf 17 Impact of the 2003 Illinois Gaming Tax Rate Increase on Marketing Spending and Cross-State Substitution, by Mikael Ahlgren: http://digitalscholarship.unlv.edu/cgi/viewcontent.cgi?article=2704&context=thesesdissertations 18 Source: https://www.gov.uk/government/publications/the-uk-betting-and-gaming-market-price-elasticities-of-demand-and-use-of-promotions
51 Indiana Sports Betting Report
was also actively considering how the duty system would treat free bets fo remote betting following the move to a place of consumption tax:
“INTERVIEWER: So [the tax treatment of promotions] is something you consciously think about in determining the use of promotions across difference activities? INTERVIEWEE: Yes, definitely, and it’s a key discussion at the moment in terms of point of consumption tax. The tax treatment of free bets and the technical requirements in terms of wagering requirements is something that will significantly influence how we use free bets.” – Terrestrial betting company (#7) “… on the gaming side there are a whole variety of different mechanisms [for promotions]. If for whatever reason some of them fall outside being considered value deductions by the UK tax regime then we’ll have to shift quite significantly the way that we do things towards promotions that are considered deductible.” – Remote betting and gaming company (#6)
While not directly related to sports, these insights highlight the importance of considering how taxes are applied. Failure to allow deduction of some promotional costs from GGR tax payments may lead to adverse consequences over the long run.
3.1.5 Other Jurisdictions’ GGR Tax Framework
Analyses of sports wagering developments often focus on Nevada and the UK, due to their size and high-profile success. In this subsection, we describe the Nevada and UK markets in the context of their gaming tax systems, and also highlight potential legislation in other U.S. states.
3.1.5.1 Nevada
Nevada has adopted a tax structure that is predominantly designed to maximize the size and economic impact of the casino resort industry, rather than maximize the state’s tax revenue. The state has a 6.75% tax rate on all forms of gaming, including sports wagering. This is the lowest gaming tax rate in the country. There are also some less significant taxes that are incurred by gaming operators, such as room-night and entertainment taxes. In addition to the Nevada tax, sports betting operators must pay a federal tax of 0.25% on total handle (i.e., the amount bet). This tax would apply to operators in any state that legalizes sports betting, although there is a nascent effort underway at the federal level to do away with the tax. Nevada’s approach maximizes investment by firms, and aligns well with its other policies, such as an absence of quotas on gaming licenses. While it is in Indiana’s best interest to maximize capital investment as was done in Nevada, we assume there will not be an unlimited license structure and therefore a higher rate can be supported. However, higher rates should consider relative competitiveness with surrounding states that could also compete for business. Due to Nevada’s low tax structure, its casinos are not at a disadvantage in terms of being able to offer their potential consumers a competitive product.
3.1.5.2 United Kingdom
The United Kingdom has a 15% tax on gross gaming revenue for both land-based, digital platform, and mobile app sports betting. The UK rate falls to the low end of the international spectrum. The UK market has produced a
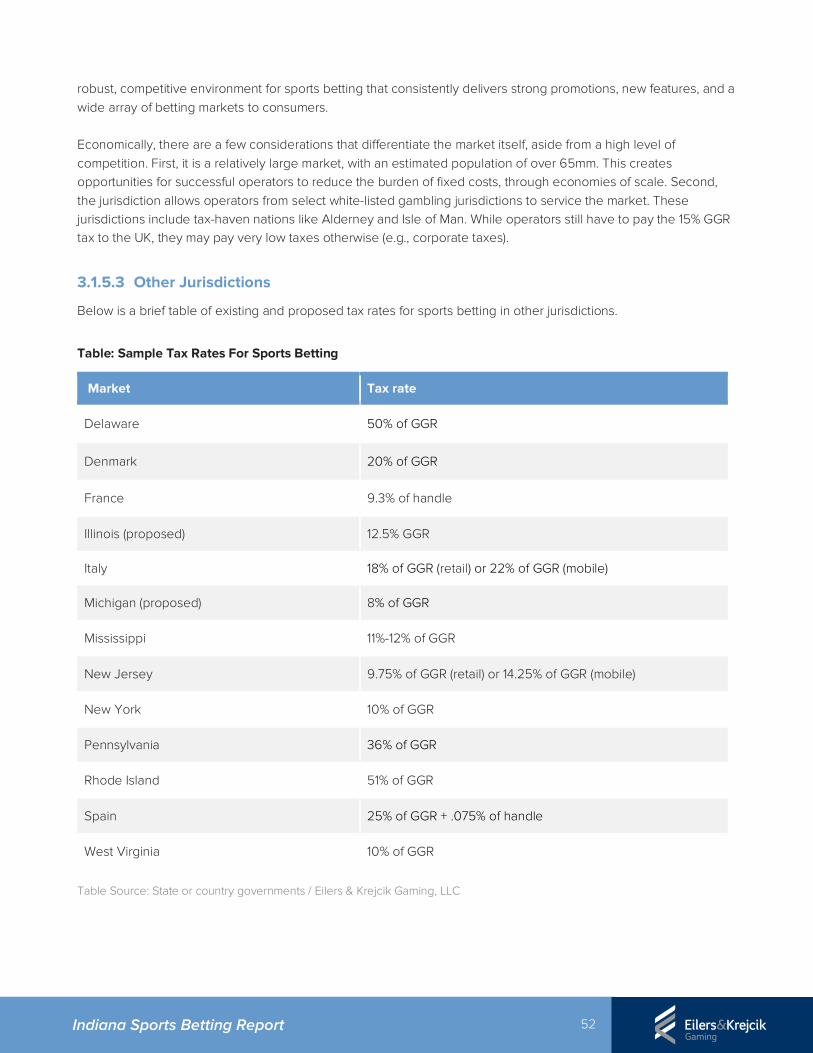
52 Indiana Sports Betting Report
robust, competitive environment for sports betting that consistently delivers strong promotions, new features, and a wide array of betting markets to consumers. Economically, there are a few considerations that differentiate the market itself, aside from a high level of competition. First, it is a relatively large market, with an estimated population of over 65mm. This creates opportunities for successful operators to reduce the burden of fixed costs, through economies of scale. Second, the jurisdiction allows operators from select white-listed gambling jurisdictions to service the market. These jurisdictions include tax-haven nations like Alderney and Isle of Man. While operators still have to pay the 15% GGR tax to the UK, they may pay very low taxes otherwise (e.g., corporate taxes).
3.1.5.3 Other Jurisdictions
Below is a brief table of existing and proposed tax rates for sports betting in other jurisdictions.
Table: Sample Tax Rates For Sports Betting
Market Tax rate
Delaware 50% of GGR
Denmark 20% of GGR
France 9.3% of handle
Illinois (proposed) 12.5% GGR
Italy 18% of GGR (retail) or 22% of GGR (mobile)
Michigan (proposed) 8% of GGR
Mississippi 11%-12% of GGR
New Jersey 9.75% of GGR (retail) or 14.25% of GGR (mobile)
New York 10% of GGR
Pennsylvania 36% of GGR
Rhode Island 51% of GGR
Spain 25% of GGR + .075% of handle
West Virginia 10% of GGR
Table Source: State or country governments / Eilers & Krejcik Gaming, LLC
53 Indiana Sports Betting Report
3.2 Proposed Tax Framework
Expanded sports wagering in the existing Indiana market creates some added layers of consideration for tax frameworks. Under the Morrison bill licensing and tax scenario we modeled, land-based wagering would be limited to the current operating locations of the 13 in-state casinos. This creates market power, and higher profits than would be observed in a perfectly competitive market. However, sports wagering is a lower margin product than typical games of chance that are available in Indiana, therefore a unique tax treatment is warranted. In addition, competitive pressures from surrounding states and offshore operators are uncertain. Indiana may have to face competing state products soon after legalization or potentially many years into the future. Based on our assessment of the potential Indiana sports betting market, we see several interrelated objectives:
1. Offset the increased costs of administration and regulation of sports wagering, caused by expansion in the state.
2. Obtain the state’s share of economic rents, created by the limited number of allowable gaming operators in the state.
3. Maximize the size of the sports wagering market, in order to benefit consumers.
4. Hedge state and operator risk, created by uncertainty in competitive pressures from surrounding state policies.
The Morrison bill licensing and tax scenario we modeled assumes a 9.25% GGR tax rate, paired with annual license fees applied to operators and interactive platform providers. At 9.25% of GGR, the flat tax should be low relative to most other jurisdictions. Nevada is the only noteworthy exception at this juncture. With this rate, there is a financial incentive for operators to serve most of the market, not just high margin customers. With high marginal tax rates (e.g., a high or escalating tax rate), customers that have lower spend or high marketing costs will be unprofitable for operators. At 9.25%, we expect that operators will be able to profitably attract all available customers to their properties, and we expect that it is unlikely that the market demand will be distorted (beyond constraints already created by the limited license structure). Since operator decisions are made at the margin, a low marginal rate will keep Indiana operators competitive with illegal gambling operators and with out-of-state operators (if sports betting, as we anticipate it will be, is legalized in bordering states).
3.3 Estimated Tax Impacts
Our estimate of tax revenue is provided in the table below. Note that this estimate blends our base case market forecasts (set out in Section 2 of this report) with the Morrison bill licensing and tax scenario. Under this estimate, which we view as the most appropriate for fiscal budgeting, we project that GGR tax revenues will climb to roughly $24mm by year five. Including taxes from other economic impacts, comprising households / individuals and firms, we expect public revenue to grow to $38mm in year five, although some of the licensing fee related funds are allocated to manage increases in administrative costs. Tax estimates for bear case and bull case scenarios, along with estimates for retail-only scenarios, are provided in Appendices A-E.
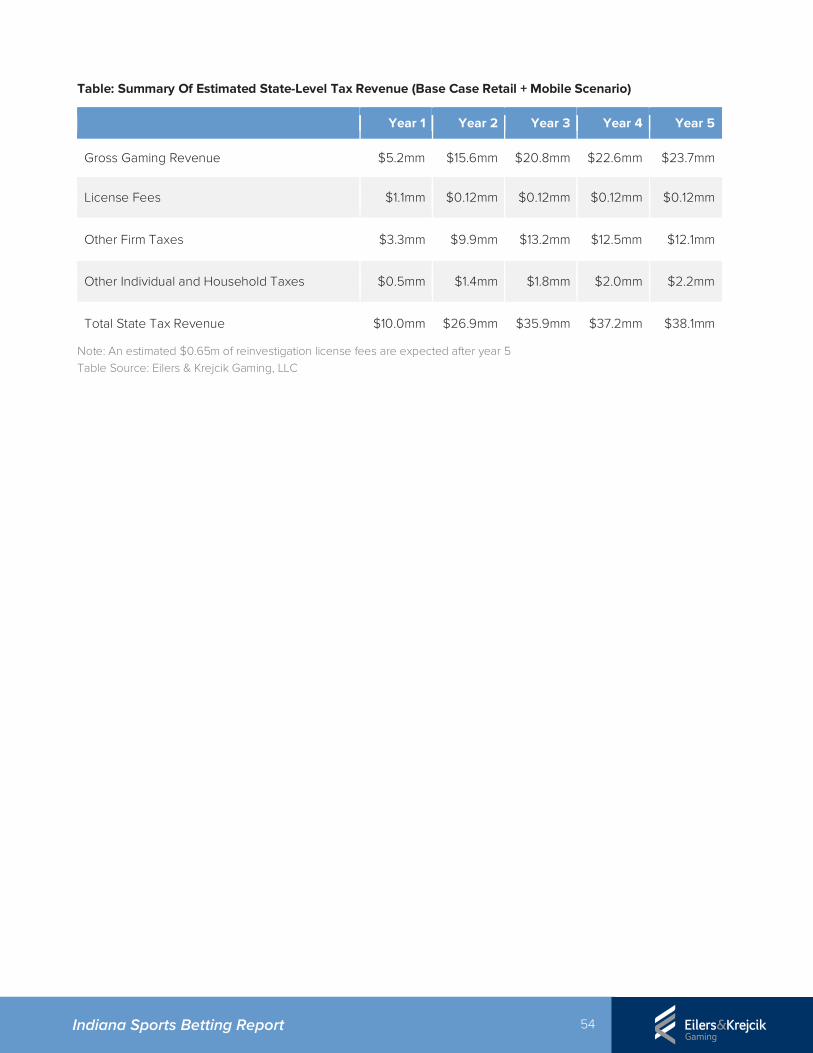
54 Indiana Sports Betting Report
Table: Summary Of Estimated State-Level Tax Revenue (Base Case Retail + Mobile Scenario)
Year 1 Year 2 Year 3 Year 4 Year 5
Gross Gaming Revenue $5.2mm $15.6mm $20.8mm $22.6mm $23.7mm
License Fees $1.1mm $0.12mm $0.12mm $0.12mm $0.12mm
Other Firm Taxes $3.3mm $9.9mm $13.2mm $12.5mm $12.1mm
Other Individual and Household Taxes $0.5mm $1.4mm $1.8mm $2.0mm $2.2mm
Total State Tax Revenue $10.0mm $26.9mm $35.9mm $37.2mm $38.1mm
Note: An estimated $0.65m of reinvestigation license fees are expected after year 5 Table Source: Eilers & Krejcik Gaming, LLC
55 Indiana Sports Betting Report
Crafting effective sports betting legislation requires balancing a complex mix of public policy goals, stakeholder considerations, and consumer demands. In this section we identify what we believe are the primary considerations facing policymakers as they grapple with the question of legal sports betting. The section identifies seven key policy considerations:
• Distribution model: How will sports betting be made available to consumers?
• Skins: How many brands will be allowed to operate under each key license?
• Limitations on betting markets: What games / types of bets will be permitted?
• Data sources: Will operators be required to use certain data sources to make and settle bets?
• Integrity fee / league royalties: Will operators be required to make payments to professional sports leagues?
• Tax rate: What tax rate will be assigned, and how will it be structured?
• Licensure: What kinds of licenses will be required, and what rates will be attached? For each consideration, we offer the following context:
• Overview
• Plausible scenarios
• Stakeholder dynamics
• Survey of other state approaches
• Other relevant precedents
• Key takeaways The section concludes by identifying and briefly discussing secondary and tertiary policy considerations. This section is primarily meant to serve as an objective survey of the core issues and decisions involved in legalizing sports betting. Our key takeaways for each policy consideration provide our professional opinion on the general policy direction that will ensure a regulated sports betting market that maximizes overall revenue while taking the greatest share of demand possible from the black market for sports betting.
5a. KEY POLICY CONSIDERATIONS: INTRODUCTION
56 Indiana Sports Betting Report
Overview
Distribution model refers to how the state decides to make regulated sports betting available to consumers. Key questions here include what channels the state allows (e.g., retail, mobile) and what, if any, restrictions the state places on those channels (e.g., requiring in-person sign up for mobile sports betting accounts).
Plausible Scenarios
There are two primary distribution channels for regulated sports betting: Retail (i.e., betting in person) and mobile (i.e., betting over the internet from within Indiana's borders). The state could choose to allow retail only, or allow a mix of retail and mobile availability. There are a number of additional options the state could consider for each channel to further impact availability:
• Potential retail outlets
o Casinos
o Existing OTBs
o New form of OTB-like facility designated specifically for sports betting
o Lottery retailers
o VGT outlets (should Indiana permit VGTs)
o Sports venues
o Other
• Mobile models
o On-premise only: Consumers can only bet online when physically located on the property of an approved retail outlet like a casino.
o In-person registration required: Consumers must create or fund your mobile account at an approved retail outlet, but then can bet from anywhere in the state).
o Open: Consumers can create and fund their account from anywhere, and can place bets from anywhere within the state.
Direct Impacts
Broadly speaking, there is a positive correlation between increased availability of sports betting and the success of the market. Decisions around the distribution model specifically impact the following aspects of a regulated sports betting market (impacts ordered by perceived relative severity):
5b. KEY POLICY CONSIDERATIONS: DISTRIBUTION MODEL
57 Indiana Sports Betting Report
• Market size: Wider availability will almost always generate a larger market in terms of overall handle and revenue.
• Black market capture rate: Wider availability will result in a greater transfer of demand from the black market to the regulated market. Correspondingly, narrower availability will likely motivate more consumers to stick with the black market (e.g., a regulated market with no mobile option will certainly lose some customers to black market sites with easily-accessible mobile options).
• Competition: Wider availability should increase the competition between individual sports betting providers as a wider population of potential customers comes into play. Limited availability should result in consumers choosing a sports betting product based on convenience rather than price or quality.
• Competitive balance: Wider availability has a mixed impact on competitive balance. On one hand, well-funded operators can leverage their existing strength to compete for a larger share of a wide-open market. On the other, smaller operators can leverage unique expertise or tactics to punch above their weight in the market, a phenomenon on full display in New Jersey's online casino industry.
Stakeholder Dynamics
The professional sports leagues that have weighed in on the issue appear to support broad distribution models. Notably, the leagues who have made their position clear (including the NBA, MLB, and PGA) are firmly in favor of allowing mobile sports betting. Things are fuzzier when it comes to commercial casinos. The industry is generally likely to oppose expanded retail availability. But mobile availability is a more decisive issue19. Variables that influence a given casino's position on mobile include their relative expertise when it comes to online betting, their perception of how mobile will advantage or disadvantage their business, and their presence (or lack thereof) in other states expected to authorize mobile betting. Tribal casinos will generally oppose expanded retail availability. The question of mobile sports betting is a more complicated one for tribes due to IGRA considerations, an analysis of which is beyond the scope of this report. Other retail stakeholders (e.g., lottery retailers) will support expanded retail availability insomuch that it leads to them being able to offer sports betting, and otherwise oppose. They are also likely to oppose mobile sports betting. Other gambling stakeholders (e.g., the lottery, charitable gambling) are broadly likely to embrace similar positions. The above is a surface analysis and does not consider the web of unique dynamics that might influence a given stakeholder to break type.
How Are Other States Approaching Sports Betting Distribution Models?
The national legislative conversation around sports betting is still in the early stages. We have seen no true consensus on the question to date, and we do not expect a true consensus to emerge as more states chime in. If anything, we expect to see a greater array of unique models as additional states authorize sports betting. The one
19 Online gambling has historically been a divisive issue for the U.S. gambling industry. See: https://www.onlinepokerreport.com/29432/agas-online-gaming-position/
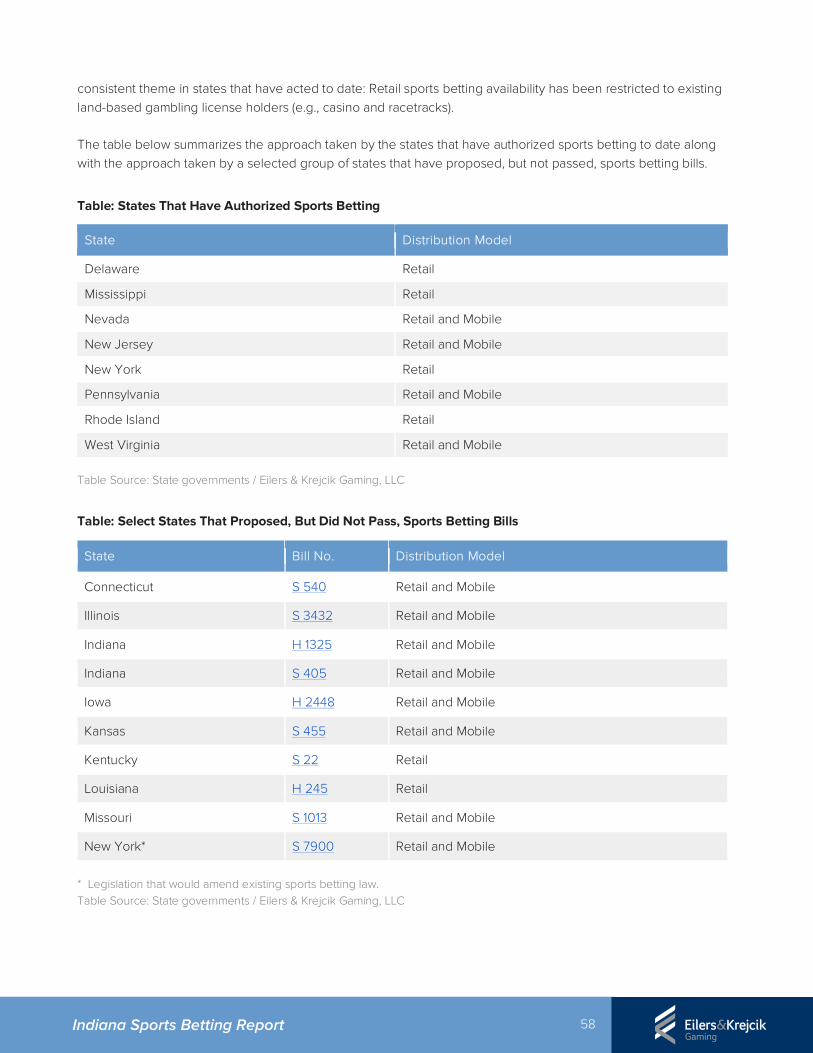
58 Indiana Sports Betting Report
consistent theme in states that have acted to date: Retail sports betting availability has been restricted to existing land-based gambling license holders (e.g., casino and racetracks). The table below summarizes the approach taken by the states that have authorized sports betting to date along with the approach taken by a selected group of states that have proposed, but not passed, sports betting bills.
Table: States That Have Authorized Sports Betting
State Distribution Model
Delaware Retail
Mississippi Retail
Nevada Retail and Mobile
New Jersey Retail and Mobile
New York Retail
Pennsylvania Retail and Mobile
Rhode Island Retail
West Virginia Retail and Mobile
Table Source: State governments / Eilers & Krejcik Gaming, LLC
Table: Select States That Proposed, But Did Not Pass, Sports Betting Bills
State Bill No. Distribution Model
Connecticut S 540 Retail and Mobile
Illinois S 3432 Retail and Mobile
Indiana H 1325 Retail and Mobile
Indiana S 405 Retail and Mobile
Iowa H 2448 Retail and Mobile
Kansas S 455 Retail and Mobile
Kentucky S 22 Retail
Louisiana H 245 Retail
Missouri S 1013 Retail and Mobile
New York* S 7900 Retail and Mobile
* Legislation that would amend existing sports betting law. Table Source: State governments / Eilers & Krejcik Gaming, LLC
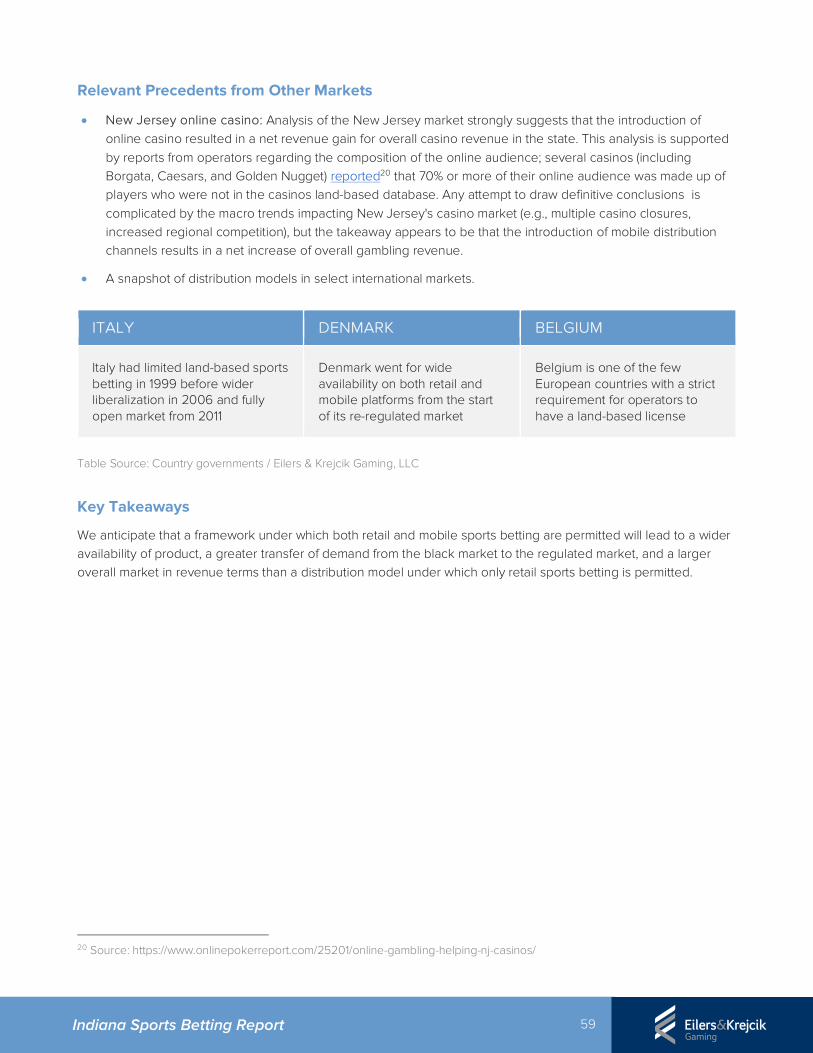
59 Indiana Sports Betting Report
Relevant Precedents from Other Markets
• New Jersey online casino: Analysis of the New Jersey market strongly suggests that the introduction of online casino resulted in a net revenue gain for overall casino revenue in the state. This analysis is supported by reports from operators regarding the composition of the online audience; several casinos (including Borgata, Caesars, and Golden Nugget) reported20 that 70% or more of their online audience was made up of players who were not in the casinos land-based database. Any attempt to draw definitive conclusions is complicated by the macro trends impacting New Jersey's casino market (e.g., multiple casino closures, increased regional competition), but the takeaway appears to be that the introduction of mobile distribution channels results in a net increase of overall gambling revenue.
• A snapshot of distribution models in select international markets.
ITALY DENMARK BELGIUM
Italy had limited land-based sports betting in 1999 before wider liberalization in 2006 and fully open market from 2011
Denmark went for wide availability on both retail and mobile platforms from the start of its re-regulated market
Belgium is one of the few European countries with a strict requirement for operators to have a land-based license
Table Source: Country governments / Eilers & Krejcik Gaming, LLC
Key Takeaways
We anticipate that a framework under which both retail and mobile sports betting are permitted will lead to a wider availability of product, a greater transfer of demand from the black market to the regulated market, and a larger overall market in revenue terms than a distribution model under which only retail sports betting is permitted.
20 Source: https://www.onlinepokerreport.com/25201/online-gambling-helping-nj-casinos/
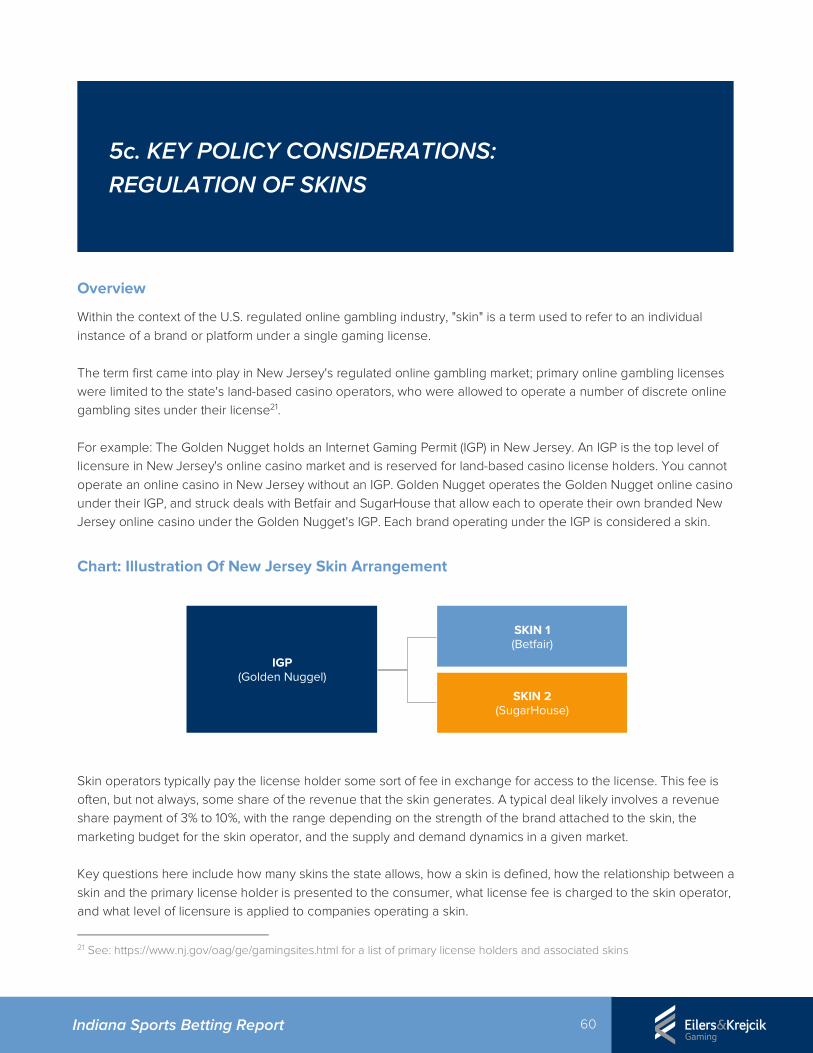
60 Indiana Sports Betting Report
Overview
Within the context of the U.S. regulated online gambling industry, "skin" is a term used to refer to an individual instance of a brand or platform under a single gaming license. The term first came into play in New Jersey's regulated online gambling market; primary online gambling licenses were limited to the state's land-based casino operators, who were allowed to operate a number of discrete online gambling sites under their license21. For example: The Golden Nugget holds an Internet Gaming Permit (IGP) in New Jersey. An IGP is the top level of licensure in New Jersey's online casino market and is reserved for land-based casino license holders. You cannot operate an online casino in New Jersey without an IGP. Golden Nugget operates the Golden Nugget online casino under their IGP, and struck deals with Betfair and SugarHouse that allow each to operate their own branded New Jersey online casino under the Golden Nugget's IGP. Each brand operating under the IGP is considered a skin.
Chart: Illustration Of New Jersey Skin Arrangement
Skin operators typically pay the license holder some sort of fee in exchange for access to the license. This fee is often, but not always, some share of the revenue that the skin generates. A typical deal likely involves a revenue share payment of 3% to 10%, with the range depending on the strength of the brand attached to the skin, the marketing budget for the skin operator, and the supply and demand dynamics in a given market. Key questions here include how many skins the state allows, how a skin is defined, how the relationship between a skin and the primary license holder is presented to the consumer, what license fee is charged to the skin operator, and what level of licensure is applied to companies operating a skin.
21 See: https://www.nj.gov/oag/ge/gamingsites.html for a list of primary license holders and associated skins
IGP(Golden Nuggel)
SKIN 1(Betfair)
SKIN 2(SugarHouse)
5c. KEY POLICY CONSIDERATIONS: REGULATION OF SKINS
61 Indiana Sports Betting Report
Plausible Scenarios
The state could adopt a highly restrictive approach, an unrestricted approach, or something between the two poles. Unlike some of our other key policy points, the question of how to best handle skins covers largely uncharted territory.
• Most restrictive: The state allows casino license holders to only operate mobile sportsbooks under their existing land-based casino brand.
• Moderately restrictive: The state allows license holders to operate 1-2 unique mobile sports betting brands with the option of using or not using their existing casino brand.
• Moderately permissive: The state allows license holders to operate 3-5 mobile sports betting brands with the option of using or not using their existing casino brand.
• Unrestricted: The state places no restriction (or a cap that is unrestricted for all intents and purposes) on the number of brands.
Direct Impacts
While it may appear a somewhat-obscure issue, the skins question can have a dramatic impact on a number of facets of a state-regulated sports betting industry:
• Market size: Generally speaking, a greater number of available brands results in a larger overall market, although this relationship does quickly become subject to diminishing returns.
• Competition: There is ample precedent to support the notion that a greater number of available brands generates additional competition in the market, creating benefits for consumers such as greater product variety, better pricing and better promotions. A highly competitive market may therefore have a positive impact on black market capture rate. However, a highly competitive market may also eventually motivate some operators to take an unsustainable approach to business (e.g., hyper-aggressive promotional spend) which could disincentivize some other operators from meaningfully participating in the market. In these extreme conditions, market size and state revenues may be negatively impacted.
• Competitive balance: A skin is effectively a sub-lease option on a license. That provides smaller casinos with an asset they can leverage in a number of ways, including new revenue streams and negotiating favorable terms with mobile gambling technology providers. New Jersey's experience with online gambling suggests that skins are a meaningful force for promoting greater revenue parity in the online gambling arena22.
• Casino participation: Some casinos – especially smaller operators with a largely regional audience – may question the value of paying big-ticket license fees for mobile sports betting due to a difficulty appreciating how the investment will be paid back or a perceived inability to acquire the necessary technology to compete in the market. The ability to sub-lease the sports betting license provides at least a partial answer to both concerns, and could, in some scenarios, encourage broader participation in regulated sports betting by current land-based gambling license holders.
22 Casinos such as the Golden Nugget and Resorts have dramatically over-performed with online gambling relative to their land-based casino share, while casinos such as Borgata and Caesars have under-performed by the same measure.
62 Indiana Sports Betting Report
• State revenue: In addition to the implied revenue from the market expansion generated by the presence of skins, skins provide states with another direct revenue opportunity via the license fee that can be charged to companies operating a skin.
Stakeholder Dynamics
Professional sports stakeholders (e.g., leagues, teams, player's unions) have been publicly silent on the skins issue. There is little evidence (public or anecdotal) to suggest that professional sports stakeholders are specifically opposed to skins. We suspect, but do not know, that professional sports stakeholders are likely to support skins, as the presence of skins creates a path for brands that do not hold a gaming license to participate in a gaming market. While we think it unlikely that professional sports leagues would be immediately interested in operating a sportsbook, the same attitude may not be shared by team owners – if not for their team brand directly, then for associated businesses. We think it relevant to reference here the exceedingly close connections between the leagues, teams, and several team owners with daily fantasy sports sites over the last few years. Gambling stakeholders are deeply split on the question of skins, and the dynamic is becoming increasingly complex. Some land-based operators are interested in skins as a way to ensure that they can access markets in states where they don't have a license (see the recent agreement between Boyd and MGM23). Others may value the options skins provide. International operators and non-endemic brands such as FanDuel view skins as an existential issue. Conversely, other land-based operators may view skins as a competitive threat and work to limit or eliminate the option. And even land-based operators who support skins may differ once the issue moves to the particulars (e.g., how many skins should be allowed). Other retail stakeholders would likely oppose skins or use the issue as a lever to extract some sort of benefit or path to participation. We believe that retail stakeholders are broadly likely to push back against anything that expands the market, unless they are included in or directly benefit from such expansion.
How Are Other States Approaching Skins?
The picture is currently mixed, and expected to remain so. We do believe that the recent wave24 of cooperative agreements – between US casinos, and then also between US casinos and international operators – will push the consensus in the direction of a relatively permissive approach toward skins in many states. The table below summarizes the approach to skins taken by the states that have authorized sports betting along with the approach taken by a sampling of states that have introduced, but have yet to pass, sports betting bills.
23 Source: https://www.prnewswire.com/news-releases/mgm-resorts-boyd-gaming-partner-to-expand-mobile-online-gaming-throughout-the-united-states-300688263.html 24 See: https://www.onlinepokerreport.com/31651/mgm-boyd-partner-online-casino-and-sports-betting/. We believe additional agreements are likely to follow.
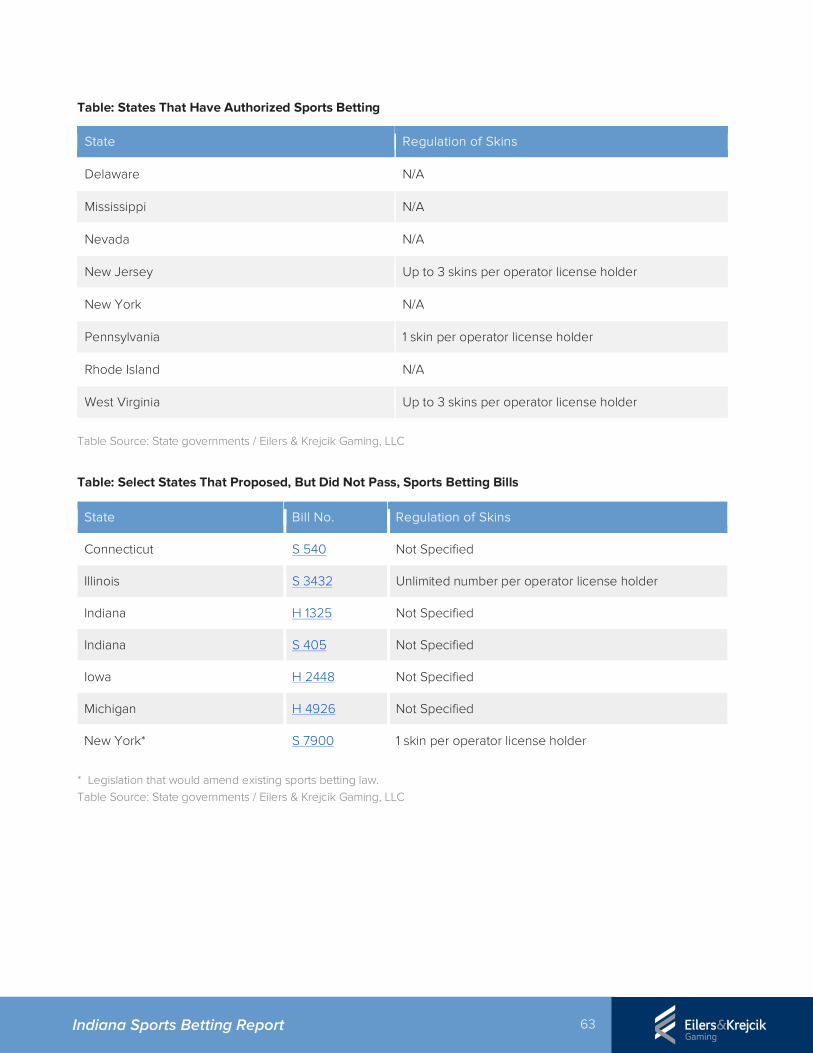
63 Indiana Sports Betting Report
Table: States That Have Authorized Sports Betting
State Regulation of Skins
Delaware N/A
Mississippi N/A
Nevada N/A
New Jersey Up to 3 skins per operator license holder
New York N/A
Pennsylvania 1 skin per operator license holder
Rhode Island N/A
West Virginia Up to 3 skins per operator license holder
Table Source: State governments / Eilers & Krejcik Gaming, LLC
Table: Select States That Proposed, But Did Not Pass, Sports Betting Bills
State Bill No. Regulation of Skins
Connecticut S 540 Not Specified
Illinois S 3432 Unlimited number per operator license holder
Indiana H 1325 Not Specified
Indiana S 405 Not Specified
Iowa H 2448 Not Specified
Michigan H 4926 Not Specified
New York* S 7900 1 skin per operator license holder
* Legislation that would amend existing sports betting law. Table Source: State governments / Eilers & Krejcik Gaming, LLC
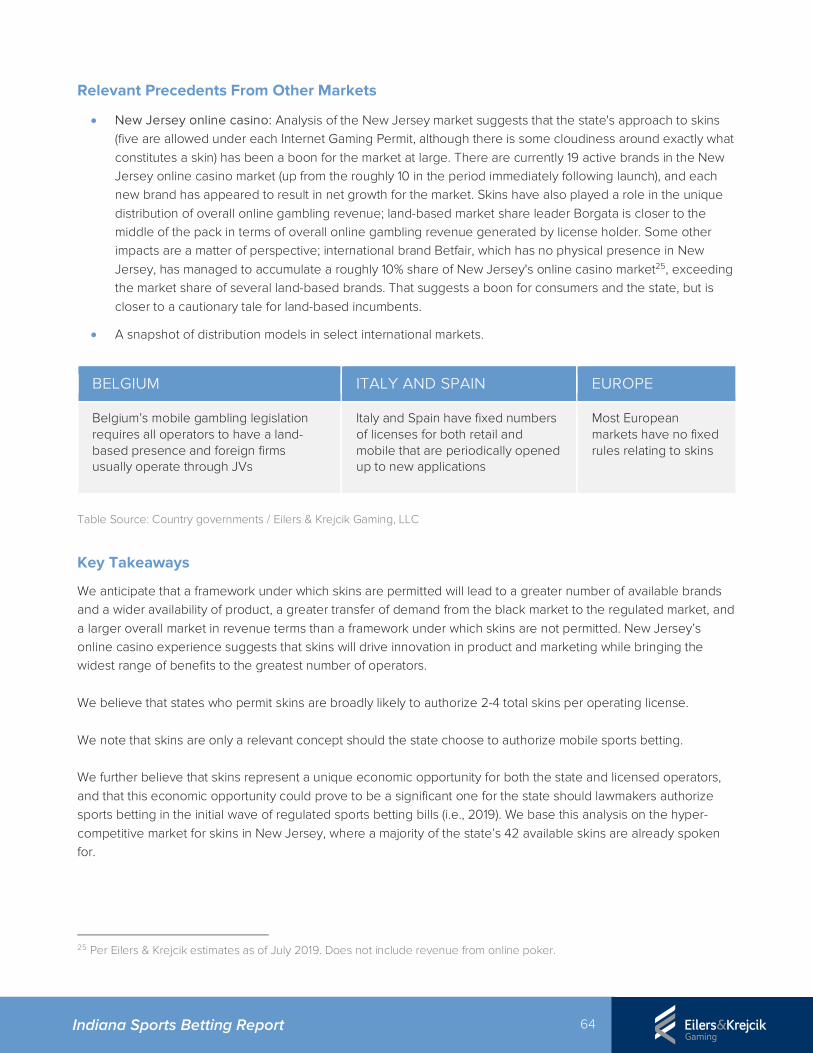
64 Indiana Sports Betting Report
Relevant Precedents From Other Markets
• New Jersey online casino: Analysis of the New Jersey market suggests that the state's approach to skins (five are allowed under each Internet Gaming Permit, although there is some cloudiness around exactly what constitutes a skin) has been a boon for the market at large. There are currently 19 active brands in the New Jersey online casino market (up from the roughly 10 in the period immediately following launch), and each new brand has appeared to result in net growth for the market. Skins have also played a role in the unique distribution of overall online gambling revenue; land-based market share leader Borgata is closer to the middle of the pack in terms of overall online gambling revenue generated by license holder. Some other impacts are a matter of perspective; international brand Betfair, which has no physical presence in New Jersey, has managed to accumulate a roughly 10% share of New Jersey's online casino market25, exceeding the market share of several land-based brands. That suggests a boon for consumers and the state, but is closer to a cautionary tale for land-based incumbents.
• A snapshot of distribution models in select international markets.
BELGIUM ITALY AND SPAIN EUROPE
Belgium’s mobile gambling legislation requires all operators to have a land-based presence and foreign firms usually operate through JVs
Italy and Spain have fixed numbers of licenses for both retail and mobile that are periodically opened up to new applications
Most European markets have no fixed rules relating to skins
Table Source: Country governments / Eilers & Krejcik Gaming, LLC
Key Takeaways
We anticipate that a framework under which skins are permitted will lead to a greater number of available brands and a wider availability of product, a greater transfer of demand from the black market to the regulated market, and a larger overall market in revenue terms than a framework under which skins are not permitted. New Jersey’s online casino experience suggests that skins will drive innovation in product and marketing while bringing the widest range of benefits to the greatest number of operators. We believe that states who permit skins are broadly likely to authorize 2-4 total skins per operating license. We note that skins are only a relevant concept should the state choose to authorize mobile sports betting. We further believe that skins represent a unique economic opportunity for both the state and licensed operators, and that this economic opportunity could prove to be a significant one for the state should lawmakers authorize sports betting in the initial wave of regulated sports betting bills (i.e., 2019). We base this analysis on the hyper-competitive market for skins in New Jersey, where a majority of the state’s 42 available skins are already spoken for.
25 Per Eilers & Krejcik estimates as of July 2019. Does not include revenue from online poker.
65 Indiana Sports Betting Report
Overview
By "limiting betting markets," we are referring to the possibility that lawmakers or regulators choose to limit or prohibit bets on certain kinds of events and / or limit or prohibit certain bet types. There is also the possibility that policymakers provide such veto power to a third party (e.g., a professional sports league).
Plausible Scenarios
We see three likely routes to the end of regulated sports betting operators facing restrictions on the bets they can offer:
• States enacting restrictions for reasons of public policy. Most states will likely prohibit betting on some sports (e.g., high school sporting events) and may utilize a narrow definition of "sports" to ensure that operators don't wander into offering bets on competitive events that are outside of the scope of traditional sports betting (e.g., reality shows like Survivor).
• Collegiate sports stakeholders lobbying for carve outs. The NCAA has been vocal and consistent in its opposition to regulated sports betting. Individual colleges and universities have voiced their own concerns in several states. The idea of limiting betting on college sports, whether in whole or in part, is a live issue in several states.
• Professional sports leagues lobbying for veto power. One of the central parts of the model sports betting bill26 advanced by the MLB, NBA, and PGA is a request that professional sports leagues all be granted the unrestricted ability to veto certain kinds of bets or all bets on certain games. Leagues have called out bets on minor league games and some types of in-play bets27 – such as "will the next pitch be a ball or a strike" – as examples of the types of bets they're seeking to block. Barring that full veto, leagues will likely push for specific exemptions or a less-comprehensive ability to control what kinds of bets are offered at regulated sportsbooks.
We believe that states are highly likely to act to restrict betting on games that involve minors and fringe betting. We believe collegiate sports stakeholders will have moderate success in achieving some level of carve out prohibiting bets on college sports (New Jersey's policy, detailed in a later section, may provide a sense of how a compromise on this issue manifests in policy).
26 Source: https://sportshandle.com/sports-betting-nba-mlb-model-act-integrity-fee/ 27 Source: https://www.washingtonpost.com/sports/for-sports-leagues-legalized-sports-betting-offers-new-risks-and-massive-rewards/2018/05/14/5ce4caf4-5790-11e8-858f-12becb4d6067_story.html
5d. KEY POLICY CONSIDERATIONS: LIMITING BETTING MARKETS
66 Indiana Sports Betting Report
We are less certain on the question of how much power state legislatures will be willing to give to professional sports leagues to limit commercial activity. It may be that the question ends up being a private negotiation between leagues and regulated sportsbooks (e.g., restricting betting on minor league games may be made a requirement for access to official league data).
Direct Impacts
Limiting betting markets would likely have a number of direct impacts on a regulated sports betting market. Obviously, the severity of the impact would be directly tied to the severity of the restriction; preventing consumers from wagering on minor league games would likely have a relatively small impact on the overall market, while preventing consumers from wagering on all collegiate sports would likely have a disastrous impact on the market for regulated sports betting.
• Market size: Betting on college sports could easily account for over 50% of total sports betting activity in states with a strong affinity for collegiate athletics. In-play betting makes up the lion's share of total activity in many international sports betting markets, and is expected to quickly become the dominant vertical in the U.S. market. These are two examples that highlight how dramatic of an impact limiting types of bets or bets on certain sports can have on overall market size. Narrower limitations, such as a ban on high school sports betting or minor league games, would have a measurable, but effectively immaterial impact on total market size.
• Black market capture rate: A regulated market that faces significant restrictions on what types of bets can be placed or what games are available to be bet on is at a meaningful - perhaps insurmountable - disadvantage to black market sports betting options.
• Casino participation: Significant restrictions (e.g., no college sports, blanket veto granted to sports leagues) may dissuade some casinos from seeking a sports betting license, especially if other conditions (e.g., tax rate) are perceived as unfavorable.
• State revenue: Decreased market size and decreased participation both carry implications for state revenue. Lower participation means a lower initial total for license fees, and both factors contribute to a smaller stream of tax revenue than the state would enjoy in an unrestricted environment.
Stakeholder Dynamics
Professional sports stakeholders appear to be broadly in favor of some type of restriction, especially models where leagues have the ability to block betting directly. The MLB, NBA and PGA have all advocated publicly for such models. Notably, the NFL did not include such direct control as part of its core principles for sports betting regulation. Collegiate sports stakeholders tend to be in favor of betting restrictions when they take a position; many conferences and individual institutions have yet to articulate a specific position. The NCAA has advocated for a complete carve out of college sports from regulated sports betting, but has so far failed to achieve that goal in states that have authorized sports betting. Commercial casinos and tribal casinos are broadly opposed to any sort of betting restrictions. They are unlikely to protest common-sense restrictions such as a ban on high school sports betting, but we expect they would steadfastly oppose any policy approach that ceded meaningful control over their product to professional sports or collegiate sports stakeholders.
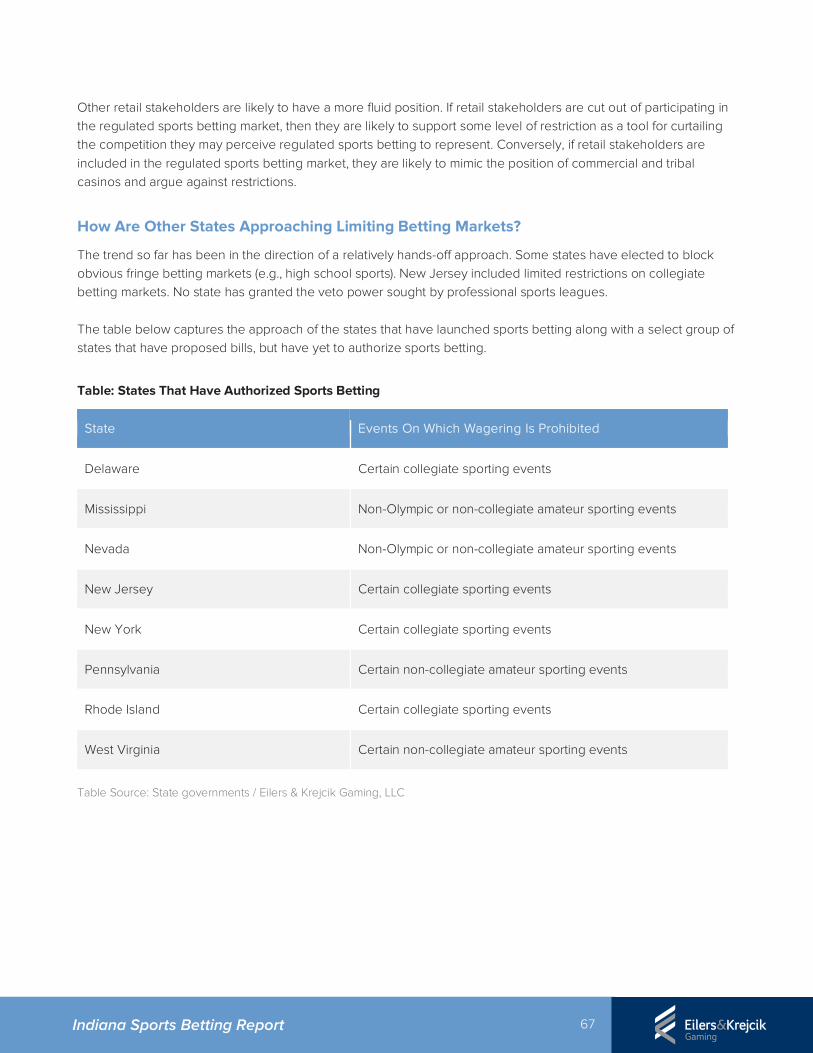
67 Indiana Sports Betting Report
Other retail stakeholders are likely to have a more fluid position. If retail stakeholders are cut out of participating in the regulated sports betting market, then they are likely to support some level of restriction as a tool for curtailing the competition they may perceive regulated sports betting to represent. Conversely, if retail stakeholders are included in the regulated sports betting market, they are likely to mimic the position of commercial and tribal casinos and argue against restrictions.
How Are Other States Approaching Limiting Betting Markets?
The trend so far has been in the direction of a relatively hands-off approach. Some states have elected to block obvious fringe betting markets (e.g., high school sports). New Jersey included limited restrictions on collegiate betting markets. No state has granted the veto power sought by professional sports leagues. The table below captures the approach of the states that have launched sports betting along with a select group of states that have proposed bills, but have yet to authorize sports betting.
Table: States That Have Authorized Sports Betting
State Events On Which Wagering Is Prohibited
Delaware Certain collegiate sporting events
Mississippi Non-Olympic or non-collegiate amateur sporting events
Nevada Non-Olympic or non-collegiate amateur sporting events
New Jersey Certain collegiate sporting events
New York Certain collegiate sporting events
Pennsylvania Certain non-collegiate amateur sporting events
Rhode Island Certain collegiate sporting events
West Virginia Certain non-collegiate amateur sporting events
Table Source: State governments / Eilers & Krejcik Gaming, LLC
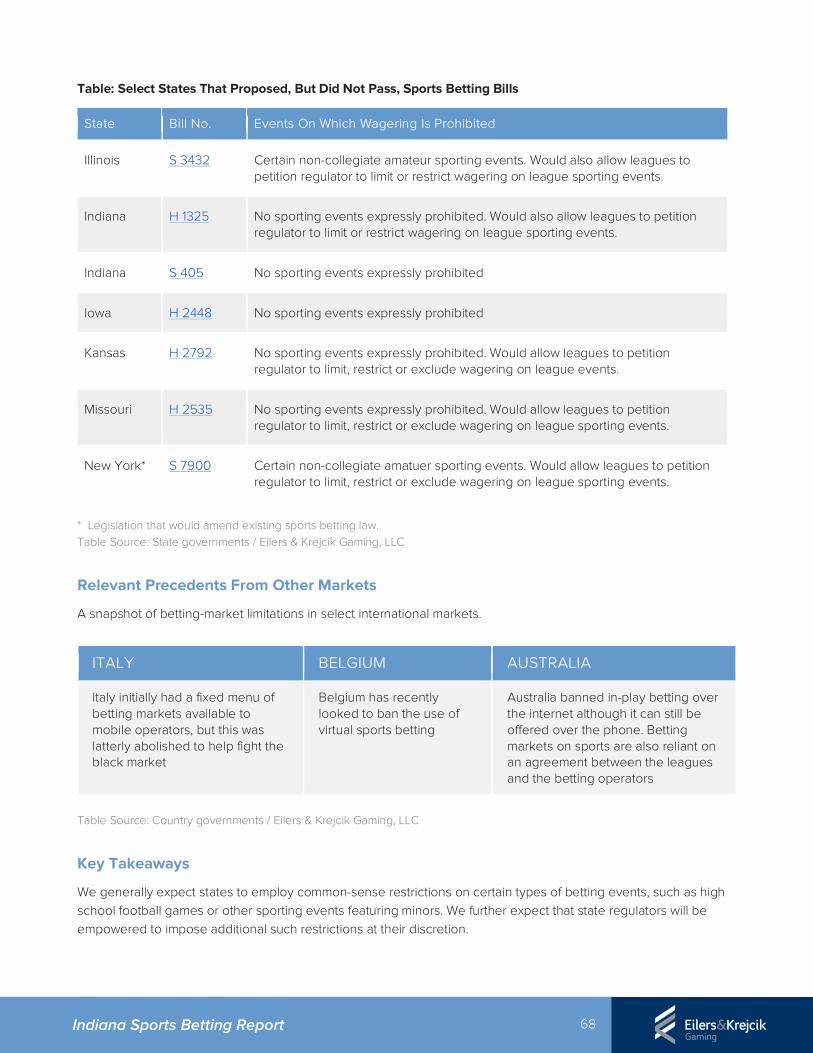
68 Indiana Sports Betting Report
Table: Select States That Proposed, But Did Not Pass, Sports Betting Bills
State Bill No. Events On Which Wagering Is Prohibited
Illinois S 3432 Certain non-collegiate amateur sporting events. Would also allow leagues to petition regulator to limit or restrict wagering on league sporting events.
Indiana H 1325 No sporting events expressly prohibited. Would also allow leagues to petition regulator to limit or restrict wagering on league sporting events.
Indiana S 405 No sporting events expressly prohibited
Iowa H 2448 No sporting events expressly prohibited
Kansas H 2792 No sporting events expressly prohibited. Would allow leagues to petition regulator to limit, restrict or exclude wagering on league events.
Missouri H 2535 No sporting events expressly prohibited. Would allow leagues to petition regulator to limit, restrict or exclude wagering on league sporting events.
New York* S 7900 Certain non-collegiate amatuer sporting events. Would allow leagues to petition regulator to limit, restrict or exclude wagering on league sporting events.
* Legislation that would amend existing sports betting law. Table Source: State governments / Eilers & Krejcik Gaming, LLC
Relevant Precedents From Other Markets
A snapshot of betting-market limitations in select international markets.
ITALY BELGIUM AUSTRALIA
Italy initially had a fixed menu of betting markets available to mobile operators, but this was latterly abolished to help fight the black market
Belgium has recently looked to ban the use of virtual sports betting
Australia banned in-play betting over the internet although it can still be offered over the phone. Betting markets on sports are also reliant on an agreement between the leagues and the betting operators
Table Source: Country governments / Eilers & Krejcik Gaming, LLC
Key Takeaways
We generally expect states to employ common-sense restrictions on certain types of betting events, such as high school football games or other sporting events featuring minors. We further expect that state regulators will be empowered to impose additional such restrictions at their discretion.

69 Indiana Sports Betting Report
We anticipate that a framework under which betting-event restrictions are largely limited to youth sporting events will lead to a wider variety of betting markets from which customers can choose, a greater transfer of demand from the black market to the regulated market, and a larger overall market in revenue terms than a framework under which restrictions on betting are more broadly imposed. We believe that any attempts to impose significant betting restrictions on collegiate or professional sports would have a material impact on the size of the regulated sports betting market and would drive additional demand to the black market for sports betting.
70 Indiana Sports Betting Report
Overview
Data sources are entities which provide data on sporting events. In most jurisdictions with legal sports betting, third-party companies provide data to sportsbooks, which in turn use the information to create new markets and to officially rule on the outcomes of previously accepted wagers. Third-party sources may acquire their data directly from a sports league or league-sanctioned source, acquire data through observation of events, or some combination of the two approaches. Key questions here include whether or not to require sports betting operators to use official league data, and whether or not different types of wagers should be treated differently with respect to which data sources can determine their results.
Plausible Scenarios
The state can choose to require operators to use official league data, or the state can allow operators to choose their preferred data sources. There are several permutations for each option: Requiring usage of official league data:
• For all bets: Official league data must be exclusively used for all types of bets.
• Two-tier system: As was written into Connecticut’s S 54028 (which did not pass), bets are divided into two tiers:
o Tier one sports wagers are bets that are placed either on the final score or final outcome of a sporting event. To qualify as a tier one wager, the bet must be placed before the start of a sporting event. In a typical two-tier system, the result of tier one wagers can be determined using any data source that the operator chooses.
o Tier two sports wagers include all other bets. In a two-tier system, this second tier must use official league data exclusively when determining the results of wagers, as long as the league possesses and sells access to a data feed with commercially reasonable terms.
• Three-tier system: As was written into New York’s S 790029 (which did not pass), bets are divided into three tiers:
28 Source: https://www.cga.ct.gov/2018/FC/2018SB-00540-R000633-FC.htm 29 Source: https://legislation.nysenate.gov/pdf/bills/2017/S7900C
5e. KEY POLICY CONSIDERATIONS: DATA SOURCES
71 Indiana Sports Betting Report
o Tier one sports wagers include all wagers determined by the final score or outcome of a sporting event. This is already different from the tier one definition in the two-tier system because bets are not required to have been placed before the start of an event to qualify as tier one. As was the case in the two-tier system, however, the result of a tier one bet can still be determined using any data source an operator chooses.
o Tier two wagers include in-play bets (bets placed once a game has started) that are not determined by the final score or outcome of a sporting event, as those in-play bets would still be tier one. In a three-tier system, operators are required to use official league data to determine the results of all tier two bets.
o Tier three is a catch-all for all other wagers. By default, operators can use any data source they deem appropriate for determining the outcome of tier three wagers. However, leagues are granted the right to notify the regulatory agency that they wish to provide the data. The agency then reviews the request, considers input from operators, and determines whether or not the outcome of a particular type of tier three bet should be determined exclusively by official league data.
Allowing operators to choose their data sources. Here, operators can choose one or a mix of a number of options:
• Operators can contract with third-party providers such as SportRadar or BetGenius.
• Operators can develop their own in-house data sourcing technology.
• Operators can partner directly with leagues. For example, in late July of 2018, the NBA reached a deal with MGM30 that simultaneously made MGM the official gaming partner of the NBA and made the NBA the data provider for MGM’s sports betting operations.
Direct Impacts
Decisions related to data sources impact the following areas of a regulated sports betting market:
• Market size: Allowing leagues to monopolize control of data at any level inherently prevents competition between data providers for the business of sports betting operators. In a free market, operators could choose a data provider by considering costs as well as the quality and scope of data. This contrast highlights two primary concerns: What price will the leagues set for data access, and what level of quality and scope will be provided? Negative answers to either question could artificially restrict the size of the market by cramping operator margins or diminishing product quality.
• Black market capture rate: Allowing for a free market on data sources may improve the quality of operator offerings in a legal market, and by extension these products become more attractive for consumers compared to black market alternatives.
• State regulatory costs and burdens: In the three-tier system for classifying bets, data requirements for tier three wagers would frequently be disputed between operators and leagues. These disputes would be overseen by the state, which would need to have guidelines in place for handling such disputes. Similarly, the state would need to expend the necessary resources to handle these situations.
30 Source: https://www.sporttechie.com/nba-mgm-resorts-official-data-second-spectrum-adam-silver-jim-murren/
72 Indiana Sports Betting Report
Stakeholder Dynamics
Professional sports stakeholders are by and large in favor of legislation that requires usage of official league data. Such a requirement is part of the model legislation advanced by the NBA, MLB, and the PGA. The NFL has stopped short of an explicit public position on this issue, but its "core principles"31 for sports betting regulation include fans having "access to official, reliable, league data." Given the potential for a significant revenue stream and the ability to exercise a level of control over what kinds of bets can be offered, we expect professional sports stakeholders to continue to lobby aggressively on the issue of requiring regulated sportsbooks to use official league data. Commercial casinos are overwhelmingly opposed to legislation that limits the ability of casinos to choose sports betting data sources. Tribal casinos will likely agree with commercial casinos on the data source issue. While disagreements exist in a variety of other areas, a legal requirement for sportsbooks to use official league data is a topic where commercial and tribal casino interests are expected to be tightly aligned. Other gaming stakeholders are likely to condition their position on the issue based on the broader direction of sports betting legislation. Lottery retailers, for example, may choose to support or oppose various aspects of a sports betting bill as it relates to their ability to offer wagering on sports at all. However, in the event that they are legally authorized to offer wagers, they too would prefer to avoid a state-mandated league monopoly on betting data.
How Are Other States Approaching Data Sources?
The question of data sources has been addressed in many sports betting bills, but, as of this report, no state has passed a bill that provides sports leagues or teams control over the data used for wagering. The table below summarizes the data source approach taken by states that have authorized sports betting to date:
Table: States That Have Authorized Sports Betting
State League Control Over Data Sources
Delaware No
Mississippi No
Nevada No
New Jersey No
New York No
Pennsylvania No
Rhode Island No
West Virginia No
Table Source: State governments / Eilers & Krejcik Gaming, LLC
31 Source: http://www.nfl.com/news/story/0ap3000000933466/article/nfl-commissioner-roger-goodell-issues-statement-on-gambling
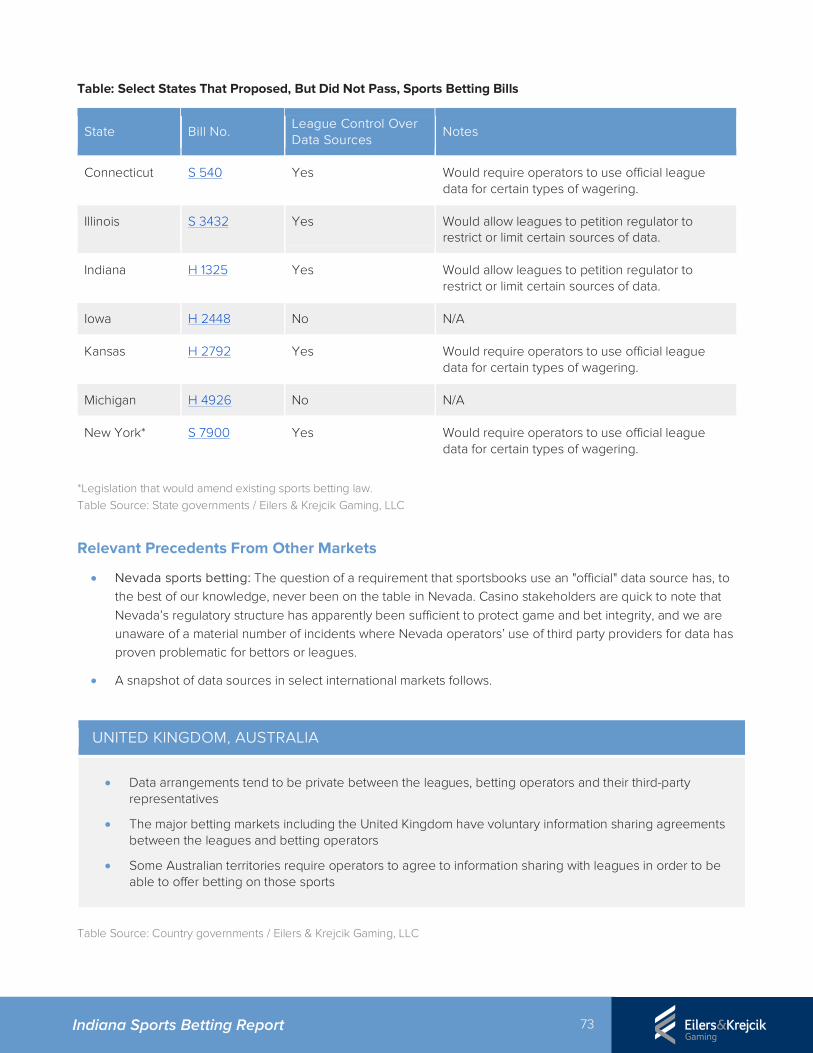
73 Indiana Sports Betting Report
Table: Select States That Proposed, But Did Not Pass, Sports Betting Bills
State Bill No. League Control Over Data Sources
Notes
Connecticut S 540 Yes Would require operators to use official league data for certain types of wagering.
Illinois S 3432 Yes Would allow leagues to petition regulator to restrict or limit certain sources of data.
Indiana H 1325 Yes Would allow leagues to petition regulator to restrict or limit certain sources of data.
Iowa H 2448 No N/A
Kansas H 2792 Yes Would require operators to use official league data for certain types of wagering.
Michigan H 4926 No N/A
New York* S 7900 Yes Would require operators to use official league data for certain types of wagering.
*Legislation that would amend existing sports betting law. Table Source: State governments / Eilers & Krejcik Gaming, LLC
Relevant Precedents From Other Markets
• Nevada sports betting: The question of a requirement that sportsbooks use an "official" data source has, to the best of our knowledge, never been on the table in Nevada. Casino stakeholders are quick to note that Nevada’s regulatory structure has apparently been sufficient to protect game and bet integrity, and we are unaware of a material number of incidents where Nevada operators’ use of third party providers for data has proven problematic for bettors or leagues.
• A snapshot of data sources in select international markets follows.
UNITED KINGDOM, AUSTRALIA
• Data arrangements tend to be private between the leagues, betting operators and their third-party representatives
• The major betting markets including the United Kingdom have voluntary information sharing agreements between the leagues and betting operators
• Some Australian territories require operators to agree to information sharing with leagues in order to be able to offer betting on those sports
Table Source: Country governments / Eilers & Krejcik Gaming, LLC
74 Indiana Sports Betting Report
Key Takeaways
We anticipate that a framework under which sports betting operators are not required to purchase data from sports leagues will lead to a greater level of competition between data providers and a broader array of data options and prices, as well as a higher level of impetus for data providers to innovate and improve their data-product offerings, than a framework under which operators are required to purchase data from leagues. We are unsure of how state governments will ultimately address this issue given significant lobbying pressure from professional sports leagues. We note that the black market has functioned efficiently in the absence of such agreements. Finally, we believe that many of the leagues’ stated concerns regarding the connections between official data and integrity and consumer protection can be addressed via other regulatory avenues.
75 Indiana Sports Betting Report
Overview
Royalty or integrity fees refer to monies that sports betting operators pay to sports leagues for the privilege of offering wagers on league games, or to offset league costs associated with instituting and maintaining integrity-monitoring protocols, or both. Key questions here include whether the state will implement a royalty or integrity fee, and if so, how it will assess that fee.
Plausible Scenarios
The state could choose to implement a royalty or integrity fee, to not implement such a fee, or to require sports betting operators to negotiate such a fee with sports leagues on whose games they offer wagers. SCENARIO 1.
If the state chooses to implement a royalty or integrity fee, it must first determine:
• Whether to assess the fee against a sports betting operator’s revenue or handle, or • Whether to implement a flat / other fee that is not assessed against revenue or handle
From that initial decision flow the following considerations:
• The percentage of revenue or handle against which to assess the fee, or • The amount of the flat / other fee
Finally, the state must determine:
• Whether the fee should be paid by a sports betting operator directly to the league • Whether the state should be involved in collecting and disbursing the fee
SCENARIO 2.
If the state chooses not to implement such a fee:
• No further action is required SCENARIO 3.
If the state chooses to require sports betting operators to negotiate such a fee with sports leagues on whose games they offer wagers, it could:
• Establish no floor and / or ceiling for the fee
• Establish a floor and / or ceiling for the fee
5f. KEY POLICY CONSIDERATIONS: ROYALTY OR INTEGRITY FEES
76 Indiana Sports Betting Report
Direct Impacts
Decisions around royalty or integrity fees specifically impact the following aspects of a regulated sports betting market:
• Market size: Sports betting is a business with narrow margins. Historical Nevada data, for instance, shows that sports betting operators tend to keep only between 4% and 6% of the total amount of handle they receive. The implementation of a royalty or integrity fee will result in tighter operating margins or – if assessed against handle – even losses for sports betting operators. If operators are less willing or unable to invest profits in core areas including marketing and brand-building, customer acquisition and retention, and product development, such inaction could lead to a sports betting market whose size, in revenue terms, is artificially depressed by cost constraints.
• State revenue: A sports betting market whose size is artificially depressed by cost constraints associated with a royalty or integrity fee will naturally generate less gaming tax revenue for the state than a market that is unencumbered by such constraints.
• Black market capture rate: A less cost-intensive operating environment will likely result in a greater transfer of demand from the black market to the regulated market. Correspondingly, a more cost-intensive environment – given the historical margin profile of sports betting – will likely depress operator investment in marketing and product. Lighter marketing and less compelling product, in turn, will impede operators’ – and, by extension, the state’s – ability to recapture customers from black market sites that are well-marketed, that feature superior product, and that are easily accessible.
• State regulatory costs and burdens: If the state chooses to implement a royalty or integrity fee and to involve itself in the collection and disbursement of such a fee, its level of involvement, if low, could yield no or minimal additional regulatory costs and burdens. But if its level of involvement involves a moderate or high level of complexity – if it is required, say, to review and award fee-disbursement claims from sports leagues in accordance with rigorous statutory guidelines – the state may incur additional, non-minimal regulatory costs and burdens.
Stakeholder Dynamics
The professional sports leagues, teams and players associations that have weighed in on the issue appear to support the implementation of royalty or integrity fees. Notably, the leagues that have made their position clear (the NBA, MLB and PGA) are firmly in favor of such fees being enshrined in state statutes.
By contrast, the commercial and tribal casinos that have weighed in, including industry trade groups such as the American Gaming Association and the National Indian Gaming Association, are or appear to be vigorously opposed to the issue. Other retail gaming stakeholders (e.g., racetracks) have also voiced opposition.
State lotteries – with the exception of the West Virginia Lottery Commission, which has raised questions32 about the economic impacts of royalty or integrity fees on regulated sports betting – have been largely silent on the issue. However, if pressed, lotteries are likely to oppose royalty or integrity fees on grounds that such fees could impede their ability to use sports betting as a means to generate funding for core lottery causes, including education.
The above is a surface analysis and does not consider the web of unique dynamics that might influence a given stakeholder to break type.
32 Source: https://www.wvgazettemail.com/news/legislative_session/leagues-want-a-share-of-the-action-in-wv-sports/article_d4fc4789-26e9-5b13-8534-884e94f5b60b.html
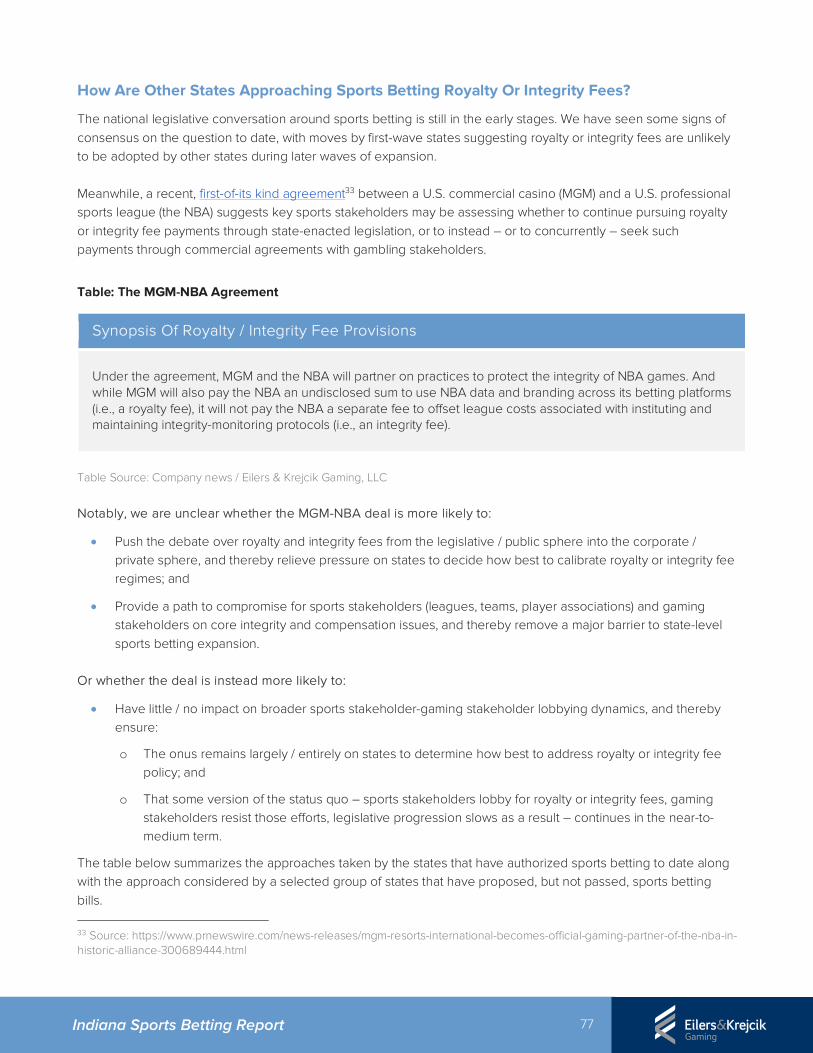
77 Indiana Sports Betting Report
How Are Other States Approaching Sports Betting Royalty Or Integrity Fees?
The national legislative conversation around sports betting is still in the early stages. We have seen some signs of consensus on the question to date, with moves by first-wave states suggesting royalty or integrity fees are unlikely to be adopted by other states during later waves of expansion. Meanwhile, a recent, first-of-its kind agreement33 between a U.S. commercial casino (MGM) and a U.S. professional sports league (the NBA) suggests key sports stakeholders may be assessing whether to continue pursuing royalty or integrity fee payments through state-enacted legislation, or to instead – or to concurrently – seek such payments through commercial agreements with gambling stakeholders.
Table: The MGM-NBA Agreement
Synopsis Of Royalty / Integrity Fee Provisions
Under the agreement, MGM and the NBA will partner on practices to protect the integrity of NBA games. And while MGM will also pay the NBA an undisclosed sum to use NBA data and branding across its betting platforms (i.e., a royalty fee), it will not pay the NBA a separate fee to offset league costs associated with instituting and maintaining integrity-monitoring protocols (i.e., an integrity fee).
Table Source: Company news / Eilers & Krejcik Gaming, LLC
Notably, we are unclear whether the MGM-NBA deal is more likely to:
• Push the debate over royalty and integrity fees from the legislative / public sphere into the corporate / private sphere, and thereby relieve pressure on states to decide how best to calibrate royalty or integrity fee regimes; and
• Provide a path to compromise for sports stakeholders (leagues, teams, player associations) and gaming stakeholders on core integrity and compensation issues, and thereby remove a major barrier to state-level sports betting expansion.
Or whether the deal is instead more likely to:
• Have little / no impact on broader sports stakeholder-gaming stakeholder lobbying dynamics, and thereby ensure:
o The onus remains largely / entirely on states to determine how best to address royalty or integrity fee policy; and
o That some version of the status quo – sports stakeholders lobby for royalty or integrity fees, gaming stakeholders resist those efforts, legislative progression slows as a result – continues in the near-to-medium term.
The table below summarizes the approaches taken by the states that have authorized sports betting to date along with the approach considered by a selected group of states that have proposed, but not passed, sports betting bills.
33 Source: https://www.prnewswire.com/news-releases/mgm-resorts-international-becomes-official-gaming-partner-of-the-nba-in-historic-alliance-300689444.html
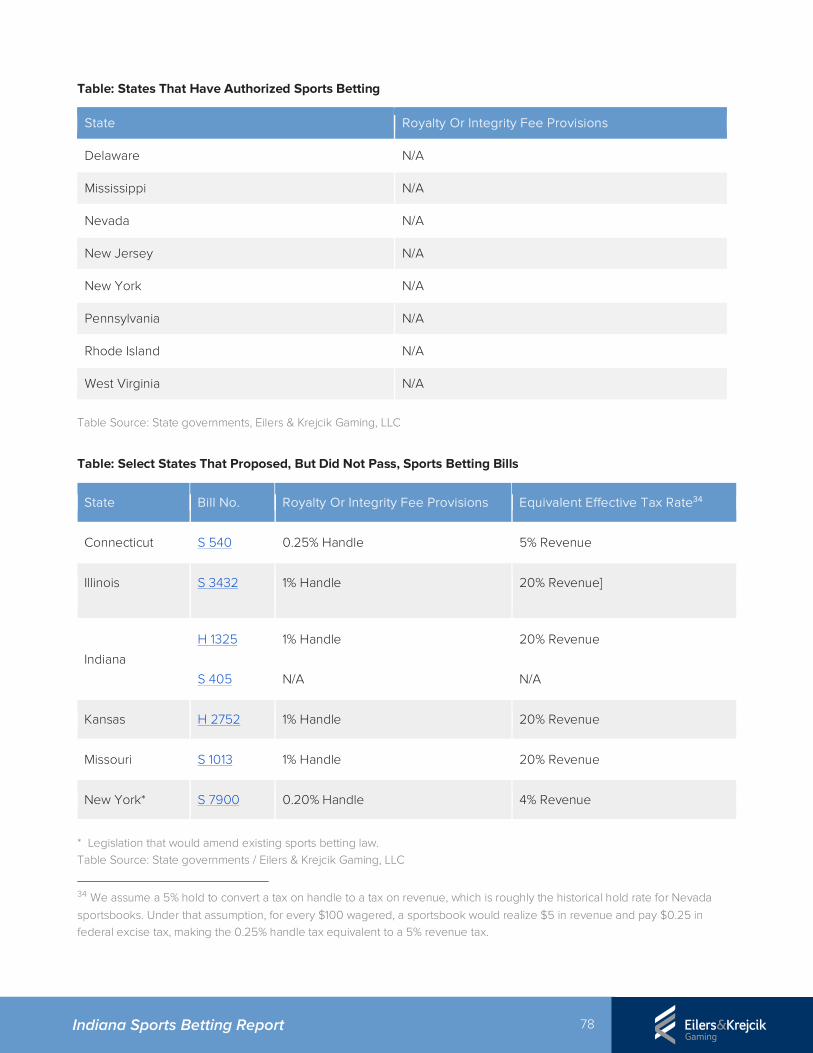
78 Indiana Sports Betting Report
Table: States That Have Authorized Sports Betting
State Royalty Or Integrity Fee Provisions
Delaware N/A
Mississippi N/A
Nevada N/A
New Jersey N/A
New York N/A
Pennsylvania N/A
Rhode Island N/A
West Virginia N/A
Table Source: State governments, Eilers & Krejcik Gaming, LLC
Table: Select States That Proposed, But Did Not Pass, Sports Betting Bills
State Bill No. Royalty Or Integrity Fee Provisions Equivalent Effective Tax Rate34
Connecticut S 540 0.25% Handle 5% Revenue
Illinois S 3432 1% Handle 20% Revenue]
Indiana
H 1325 1% Handle 20% Revenue
S 405 N/A N/A
Kansas H 2752 1% Handle 20% Revenue
Missouri S 1013 1% Handle 20% Revenue
New York* S 7900 0.20% Handle 4% Revenue
* Legislation that would amend existing sports betting law. Table Source: State governments / Eilers & Krejcik Gaming, LLC
34 We assume a 5% hold to convert a tax on handle to a tax on revenue, which is roughly the historical hold rate for Nevada sportsbooks. Under that assumption, for every $100 wagered, a sportsbook would realize $5 in revenue and pay $0.25 in federal excise tax, making the 0.25% handle tax equivalent to a 5% revenue tax.
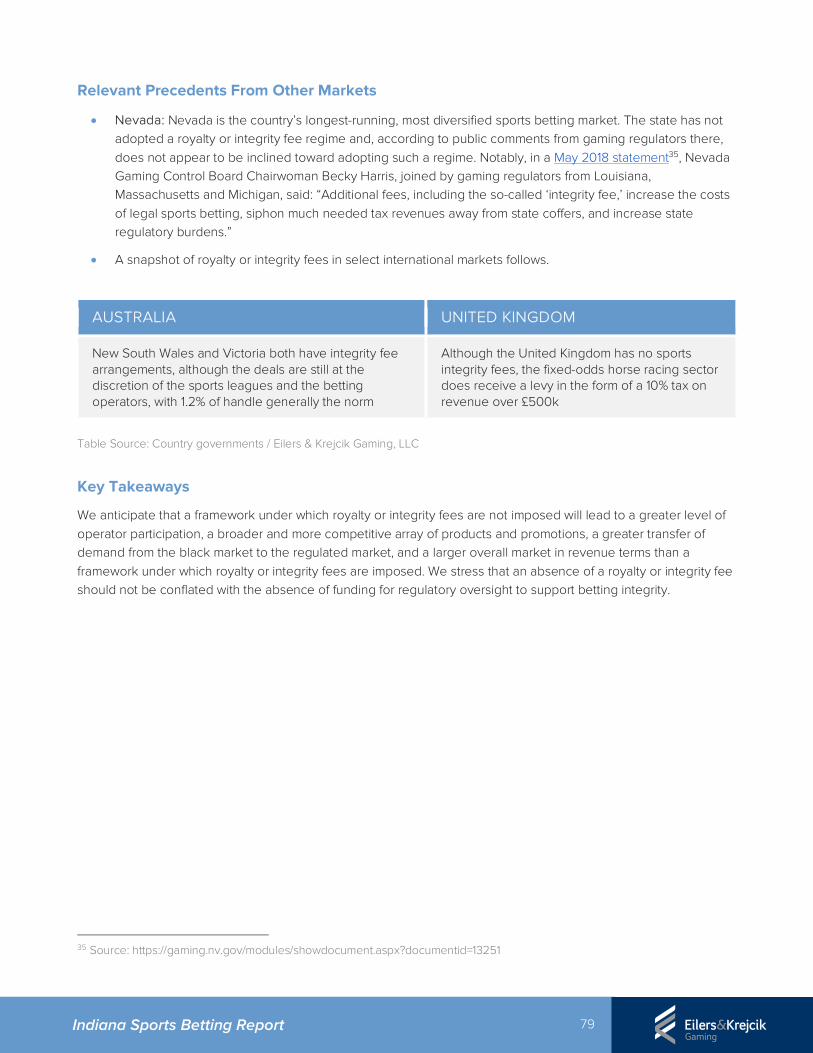
79 Indiana Sports Betting Report
Relevant Precedents From Other Markets
• Nevada: Nevada is the country’s longest-running, most diversified sports betting market. The state has not adopted a royalty or integrity fee regime and, according to public comments from gaming regulators there, does not appear to be inclined toward adopting such a regime. Notably, in a May 2018 statement35, Nevada Gaming Control Board Chairwoman Becky Harris, joined by gaming regulators from Louisiana, Massachusetts and Michigan, said: “Additional fees, including the so-called ‘integrity fee,’ increase the costs of legal sports betting, siphon much needed tax revenues away from state coffers, and increase state regulatory burdens.”
• A snapshot of royalty or integrity fees in select international markets follows.
AUSTRALIA UNITED KINGDOM
New South Wales and Victoria both have integrity fee arrangements, although the deals are still at the discretion of the sports leagues and the betting operators, with 1.2% of handle generally the norm
Although the United Kingdom has no sports integrity fees, the fixed-odds horse racing sector does receive a levy in the form of a 10% tax on revenue over £500k
Table Source: Country governments / Eilers & Krejcik Gaming, LLC
Key Takeaways
We anticipate that a framework under which royalty or integrity fees are not imposed will lead to a greater level of operator participation, a broader and more competitive array of products and promotions, a greater transfer of demand from the black market to the regulated market, and a larger overall market in revenue terms than a framework under which royalty or integrity fees are imposed. We stress that an absence of a royalty or integrity fee should not be conflated with the absence of funding for regulatory oversight to support betting integrity.
35 Source: https://gaming.nv.gov/modules/showdocument.aspx?documentid=13251
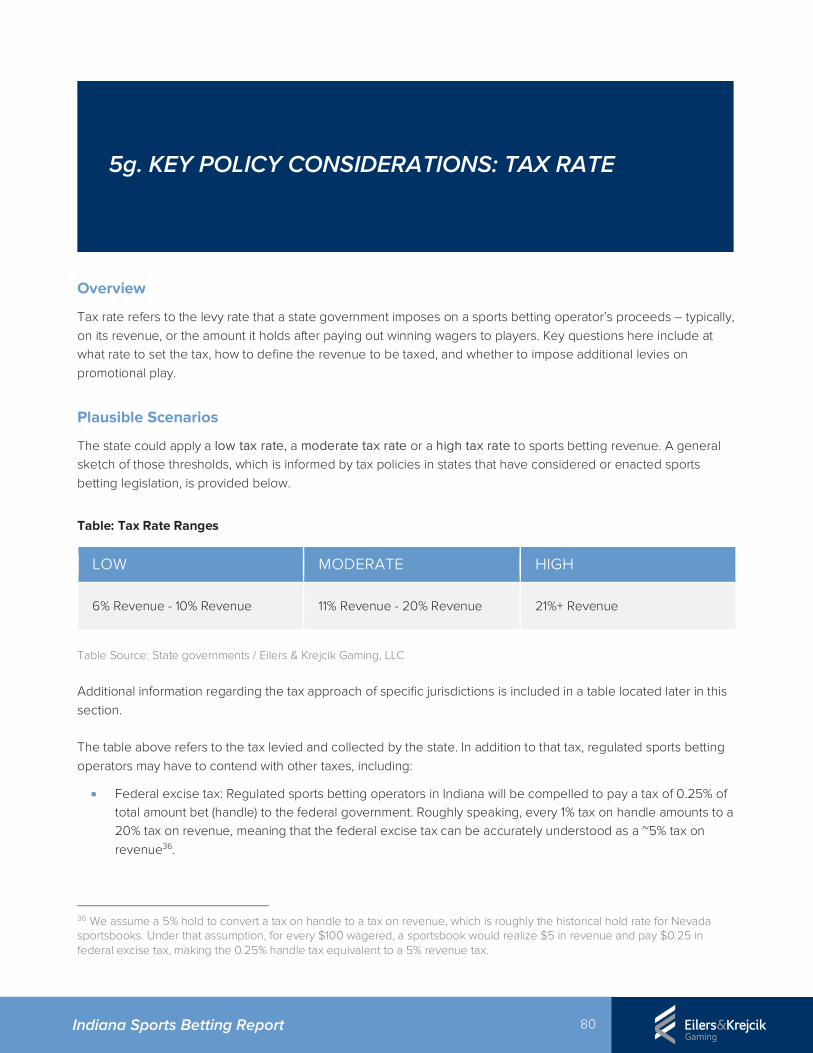
80 Indiana Sports Betting Report
Overview
Tax rate refers to the levy rate that a state government imposes on a sports betting operator’s proceeds – typically, on its revenue, or the amount it holds after paying out winning wagers to players. Key questions here include at what rate to set the tax, how to define the revenue to be taxed, and whether to impose additional levies on promotional play.
Plausible Scenarios
The state could apply a low tax rate, a moderate tax rate or a high tax rate to sports betting revenue. A general sketch of those thresholds, which is informed by tax policies in states that have considered or enacted sports betting legislation, is provided below.
Table: Tax Rate Ranges
LOW MODERATE HIGH
6% Revenue - 10% Revenue 11% Revenue - 20% Revenue 21%+ Revenue
Table Source: State governments / Eilers & Krejcik Gaming, LLC
Additional information regarding the tax approach of specific jurisdictions is included in a table located later in this section. The table above refers to the tax levied and collected by the state. In addition to that tax, regulated sports betting operators may have to contend with other taxes, including:
• Federal excise tax: Regulated sports betting operators in Indiana will be compelled to pay a tax of 0.25% of total amount bet (handle) to the federal government. Roughly speaking, every 1% tax on handle amounts to a 20% tax on revenue, meaning that the federal excise tax can be accurately understood as a ~5% tax on revenue36.
36 We assume a 5% hold to convert a tax on handle to a tax on revenue, which is roughly the historical hold rate for Nevada sportsbooks. Under that assumption, for every $100 wagered, a sportsbook would realize $5 in revenue and pay $0.25 in federal excise tax, making the 0.25% handle tax equivalent to a 5% revenue tax.
5g. KEY POLICY CONSIDERATIONS: TAX RATE
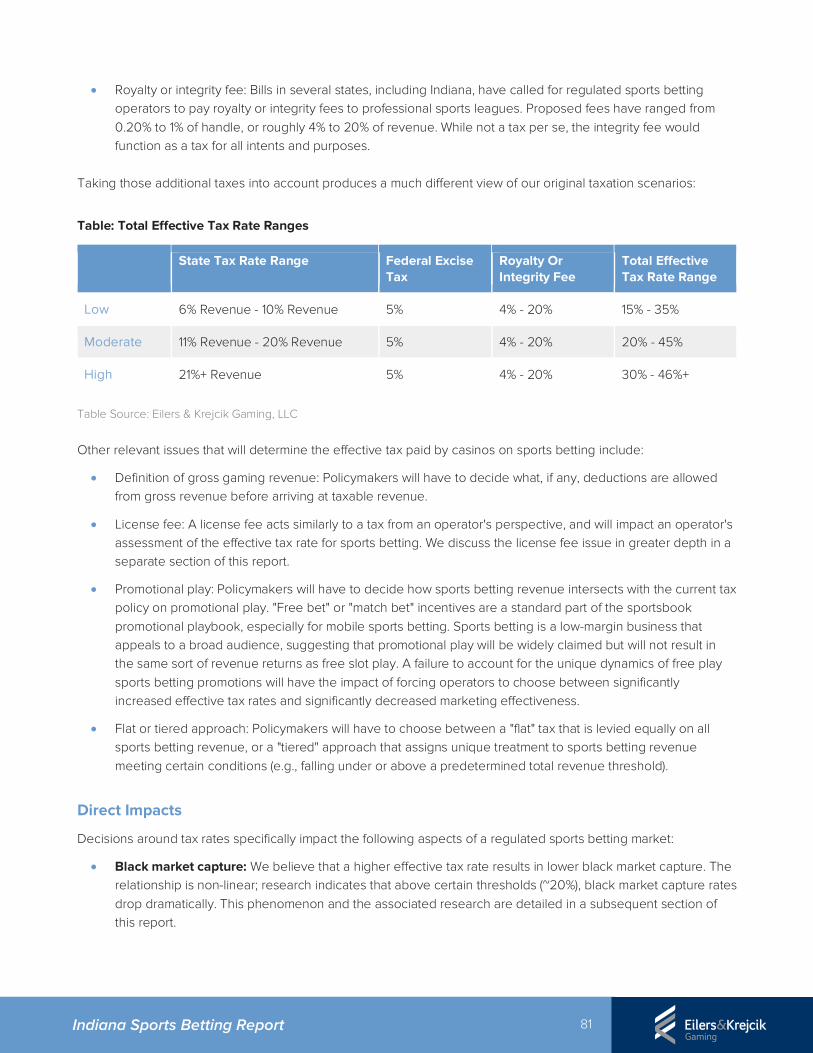
81 Indiana Sports Betting Report
• Royalty or integrity fee: Bills in several states, including Indiana, have called for regulated sports betting operators to pay royalty or integrity fees to professional sports leagues. Proposed fees have ranged from 0.20% to 1% of handle, or roughly 4% to 20% of revenue. While not a tax per se, the integrity fee would function as a tax for all intents and purposes.
Taking those additional taxes into account produces a much different view of our original taxation scenarios:
Table: Total Effective Tax Rate Ranges
State Tax Rate Range Federal Excise
Tax Royalty Or Integrity Fee
Total Effective Tax Rate Range
Low 6% Revenue - 10% Revenue 5% 4% - 20% 15% - 35%
Moderate 11% Revenue - 20% Revenue 5% 4% - 20% 20% - 45%
High 21%+ Revenue 5% 4% - 20% 30% - 46%+
Table Source: Eilers & Krejcik Gaming, LLC
Other relevant issues that will determine the effective tax paid by casinos on sports betting include:
• Definition of gross gaming revenue: Policymakers will have to decide what, if any, deductions are allowed from gross revenue before arriving at taxable revenue.
• License fee: A license fee acts similarly to a tax from an operator's perspective, and will impact an operator's assessment of the effective tax rate for sports betting. We discuss the license fee issue in greater depth in a separate section of this report.
• Promotional play: Policymakers will have to decide how sports betting revenue intersects with the current tax policy on promotional play. "Free bet" or "match bet" incentives are a standard part of the sportsbook promotional playbook, especially for mobile sports betting. Sports betting is a low-margin business that appeals to a broad audience, suggesting that promotional play will be widely claimed but will not result in the same sort of revenue returns as free slot play. A failure to account for the unique dynamics of free play sports betting promotions will have the impact of forcing operators to choose between significantly increased effective tax rates and significantly decreased marketing effectiveness.
• Flat or tiered approach: Policymakers will have to choose between a "flat" tax that is levied equally on all sports betting revenue, or a "tiered" approach that assigns unique treatment to sports betting revenue meeting certain conditions (e.g., falling under or above a predetermined total revenue threshold).
Direct Impacts
Decisions around tax rates specifically impact the following aspects of a regulated sports betting market:
• Black market capture: We believe that a higher effective tax rate results in lower black market capture. The relationship is non-linear; research indicates that above certain thresholds (~20%), black market capture rates drop dramatically. This phenomenon and the associated research are detailed in a subsequent section of this report.
82 Indiana Sports Betting Report
• Market size: High tax rates are likely to depress overall market size. The decrease is driven both by a lower black market capture rate (i.e., more demand stays in the black market) and by a reduced incentive for operators to develop and market their sports betting product.
• Competition: High tax rates will generally favor larger operators who can more readily absorb a low-margin, high-volatility product on their balance sheets. Higher tax rates also shift greater emphasis to operational scale (e.g., operators with multiple properties can share some costs and better absorb a higher tax burden) and to ancillary benefits (e.g., operators with a broader array of non-gaming amenities or a national footprint can more readily justify using sports betting as a sort of loss-leader). In short, high tax rates may provide an advantage to larger operators and hamper smaller operators, decreasing overall competition in the market. Admittedly, some degree of this dynamic will be in play regardless of tax rate.
• Competitive balance: High tax rates reduce margin, which diminishes the ability of smaller operators to utilize sports betting as a lever to reduce the revenue gap between themselves and larger operators.
• Casino participation: At some threshold, tax rates will be high enough to convince some operators (likely smaller operators) that sports betting cannot be operated profitably even when taking into account ancillary benefits such as increased visitation and cross-sell to other products.
• State revenue: The state is faced with a difficult calculation. Low tax rates will stimulate market activity and generate a larger market size when compared to a high-tax environment. But higher tax rates generate more revenue on face, meaning the drop off in market size due to a high tax rate must be relatively dramatic to outweigh the increased revenue from a higher tax rate. Of course, state revenue is only one of several goals in play with tax policy. We will discuss additional goals and how they intersect with tax policy in our Recommendations section.
Stakeholder Dynamics
Professional sports stakeholders have taken divergent positions on the issue. The NBA, MLB and PGA have voiced strong support for royalty or integrity fees – a potentially significant form of effective taxation – but have been less vocal about how states should approach tax rates for sports betting revenue. The NFL, by contrast, has not come out in favor of royalty or integrity fees. Further, it has raised questions37 about whether tax policy in Pennsylvania – where a 36% tax is applied to sports betting revenue – will hinder the ability of legal market operators to compete against their black market counterparts. The commercial casinos that have weighed in have opposed efforts by professional sports leagues to codify royalty or integrity fees in state legislation. At the same time, casinos, alongside other retail gaming stakeholders, have expressed near-unanimous support for tax regimes under which a low or moderate levy rate is applied to sports betting revenue. Tribal casinos, which do not pay taxes on their gaming revenue, have suggested in no uncertain terms38 that they will not pay taxes on their sports betting revenue. Other gambling stakeholders (e.g., lottery retailers, charitable gambling operators) will likely base their position on their ability to participate in or receive benefits from regulated sports betting.
37 Source: https://gamingcontrolboard.pa.gov/files/legislation/sports_wagering_public_input.pdf 38 Source: http://www.indiangaming.org/news/2018/5/18/sport-betting-notice
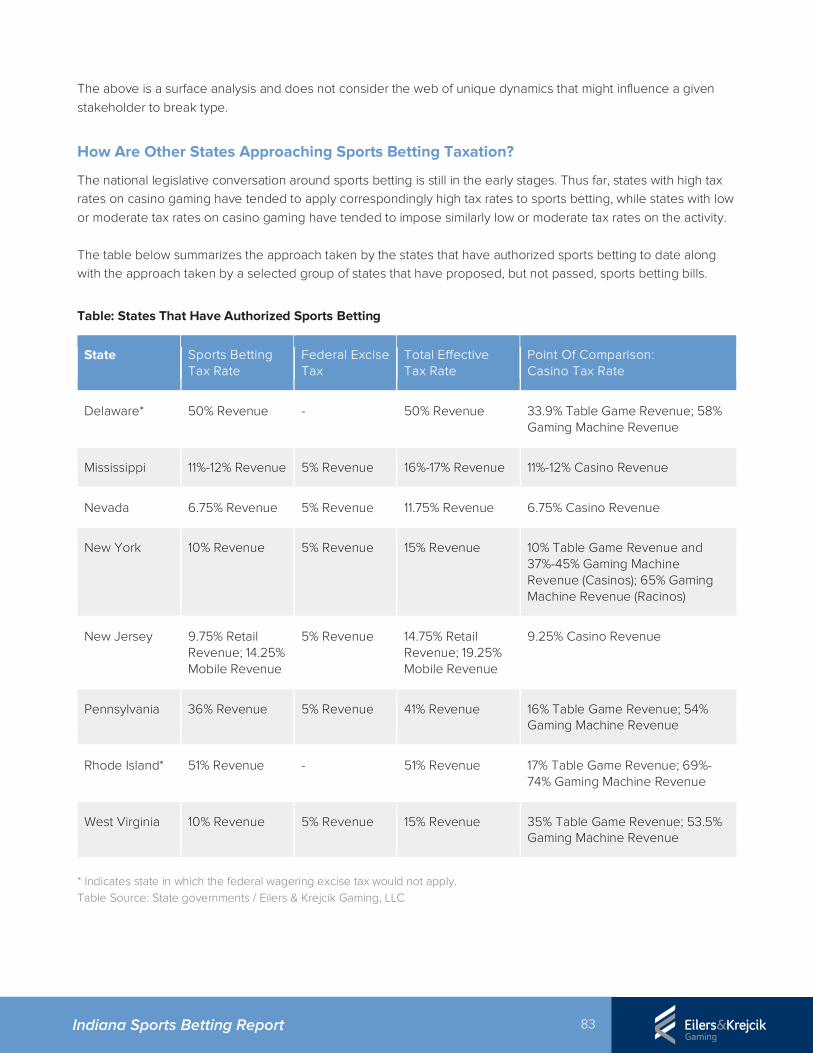
83 Indiana Sports Betting Report
The above is a surface analysis and does not consider the web of unique dynamics that might influence a given stakeholder to break type.
How Are Other States Approaching Sports Betting Taxation?
The national legislative conversation around sports betting is still in the early stages. Thus far, states with high tax rates on casino gaming have tended to apply correspondingly high tax rates to sports betting, while states with low or moderate tax rates on casino gaming have tended to impose similarly low or moderate tax rates on the activity. The table below summarizes the approach taken by the states that have authorized sports betting to date along with the approach taken by a selected group of states that have proposed, but not passed, sports betting bills.
Table: States That Have Authorized Sports Betting
State Sports Betting Tax Rate
Federal Excise Tax
Total Effective Tax Rate
Point Of Comparison: Casino Tax Rate
Delaware* 50% Revenue - 50% Revenue 33.9% Table Game Revenue; 58% Gaming Machine Revenue
Mississippi 11%-12% Revenue 5% Revenue 16%-17% Revenue 11%-12% Casino Revenue
Nevada 6.75% Revenue 5% Revenue 11.75% Revenue 6.75% Casino Revenue
New York 10% Revenue 5% Revenue 15% Revenue 10% Table Game Revenue and 37%-45% Gaming Machine Revenue (Casinos); 65% Gaming Machine Revenue (Racinos)
New Jersey 9.75% Retail Revenue; 14.25% Mobile Revenue
5% Revenue 14.75% Retail Revenue; 19.25% Mobile Revenue
9.25% Casino Revenue
Pennsylvania 36% Revenue 5% Revenue 41% Revenue 16% Table Game Revenue; 54% Gaming Machine Revenue
Rhode Island* 51% Revenue - 51% Revenue 17% Table Game Revenue; 69%-74% Gaming Machine Revenue
West Virginia 10% Revenue 5% Revenue 15% Revenue 35% Table Game Revenue; 53.5% Gaming Machine Revenue
* Indicates state in which the federal wagering excise tax would not apply. Table Source: State governments / Eilers & Krejcik Gaming, LLC
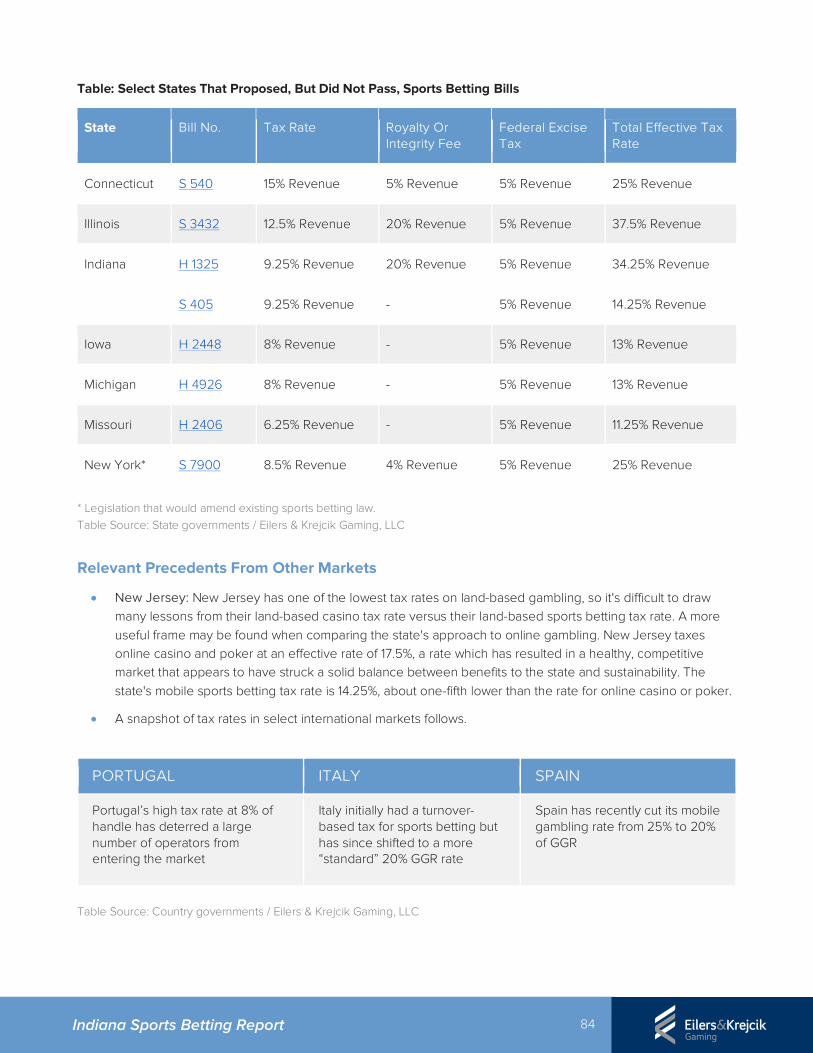
84 Indiana Sports Betting Report
Table: Select States That Proposed, But Did Not Pass, Sports Betting Bills
State Bill No. Tax Rate Royalty Or Integrity Fee
Federal Excise Tax
Total Effective Tax Rate
Connecticut S 540 15% Revenue 5% Revenue 5% Revenue 25% Revenue
Illinois S 3432 12.5% Revenue 20% Revenue 5% Revenue 37.5% Revenue
Indiana H 1325 9.25% Revenue 20% Revenue 5% Revenue 34.25% Revenue
S 405 9.25% Revenue - 5% Revenue 14.25% Revenue
Iowa H 2448 8% Revenue - 5% Revenue 13% Revenue
Michigan H 4926 8% Revenue - 5% Revenue 13% Revenue
Missouri H 2406 6.25% Revenue - 5% Revenue 11.25% Revenue
New York* S 7900 8.5% Revenue 4% Revenue 5% Revenue 25% Revenue
* Legislation that would amend existing sports betting law. Table Source: State governments / Eilers & Krejcik Gaming, LLC
Relevant Precedents From Other Markets
• New Jersey: New Jersey has one of the lowest tax rates on land-based gambling, so it's difficult to draw many lessons from their land-based casino tax rate versus their land-based sports betting tax rate. A more useful frame may be found when comparing the state's approach to online gambling. New Jersey taxes online casino and poker at an effective rate of 17.5%, a rate which has resulted in a healthy, competitive market that appears to have struck a solid balance between benefits to the state and sustainability. The state's mobile sports betting tax rate is 14.25%, about one-fifth lower than the rate for online casino or poker.
• A snapshot of tax rates in select international markets follows.
PORTUGAL ITALY SPAIN
Portugal’s high tax rate at 8% of handle has deterred a large number of operators from entering the market
Italy initially had a turnover-based tax for sports betting but has since shifted to a more “standard” 20% GGR rate
Spain has recently cut its mobile gambling rate from 25% to 20% of GGR
Table Source: Country governments / Eilers & Krejcik Gaming, LLC
85 Indiana Sports Betting Report
Key Takeaways
We note that above a 15% tax rate, there is substantially more uncertainty in the demand impacts. We expect that somewhere above 15-20%, there is a “cliff” or non-continuous change in market size, as some games become unprofitable (e.g., in-game wagering) and are no longer offered, and substantial demand shifts to the unregulated market. This view is supported by numerous pieces of research underpinned by the performance of a variety of international markets. We think it is worth emphasizing that the federal excise tax is likely to remain in play for the foreseeable future, and that the tax can be best understood as a 5% effective tax on revenue. This tax must be included in any analysis of the impact of tax rates on market size, black market capture, and operator participation. While higher tax revenue may be feasible with a rate above 15%, we believe there will be substantially increased risk in terms of market supply and consumer demand. There is also some risk that a high tax rate dissuades some operators from entering the market, decreasing license fee revenue and likely resulting in a smaller overall market. We note that states are unlikely to reach any sort of consensus on tax rates.
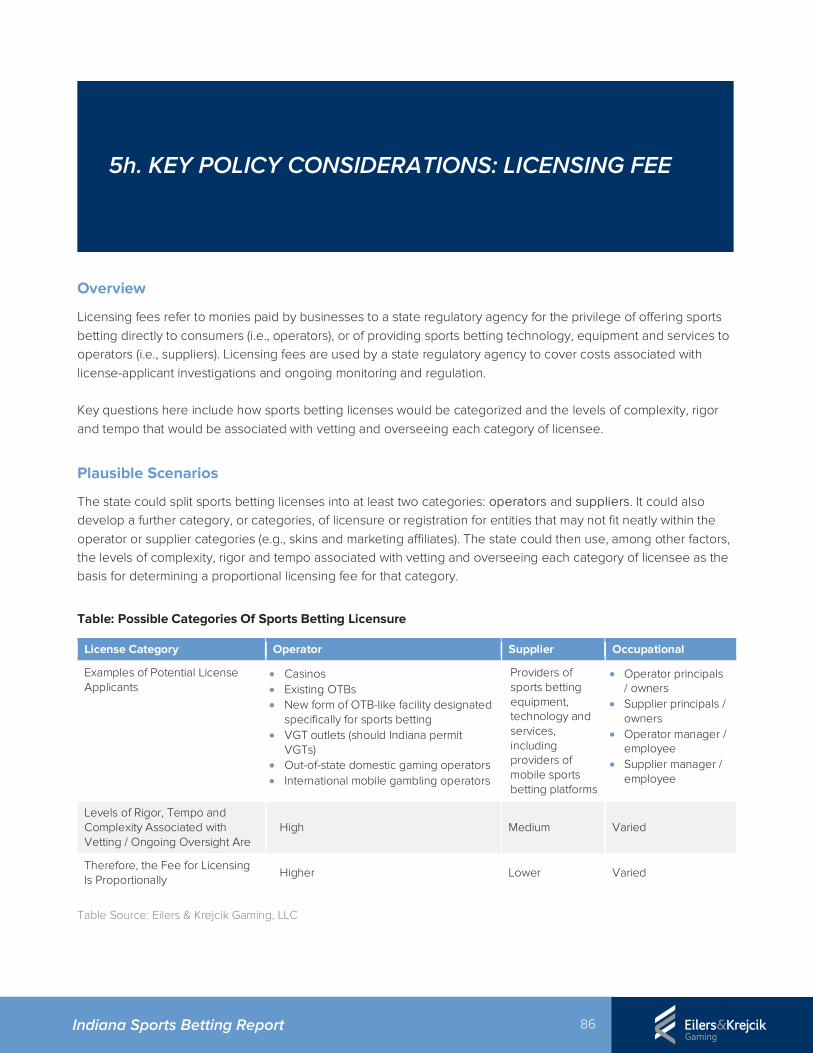
86 Indiana Sports Betting Report
Overview
Licensing fees refer to monies paid by businesses to a state regulatory agency for the privilege of offering sports betting directly to consumers (i.e., operators), or of providing sports betting technology, equipment and services to operators (i.e., suppliers). Licensing fees are used by a state regulatory agency to cover costs associated with license-applicant investigations and ongoing monitoring and regulation. Key questions here include how sports betting licenses would be categorized and the levels of complexity, rigor and tempo that would be associated with vetting and overseeing each category of licensee.
Plausible Scenarios
The state could split sports betting licenses into at least two categories: operators and suppliers. It could also develop a further category, or categories, of licensure or registration for entities that may not fit neatly within the operator or supplier categories (e.g., skins and marketing affiliates). The state could then use, among other factors, the levels of complexity, rigor and tempo associated with vetting and overseeing each category of licensee as the basis for determining a proportional licensing fee for that category.
Table: Possible Categories Of Sports Betting Licensure
License Category Operator Supplier Occupational
Examples of Potential License Applicants
• Casinos • Existing OTBs • New form of OTB-like facility designated
specifically for sports betting • VGT outlets (should Indiana permit
VGTs) • Out-of-state domestic gaming operators • International mobile gambling operators
Providers of sports betting equipment, technology and services, including providers of mobile sports betting platforms
• Operator principals / owners
• Supplier principals / owners
• Operator manager / employee
• Supplier manager / employee
Levels of Rigor, Tempo and Complexity Associated with Vetting / Ongoing Oversight Are
High Medium Varied
Therefore, the Fee for Licensing Is Proportionally
Higher Lower Varied
Table Source: Eilers & Krejcik Gaming, LLC
5h. KEY POLICY CONSIDERATIONS: LICENSING FEE
87 Indiana Sports Betting Report
Direct Impacts
Decisions around licensing fees specifically impact the following aspects of a regulated sports betting market:
• State revenue: Broadly speaking, the implementation of higher licensing fees may not only cover the state’s costs associated with licensing and regulation, but also exceed them to some degree, yielding a profit for the state (whereas the implementation of lower such fees may not yield a profit). If the implementation of additional licensing categories for entities that do not fit neatly within the operator or supplier categories is necessary, the state, depending on how it calibrates licensing fees for those categories, may have further opportunities to generate profits from licensing activity.
• Participation levels: Lower licensing fees will generally attract more license applicants and, in turn, yield higher levels of operator / supplier participation, whereas higher fees may attract fewer applicants and yield correspondingly lower levels of participation.
• Market size: A market with greater operator / supplier participation levels tends to yield wider availability of product, and wider availability of product almost always generates a larger market in terms of overall handle and revenue.
• Black market capture rate: Wider availability of product will result in a greater transfer of demand from the black market to the regulated market. Correspondingly, narrower availability will likely motivate more consumers to stick with the black market.
• Competition: Wider availability of product tends to increase the competition between individual sports betting operators / suppliers as a wider population of potential customers comes into play. Limited availability tends to result in consumers choosing a sports betting product based on convenience rather than price or quality.
• Regulatory funding: Recurring license fees or renewals are often a critical funding mechanism for regulatory agencies. Sports betting will absolutely impose additional responsibilities and costs upon regulatory bodies, costs that will need to be recouped through license renewal fees or a similar funding mechanism.
Stakeholder Dynamics
Professional sports stakeholders, given none have expressed interest in becoming a sports betting operator or supplier, have largely been silent on the issue of licensing fees. The NFL, however, has raised questions39 about whether the cost of operator licensure in Pennsylvania ($10mm), together with the state’s 36% tax on sports betting revenue, “may render legal market participants unable to effectively compete with those in the illegal market.” The commercial casino industry, its suppliers, and other retail gaming stakeholders have also voiced little opposition to proposed or enacted licensing fees for sports betting, although some, like the NFL, have questioned40 the viability of the fee-and-tax regime in Pennsylvania. The above is a surface analysis and does not consider the web of unique dynamics that might influence a given stakeholder to break type.
39 Source: https://gamingcontrolboard.pa.gov/files/legislation/sports_wagering_public_input.pdf 40 Source: https://www.usatoday.com/story/sports/2018/05/17/sports-betting-high-cost-opening-sports-books-avoid-states/614332002/
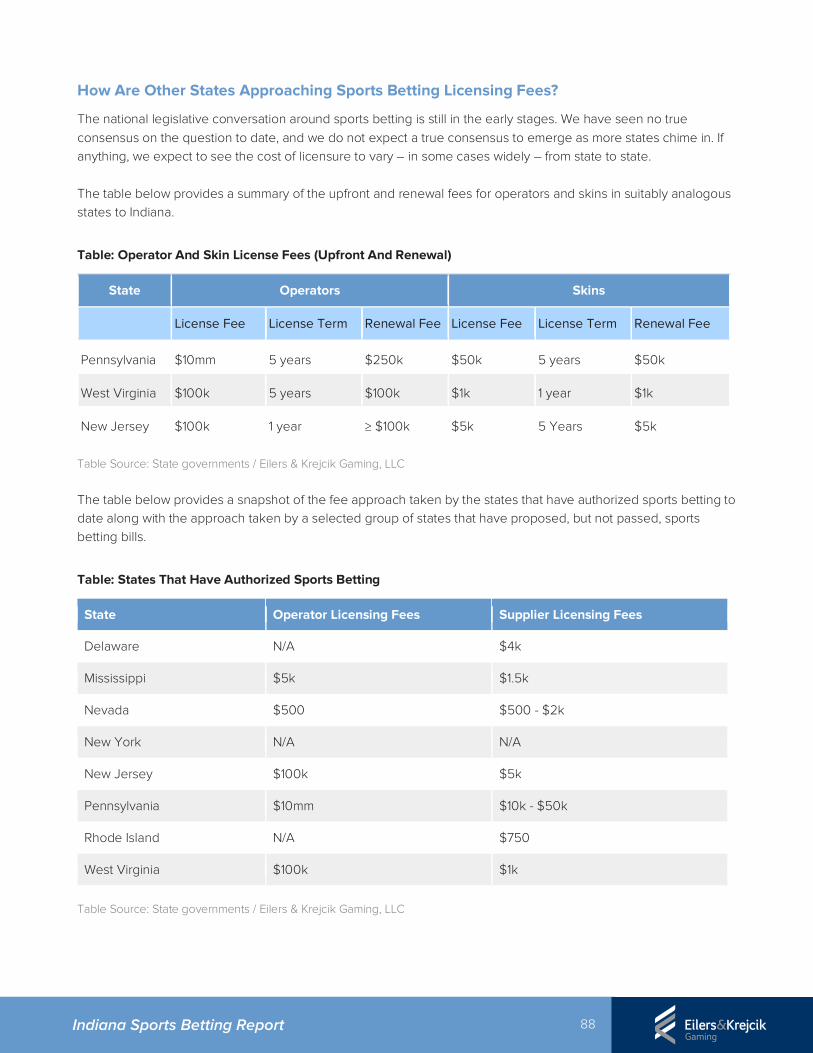
88 Indiana Sports Betting Report
How Are Other States Approaching Sports Betting Licensing Fees?
The national legislative conversation around sports betting is still in the early stages. We have seen no true consensus on the question to date, and we do not expect a true consensus to emerge as more states chime in. If anything, we expect to see the cost of licensure to vary – in some cases widely – from state to state. The table below provides a summary of the upfront and renewal fees for operators and skins in suitably analogous states to Indiana.
Table: Operator And Skin License Fees (Upfront And Renewal)
State Operators Skins
License Fee License Term Renewal Fee License Fee License Term Renewal Fee
Pennsylvania $10mm 5 years $250k $50k 5 years $50k
West Virginia $100k 5 years $100k $1k 1 year $1k
New Jersey $100k 1 year ≥ $100k $5k 5 Years $5k
Table Source: State governments / Eilers & Krejcik Gaming, LLC The table below provides a snapshot of the fee approach taken by the states that have authorized sports betting to date along with the approach taken by a selected group of states that have proposed, but not passed, sports betting bills.
Table: States That Have Authorized Sports Betting
State Operator Licensing Fees Supplier Licensing Fees
Delaware N/A $4k
Mississippi $5k $1.5k
Nevada $500 $500 - $2k
New York N/A N/A
New Jersey $100k $5k
Pennsylvania $10mm $10k - $50k
Rhode Island N/A $750
West Virginia $100k $1k
Table Source: State governments / Eilers & Krejcik Gaming, LLC
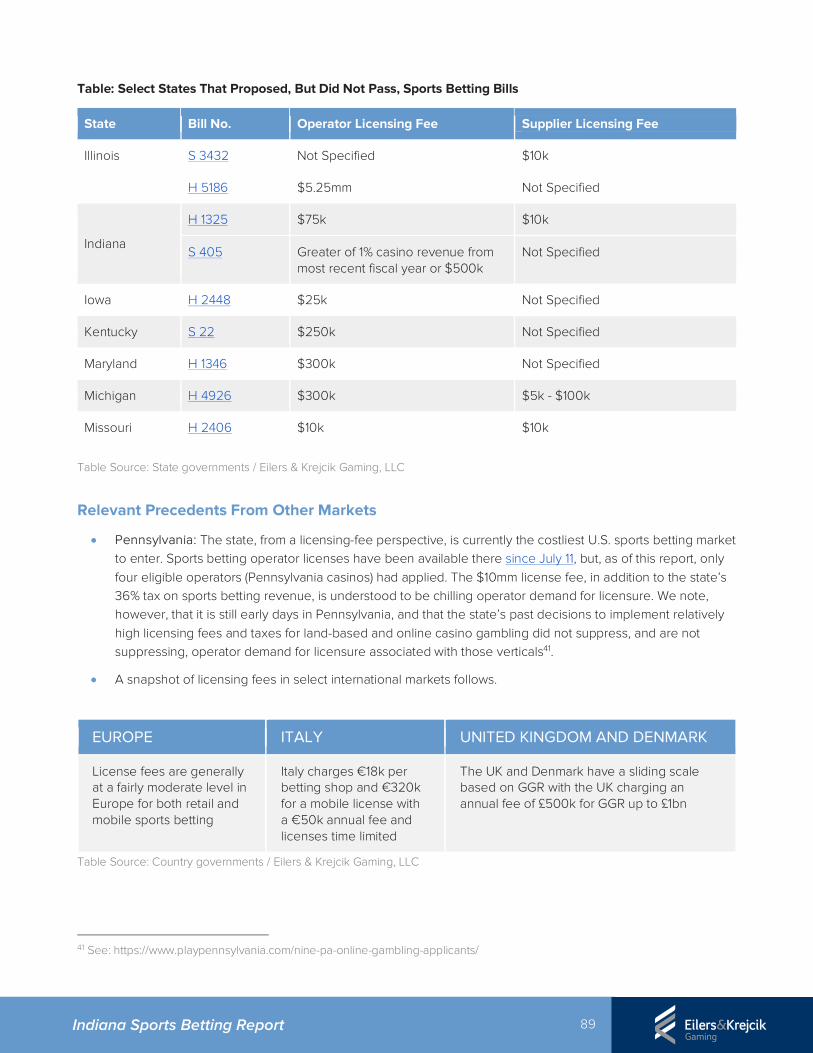
89 Indiana Sports Betting Report
Table: Select States That Proposed, But Did Not Pass, Sports Betting Bills
State Bill No. Operator Licensing Fee Supplier Licensing Fee
Illinois S 3432 Not Specified $10k
H 5186 $5.25mm Not Specified
Indiana
H 1325 $75k $10k
S 405 Greater of 1% casino revenue from most recent fiscal year or $500k
Not Specified
Iowa H 2448 $25k Not Specified
Kentucky S 22 $250k Not Specified
Maryland H 1346 $300k Not Specified
Michigan H 4926 $300k $5k - $100k
Missouri H 2406 $10k $10k
Table Source: State governments / Eilers & Krejcik Gaming, LLC
Relevant Precedents From Other Markets
• Pennsylvania: The state, from a licensing-fee perspective, is currently the costliest U.S. sports betting market to enter. Sports betting operator licenses have been available there since July 11, but, as of this report, only four eligible operators (Pennsylvania casinos) had applied. The $10mm license fee, in addition to the state’s 36% tax on sports betting revenue, is understood to be chilling operator demand for licensure. We note, however, that it is still early days in Pennsylvania, and that the state’s past decisions to implement relatively high licensing fees and taxes for land-based and online casino gambling did not suppress, and are not suppressing, operator demand for licensure associated with those verticals41.
• A snapshot of licensing fees in select international markets follows.
EUROPE ITALY UNITED KINGDOM AND DENMARK
License fees are generally at a fairly moderate level in Europe for both retail and mobile sports betting
Italy charges €18k per betting shop and €320k for a mobile license with a €50k annual fee and licenses time limited
The UK and Denmark have a sliding scale based on GGR with the UK charging an annual fee of £500k for GGR up to £1bn
Table Source: Country governments / Eilers & Krejcik Gaming, LLC
41 See: https://www.playpennsylvania.com/nine-pa-online-gambling-applicants/
90 Indiana Sports Betting Report
Key Takeaways
As with tax rates, license fees must be considered through a complex lens that takes into account direct benefits for the state, impact on the market, and impact on operator participation. We believe that the experience of other states has shown that operators are willing to pay a material price for licenses that confer the exclusive ability to offer regulated sports betting. We note that not all operators will feel the same impacts from a flat license fee; larger operators or those with a multi-state sports betting operation can more readily absorb larger license fees. We further note that license fees must be considered in conjunction with tax rates, as a license fee can be economically understood as an extension of the tax rate. We further believe that – given the intense demand in New Jersey – policymakers may have been undervaluing skins. Policymakers could conceivably extract a meaningful amount of additional license fee revenue from entities seeking to operate skins in a regulated sports betting market. Finally, we note that sports betting brings with it a unique regulatory burden, and that license fees – or a similar funding mechanism – must account for this burden by providing material funding and resources to relevant regulatory bodies.
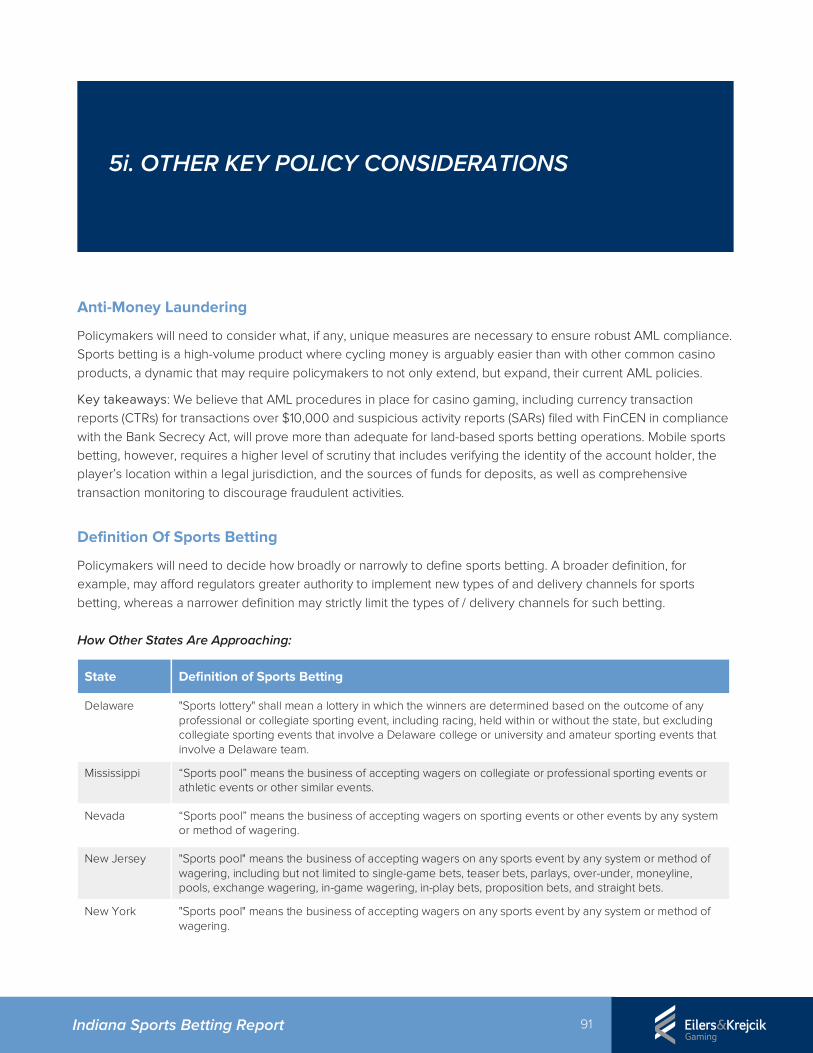
91 Indiana Sports Betting Report
Anti-Money Laundering
Policymakers will need to consider what, if any, unique measures are necessary to ensure robust AML compliance. Sports betting is a high-volume product where cycling money is arguably easier than with other common casino products, a dynamic that may require policymakers to not only extend, but expand, their current AML policies.
Key takeaways: We believe that AML procedures in place for casino gaming, including currency transaction reports (CTRs) for transactions over $10,000 and suspicious activity reports (SARs) filed with FinCEN in compliance with the Bank Secrecy Act, will prove more than adequate for land-based sports betting operations. Mobile sports betting, however, requires a higher level of scrutiny that includes verifying the identity of the account holder, the player’s location within a legal jurisdiction, and the sources of funds for deposits, as well as comprehensive transaction monitoring to discourage fraudulent activities.
Definition Of Sports Betting
Policymakers will need to decide how broadly or narrowly to define sports betting. A broader definition, for example, may afford regulators greater authority to implement new types of and delivery channels for sports betting, whereas a narrower definition may strictly limit the types of / delivery channels for such betting. How Other States Are Approaching:
State Definition of Sports Betting
Delaware "Sports lottery" shall mean a lottery in which the winners are determined based on the outcome of any professional or collegiate sporting event, including racing, held within or without the state, but excluding collegiate sporting events that involve a Delaware college or university and amateur sporting events that involve a Delaware team.
Mississippi “Sports pool” means the business of accepting wagers on collegiate or professional sporting events or athletic events or other similar events.
Nevada “Sports pool” means the business of accepting wagers on sporting events or other events by any system or method of wagering.
New Jersey "Sports pool" means the business of accepting wagers on any sports event by any system or method of wagering, including but not limited to single-game bets, teaser bets, parlays, over-under, moneyline, pools, exchange wagering, in-game wagering, in-play bets, proposition bets, and straight bets.
New York "Sports pool" means the business of accepting wagers on any sports event by any system or method of wagering.
5i. OTHER KEY POLICY CONSIDERATIONS
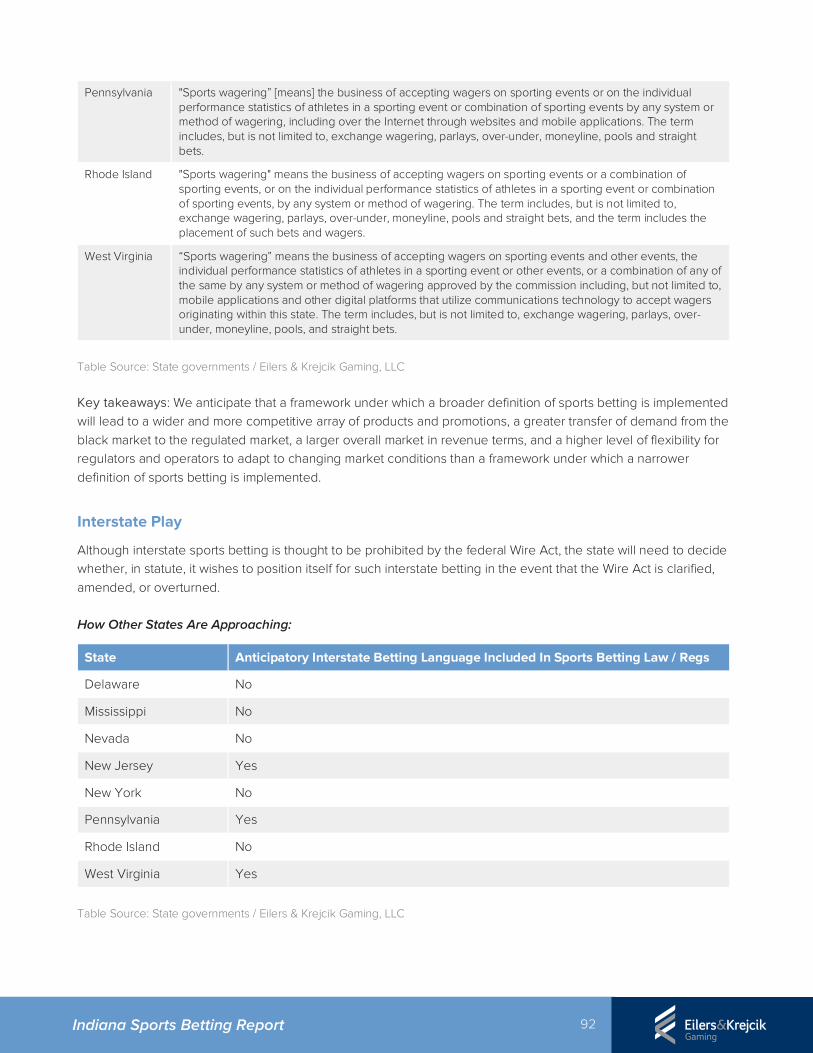
92 Indiana Sports Betting Report
Pennsylvania "Sports wagering” [means] the business of accepting wagers on sporting events or on the individual performance statistics of athletes in a sporting event or combination of sporting events by any system or method of wagering, including over the Internet through websites and mobile applications. The term includes, but is not limited to, exchange wagering, parlays, over-under, moneyline, pools and straight bets.
Rhode Island "Sports wagering" means the business of accepting wagers on sporting events or a combination of sporting events, or on the individual performance statistics of athletes in a sporting event or combination of sporting events, by any system or method of wagering. The term includes, but is not limited to, exchange wagering, parlays, over-under, moneyline, pools and straight bets, and the term includes the placement of such bets and wagers.
West Virginia “Sports wagering” means the business of accepting wagers on sporting events and other events, the individual performance statistics of athletes in a sporting event or other events, or a combination of any of the same by any system or method of wagering approved by the commission including, but not limited to, mobile applications and other digital platforms that utilize communications technology to accept wagers originating within this state. The term includes, but is not limited to, exchange wagering, parlays, over-under, moneyline, pools, and straight bets.
Table Source: State governments / Eilers & Krejcik Gaming, LLC
Key takeaways: We anticipate that a framework under which a broader definition of sports betting is implemented will lead to a wider and more competitive array of products and promotions, a greater transfer of demand from the black market to the regulated market, a larger overall market in revenue terms, and a higher level of flexibility for regulators and operators to adapt to changing market conditions than a framework under which a narrower definition of sports betting is implemented.
Interstate Play
Although interstate sports betting is thought to be prohibited by the federal Wire Act, the state will need to decide whether, in statute, it wishes to position itself for such interstate betting in the event that the Wire Act is clarified, amended, or overturned. How Other States Are Approaching:
State Anticipatory Interstate Betting Language Included In Sports Betting Law / Regs
Delaware No
Mississippi No
Nevada No
New Jersey Yes
New York No
Pennsylvania Yes
Rhode Island No
West Virginia Yes
Table Source: State governments / Eilers & Krejcik Gaming, LLC
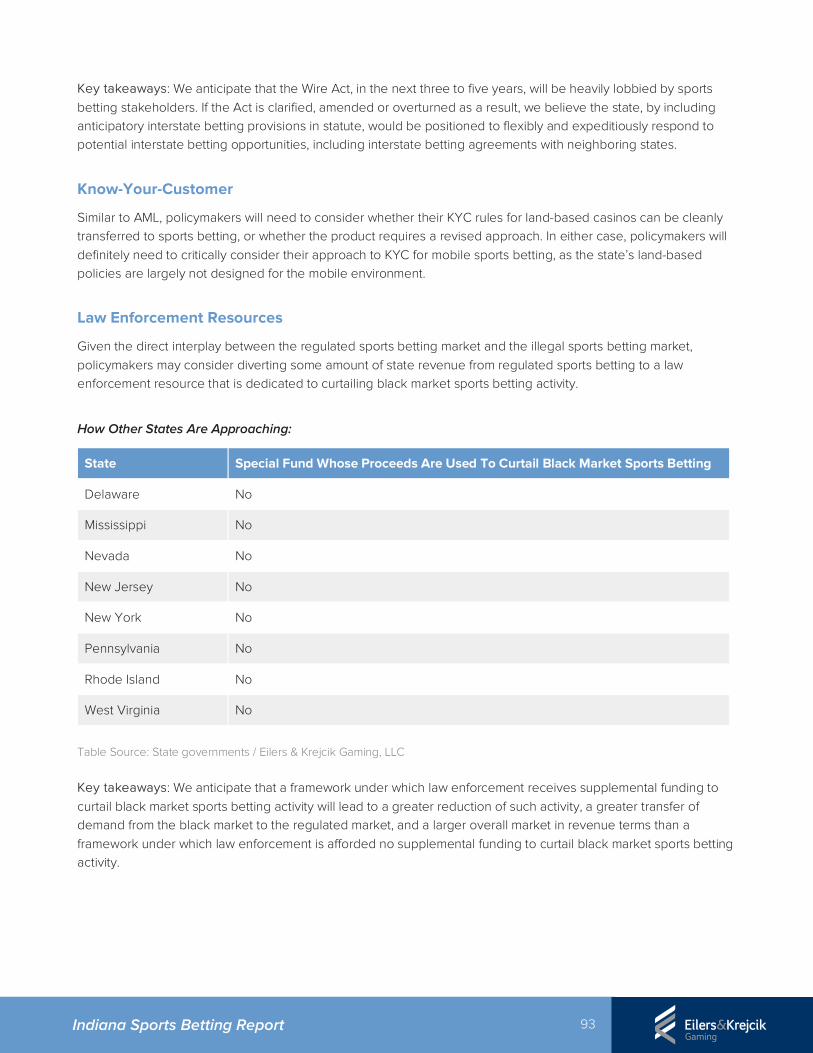
93 Indiana Sports Betting Report
Key takeaways: We anticipate that the Wire Act, in the next three to five years, will be heavily lobbied by sports betting stakeholders. If the Act is clarified, amended or overturned as a result, we believe the state, by including anticipatory interstate betting provisions in statute, would be positioned to flexibly and expeditiously respond to potential interstate betting opportunities, including interstate betting agreements with neighboring states.
Know-Your-Customer
Similar to AML, policymakers will need to consider whether their KYC rules for land-based casinos can be cleanly transferred to sports betting, or whether the product requires a revised approach. In either case, policymakers will definitely need to critically consider their approach to KYC for mobile sports betting, as the state’s land-based policies are largely not designed for the mobile environment.
Law Enforcement Resources
Given the direct interplay between the regulated sports betting market and the illegal sports betting market, policymakers may consider diverting some amount of state revenue from regulated sports betting to a law enforcement resource that is dedicated to curtailing black market sports betting activity.
How Other States Are Approaching:
State Special Fund Whose Proceeds Are Used To Curtail Black Market Sports Betting
Delaware No
Mississippi No
Nevada No
New Jersey No
New York No
Pennsylvania No
Rhode Island No
West Virginia No
Table Source: State governments / Eilers & Krejcik Gaming, LLC Key takeaways: We anticipate that a framework under which law enforcement receives supplemental funding to curtail black market sports betting activity will lead to a greater reduction of such activity, a greater transfer of demand from the black market to the regulated market, and a larger overall market in revenue terms than a framework under which law enforcement is afforded no supplemental funding to curtail black market sports betting activity.
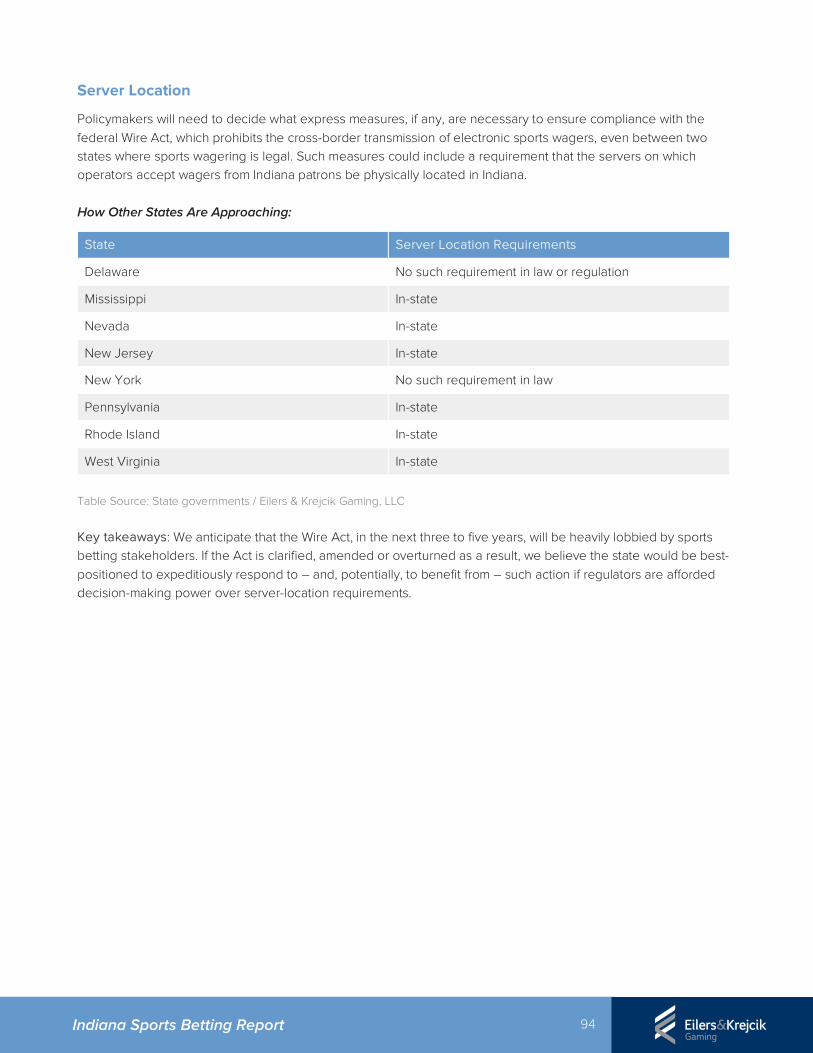
94 Indiana Sports Betting Report
Server Location
Policymakers will need to decide what express measures, if any, are necessary to ensure compliance with the federal Wire Act, which prohibits the cross-border transmission of electronic sports wagers, even between two states where sports wagering is legal. Such measures could include a requirement that the servers on which operators accept wagers from Indiana patrons be physically located in Indiana. How Other States Are Approaching:
State Server Location Requirements
Delaware No such requirement in law or regulation
Mississippi In-state
Nevada In-state
New Jersey In-state
New York No such requirement in law
Pennsylvania In-state
Rhode Island In-state
West Virginia In-state
Table Source: State governments / Eilers & Krejcik Gaming, LLC
Key takeaways: We anticipate that the Wire Act, in the next three to five years, will be heavily lobbied by sports betting stakeholders. If the Act is clarified, amended or overturned as a result, we believe the state would be best-positioned to expeditiously respond to – and, potentially, to benefit from – such action if regulators are afforded decision-making power over server-location requirements.
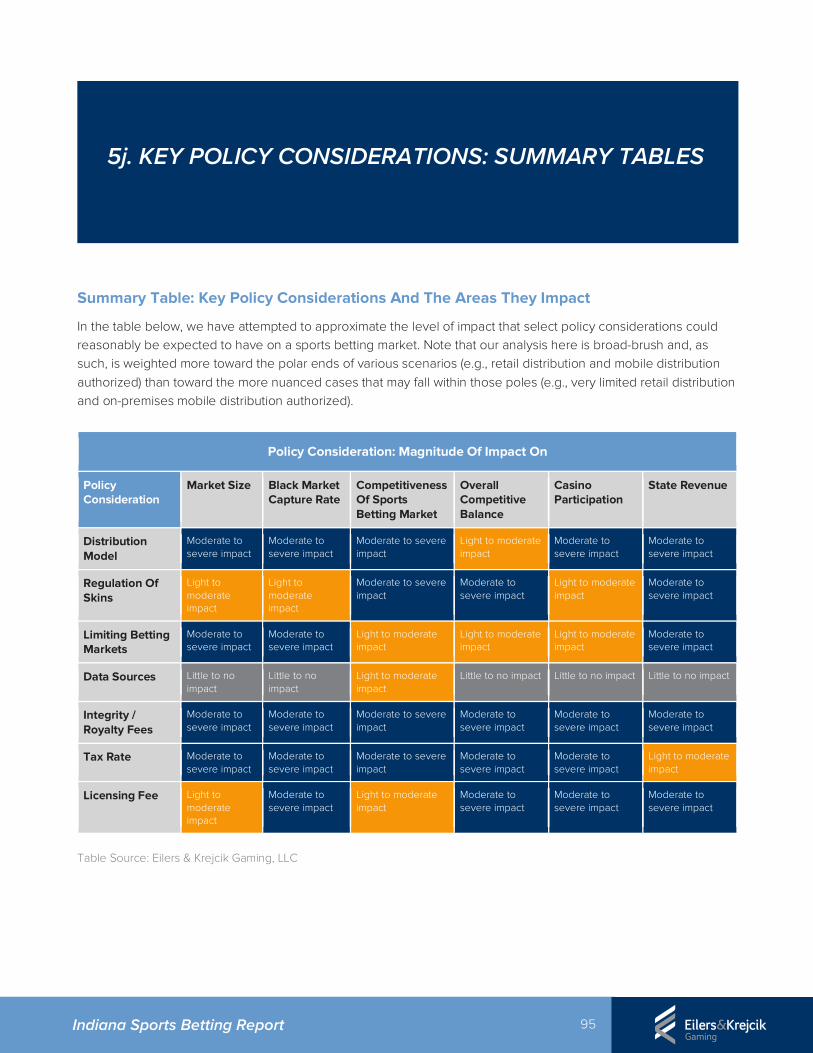
95 Indiana Sports Betting Report
Summary Table: Key Policy Considerations And The Areas They Impact
In the table below, we have attempted to approximate the level of impact that select policy considerations could reasonably be expected to have on a sports betting market. Note that our analysis here is broad-brush and, as such, is weighted more toward the polar ends of various scenarios (e.g., retail distribution and mobile distribution authorized) than toward the more nuanced cases that may fall within those poles (e.g., very limited retail distribution and on-premises mobile distribution authorized).
Policy Consideration: Magnitude Of Impact On
Policy Consideration
Market Size Black Market Capture Rate
Competitiveness Of Sports Betting Market
Overall Competitive Balance
Casino Participation
State Revenue
Distribution Model
Moderate to severe impact
Moderate to severe impact
Moderate to severe impact
Light to moderate impact
Moderate to severe impact
Moderate to severe impact
Regulation Of Skins
Light to moderate impact
Light to moderate impact
Moderate to severe impact
Moderate to severe impact
Light to moderate impact
Moderate to severe impact
Limiting Betting Markets
Moderate to severe impact
Moderate to severe impact
Light to moderate impact
Light to moderate impact
Light to moderate impact
Moderate to severe impact
Data Sources Little to no impact
Little to no impact
Light to moderate impact
Little to no impact Little to no impact Little to no impact
Integrity / Royalty Fees
Moderate to severe impact
Moderate to severe impact
Moderate to severe impact
Moderate to severe impact
Moderate to severe impact
Moderate to severe impact
Tax Rate Moderate to severe impact
Moderate to severe impact
Moderate to severe impact
Moderate to severe impact
Moderate to severe impact
Light to moderate impact
Licensing Fee Light to moderate impact
Moderate to severe impact
Light to moderate impact
Moderate to severe impact
Moderate to severe impact
Moderate to severe impact
Table Source: Eilers & Krejcik Gaming, LLC
5j. KEY POLICY CONSIDERATIONS: SUMMARY TABLES
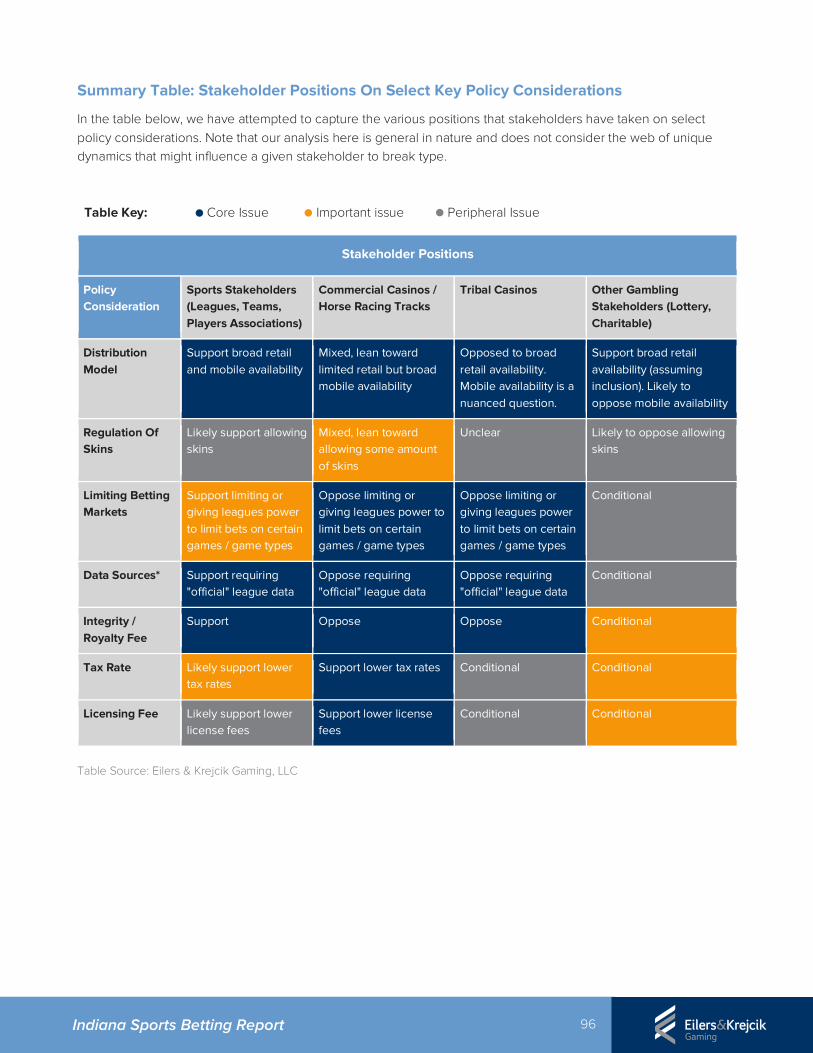
96 Indiana Sports Betting Report
Summary Table: Stakeholder Positions On Select Key Policy Considerations
In the table below, we have attempted to capture the various positions that stakeholders have taken on select policy considerations. Note that our analysis here is general in nature and does not consider the web of unique dynamics that might influence a given stakeholder to break type.
Table Key: Core Issue Important issue Peripheral Issue
Stakeholder Positions
Policy Consideration
Sports Stakeholders (Leagues, Teams, Players Associations)
Commercial Casinos / Horse Racing Tracks
Tribal Casinos Other Gambling Stakeholders (Lottery, Charitable)
Distribution Model
Support broad retail and mobile availability
Mixed, lean toward limited retail but broad mobile availability
Opposed to broad retail availability. Mobile availability is a nuanced question.
Support broad retail availability (assuming inclusion). Likely to oppose mobile availability
Regulation Of Skins
Likely support allowing skins
Mixed, lean toward allowing some amount of skins
Unclear Likely to oppose allowing skins
Limiting Betting Markets
Support limiting or giving leagues power to limit bets on certain games / game types
Oppose limiting or giving leagues power to limit bets on certain games / game types
Oppose limiting or giving leagues power to limit bets on certain games / game types
Conditional
Data Sources* Support requiring "official" league data
Oppose requiring "official" league data
Oppose requiring "official" league data
Conditional
Integrity / Royalty Fee
Support Oppose Oppose Conditional
Tax Rate Likely support lower tax rates
Support lower tax rates Conditional Conditional
Licensing Fee Likely support lower license fees
Support lower license fees
Conditional Conditional
Table Source: Eilers & Krejcik Gaming, LLC
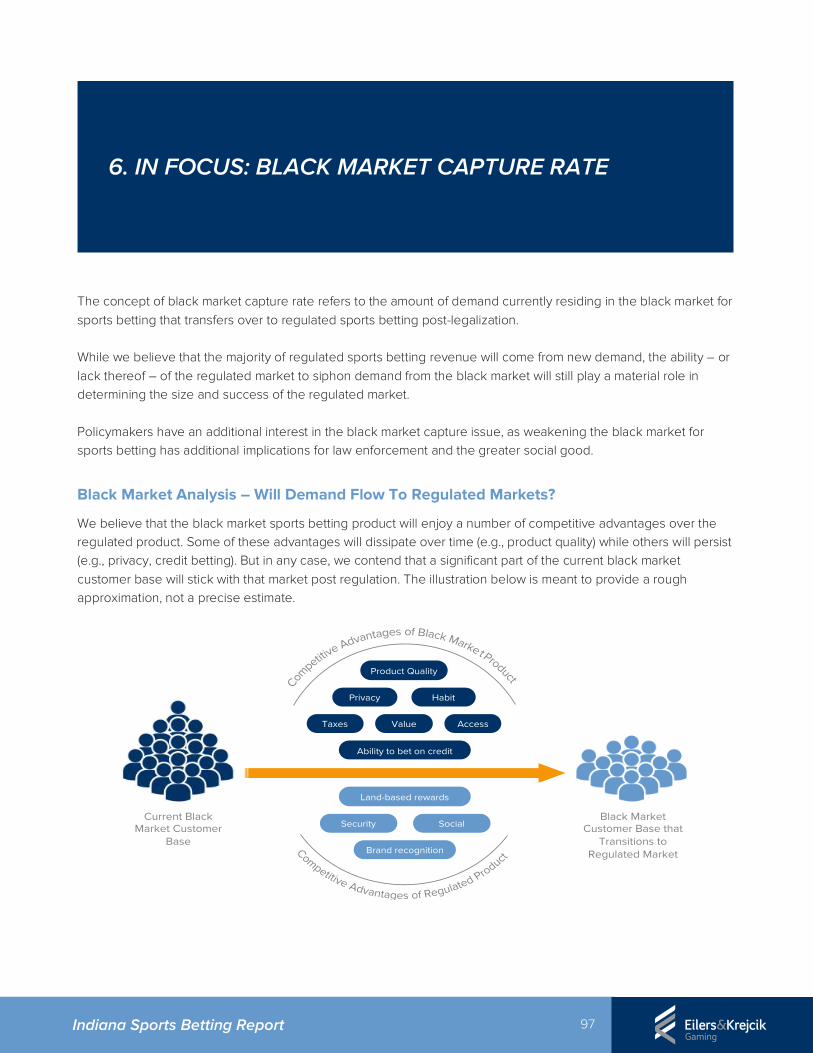
97 Indiana Sports Betting Report
The concept of black market capture rate refers to the amount of demand currently residing in the black market for sports betting that transfers over to regulated sports betting post-legalization. While we believe that the majority of regulated sports betting revenue will come from new demand, the ability – or lack thereof – of the regulated market to siphon demand from the black market will still play a material role in determining the size and success of the regulated market. Policymakers have an additional interest in the black market capture issue, as weakening the black market for sports betting has additional implications for law enforcement and the greater social good.
Black Market Analysis – Will Demand Flow To Regulated Markets?
We believe that the black market sports betting product will enjoy a number of competitive advantages over the regulated product. Some of these advantages will dissipate over time (e.g., product quality) while others will persist (e.g., privacy, credit betting). But in any case, we contend that a significant part of the current black market customer base will stick with that market post regulation. The illustration below is meant to provide a rough approximation, not a precise estimate.
Privacy
Taxes
Product Quality
Value
Habit
Access
Ability to bet on credit
Security
Land-based rewards
Brand recognition
SocialCurrent Black
Market Customer Base
Black Market Customer Base that
Transitions to Regulated Market
6. IN FOCUS: BLACK MARKET CAPTURE RATE
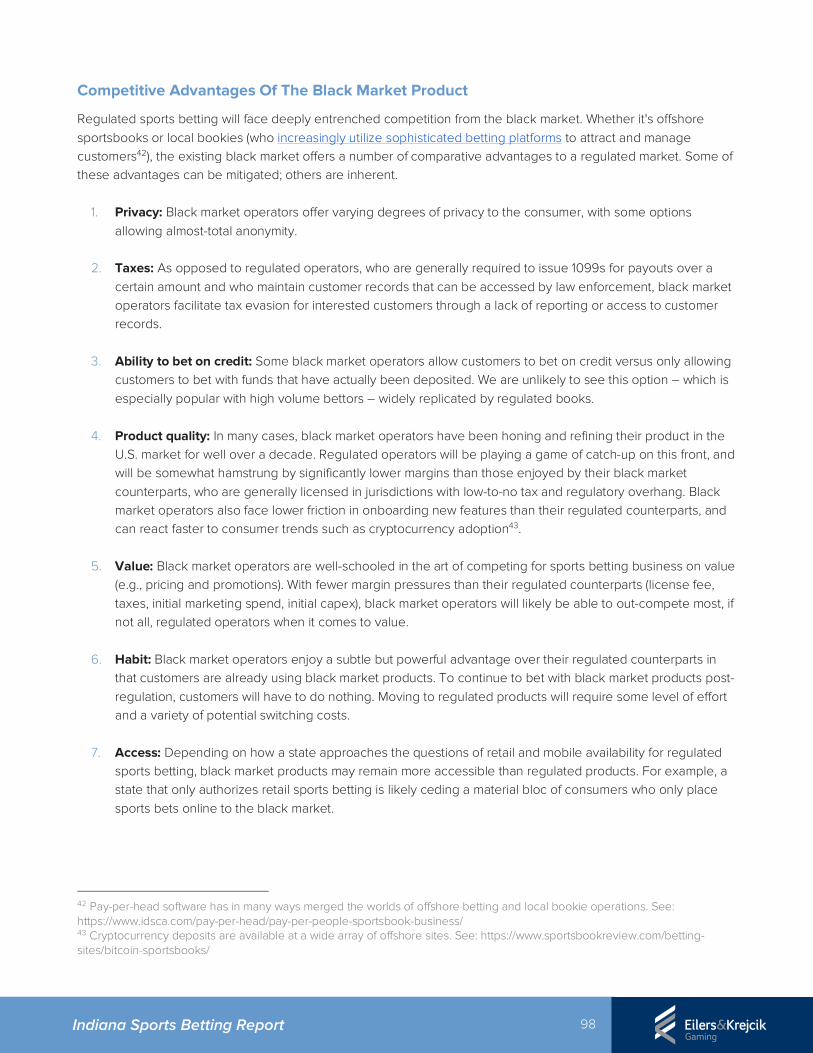
98 Indiana Sports Betting Report
Competitive Advantages Of The Black Market Product
Regulated sports betting will face deeply entrenched competition from the black market. Whether it's offshore sportsbooks or local bookies (who increasingly utilize sophisticated betting platforms to attract and manage customers42), the existing black market offers a number of comparative advantages to a regulated market. Some of these advantages can be mitigated; others are inherent.
1. Privacy: Black market operators offer varying degrees of privacy to the consumer, with some options allowing almost-total anonymity.
2. Taxes: As opposed to regulated operators, who are generally required to issue 1099s for payouts over a certain amount and who maintain customer records that can be accessed by law enforcement, black market operators facilitate tax evasion for interested customers through a lack of reporting or access to customer records.
3. Ability to bet on credit: Some black market operators allow customers to bet on credit versus only allowing customers to bet with funds that have actually been deposited. We are unlikely to see this option – which is especially popular with high volume bettors – widely replicated by regulated books.
4. Product quality: In many cases, black market operators have been honing and refining their product in the U.S. market for well over a decade. Regulated operators will be playing a game of catch-up on this front, and will be somewhat hamstrung by significantly lower margins than those enjoyed by their black market counterparts, who are generally licensed in jurisdictions with low-to-no tax and regulatory overhang. Black market operators also face lower friction in onboarding new features than their regulated counterparts, and can react faster to consumer trends such as cryptocurrency adoption43.
5. Value: Black market operators are well-schooled in the art of competing for sports betting business on value (e.g., pricing and promotions). With fewer margin pressures than their regulated counterparts (license fee, taxes, initial marketing spend, initial capex), black market operators will likely be able to out-compete most, if not all, regulated operators when it comes to value.
6. Habit: Black market operators enjoy a subtle but powerful advantage over their regulated counterparts in that customers are already using black market products. To continue to bet with black market products post-regulation, customers will have to do nothing. Moving to regulated products will require some level of effort and a variety of potential switching costs.
7. Access: Depending on how a state approaches the questions of retail and mobile availability for regulated sports betting, black market products may remain more accessible than regulated products. For example, a state that only authorizes retail sports betting is likely ceding a material bloc of consumers who only place sports bets online to the black market.
42 Pay-per-head software has in many ways merged the worlds of offshore betting and local bookie operations. See: https://www.idsca.com/pay-per-head/pay-per-people-sportsbook-business/ 43 Cryptocurrency deposits are available at a wide array of offshore sites. See: https://www.sportsbookreview.com/betting-sites/bitcoin-sportsbooks/
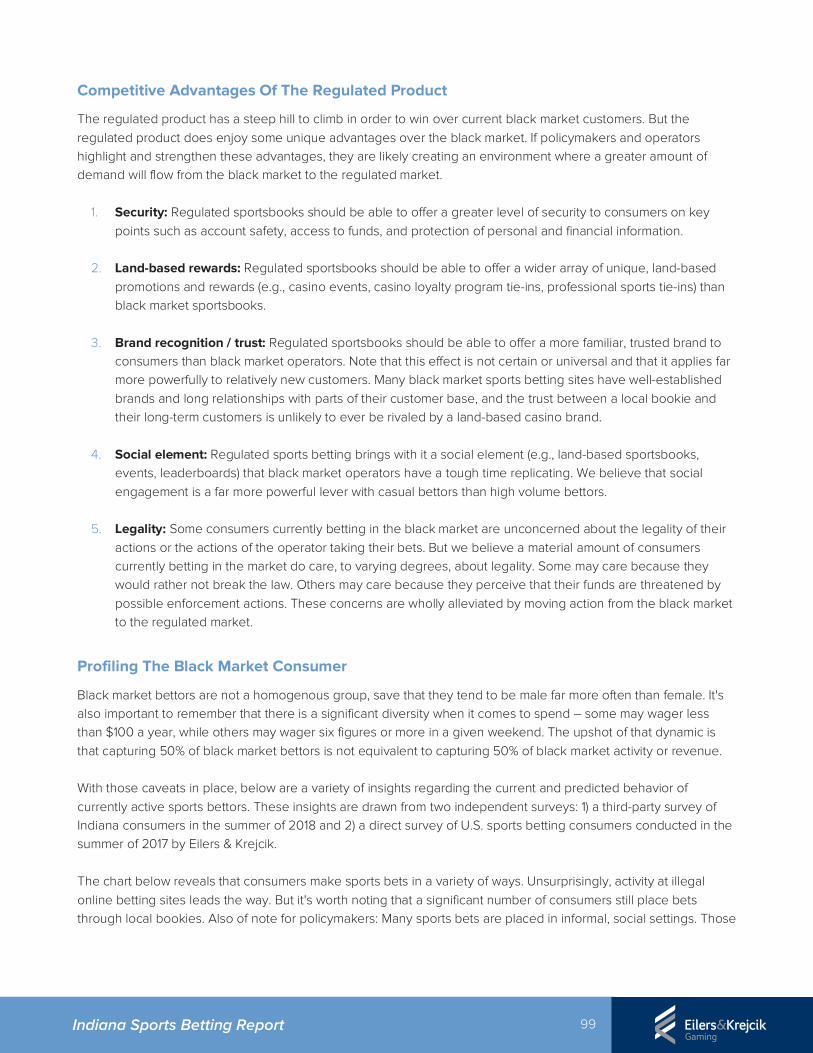
99 Indiana Sports Betting Report
Competitive Advantages Of The Regulated Product
The regulated product has a steep hill to climb in order to win over current black market customers. But the regulated product does enjoy some unique advantages over the black market. If policymakers and operators highlight and strengthen these advantages, they are likely creating an environment where a greater amount of demand will flow from the black market to the regulated market.
1. Security: Regulated sportsbooks should be able to offer a greater level of security to consumers on key points such as account safety, access to funds, and protection of personal and financial information.
2. Land-based rewards: Regulated sportsbooks should be able to offer a wider array of unique, land-based promotions and rewards (e.g., casino events, casino loyalty program tie-ins, professional sports tie-ins) than black market sportsbooks.
3. Brand recognition / trust: Regulated sportsbooks should be able to offer a more familiar, trusted brand to consumers than black market operators. Note that this effect is not certain or universal and that it applies far more powerfully to relatively new customers. Many black market sports betting sites have well-established brands and long relationships with parts of their customer base, and the trust between a local bookie and their long-term customers is unlikely to ever be rivaled by a land-based casino brand.
4. Social element: Regulated sports betting brings with it a social element (e.g., land-based sportsbooks, events, leaderboards) that black market operators have a tough time replicating. We believe that social engagement is a far more powerful lever with casual bettors than high volume bettors.
5. Legality: Some consumers currently betting in the black market are unconcerned about the legality of their actions or the actions of the operator taking their bets. But we believe a material amount of consumers currently betting in the market do care, to varying degrees, about legality. Some may care because they would rather not break the law. Others may care because they perceive that their funds are threatened by possible enforcement actions. These concerns are wholly alleviated by moving action from the black market to the regulated market.
Profiling The Black Market Consumer
Black market bettors are not a homogenous group, save that they tend to be male far more often than female. It's also important to remember that there is a significant diversity when it comes to spend – some may wager less than $100 a year, while others may wager six figures or more in a given weekend. The upshot of that dynamic is that capturing 50% of black market bettors is not equivalent to capturing 50% of black market activity or revenue. With those caveats in place, below are a variety of insights regarding the current and predicted behavior of currently active sports bettors. These insights are drawn from two independent surveys: 1) a third-party survey of Indiana consumers in the summer of 2018 and 2) a direct survey of U.S. sports betting consumers conducted in the summer of 2017 by Eilers & Krejcik. The chart below reveals that consumers make sports bets in a variety of ways. Unsurprisingly, activity at illegal online betting sites leads the way. But it's worth noting that a significant number of consumers still place bets through local bookies. Also of note for policymakers: Many sports bets are placed in informal, social settings. Those
100 Indiana Sports Betting Report
sorts of bets – the office pool, bets made between friends at the bar – are far more unlikely to migrate to the regulated market than bets currently place with an illegal bookmaker. Indiana Survey: When You Wagered On This Event, Was The Bet Placed:
Source: Eilers & Krejcik Gaming LLC The next chart underscores the critical need for the regulated sports betting market to include a robust array of ways for consumers to bet remotely. Over half of consumers placing bets in the status quo reported doing so either via an Internet website or via mobile device or smartphone app. Indiana Survey: Bet Placement Media - How Do You Normally Place Your Bets?
Source: Eilers & Krejcik Gaming LLC
Consumers who currently bet on sports tend to be relatively frequent bettors, with one third reporting that they bet weekly or more. Nearly 70% of respondents report betting at least once per month, a finding that has implications
42.2%
10.8%
47.0%
0%
10%
20%
30%
40%
50%
60%
At a sports book in a casino orgaming facility in the US
Directly with a bookie or salesrepresentative
Over the Internet on a sports bettingwebsite
In person, 43.1%
Phone call, 6.5%
Mobile device app, 21.8%
Internet website, 28.4%
Other, 0.3%
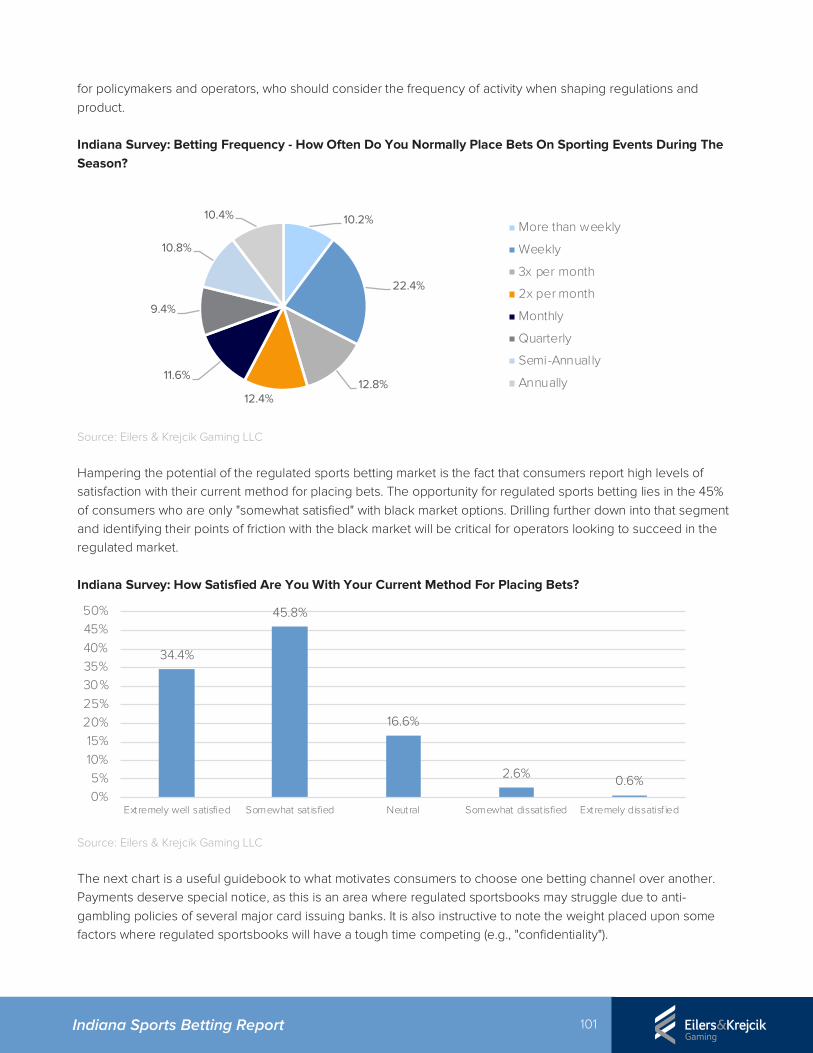
101 Indiana Sports Betting Report
for policymakers and operators, who should consider the frequency of activity when shaping regulations and product. Indiana Survey: Betting Frequency - How Often Do You Normally Place Bets On Sporting Events During The Season?
Source: Eilers & Krejcik Gaming LLC
Hampering the potential of the regulated sports betting market is the fact that consumers report high levels of satisfaction with their current method for placing bets. The opportunity for regulated sports betting lies in the 45% of consumers who are only "somewhat satisfied" with black market options. Drilling further down into that segment and identifying their points of friction with the black market will be critical for operators looking to succeed in the regulated market. Indiana Survey: How Satisfied Are You With Your Current Method For Placing Bets?
Source: Eilers & Krejcik Gaming LLC The next chart is a useful guidebook to what motivates consumers to choose one betting channel over another. Payments deserve special notice, as this is an area where regulated sportsbooks may struggle due to anti-gambling policies of several major card issuing banks. It is also instructive to note the weight placed upon some factors where regulated sportsbooks will have a tough time competing (e.g., "confidentiality").
10.2%
22.4%
12.8%12.4%
11.6%
9.4%
10.8%
10.4%More than weekly
Weekly
3x per month
2x per month
Monthly
Quarterly
Semi-Annually
Annually
34.4%
45.8%
16.6%
2.6% 0.6%0%5%
10%15%
20%25%30%35%40%45%50%
Extremely well satisfied Somewhat sat isfied Neutral Somewhat dissat isfied Extremely dissatisf ied
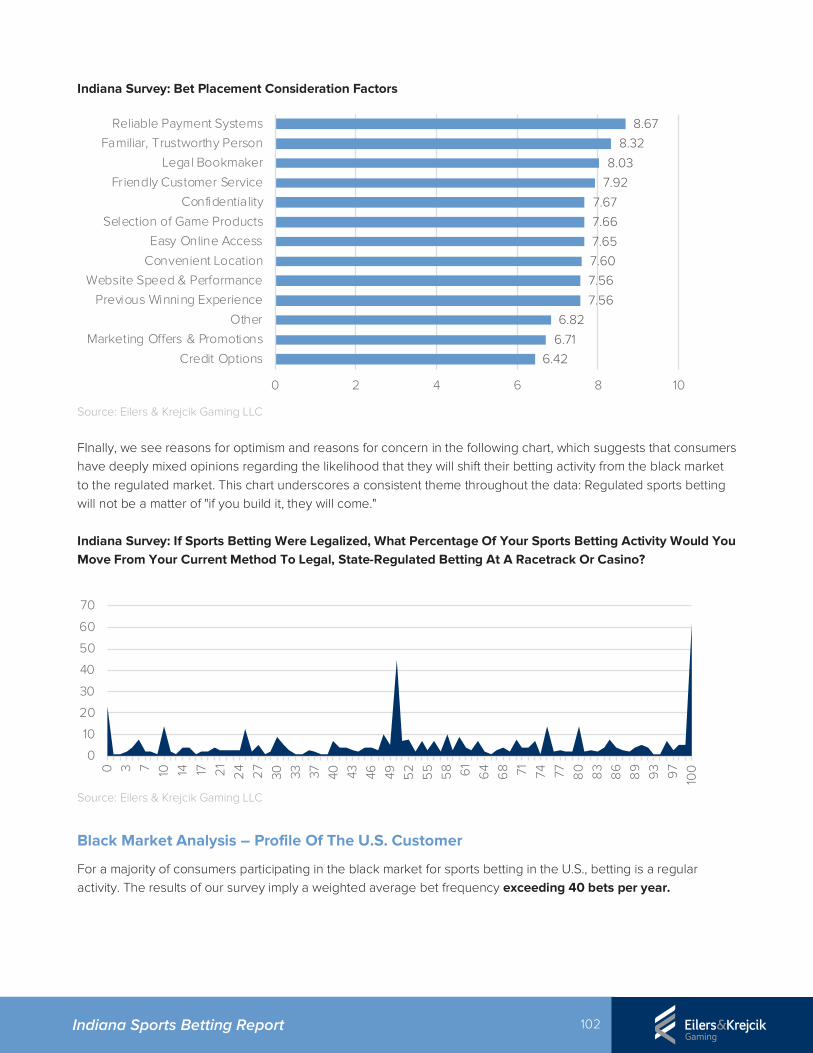
102 Indiana Sports Betting Report
Indiana Survey: Bet Placement Consideration Factors
Source: Eilers & Krejcik Gaming LLC
FInally, we see reasons for optimism and reasons for concern in the following chart, which suggests that consumers have deeply mixed opinions regarding the likelihood that they will shift their betting activity from the black market to the regulated market. This chart underscores a consistent theme throughout the data: Regulated sports betting will not be a matter of "if you build it, they will come." Indiana Survey: If Sports Betting Were Legalized, What Percentage Of Your Sports Betting Activity Would You Move From Your Current Method To Legal, State-Regulated Betting At A Racetrack Or Casino?
Source: Eilers & Krejcik Gaming LLC
Black Market Analysis – Profile Of The U.S. Customer
For a majority of consumers participating in the black market for sports betting in the U.S., betting is a regular activity. The results of our survey imply a weighted average bet frequency exceeding 40 bets per year.
6.426.71
6.827.56
7.567.607.65
7.667.67
7.928.03
8.328.67
0 2 4 6 8 10
Credit Options
Marketing Offers & PromotionsOther
Previous Winning ExperienceWebsite Speed & Performance
Convenient Location
Easy Online AccessSelection of Game Products
ConfidentialityFriendly Customer Service
Legal BookmakerFamiliar, Trustworthy Person
Reliable Payment Systems
0
10
20
30
40
50
60
70
0 3 7 10 14 17 21
24 27
30 33 37 40 43 46 49 52
55 58 61
64
68 71 74 77 80 83
86
89 93 97
100
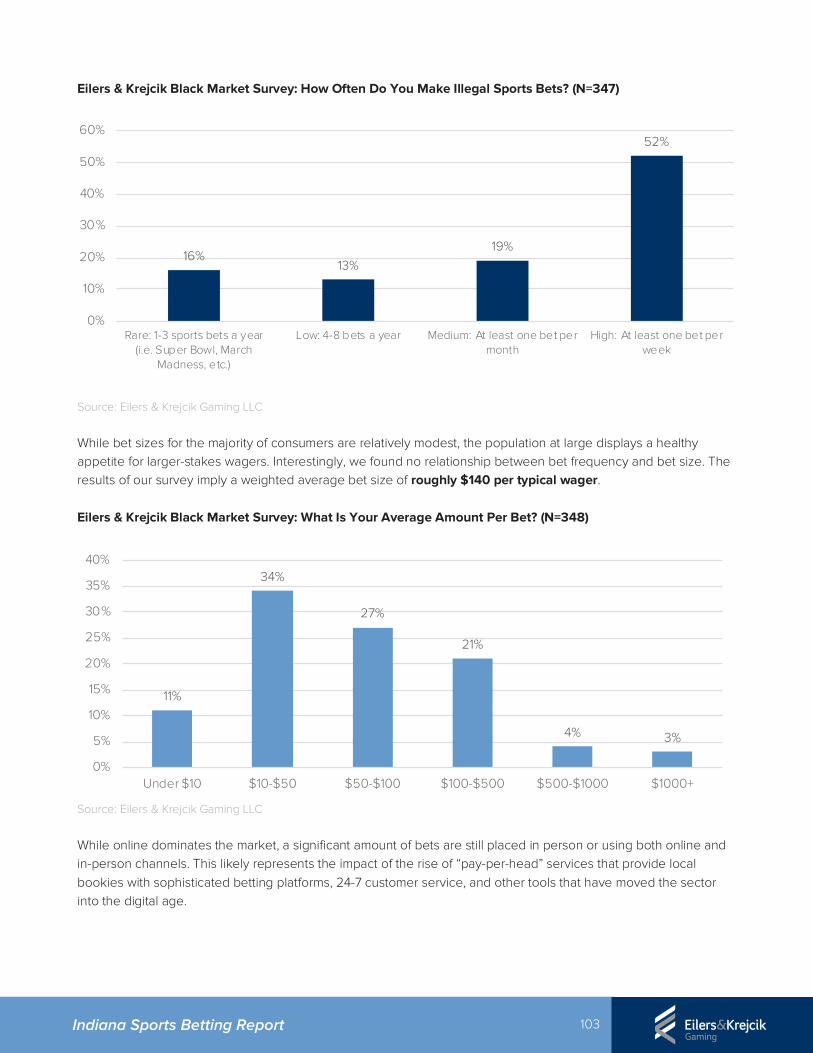
103 Indiana Sports Betting Report
Eilers & Krejcik Black Market Survey: How Often Do You Make Illegal Sports Bets? (N=347)
Source: Eilers & Krejcik Gaming LLC While bet sizes for the majority of consumers are relatively modest, the population at large displays a healthy appetite for larger-stakes wagers. Interestingly, we found no relationship between bet frequency and bet size. The results of our survey imply a weighted average bet size of roughly $140 per typical wager. Eilers & Krejcik Black Market Survey: What Is Your Average Amount Per Bet? (N=348)
Source: Eilers & Krejcik Gaming LLC
While online dominates the market, a significant amount of bets are still placed in person or using both online and in-person channels. This likely represents the impact of the rise of “pay-per-head” services that provide local bookies with sophisticated betting platforms, 24-7 customer service, and other tools that have moved the sector into the digital age.
16%13%
19%
52%
0%
10%
20%
30%
40%
50%
60%
Rare: 1-3 sports bets a year(i.e. Super Bowl, March
Madness, etc.)
Low: 4-8 bets a year Medium: At least one bet permonth
High: At least one bet perweek
11%
34%
27%
21%
4% 3%
0%
5%
10%
15%
20%
25%
30%
35%
40%
Under $10 $10-$50 $50-$100 $100-$500 $500-$1000 $1000+
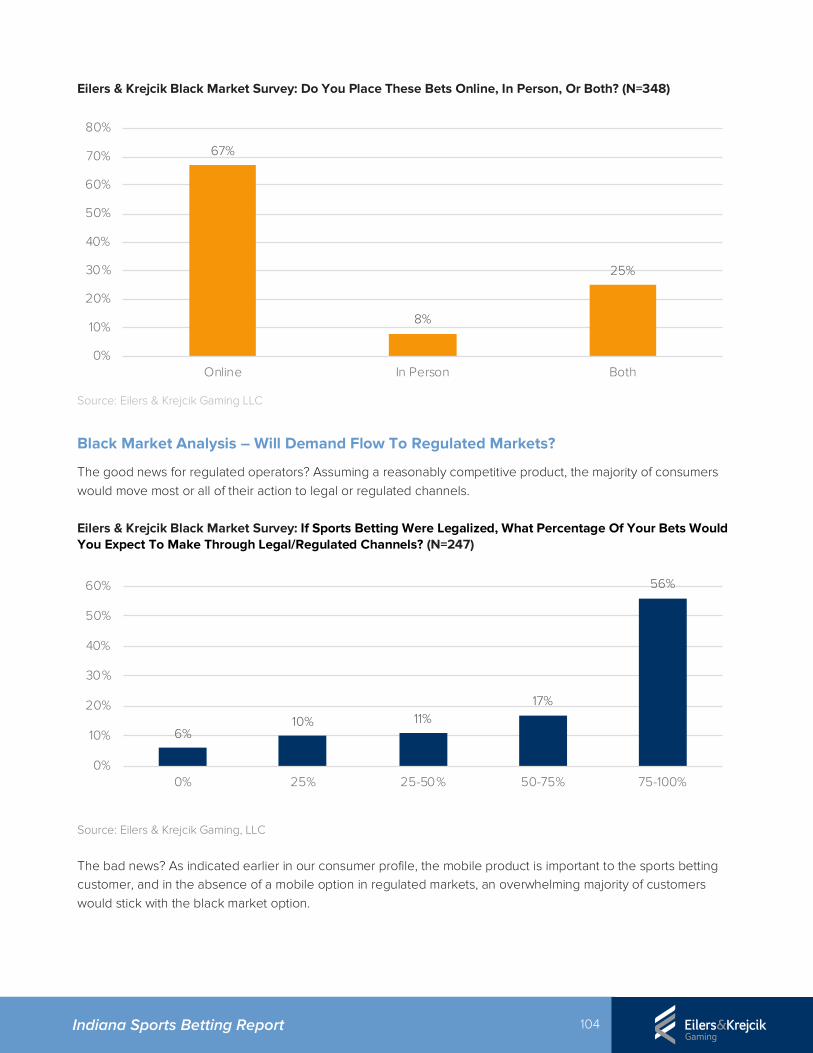
104 Indiana Sports Betting Report
Eilers & Krejcik Black Market Survey: Do You Place These Bets Online, In Person, Or Both? (N=348)
Source: Eilers & Krejcik Gaming LLC
Black Market Analysis – Will Demand Flow To Regulated Markets?
The good news for regulated operators? Assuming a reasonably competitive product, the majority of consumers would move most or all of their action to legal or regulated channels. Eilers & Krejcik Black Market Survey: If Sports Betting Were Legalized, What Percentage Of Your Bets Would You Expect To Make Through Legal/Regulated Channels? (N=247)
Source: Eilers & Krejcik Gaming, LLC
The bad news? As indicated earlier in our consumer profile, the mobile product is important to the sports betting customer, and in the absence of a mobile option in regulated markets, an overwhelming majority of customers would stick with the black market option.
67%
8%
25%
0%
10%
20%
30%
40%
50%
60%
70%
80%
Online In Person Both
6%10% 11%
17%
56%
0%
10%
20%
30%
40%
50%
60%
0% 25% 25-50% 50-75% 75-100%
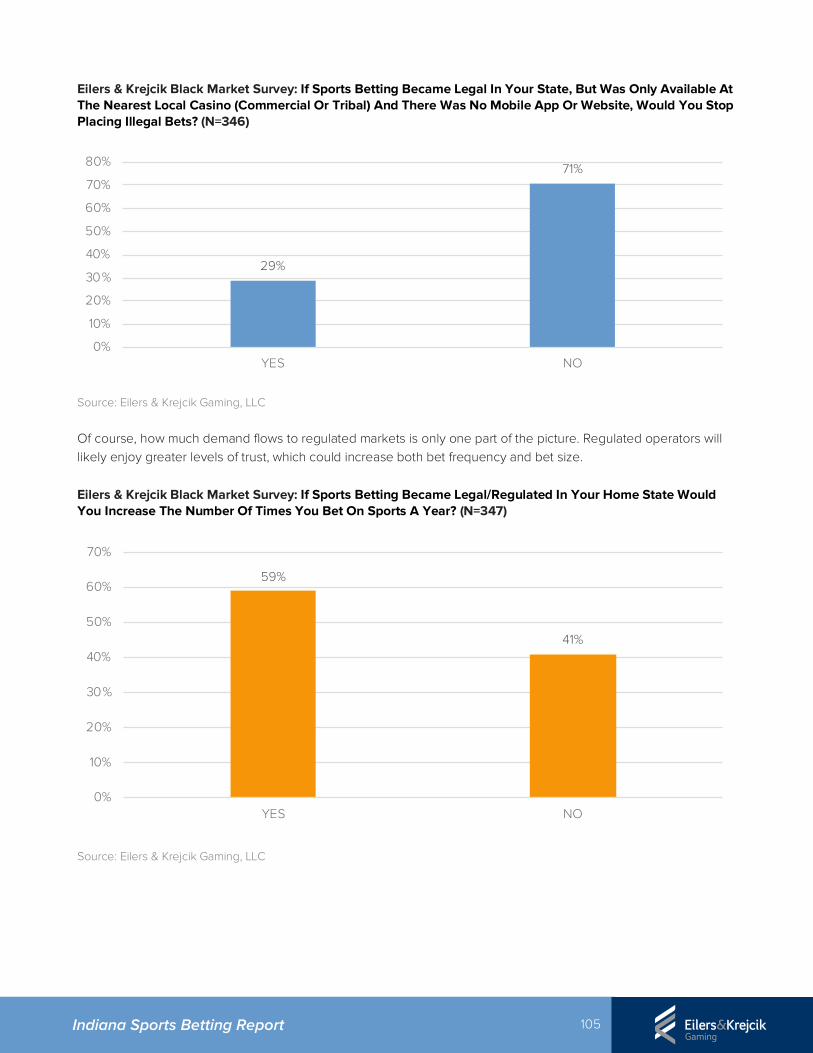
105 Indiana Sports Betting Report
Eilers & Krejcik Black Market Survey: If Sports Betting Became Legal In Your State, But Was Only Available At The Nearest Local Casino (Commercial Or Tribal) And There Was No Mobile App Or Website, Would You Stop Placing Illegal Bets? (N=346)
Source: Eilers & Krejcik Gaming, LLC
Of course, how much demand flows to regulated markets is only one part of the picture. Regulated operators will likely enjoy greater levels of trust, which could increase both bet frequency and bet size. Eilers & Krejcik Black Market Survey: If Sports Betting Became Legal/Regulated In Your Home State Would You Increase The Number Of Times You Bet On Sports A Year? (N=347)
Source: Eilers & Krejcik Gaming, LLC
29%
71%
0%
10%
20%
30%
40%
50%
60%
70%
80%
YES NO
59%
41%
0%
10%
20%
30%
40%
50%
60%
70%
YES NO
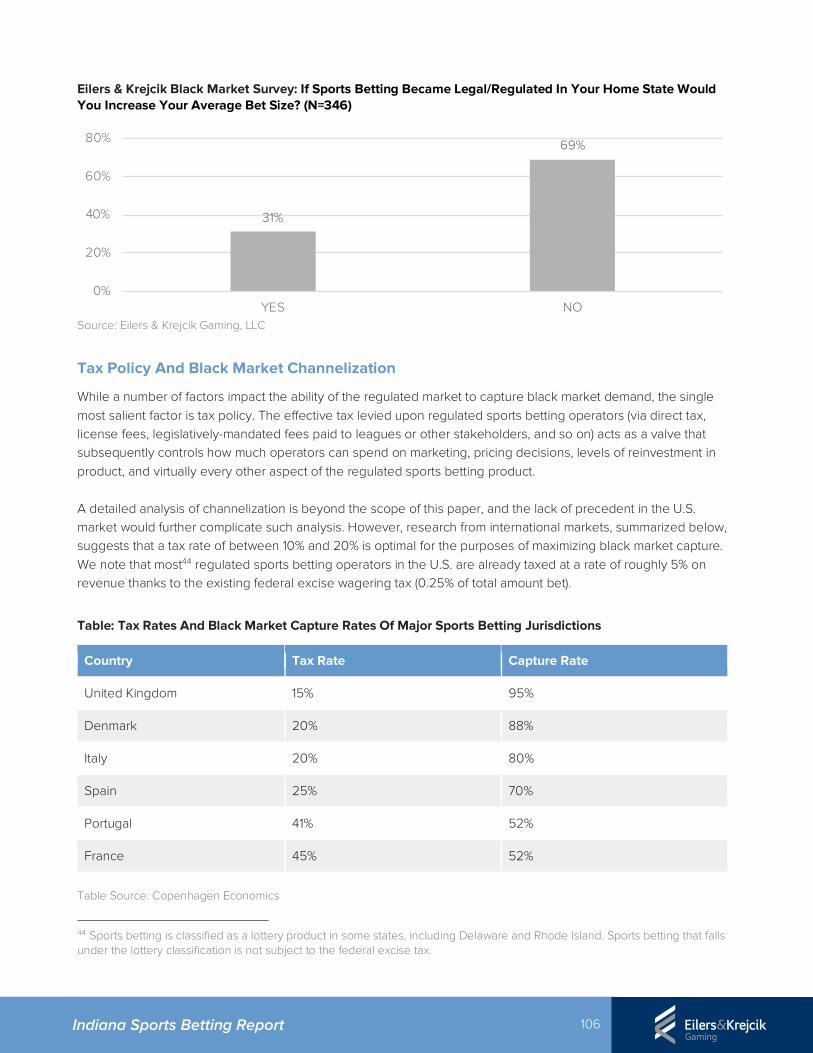
106 Indiana Sports Betting Report
Eilers & Krejcik Black Market Survey: If Sports Betting Became Legal/Regulated In Your Home State Would You Increase Your Average Bet Size? (N=346)
Source: Eilers & Krejcik Gaming, LLC
Tax Policy And Black Market Channelization
While a number of factors impact the ability of the regulated market to capture black market demand, the single most salient factor is tax policy. The effective tax levied upon regulated sports betting operators (via direct tax, license fees, legislatively-mandated fees paid to leagues or other stakeholders, and so on) acts as a valve that subsequently controls how much operators can spend on marketing, pricing decisions, levels of reinvestment in product, and virtually every other aspect of the regulated sports betting product. A detailed analysis of channelization is beyond the scope of this paper, and the lack of precedent in the U.S. market would further complicate such analysis. However, research from international markets, summarized below, suggests that a tax rate of between 10% and 20% is optimal for the purposes of maximizing black market capture. We note that most44 regulated sports betting operators in the U.S. are already taxed at a rate of roughly 5% on revenue thanks to the existing federal excise wagering tax (0.25% of total amount bet).
Table: Tax Rates And Black Market Capture Rates Of Major Sports Betting Jurisdictions
Country Tax Rate Capture Rate
United Kingdom 15% 95%
Denmark 20% 88%
Italy 20% 80%
Spain 25% 70%
Portugal 41% 52%
France 45% 52%
Table Source: Copenhagen Economics
44 Sports betting is classified as a lottery product in some states, including Delaware and Rhode Island. Sports betting that falls under the lottery classification is not subject to the federal excise tax.
31%
69%
0%
20%
40%
60%
80%
YES NO
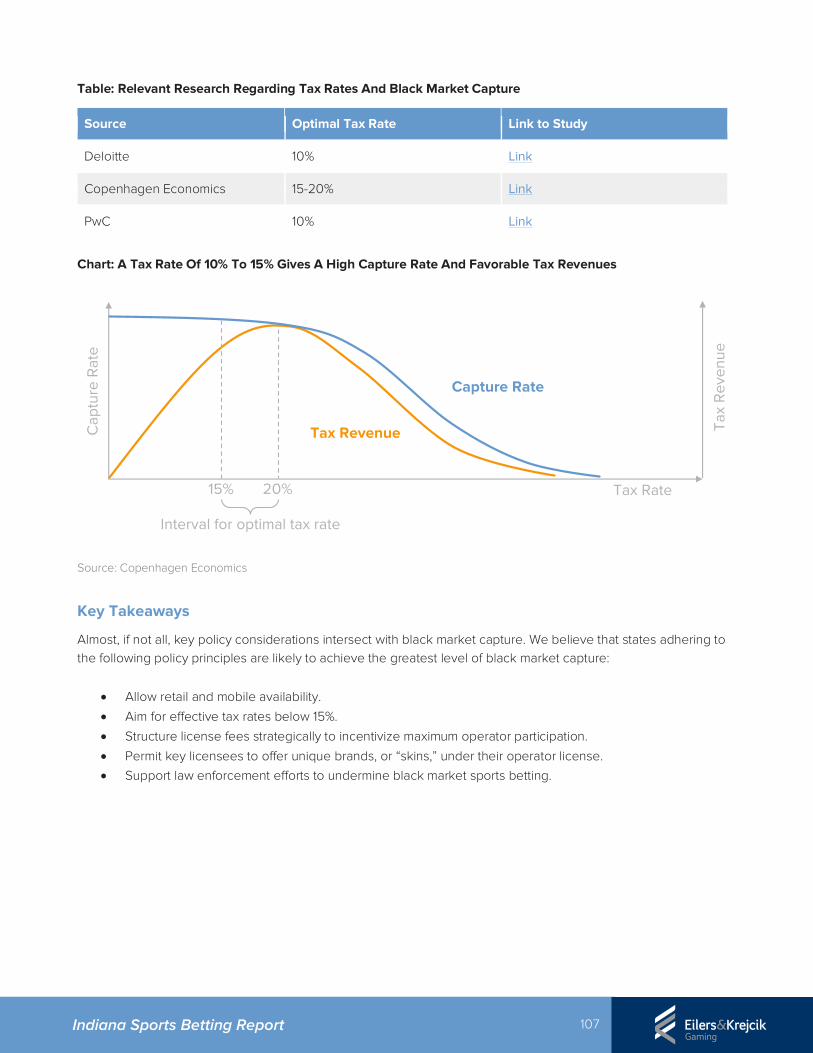
107 Indiana Sports Betting Report
Table: Relevant Research Regarding Tax Rates And Black Market Capture
Source Optimal Tax Rate Link to Study
Deloitte 10% Link
Copenhagen Economics 15-20% Link
PwC 10% Link
Chart: A Tax Rate Of 10% To 15% Gives A High Capture Rate And Favorable Tax Revenues
Source: Copenhagen Economics
Key Takeaways
Almost, if not all, key policy considerations intersect with black market capture. We believe that states adhering to the following policy principles are likely to achieve the greatest level of black market capture:
• Allow retail and mobile availability.
• Aim for effective tax rates below 15%.
• Structure license fees strategically to incentivize maximum operator participation.
• Permit key licensees to offer unique brands, or “skins,” under their operator license. • Support law enforcement efforts to undermine black market sports betting.
Capture Rate
Tax Revenue Tax
Reve
nue
Capt
ure
Rate
15% 20% Tax Rate
Interval for optimal tax rate
108 Indiana Sports Betting Report
The relationship of sports betting to gambling disorders (problem gambling) is mixed. In a 2012 review, there were 67 publicly available problem gambling prevalence studies for U.S. states, and among those studies, 16 found a positive correlation between sports betting behavior and problem gambling.45 Part of the mixed-effects may relate to the availability of treatment, and the effectiveness of responsible gambling programs. Responsible gambling programs refer to policies and operational systems that are designed to help gaming consumers avoid consequences associated with gambling disorders or non-clinical level gambling problems. In general, this means ensuring that players do not spend a harmful amount of time or money gambling, a concept known as “positive play.” Responsible gambling programs are complex, but tactics generally fall into one of the following functional areas:
• Player education programs
• Responding to distressed players
• Managing game designs and risks
• Developing advertising and marketing guidelines
• Venue design and other environmental features
• Self-exclusion programs (voluntary exclusion)
• Employee training
• Program evaluation measures In the following subsection, the core elements of the responsible gambling functional areas are described, and noteworthy elements as related to sports wagering are highlighted. This section concludes with key takeaways for Indiana.
Player Education Programs
Informed decision-making is a core element of responsible gambling programs. Research on positive play suggests that beliefs about gambling greatly influence responsible behaviors. Players should be aware of how games work (including chance and randomness), problem gambling signs, and possible harms associated with problem gambling. Public media campaigns, in-venue advertisements, in-game messages, and on-site information kiosks are all be used to deliver gambling-related information to players.
45 Source: https://www.uleth.ca/dspace/bitstream/handle/10133/3068/2012-PREVALENCE-OPGRC%20(2).pdf?sequence=3
7. IN FOCUS: RESPONSIBLE GAMING
109 Indiana Sports Betting Report
Sports betting considerations: As sports betting has a skill component, some players may have an unrealistic perspective of their ability to win over the long-run. This is known as an illusion of control. Education programs around sports betting should communicate actual risks of play, and how to identify related signs of gambling problems.
Responding To Distressed Players
Assisting players with gambling problems is a part of most responsible gaming programs. It is typically accomplished by identifying people with gambling problems (this may be self-identification) and referring them to help resources. Resources may include a gambling helpline, support groups, counseling, voluntary exclusion, or self-help resources. Identification may be assisted through training venue staff to detect problem gambling signs and intervening with these players. Online, the use of technology can assist in identifying players with gambling problems. Sports betting considerations: The introduction of sports betting should prompt venues consider new signs of distress (e.g. chasing losses from past games), and determine how to respond appropriately. Local support structures (e.g. gambling helpline, counselors, etc.) may need additional resources to accommodate potential increased volume, and to treat gamblers that may have different risk profiles than past patients.
Managing Game Designs And Risks
Games vary in their design and structure. Speed of play, odds of winning, stakes, rule complexity, and the amount of social interaction are all believed to have an impact on potential addictiveness and harm. For example, evidence suggests faster rate games can lead to greater rates of addiction through more frequent reinforcement (i.e. operant conditioning). Sports betting considerations: Some recent innovations in sports wagering are believed to be more risky than past product designs. In-play wagering, contextual betting, and mid-bet cash out options are thought to be higher-risk products than single-game wagers. However, the event frequency is not higher than typical casino games.
Developing Advertising And Marketing Guidelines
Gambling advertisements are often screened in well-established responsible gambling programs. Regulators and operators typically play a joint role in developing guidelines to assess marketing campaigns. These typically include avoiding vulnerable populations (e.g. youth), avoiding normalization and positive framing of gambling, and avoiding the reinforcement of myths in gambling that may distort efforts around informed-decision making. Sports betting considerations: Sports betting advertisements receive considerable attention as a public policy issue in foreign markets such as the UK and Australia. This is due in part to their connection to, or sponsorship of, sport. Indiana should consider when these relationships are appropriate.
Venue Design And Other Environmental Features
The environment where gambling activities take place has an impact gambling related problems and responsible gambling. Accessibility of the venue, opening hours, cash/credit access, and alcohol service are all believed to play a role in outcomes.
110 Indiana Sports Betting Report
Sports betting considerations: While in-venue environmental features will largely be similar to past gaming offerings, consideration should be given to ensure there are adequate community support resources for mobile players that may be in more remote areas.
Self-Exclusion Programs (Voluntary Exclusion)
Self-exclusion programs provide people with gamblers with an option to ban themselves from gambling venues for a predetermined or indefinite duration of time. Self-exclusion is one of the most researched RG practices, with multiple studies in different jurisdictions indicating that the introduction of self-exclusion programs led to reductions in problem gambling accompanied by improvements in well-being, control over gambling, and social and familial functioning. Best practices include providing flexibility to players over the length of term, and removing excluded players from future marketing. Sports betting considerations: Sports bettors that choose to exclude should be offered the ability to exclude from all Indiana gaming venues, including mobile wagering. Marketing should not target excluded players.
Employee Training
Responsible gambling training programs typically focus on frontline employees who interact with customers. Training materials provide educational information on general responsible gambling principles, including concepts related to chance and randomness, information about problem gambling resources, and train employees on facilitating help-seeking behaviors in people with gambling problems. Programs typically include regular refresh training, address conflicts of responsible gambling with other business goals, and are tailored to employees with different levels of responsible gambling experience. Sports betting considerations: A well designed training program should include information specific to sports betting, including the elements of skill and chance in the game. For mobile users that may not be placing wagers in a venue, customer service roles (via chat, email, or phone) should receive tailored training that enables them to respond confidently to inquiries or signs of distress.
Program Evaluation Measures
Decisions around responsible gambling policies and programs should be based on effectiveness and measurable outcomes. Leading regulators and operators typically have a research and evaluation framework that assesses performance over time and makes recommendations for improvement. Sports betting considerations: A noteworthy tool is the Positive Play Scale – an instrument designed to measure responsible gambling behaviors.46 The tool has been tested by the Hoosier Lottery, and could be used to establish a responsible gambling profile of the average sports bettor in Indiana.
External Commentary
A. National Council On Problem Gambling
46 Source: https://www.ncbi.nlm.nih.gov/pmc/articles/PMC5322204/
111 Indiana Sports Betting Report
The National Council on Problem Gambling, a nationwide advocacy group for gamblers, with state affiliates across the country, including the Indiana Council on Problem Gambling, believes the expansion of legalized sports gambling in the United States will increase gaming participation and gambling problems. They have recommended the following steps to policymakers to reduce harm:47
• Ensure that any expansion of sports gambling includes dedicated funds to prevent and treat gambling addiction.
• Require sports betting operators to implement responsible gaming programs which include comprehensive employee training, self-exclusion, ability to set limits on time and money spent betting, specific requirements for the inclusion of help/prevention messages in external marketing, and assign a regulatory agency to enforce them.
• Conduct surveys of the prevalence of gambling addiction prior to expansion and at regular periods thereafter to monitor impacts of legalized sports betting.
• Establish a consistent minimum age for sports gambling and related fantasy games. As part of their overall framework for sports wagering, the National Council for Problem Gambling recommendations that states earmark 1% of gross gaming revenue (not handle) for harm reduction.48 For reference, in 2016 two leading Canadian jurisdictions (British Columbia and Ontario) spent 1.09% and 0.49% of revenue respectively on both treatment programs and responsible gambling programs, while Massachusetts, a leading state in gambling harm reduction, allocates 2% of casino gross gaming revenue to their public health fund, which allocates resources to research, problem gambling, and some on-site responsible gambling services.49 More detailed discussion of state contributions to problem gambling services is set out below.
47 Source: https://www.ncpgambling.org/ncpg-resolution-on-legalization-of-sports-betting/ 48 Source: https://www.ncpgambling.org/responsible-gaming-principles-for-sports-gambling-legislation/ 49 Sources: https://www.responsiblegambling.org/about-rgc/what's-new-at-rgc/what's-new-item/2017/05/26/cprg-online-digest-updated-with-2015-2016-data; Eilers & Krejcik LLC.
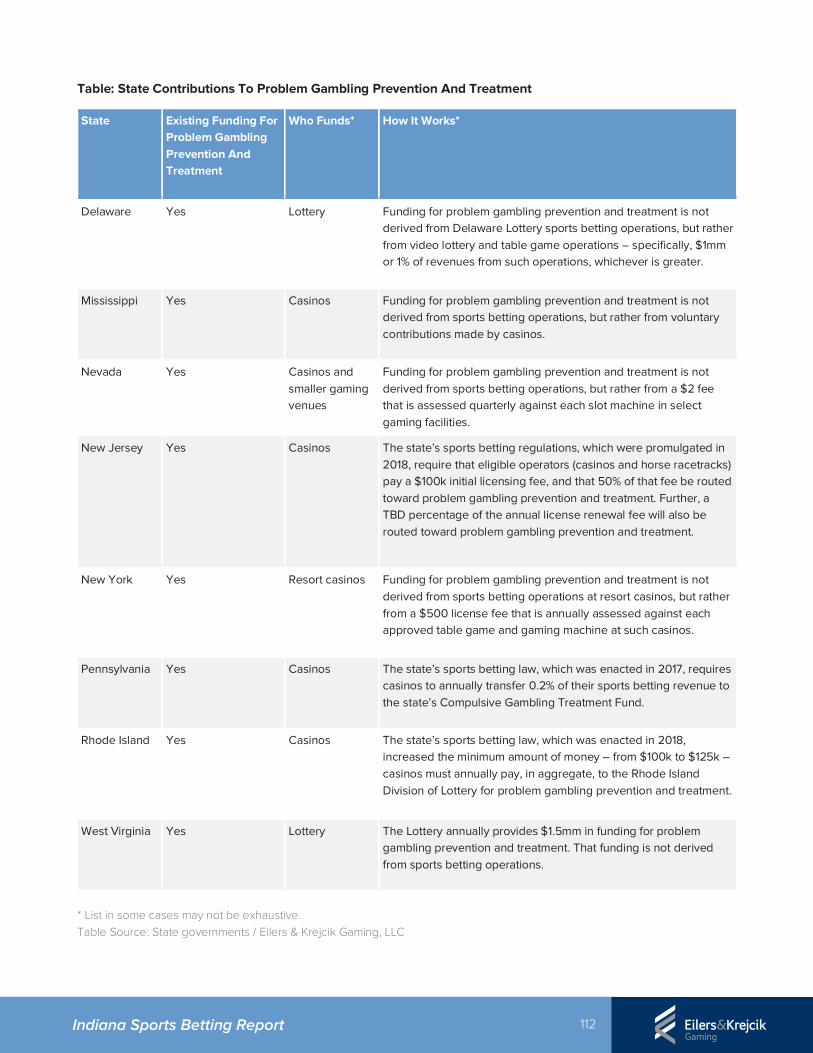
112 Indiana Sports Betting Report
Table: State Contributions To Problem Gambling Prevention And Treatment
State Existing Funding For Problem Gambling Prevention And Treatment
Who Funds* How It Works*
Delaware Yes Lottery Funding for problem gambling prevention and treatment is not derived from Delaware Lottery sports betting operations, but rather from video lottery and table game operations – specifically, $1mm or 1% of revenues from such operations, whichever is greater.
Mississippi Yes Casinos Funding for problem gambling prevention and treatment is not derived from sports betting operations, but rather from voluntary contributions made by casinos.
Nevada Yes Casinos and smaller gaming venues
Funding for problem gambling prevention and treatment is not derived from sports betting operations, but rather from a $2 fee that is assessed quarterly against each slot machine in select gaming facilities.
New Jersey Yes Casinos The state’s sports betting regulations, which were promulgated in 2018, require that eligible operators (casinos and horse racetracks) pay a $100k initial licensing fee, and that 50% of that fee be routed toward problem gambling prevention and treatment. Further, a TBD percentage of the annual license renewal fee will also be routed toward problem gambling prevention and treatment.
New York Yes Resort casinos Funding for problem gambling prevention and treatment is not derived from sports betting operations at resort casinos, but rather from a $500 license fee that is annually assessed against each approved table game and gaming machine at such casinos.
Pennsylvania Yes Casinos The state’s sports betting law, which was enacted in 2017, requires casinos to annually transfer 0.2% of their sports betting revenue to the state’s Compulsive Gambling Treatment Fund.
Rhode Island Yes Casinos The state’s sports betting law, which was enacted in 2018, increased the minimum amount of money – from $100k to $125k – casinos must annually pay, in aggregate, to the Rhode Island Division of Lottery for problem gambling prevention and treatment.
West Virginia Yes Lottery The Lottery annually provides $1.5mm in funding for problem gambling prevention and treatment. That funding is not derived from sports betting operations.
* List in some cases may not be exhaustive. Table Source: State governments / Eilers & Krejcik Gaming, LLC
113 Indiana Sports Betting Report
B. American Gaming Association
The American Gaming Association (AGA) is a national trade organization. Some Indiana operators are members of the association. The AGA developed a responsible gambling code of conduct, with several areas specifically identifying sports wagering policies:50
• Each AGA casino and sports betting company will have a policy in effect for all of its casino properties providing opportunities for patrons to request in writing the revocation of their privileges for specific services such as:
o Casino-issued markers;
o Player club/card privileges;
o On-site check-cashing;
o Complimentaries; and
o Gambling promotions
• AGA member companies will make diligent efforts to prevent underage individuals from participating in any gambling or sports betting at casinos, loitering in the gaming area of a casino or from gaining access to online, mobile or in-room gambling opportunities.
• AGA member companies will communicate the legal age to gamble through messaging, as appropriate, in their properties, on their casinos’ online platforms and in gambling and sports betting promotions.
• Casino gambling including sports betting advertising and marketing will:
o Contain a responsible gaming message and/or a toll-free help line number where practical.
o Reflect generally accepted contemporary standards of good taste.
o Strictly comply with all state and federal standards to make no false or misleading claims or create a suggestion that the probabilities of winning or losing at the various games offered by the casino, or by betting on sports contests, are different than those actually experienced.
• Casino gambling including sports betting advertising and marketing will not:
o Contain images, symbols, celebrity/entertainer endorsements and/or language designed to appeal specifically to children and minors.
o Feature anyone who is or appears to be below the legal age to participate in gambling or sports betting activity or imply that underage persons engage in casino gambling or sports betting.
o Depart from contemporary standards of good taste that apply to all commercial messaging, as suits the context of the message or the medium utilized.
o Be placed with such intensity and frequency that they represent saturation of that medium or become excessive.
o Contain claims or representations that gambling activity will guarantee an individual’s social, financial or personal success.
o Be placed before any audience where most of the audience is ordinarily expected to be below the legal age to participate in gambling or sports betting activity.
o Imply or suggest any illegal activity of any kind. 50 Source: https://www.americangaming.org/sites/default/files/AGA%20Code%20of%20Conduct%20for%20Responsible%20Gaming%202018.pdf
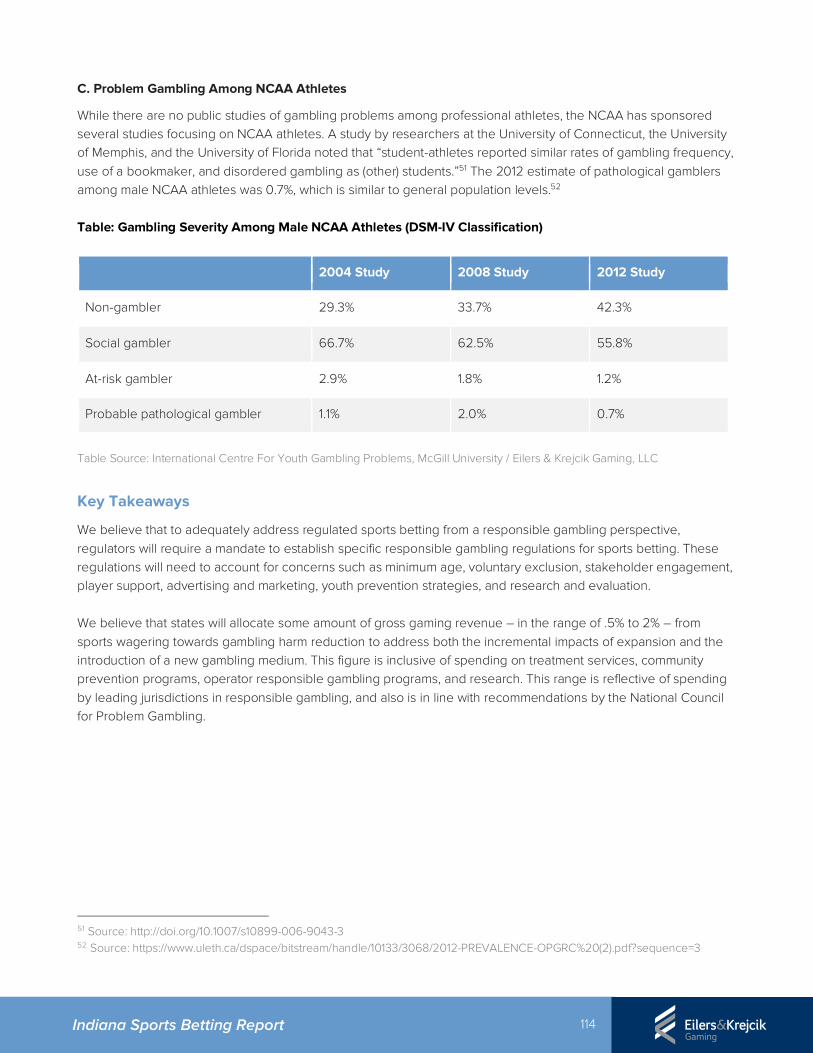
114 Indiana Sports Betting Report
C. Problem Gambling Among NCAA Athletes
While there are no public studies of gambling problems among professional athletes, the NCAA has sponsored several studies focusing on NCAA athletes. A study by researchers at the University of Connecticut, the University of Memphis, and the University of Florida noted that “student-athletes reported similar rates of gambling frequency, use of a bookmaker, and disordered gambling as (other) students.”51 The 2012 estimate of pathological gamblers among male NCAA athletes was 0.7%, which is similar to general population levels.52 Table: Gambling Severity Among Male NCAA Athletes (DSM-IV Classification)
2004 Study 2008 Study 2012 Study
Non-gambler 29.3% 33.7% 42.3%
Social gambler 66.7% 62.5% 55.8%
At-risk gambler 2.9% 1.8% 1.2%
Probable pathological gambler 1.1% 2.0% 0.7%
Table Source: International Centre For Youth Gambling Problems, McGill University / Eilers & Krejcik Gaming, LLC
Key Takeaways
We believe that to adequately address regulated sports betting from a responsible gambling perspective, regulators will require a mandate to establish specific responsible gambling regulations for sports betting. These regulations will need to account for concerns such as minimum age, voluntary exclusion, stakeholder engagement, player support, advertising and marketing, youth prevention strategies, and research and evaluation. We believe that states will allocate some amount of gross gaming revenue – in the range of .5% to 2% – from sports wagering towards gambling harm reduction to address both the incremental impacts of expansion and the introduction of a new gambling medium. This figure is inclusive of spending on treatment services, community prevention programs, operator responsible gambling programs, and research. This range is reflective of spending by leading jurisdictions in responsible gambling, and also is in line with recommendations by the National Council for Problem Gambling.
51 Source: http://doi.org/10.1007/s10899-006-9043-3 52 Source: https://www.uleth.ca/dspace/bitstream/handle/10133/3068/2012-PREVALENCE-OPGRC%20(2).pdf?sequence=3
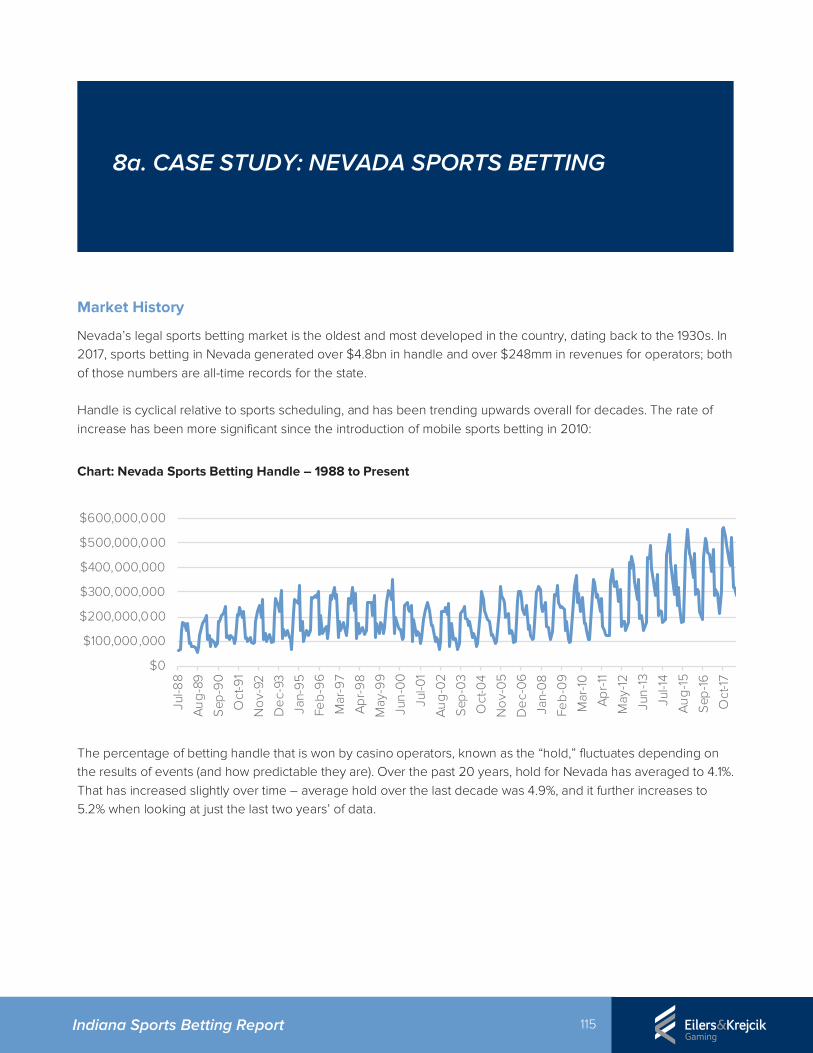
115 Indiana Sports Betting Report
Market History
Nevada’s legal sports betting market is the oldest and most developed in the country, dating back to the 1930s. In 2017, sports betting in Nevada generated over $4.8bn in handle and over $248mm in revenues for operators; both of those numbers are all-time records for the state.
Handle is cyclical relative to sports scheduling, and has been trending upwards overall for decades. The rate of increase has been more significant since the introduction of mobile sports betting in 2010:
Chart: Nevada Sports Betting Handle – 1988 to Present
The percentage of betting handle that is won by casino operators, known as the “hold,” fluctuates depending on the results of events (and how predictable they are). Over the past 20 years, hold for Nevada has averaged to 4.1%. That has increased slightly over time – average hold over the last decade was 4.9%, and it further increases to 5.2% when looking at just the last two years’ of data.
$0
$100,000,000
$200,000,000
$300,000,000
$400,000,000
$500,000,000
$600,000,000
Jul-8
8
Au
g-8
9
Sep
-90
Oct
-91
No
v-92
De
c-93
Jan-
95
Feb
-96
Mar
-97
Ap
r-9
8
May
-99
Jun
-00
Jul-0
1
Au
g-0
2
Sep
-03
Oct
-04
No
v-0
5
De
c-0
6
Jan-
08
Feb
-09
Mar
-10
Ap
r-11
May
-12
Jun
-13
Jul-1
4
Au
g-1
5
Sep
-16
Oct
-17
8a. CASE STUDY: NEVADA SPORTS BETTING
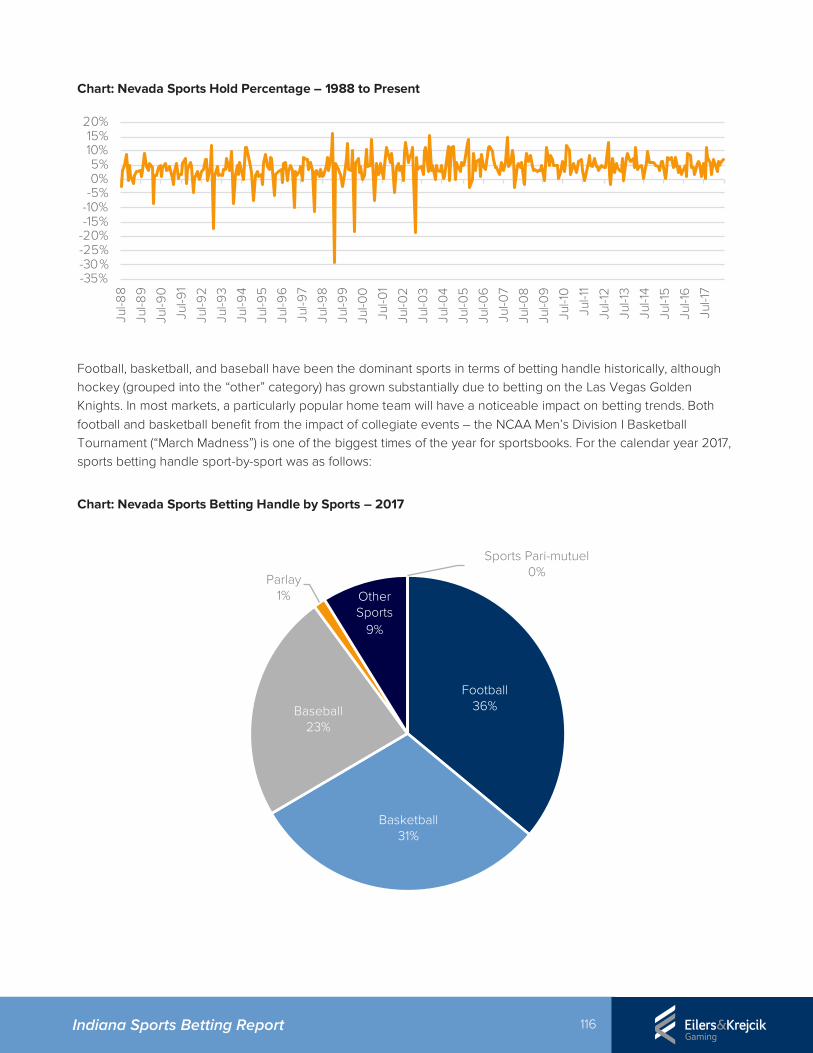
116 Indiana Sports Betting Report
Chart: Nevada Sports Hold Percentage – 1988 to Present
Football, basketball, and baseball have been the dominant sports in terms of betting handle historically, although hockey (grouped into the “other” category) has grown substantially due to betting on the Las Vegas Golden Knights. In most markets, a particularly popular home team will have a noticeable impact on betting trends. Both football and basketball benefit from the impact of collegiate events – the NCAA Men’s Division I Basketball Tournament (“March Madness”) is one of the biggest times of the year for sportsbooks. For the calendar year 2017, sports betting handle sport-by-sport was as follows:
Chart: Nevada Sports Betting Handle by Sports – 2017
-35%-30%-25%-20%-15%-10%-5%0%5%
10%15%
20%Ju
l-88
Jul-8
9
Jul-9
0
Jul-9
1
Jul-9
2
Jul-9
3
Jul-9
4
Jul-9
5
Jul-9
6
Jul-9
7
Jul-9
8
Jul-9
9
Jul-0
0
Jul-0
1
Jul-0
2
Jul-0
3
Jul-0
4
Jul-0
5
Jul-0
6
Jul-0
7
Jul-0
8
Jul-0
9
Jul-1
0
Jul-1
1
Jul-1
2
Jul-1
3
Jul-1
4
Jul-1
5
Jul-1
6
Jul-1
7Football
36%
Basketball31%
Baseball23%
Parlay1% Other
Sports9%
Sports Pari-mutuel0%
117 Indiana Sports Betting Report
Key Development Timeline
1931 - Nevada legalizes gambling. 1952 - A 10% tax on sports betting is imposed by Congress, and a majority of Nevada’s race / sports betting clubs close. 1974 - The tax is reduced to 2%. 1975 - The first casino sportsbook opens at the Union Plaza. 1983 - The tax on sports betting is further reduced to 0.25%. 1986 - The Las Vegas Hilton opens its Superbook, the first large sportsbook. 2002 - First self-service sports betting kiosk by American Wagering is approved. It goes live at Leroy’s Horse & Sports Place. 2010 - First mobile sports betting application, LEROY’S APP by American Wagering, is approved. 2012 - UK bookmaker William Hill, which purchased American Wagering in 2011, is approved for a gaming license. Today, William Hill controls over 100 betting shops and kiosks in Nevada, over half of all locations in the state. 2015 - Nevada approves wagering on the Olympics, allowing for an exception on a long-held policy banning wagers on non-collegiate amateur sporting events. 2016 - Nevada approves first betting on an esports competition. 2017 - Nevada approves wagering on professional sports league drafts.
Major Stakeholders
Commercial casinos - Most large commercial casinos, and many smaller ones, operate sportsbooks or sports betting kiosks throughout the state. The largest casino companies in Nevada include Caesars Entertainment, MGM Resorts, Boyd Gaming, Station Casinos, Las Vegas Sands, and Wynn Resorts. Sportsbook operators - Companies including William Hill and CG Technology (formerly Cantor Gaming) run sportsbooks and kiosks on behalf of casinos throughout the state. These specialists will likely be players emerging markets. Platform providers - Casinos that do not outsource the majority of their sportsbook operations to operators like William Hill, which provides its own technology solutions, use third-party platform providers to provide software instead. Companies like IGT provide both retail and mobile solutions, while companies like Miomni and Stadium Tech focus on mobile betting platforms. State of Nevada - The Nevada Gaming Control Board and Nevada Gaming Commission deal with licensing and regulating sports betting and the gaming industry. The state itself taxes sports betting at an effective tax rate of 6.75% of gross gaming revenue.
Projections
Nevada sports betting revenue for 2017 came in at $248.8mm against our projection of $247mm. We are projecting $279mm for 2018. We expect recent growth in Nevada’s sports betting market to continue in the near-term, with a number of independent factors supporting meaningful growth through 2023. We believe that regulation of sports betting in other states will not suppress growth in Nevada and that Nevada’s growth will proceed on a trajectory distinct from other states.
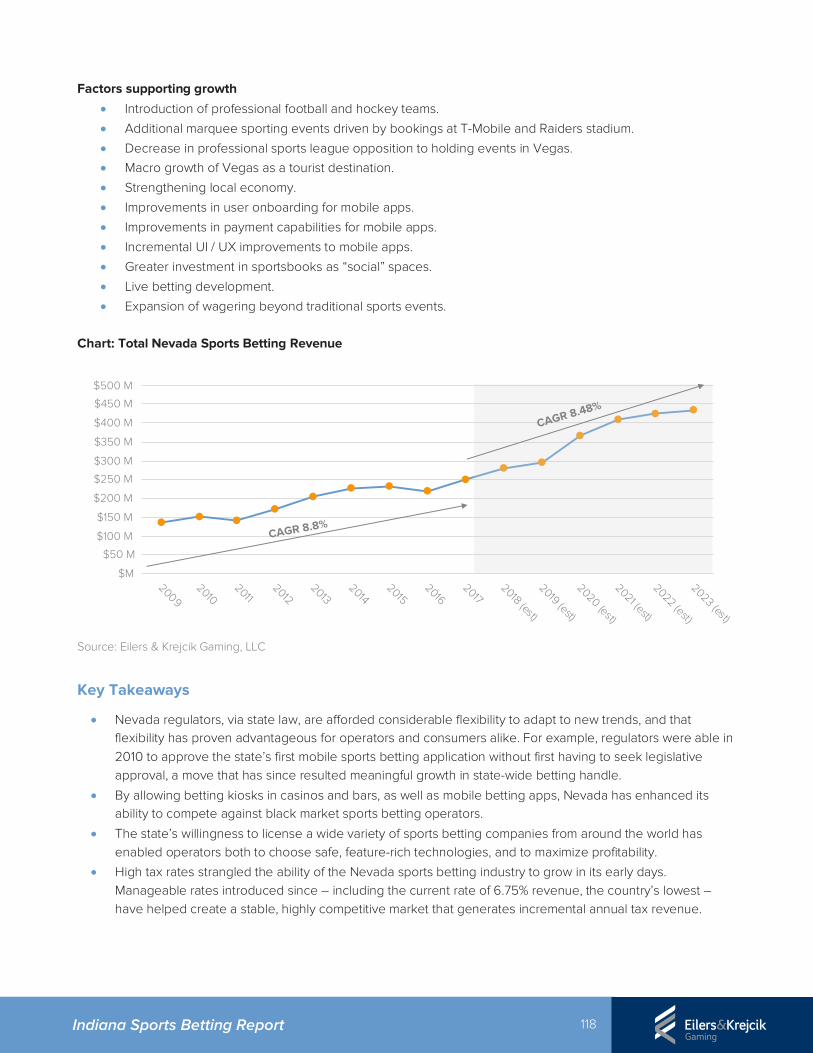
118 Indiana Sports Betting Report
Factors supporting growth
• Introduction of professional football and hockey teams.
• Additional marquee sporting events driven by bookings at T-Mobile and Raiders stadium.
• Decrease in professional sports league opposition to holding events in Vegas.• Macro growth of Vegas as a tourist destination.
• Strengthening local economy.
• Improvements in user onboarding for mobile apps.
• Improvements in payment capabilities for mobile apps.
• Incremental UI / UX improvements to mobile apps.
• Greater investment in sportsbooks as “social” spaces.
• Live betting development.
• Expansion of wagering beyond traditional sports events.
Chart: Total Nevada Sports Betting Revenue
Source: Eilers & Krejcik Gaming, LLC
Key Takeaways
• Nevada regulators, via state law, are afforded considerable flexibility to adapt to new trends, and thatflexibility has proven advantageous for operators and consumers alike. For example, regulators were able in2010 to approve the state’s first mobile sports betting application without first having to seek legislativeapproval, a move that has since resulted meaningful growth in state-wide betting handle.
• By allowing betting kiosks in casinos and bars, as well as mobile betting apps, Nevada has enhanced itsability to compete against black market sports betting operators.
• The state’s willingness to license a wide variety of sports betting companies from around the world hasenabled operators both to choose safe, feature-rich technologies, and to maximize profitability.
• High tax rates strangled the ability of the Nevada sports betting industry to grow in its early days.Manageable rates introduced since – including the current rate of 6.75% revenue, the country’s lowest –have helped create a stable, highly competitive market that generates incremental annual tax revenue.
$M
$50 M
$100 M
$150 M
$200 M
$250 M
$300 M
$350 M
$400 M
$450 M
$500 M
20092010
20112012
20132014
20152016
20172018 (est)
2019 (est)
2020 (est)
2021 (est)
2022 (est)
2023 (est)
CAGR 8.8%
CAGR 8.48%
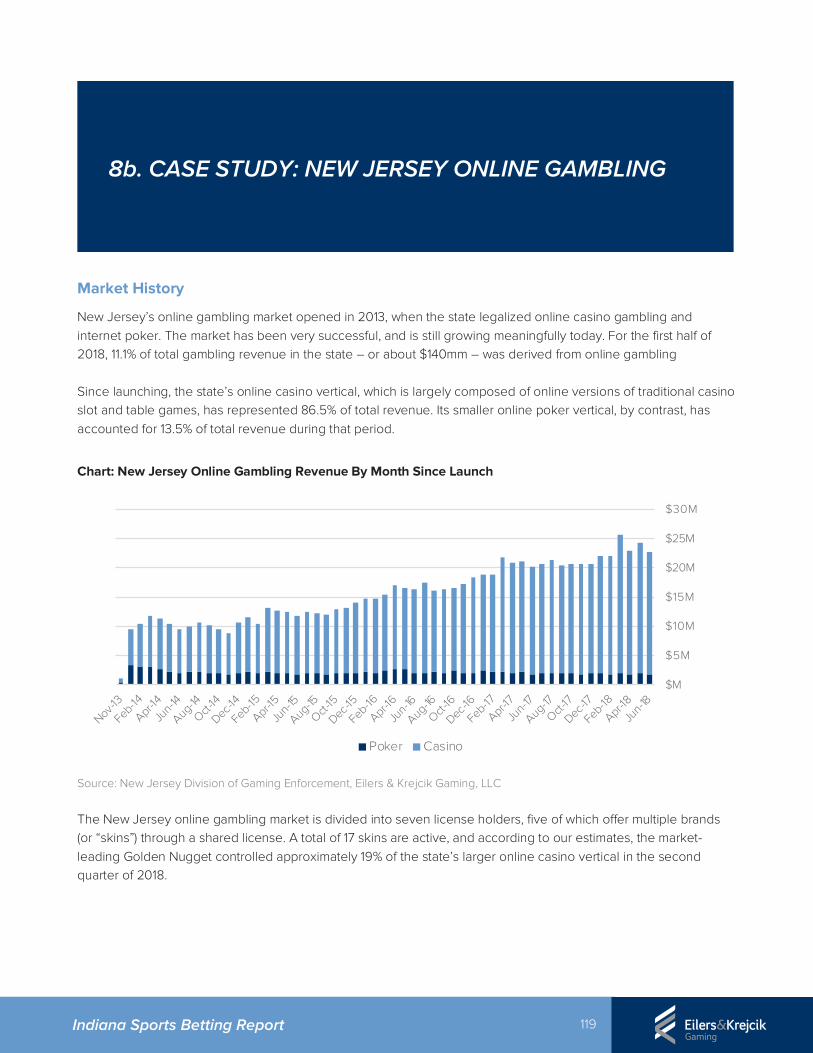
119 Indiana Sports Betting Report
Market History
New Jersey’s online gambling market opened in 2013, when the state legalized online casino gambling and internet poker. The market has been very successful, and is still growing meaningfully today. For the first half of 2018, 11.1% of total gambling revenue in the state – or about $140mm – was derived from online gambling
Since launching, the state’s online casino vertical, which is largely composed of online versions of traditional casino slot and table games, has represented 86.5% of total revenue. Its smaller online poker vertical, by contrast, has accounted for 13.5% of total revenue during that period.
Chart: New Jersey Online Gambling Revenue By Month Since Launch
Source: New Jersey Division of Gaming Enforcement, Eilers & Krejcik Gaming, LLC
The New Jersey online gambling market is divided into seven license holders, five of which offer multiple brands (or “skins”) through a shared license. A total of 17 skins are active, and according to our estimates, the market-leading Golden Nugget controlled approximately 19% of the state’s larger online casino vertical in the second quarter of 2018.
$M
$5M
$10M
$15M
$20M
$25M
$30M
Jun-18
Apr-18
Feb-18
Dec-17
Oct-17
Aug-17
Jun-17
Apr-17
Feb-17
Dec-16
Oct-16
Aug-16
Jun-16
Apr-16
Feb-16
Dec-15
Oct-15
Aug-15
Jun-15
Apr-15
Feb-15
Dec-14
Oct-14
Aug-14
Jun-14
Apr-14
Feb-14
Nov-13
Poker Casino
8b. CASE STUDY: NEW JERSEY ONLINE GAMBLING
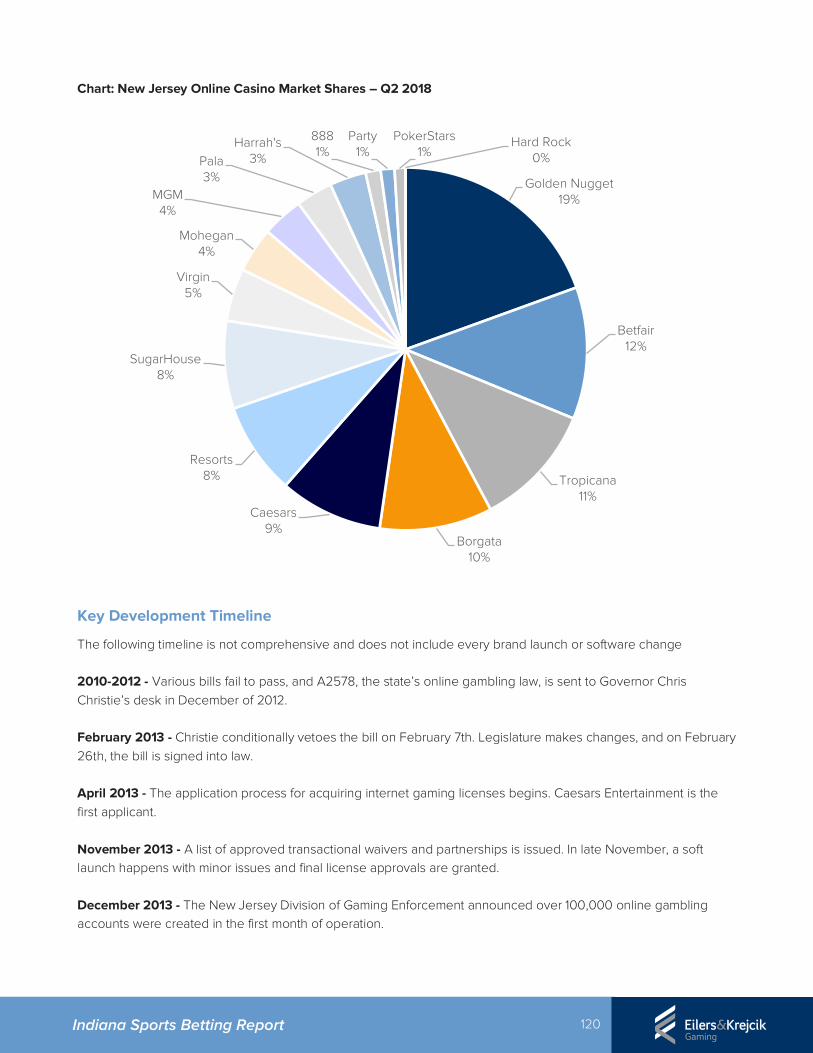
120 Indiana Sports Betting Report
Chart: New Jersey Online Casino Market Shares – Q2 2018
Key Development Timeline
The following timeline is not comprehensive and does not include every brand launch or software change
2010-2012 - Various bills fail to pass, and A2578, the state’s online gambling law, is sent to Governor Chris Christie’s desk in December of 2012.
February 2013 - Christie conditionally vetoes the bill on February 7th. Legislature makes changes, and on February 26th, the bill is signed into law.
April 2013 - The application process for acquiring internet gaming licenses begins. Caesars Entertainment is the first applicant.
November 2013 - A list of approved transactional waivers and partnerships is issued. In late November, a soft launch happens with minor issues and final license approvals are granted.
December 2013 - The New Jersey Division of Gaming Enforcement announced over 100,000 online gambling accounts were created in the first month of operation.
Golden Nugget19%
Betfair12%
Tropicana11%
Borgata10%
Caesars9%
Resorts8%
SugarHouse8%
Virgin5%
Mohegan4%
MGM4%
Pala3%
Harrah's3%
8881%
Party1%
PokerStars1%
Hard Rock0%
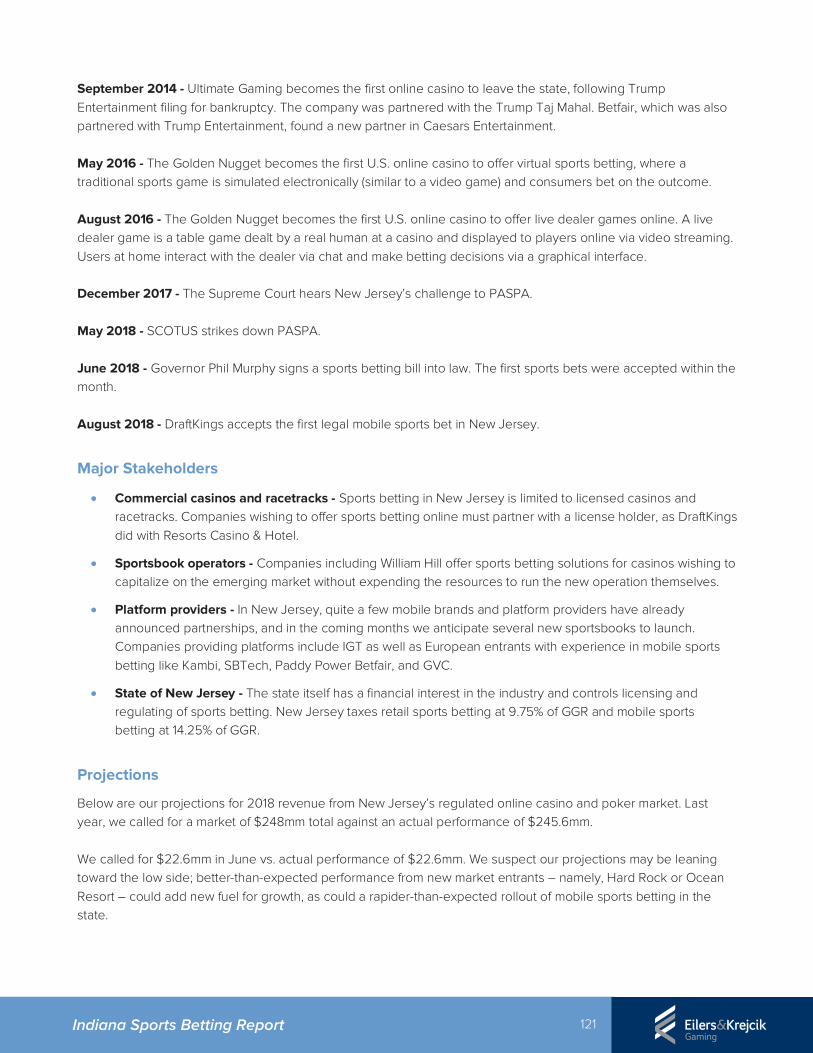
121 Indiana Sports Betting Report
September 2014 - Ultimate Gaming becomes the first online casino to leave the state, following Trump Entertainment filing for bankruptcy. The company was partnered with the Trump Taj Mahal. Betfair, which was also partnered with Trump Entertainment, found a new partner in Caesars Entertainment.
May 2016 - The Golden Nugget becomes the first U.S. online casino to offer virtual sports betting, where a traditional sports game is simulated electronically (similar to a video game) and consumers bet on the outcome.
August 2016 - The Golden Nugget becomes the first U.S. online casino to offer live dealer games online. A live dealer game is a table game dealt by a real human at a casino and displayed to players online via video streaming. Users at home interact with the dealer via chat and make betting decisions via a graphical interface.
December 2017 - The Supreme Court hears New Jersey’s challenge to PASPA.
May 2018 - SCOTUS strikes down PASPA.
June 2018 - Governor Phil Murphy signs a sports betting bill into law. The first sports bets were accepted within the month.
August 2018 - DraftKings accepts the first legal mobile sports bet in New Jersey.
Major Stakeholders
• Commercial casinos and racetracks - Sports betting in New Jersey is limited to licensed casinos andracetracks. Companies wishing to offer sports betting online must partner with a license holder, as DraftKingsdid with Resorts Casino & Hotel.
• Sportsbook operators - Companies including William Hill offer sports betting solutions for casinos wishing tocapitalize on the emerging market without expending the resources to run the new operation themselves.
• Platform providers - In New Jersey, quite a few mobile brands and platform providers have alreadyannounced partnerships, and in the coming months we anticipate several new sportsbooks to launch.Companies providing platforms include IGT as well as European entrants with experience in mobile sportsbetting like Kambi, SBTech, Paddy Power Betfair, and GVC.
• State of New Jersey - The state itself has a financial interest in the industry and controls licensing andregulating of sports betting. New Jersey taxes retail sports betting at 9.75% of GGR and mobile sportsbetting at 14.25% of GGR.
Projections
Below are our projections for 2018 revenue from New Jersey’s regulated online casino and poker market. Last year, we called for a market of $248mm total against an actual performance of $245.6mm.
We called for $22.6mm in June vs. actual performance of $22.6mm. We suspect our projections may be leaning toward the low side; better-than-expected performance from new market entrants – namely, Hard Rock or Ocean Resort – could add new fuel for growth, as could a rapider-than-expected rollout of mobile sports betting in the state.
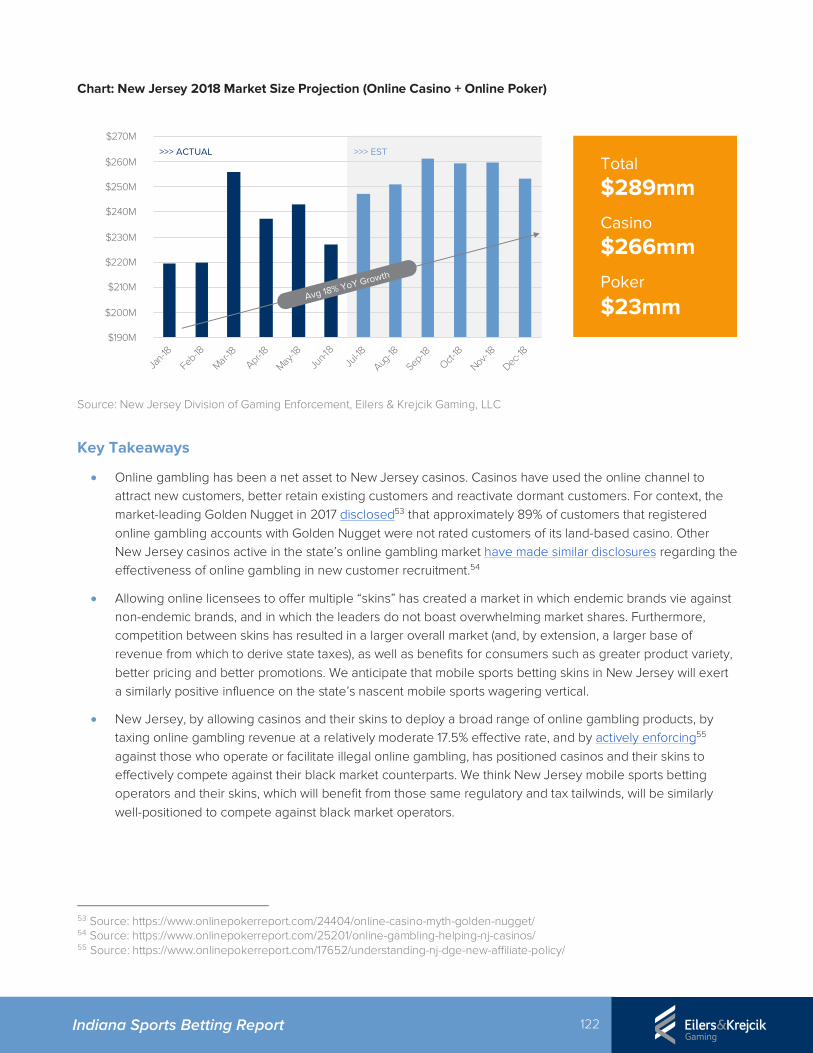
122 Indiana Sports Betting Report
Chart: New Jersey 2018 Market Size Projection (Online Casino + Online Poker)
Source: New Jersey Division of Gaming Enforcement, Eilers & Krejcik Gaming, LLC
Key Takeaways
• Online gambling has been a net asset to New Jersey casinos. Casinos have used the online channel toattract new customers, better retain existing customers and reactivate dormant customers. For context, themarket-leading Golden Nugget in 2017 disclosed53 that approximately 89% of customers that registeredonline gambling accounts with Golden Nugget were not rated customers of its land-based casino. OtherNew Jersey casinos active in the state’s online gambling market have made similar disclosures regarding theeffectiveness of online gambling in new customer recruitment.54
• Allowing online licensees to offer multiple “skins” has created a market in which endemic brands vie againstnon-endemic brands, and in which the leaders do not boast overwhelming market shares. Furthermore,competition between skins has resulted in a larger overall market (and, by extension, a larger base ofrevenue from which to derive state taxes), as well as benefits for consumers such as greater product variety,better pricing and better promotions. We anticipate that mobile sports betting skins in New Jersey will exerta similarly positive influence on the state’s nascent mobile sports wagering vertical.
• New Jersey, by allowing casinos and their skins to deploy a broad range of online gambling products, bytaxing online gambling revenue at a relatively moderate 17.5% effective rate, and by actively enforcing55
against those who operate or facilitate illegal online gambling, has positioned casinos and their skins toeffectively compete against their black market counterparts. We think New Jersey mobile sports bettingoperators and their skins, which will benefit from those same regulatory and tax tailwinds, will be similarlywell-positioned to compete against black market operators.
53 Source: https://www.onlinepokerreport.com/24404/online-casino-myth-golden-nugget/ 54 Source: https://www.onlinepokerreport.com/25201/online-gambling-helping-nj-casinos/ 55 Source: https://www.onlinepokerreport.com/17652/understanding-nj-dge-new-affiliate-policy/
$190M
$200M
$210M
$220M
$230M
$240M
$250M
$260M
$270M
Jan-18
Feb-18
Mar-18
Apr-18
May-18 Jun
-18Jul-18
Aug-18
Sep-18
Oct-18
Nov-18
Dec-18
>>> EST
Avg 18% YoY Growth
>>> ACTUALTotal$289mmCasino$266mmPoker$23mm
123 Indiana Sports Betting Report
Background
The state of Indiana operates a large and well-regulated charitable gaming industry. According to the Indiana Gaming Commission’s Charity Gaming Division’s Fiscal Year 2017 Annual Report, charitable gaming within the state generated totals of $413.8mm in gross receipts and $66.9mm in net proceeds devoted to charitable causes.56 Hundreds of local organizations are licensed and regulated by the IGC. They are authorized to offer a wide variety of charitable games including bingo, raffles, door prizes, pull-tabs, punchboards, tip boards, festival events and game nights. Naturally, the Gaming Commission and Indiana state government will be concerned about any adverse impacts on charitable gaming following the potential introduction of regulated sports betting. Beyond charitable gaming it is also important to understand the impacts that sports betting may have on the gambling spend for state lottery and casinos.
Impacts On Other Forms Of Gambling
It is difficult to quantify the impact of regulated sports betting on other legal forms of gambling as prior to the repeal of PASPA in May 2018, only one U.S. state, Nevada, was legally permitted to authorize single wager sports betting. There is little reliable data documented in Nevada with which to analyze the impacts of sports betting and comparisons and Nevada’s unique situation as a state with a relatively small resident population and a large gaming tourism economy complicate relevant comparisons.
One salient consideration that must be remembered is that a high volume of illegal sports wagering has been taking place historically for many years in the U.S. The American Gaming Association conservatively estimates that black market sports betting constituted a $150bn industry under PASPA and that $52bn was spent on NFL and NCAA football alone during the past season.57 With this scale of expenditure taking place annually much of the potential revenue impact of sports betting is already baked into the current gambling share of wallet. Indeed, one of the major challenges for regulated sports betting will be effectively shifting these black market sports wagers to legal channels.
56 Source: Indiana Gaming Commission, Charity Gaming Division, Fiscal Year 2017 Annual Report, https://www.in.gov/igc/files/Annual-Report_2017.pdf. 57 Source: http://www.sportsbettinginamerica.com/
9. IMPACT OF SPORTS BETTING ON CHARITABLEGAMING, LOTTERIES AND CASINOS IN INDIANA
124 Indiana Sports Betting Report
Casino Gaming
Several studies have been conducted to examine the impact of sports betting on casinos in Nevada. The most prominent among them were conducted by Anthony Lucas and Brett Abarbanel for University of Nevada Las Vegas. Lucas’ study58 built upon the results of the study by Abarbanel, et al.59 His work closely examined slot and table game play and tested the concludes that many race and sports book patrons visit the casino to make race and sports bets and display little interest in making slot and table game wagers, essentially forming a subset of gamblers within the casino similar to poker players. This study failed in most cases to confirm the Full Service Theory60 concept which argues that ancillary gaming amenities such as race and sports books, poker rooms, bingo lounges, etc. support slot and table games with incremental revenue. However, while it showed little crossover to slots or tables, it also found that neither the race book nor the sports book daily revenues produced a statistically significant impact on daily aggregate slot coin-in or table drop, either positive or negative. These findings support the contention that legalized sports betting will have only a minimal impact upon casino gaming revenues. In fact, a stronger argument can be made that the attraction of sports betting benefits casino properties by providing crossover to ancillary non-gaming amenities such as food and beverage. The demographic characteristics reflected in our survey shows that sports bettors are younger and more affluent than the typical casino patron in Indiana and the fact that so many are working or have children living at home indicates that while they may have disposable income for gambling activities they seldom have available time to visit the casino. Engaging this underserved demographic via sports betting operations appears likely to increase current visitation and generate ancillary non-gaming revenue.
Lottery
No reliable evidence yet exists with which to quantify revenue impacts on lottery sales due to the introduction of regulated sports betting within the U.S. Nevada, the only state with pre-existing single wager sports betting, has no state lottery. Delaware, where sports betting is administered by the lottery, and New Jersey, where it is operated by casinos and horse racing tracks, have only recently initiated sports betting and are only now beginning to roll out mobile applications. Reliable evidence can be found in Europe, where generally lotteries have prospered alongside robust sports betting markets. According to the European Lottery Association, member organizations, many of which incorporate sports betting usually in competition with commercial sports betting operators, have reported increased sales over the past five years.61
58 Source: Anthony F. Lucas, Exploring the Relationship between Race and Sports Book Wagering Activity and Daily Slot and Table Game Play, https://digitalscholarship.unlv.edu/grrj/vol18/iss2/5/. 59 Source: Brett L. Abarbanel, Anthony F. Lucas, & A. K. Singh, (2011). Estimating the indirect effect of sports books on other in-house gaming volumes. UNLV Gaming Research & Review Journal, 15(2), 77-90. 60 Source: Lucas, A.F. (2013b). Examining the link between poker room business volume and gaming activity in slots and table games: A closer look at a key assumption in the full service theory. UNLV Gaming Research & Review Journal, 17(1), 43-63. 61 Source: The European Lotteries, Report on the Lottery Sector in Europe 2016, https://www.european-lotteries.org.
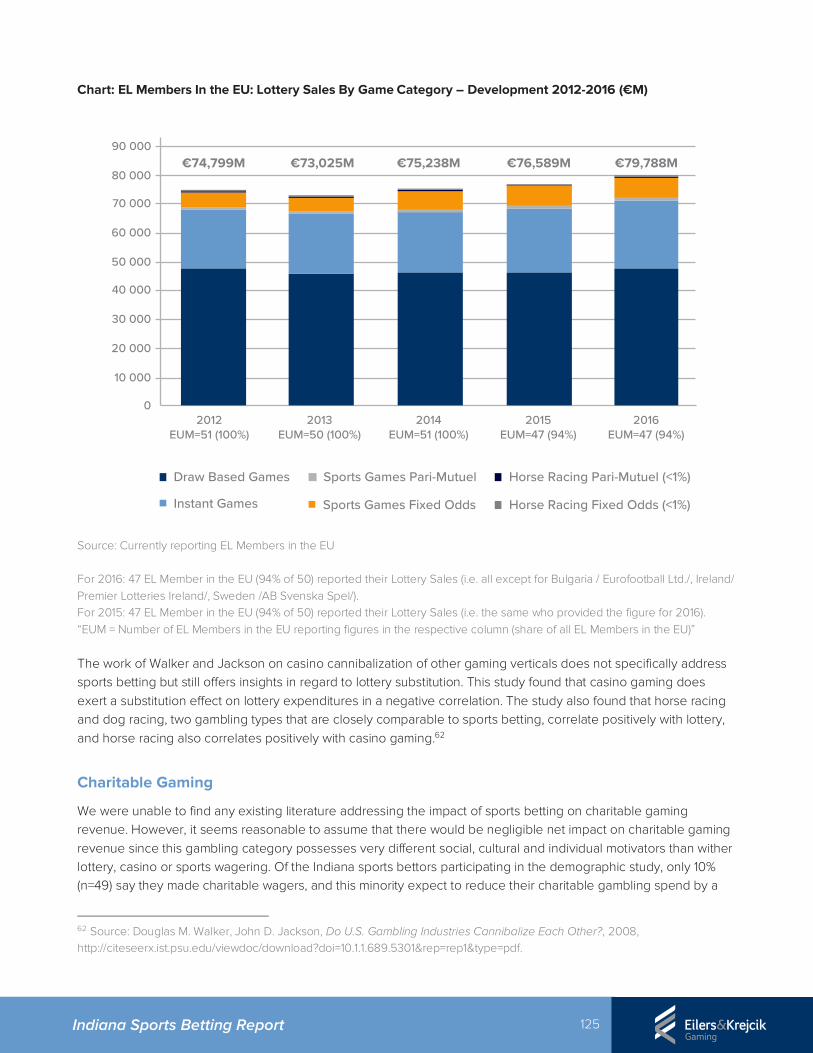
125 Indiana Sports Betting Report
Chart: EL Members In the EU: Lottery Sales By Game Category – Development 2012-2016 (€M)
Source: Currently reporting EL Members in the EU
For 2016: 47 EL Member in the EU (94% of 50) reported their Lottery Sales (i.e. all except for Bulgaria / Eurofootball Ltd./, Ireland/ Premier Lotteries Ireland/, Sweden /AB Svenska Spel/). For 2015: 47 EL Member in the EU (94% of 50) reported their Lottery Sales (i.e. the same who provided the figure for 2016). “EUM = Number of EL Members in the EU reporting figures in the respective column (share of all EL Members in the EU)”
The work of Walker and Jackson on casino cannibalization of other gaming verticals does not specifically address sports betting but still offers insights in regard to lottery substitution. This study found that casino gaming does exert a substitution effect on lottery expenditures in a negative correlation. The study also found that horse racing and dog racing, two gambling types that are closely comparable to sports betting, correlate positively with lottery, and horse racing also correlates positively with casino gaming.62
Charitable Gaming
We were unable to find any existing literature addressing the impact of sports betting on charitable gaming revenue. However, it seems reasonable to assume that there would be negligible net impact on charitable gaming revenue since this gambling category possesses very different social, cultural and individual motivators than wither lottery, casino or sports wagering. Of the Indiana sports bettors participating in the demographic study, only 10% (n=49) say they made charitable wagers, and this minority expect to reduce their charitable gambling spend by a
62 Source: Douglas M. Walker, John D. Jackson, Do U.S. Gambling Industries Cannibalize Each Other?, 2008, http://citeseerx.ist.psu.edu/viewdoc/download?doi=10.1.1.689.5301&rep=rep1&type=pdf.
90 000
80 000
70 000
60 000
50 000
40 000
30 000
20 000
10 000
02012
EUM=51 (100%)2013
EUM=50 (100%)2014
EUM=51 (100%)2015
EUM=47 (94%)2016
EUM=47 (94%)
€74,799M €73,025M €75,238M €76,589M €79,788M
Draw Based Games
Instant Games
Sports Games Pari-Mutuel
Sports Games Fixed Odds
Horse Racing Pari-Mutuel (<1%)
Horse Racing Fixed Odds (<1%)

126 Indiana Sports Betting Report
median 4% should sports betting become legal in Indiana. This contrasts favorably to the median 20% reduction anticipated for lottery expenditures and the median 21% anticipated for casino gaming expenditures. Given these self-reported expectations it is apparent that charitable gaming expenditures are the least threatened by legal sports betting and that any adverse impact will be insignificant.
127 Indiana Sports Betting Report
Overview
What happens if Indiana does not authorize sports betting in the 2019 session? This section offers a simple risk /
reward analysis of that question.
We readily admit that our view is an external one, and that there may be additional considerations unique to
Indiana's gaming market or political landscape that add additional weight on either side of the scale.
On balance, we believe the risks associated with delaying sports betting beyond the 2019 session clearly outweigh
the rewards. We also think it is worth noting that some of the benefits of delaying legislation can be secured in
whole or in part by providing regulators with flexibility as part of the authorizing legislation.
Delaying Sports Betting Legislation: Risks
1) Delay allows the black market to further entrench. Black market operators would likely welcome additional
delays by states to regulate sports betting. Black market operators can use that time to reinforce their relationships
with existing customers through promotions, bonuses, and other rewards, making it more difficult for regulated
operators to pry those customers away when regulation does happen.
Black market operators can also utilize any delay to increase their customer base. Based on anecdotal evidence,
we believe that many U.S. consumers are broadly unaware of the nuances of the Supreme Court's decision. We
believe that no small segment of the population thinks that the Court made sports betting legal, irrespective of state
action. Under those conditions, some consumers spurred to interest in sports betting by the Court's decision may
find their way to black market operators63 but believe that they are using legal sites.
2) Delay creates a competitive disadvantage for Indiana operators. If Indiana authorizes early in 2019 and
moves quickly to launch, Indiana operators will likely enjoy some amount of regional exclusivity. While the
exclusivity will almost certainly be short-term, it could still represent a significant opportunity for Indiana gaming
operators, especially those with large proximate bordering populations.
63 See https://www.oddsshark.com/usa/indiana, a top result for the Google search "Indiana sports betting sites" that promotes black market operators.
10. RISK-REWARD ANALYSIS OF DELAYING SPORTS BETTING LEGISLATION
128 Indiana Sports Betting Report
Conversely, should Indiana fail to authorize sports betting in 2019, there is a significant chance that many, if not
most, neighboring states will act on sports betting. This dynamic results in Indiana both surrendering some short-
term revenue gain and also risking a long-term revenue loss as its own border-adjacent population may develop
the habit of wagering in neighboring states and maintain that habit even after Indiana authorizes sports betting.
That impact could be exacerbated by the fact that when Indiana does enter the market, Indiana operators may be
some distance behind their neighboring counterparts when it comes to sports betting technology, staffing, and
operational expertise.
3) Delay may complicate the legislative process. We believe that a delay in 2019 could easily translate into a
delay that stretches beyond 2020.
• The experience of other states (e.g., New York) suggests to us that non-election years are more hospitable
climates for sports betting bills.
• Additionally, the current political climate in Indiana for sports betting appears to be positive on balance;
political climates are rarely stable and we can imagine several scenarios in which Indiana's current
momentum for sports betting lessens or evaporates.
• An extended debate offers the opportunity for stakeholders to become entrenched, a realistic concern
given the existing and potential points of conflict between stakeholders such as commercial casinos, tribal
casinos, professional sports leagues, and the NCAA.
• Finally, Indiana risks losing leverage with suppliers and operators, who are more likely to agree to less-
favorable terms in first-mover states.
4) Delay causes economic loss for the state. A full year of delay would cost Indiana millions in tax revenue and
tens of millions in economic impact. Should the one-year delay stretch into additional years, Indiana risks tax losses
that could exceed $100mm in short order.
Delaying Sports Betting Legislation: Rewards
1) Delay could result in a stronger product at launch. First-wave sports betting states are likely to launch with
immature product sets. These markets will have to work out the kinks in real time, while states that follow in
subsequent waves will have the benefit of the experience of first-wave states. A delay could also result in Indiana
launching sports betting in a more supportive payment processing climate. The upshot could be a product that makes a better first impression on Indiana consumers, increasing new
customer retention and black market capture potential.
2) Delay creates opportunity to learn broad lessons from other markets. Should Indiana wait until 2020 to
authorize sports betting, it will have the benefit of a full year of retail and mobile performance in New Jersey and
West Virginia (along with a shorter calendar of results in other states) to draw upon when crafting policy and
regulations.
One could argue that Nevada's existing market provides all of the experience necessary for policymakers to make
quality decisions around sports betting, but we believe that new markets outside of Nevada will present at least
some useful lessons for Indiana's approach.

129 Indiana Sports Betting Report
3) Delay may provide clarity around key policy issues. To date, states have been split on a number of key policy
considerations. Notable issues where states have diverged dramatically - or where a dominant approach has yet to
emerge - include tax rate, distribution channels, skins, and the asks from professional sports leagues such as
integrity fees and data exclusivity.
Should Indiana push a decision on sports betting into a subsequent session, there is the chance that a clearer
consensus could emerge among states on these issues.

130 Indiana Sports Betting Report
Appendix A: Estimated Economic Impacts Of Bear Case Retail + Mobile Scenario
In our bear case scenario, we assume that regulated sports betting products and pricing are clearly uncompetitive with black market products, that operators build minimal sports betting facilities and treat sports betting largely as an amenity, and that payment processing difficulties – particularly, credit card rejection rates – act as a significant drag on the market. Note that this estimate blends our bear case retail + mobile market forecast (set out in Section 2 of this report) with the Morrison bill licensing and tax scenario.
Table: Economic Output Impacts By Year (Bear Case Retail + Mobile Scenario)
Year 1 Year 2 Year 3 Year 4 Year 5
Direct $44.9mm $134.7mm $179.6mm $194.2mm $203.5mm
Indirect/ Induced $34.1mm $102.3mm $136.4mm $154.7mm $166.1mm
Total Economic Impact $79.0mm $237.0mm $316.0mm $349.0mm $369.7mm
Table Source: Eilers & Krejcik Gaming, LLC
Table: Economic Value-Added Impacts By Year (Bear Case Retail + Mobile Scenario)
Year 1 Year 2 Year 3 Year 4 Year 5
Direct $18.2mm $54.5mm $72.7mm $72.1mm $72.0mm
Indirect/ Induced $19.6mm $58.9mm $78.6mm $88.6mm $94.9mm
Total Economic Impact $37.8mm $113.4mm $151.2mm $160.7mm $166.9mm
Table Source: Eilers & Krejcik Gaming, LLC
Table: Full-Time Equivalent Employment Impacts By Year (Bear Case Retail + Mobile Scenario)
Year 1 Year 2 Year 3 Year 4 Year 5
Direct 143 428 571 577 583
Indirect/ Induced 251 752 1,002 1,142 1,228
Total Economic Impact 393 1,180 1,573 1,719 1,812
Table Source: Eilers & Krejcik Gaming, LLC

131 Indiana Sports Betting Report
Table: Earnings Impacts By Year (Bear Case Retail + Mobile Scenario)
Year 1 Year 2 Year 3 Year 4 Year 5
Direct $8.2mm $24.6mm $32.8mm $35.7mm $37.5mm
Indirect/ Induced $12.0mm $36.0mm $48.0mm $54.7mm $58.9mm
Total Economic Impact $20.2mm $60.6mm $80.8mm $90.4mm $96.4mm
Table Source: Eilers & Krejcik Gaming, LLC
Table: Summary Of Estimated State-Level Tax Revenue (Bear Case Retail + Mobile Scenario)
Year 1 Year 2 Year 3 Year 4 Year 5
Gross Gaming Revenue $4.2mm $12.5mm $16.6mm $18.0mm $18.8mm
License Fees $1.1mm $0.12mm $0.12mm $0.12mm $0.12mm
Other Firm Taxes $2.7mm $8.0mm $10.7mm $10.1mm $9.8mm
Other Individual and Household Taxes $0.4mm $1.1mm $1.4mm $1.6mm $1.7mm
Total State Tax Revenue $8.3mm $21.7mm $28.8mm $29.8mm $30.4mm
Note: An estimated $0.65mm of reinvestigation license fees are expected after year 5 Table Source: Eilers & Krejcik Gaming, LLC
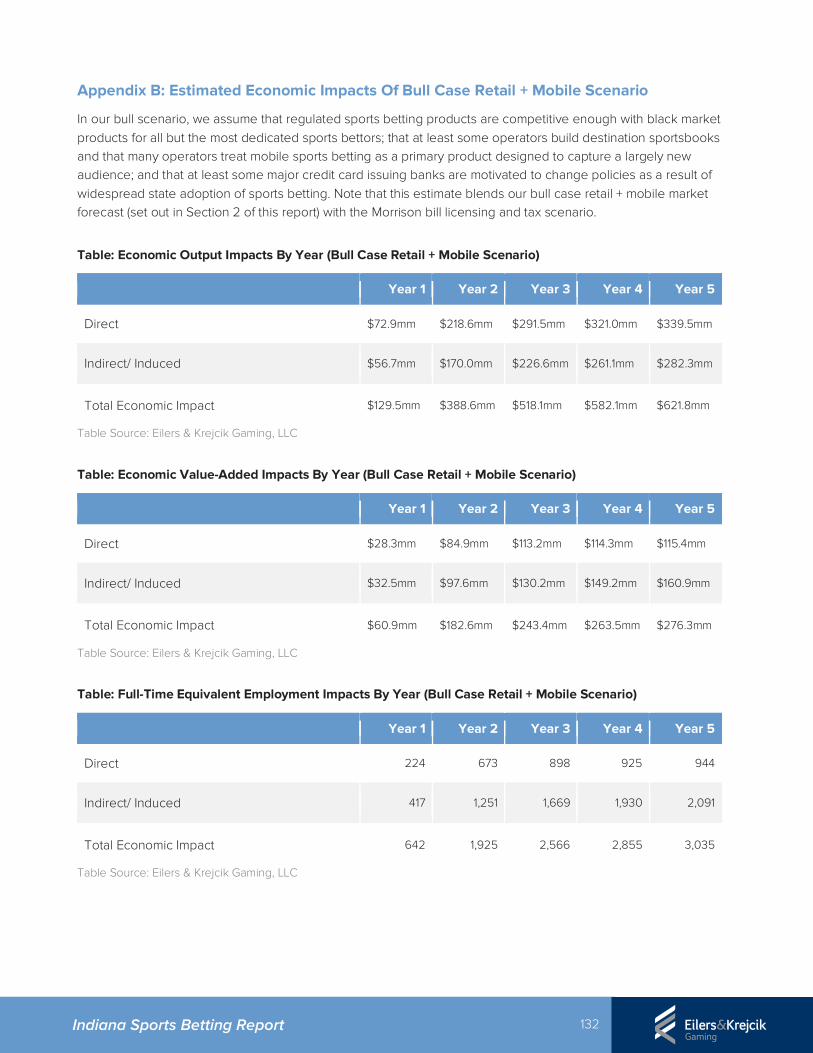
132 Indiana Sports Betting Report
Appendix B: Estimated Economic Impacts Of Bull Case Retail + Mobile Scenario
In our bull scenario, we assume that regulated sports betting products are competitive enough with black market products for all but the most dedicated sports bettors; that at least some operators build destination sportsbooks and that many operators treat mobile sports betting as a primary product designed to capture a largely new audience; and that at least some major credit card issuing banks are motivated to change policies as a result of widespread state adoption of sports betting. Note that this estimate blends our bull case retail + mobile market forecast (set out in Section 2 of this report) with the Morrison bill licensing and tax scenario.
Table: Economic Output Impacts By Year (Bull Case Retail + Mobile Scenario)
Year 1 Year 2 Year 3 Year 4 Year 5
Direct $72.9mm $218.6mm $291.5mm $321.0mm $339.5mm
Indirect/ Induced $56.7mm $170.0mm $226.6mm $261.1mm $282.3mm
Total Economic Impact $129.5mm $388.6mm $518.1mm $582.1mm $621.8mm
Table Source: Eilers & Krejcik Gaming, LLC
Table: Economic Value-Added Impacts By Year (Bull Case Retail + Mobile Scenario)
Year 1 Year 2 Year 3 Year 4 Year 5
Direct $28.3mm $84.9mm $113.2mm $114.3mm $115.4mm
Indirect/ Induced $32.5mm $97.6mm $130.2mm $149.2mm $160.9mm
Total Economic Impact $60.9mm $182.6mm $243.4mm $263.5mm $276.3mm
Table Source: Eilers & Krejcik Gaming, LLC
Table: Full-Time Equivalent Employment Impacts By Year (Bull Case Retail + Mobile Scenario)
Year 1 Year 2 Year 3 Year 4 Year 5
Direct 224 673 898 925 944
Indirect/ Induced 417 1,251 1,669 1,930 2,091
Total Economic Impact 642 1,925 2,566 2,855 3,035
Table Source: Eilers & Krejcik Gaming, LLC

133 Indiana Sports Betting Report
Table: Earnings Impacts By Year (Bull Case Retail + Mobile Scenario)
Year 1 Year 2 Year 3 Year 4 Year 5
Direct $13.3mm $40.0mm $53.4mm $59.1mm $62.7mm
Indirect/ Induced $20.0mm $60.0mm $80.0mm $92.5mm $100.3mm
Total Economic Impact $33.3mm $100.0mm $133.4mm $151.7mm $163.0mm
Table Source: Eilers & Krejcik Gaming, LLC
Table: Summary Of Estimated State-Level Tax Revenue (Bull Case Retail + Mobile Scenario)
Year 1 Year 2 Year 3 Year 4 Year 5
Gross Gaming Revenue $6.7mm $20.2mm $27.0mm $29.7mm $31.4mm
License Fees $1.1mm $0.12mm $0.12mm $0.12mm $0.12mm
Other Firm Taxes $4.1mm $12.2mm $16.2mm $15.6mm $15.2mm
Other Individual and Household Taxes $0.6mm $1.8mm $2.4mm $2.7mm $2.9mm
Total State Tax Revenue $12.5mm $34.3mm $45.7mm $48.1mm $49.6mm
Note: An estimated $0.65mm of reinvestigation license fees are expected after year 5 Table Source: Eilers & Krejcik Gaming, LLC
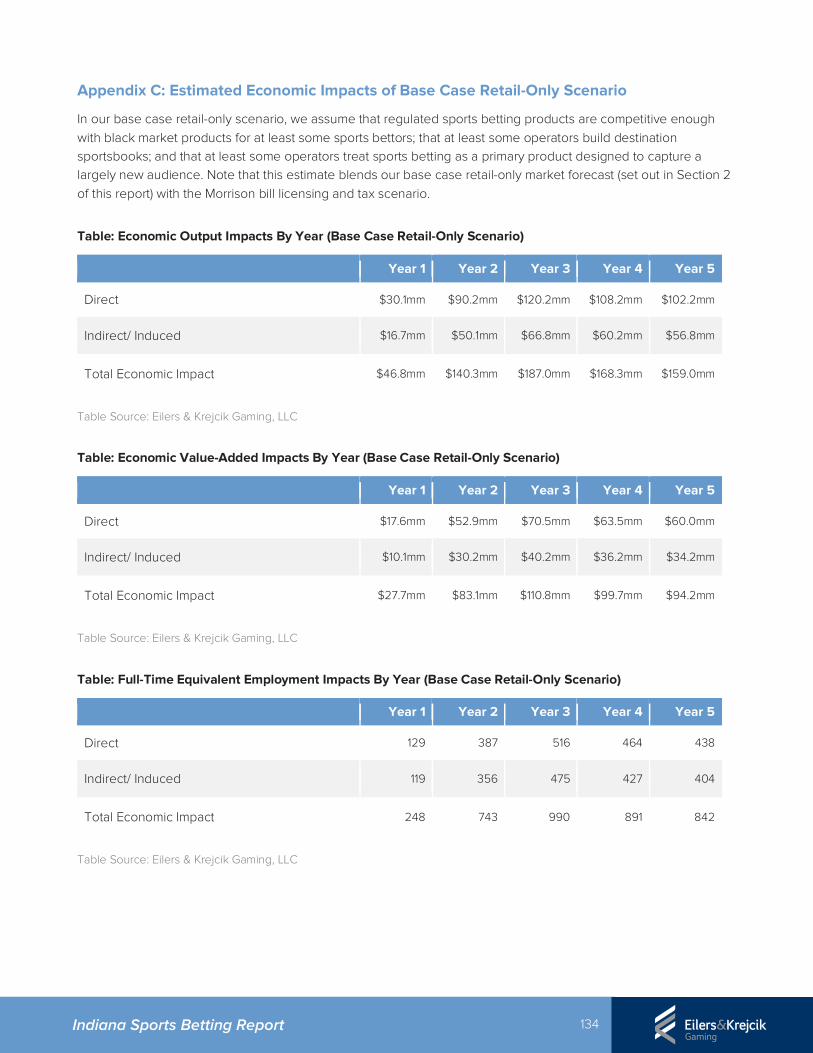
134 Indiana Sports Betting Report
Appendix C: Estimated Economic Impacts of Base Case Retail-Only Scenario
In our base case retail-only scenario, we assume that regulated sports betting products are competitive enough with black market products for at least some sports bettors; that at least some operators build destination sportsbooks; and that at least some operators treat sports betting as a primary product designed to capture a largely new audience. Note that this estimate blends our base case retail-only market forecast (set out in Section 2 of this report) with the Morrison bill licensing and tax scenario.
Table: Economic Output Impacts By Year (Base Case Retail-Only Scenario)
Year 1 Year 2 Year 3 Year 4 Year 5
Direct $30.1mm $90.2mm $120.2mm $108.2mm $102.2mm
Indirect/ Induced $16.7mm $50.1mm $66.8mm $60.2mm $56.8mm
Total Economic Impact $46.8mm $140.3mm $187.0mm $168.3mm $159.0mm
Table Source: Eilers & Krejcik Gaming, LLC
Table: Economic Value-Added Impacts By Year (Base Case Retail-Only Scenario)
Year 1 Year 2 Year 3 Year 4 Year 5
Direct $17.6mm $52.9mm $70.5mm $63.5mm $60.0mm
Indirect/ Induced $10.1mm $30.2mm $40.2mm $36.2mm $34.2mm
Total Economic Impact $27.7mm $83.1mm $110.8mm $99.7mm $94.2mm
Table Source: Eilers & Krejcik Gaming, LLC
Table: Full-Time Equivalent Employment Impacts By Year (Base Case Retail-Only Scenario)
Year 1 Year 2 Year 3 Year 4 Year 5
Direct 129 387 516 464 438
Indirect/ Induced 119 356 475 427 404
Total Economic Impact 248 743 990 891 842
Table Source: Eilers & Krejcik Gaming, LLC
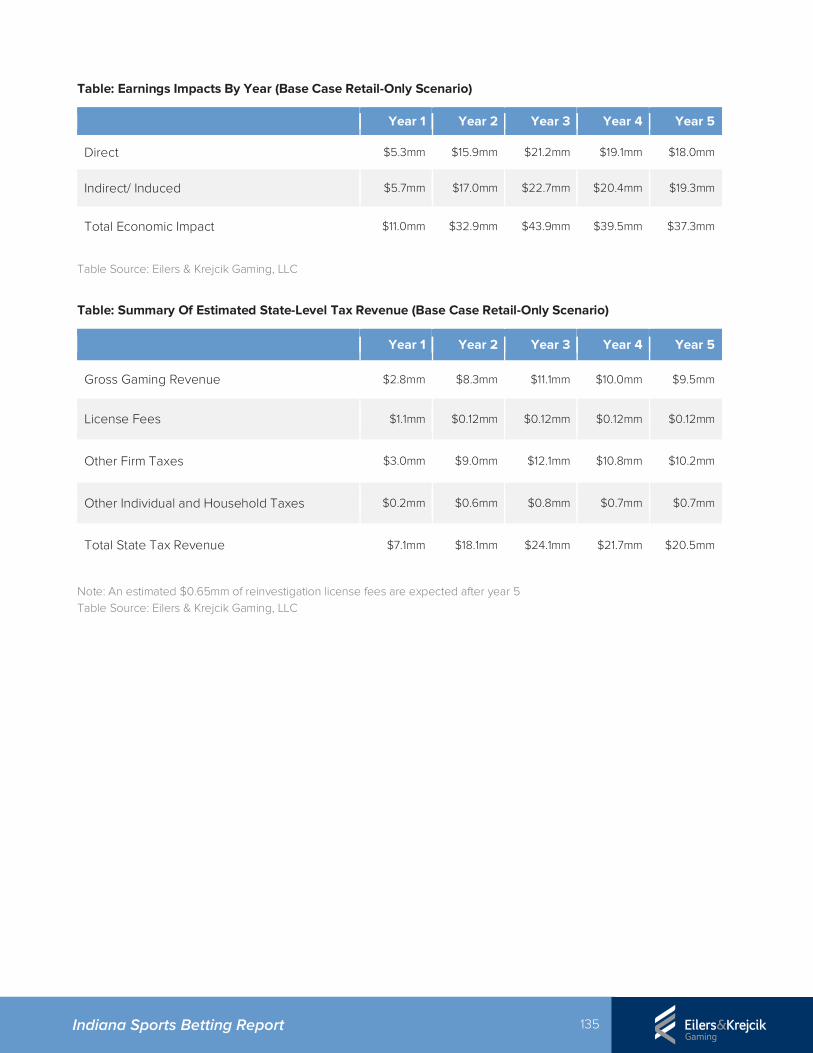
135 Indiana Sports Betting Report
Table: Earnings Impacts By Year (Base Case Retail-Only Scenario)
Year 1 Year 2 Year 3 Year 4 Year 5
Direct $5.3mm $15.9mm $21.2mm $19.1mm $18.0mm
Indirect/ Induced $5.7mm $17.0mm $22.7mm $20.4mm $19.3mm
Total Economic Impact $11.0mm $32.9mm $43.9mm $39.5mm $37.3mm
Table Source: Eilers & Krejcik Gaming, LLC
Table: Summary Of Estimated State-Level Tax Revenue (Base Case Retail-Only Scenario)
Year 1 Year 2 Year 3 Year 4 Year 5
Gross Gaming Revenue $2.8mm $8.3mm $11.1mm $10.0mm $9.5mm
License Fees $1.1mm $0.12mm $0.12mm $0.12mm $0.12mm
Other Firm Taxes $3.0mm $9.0mm $12.1mm $10.8mm $10.2mm
Other Individual and Household Taxes $0.2mm $0.6mm $0.8mm $0.7mm $0.7mm
Total State Tax Revenue $7.1mm $18.1mm $24.1mm $21.7mm $20.5mm
Note: An estimated $0.65mm of reinvestigation license fees are expected after year 5 Table Source: Eilers & Krejcik Gaming, LLC
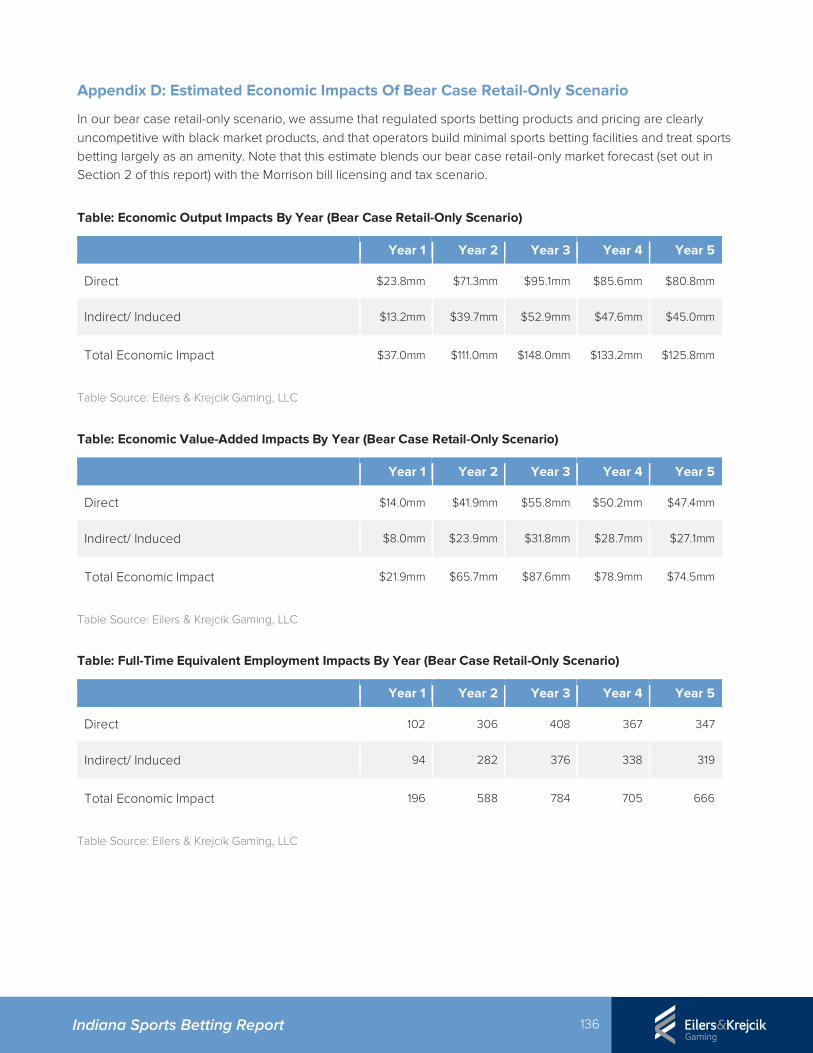
136 Indiana Sports Betting Report
Appendix D: Estimated Economic Impacts Of Bear Case Retail-Only Scenario
In our bear case retail-only scenario, we assume that regulated sports betting products and pricing are clearly uncompetitive with black market products, and that operators build minimal sports betting facilities and treat sports betting largely as an amenity. Note that this estimate blends our bear case retail-only market forecast (set out in Section 2 of this report) with the Morrison bill licensing and tax scenario.
Table: Economic Output Impacts By Year (Bear Case Retail-Only Scenario)
Year 1 Year 2 Year 3 Year 4 Year 5
Direct $23.8mm $71.3mm $95.1mm $85.6mm $80.8mm
Indirect/ Induced $13.2mm $39.7mm $52.9mm $47.6mm $45.0mm
Total Economic Impact $37.0mm $111.0mm $148.0mm $133.2mm $125.8mm
Table Source: Eilers & Krejcik Gaming, LLC
Table: Economic Value-Added Impacts By Year (Bear Case Retail-Only Scenario)
Year 1 Year 2 Year 3 Year 4 Year 5
Direct $14.0mm $41.9mm $55.8mm $50.2mm $47.4mm
Indirect/ Induced $8.0mm $23.9mm $31.8mm $28.7mm $27.1mm
Total Economic Impact $21.9mm $65.7mm $87.6mm $78.9mm $74.5mm
Table Source: Eilers & Krejcik Gaming, LLC
Table: Full-Time Equivalent Employment Impacts By Year (Bear Case Retail-Only Scenario)
Year 1 Year 2 Year 3 Year 4 Year 5
Direct 102 306 408 367 347
Indirect/ Induced 94 282 376 338 319
Total Economic Impact 196 588 784 705 666
Table Source: Eilers & Krejcik Gaming, LLC

137 Indiana Sports Betting Report
Table: Earnings Impacts By Year (Bear Case Retail-Only Scenario)
Year 1 Year 2 Year 3 Year 4 Year 5
Direct $4.2mm $12.6mm $16.8mm $15.1mm $14.3mm
Indirect/ Induced $4.5mm $13.5mm $17.9mm $16.1mm $15.2mm
Total Economic Impact $8.7mm $26.0mm $34.7mm $31.3mm $29.5mm
Table Source: Eilers & Krejcik Gaming, LLC
Table: Summary Of Estimated State-Level Tax Revenue (Bear Case Retail-Only Scenario)
Year 1 Year 2 Year 3 Year 4 Year 5
Gross Gaming Revenue $2.2mm $6.6mm $8.8mm $7.9mm $7.5mm
License Fees $1.1mm $0.12mm $0.12mm $0.12mm $0.12mm
Other Firm Taxes $2.4mm $7.2mm $9.5mm $8.6mm $8.1mm
Other Individual and Household Taxes $0.2mm $0.5mm $0.6mm $0.6mm $0.5mm
Total State Tax Revenue $5.8mm $14.3mm $19.1mm $17.2mm $16.2mm
Note: An estimated $0.65mm of reinvestigation license fees are expected after year 5 Table Source: Eilers & Krejcik Gaming, LLC
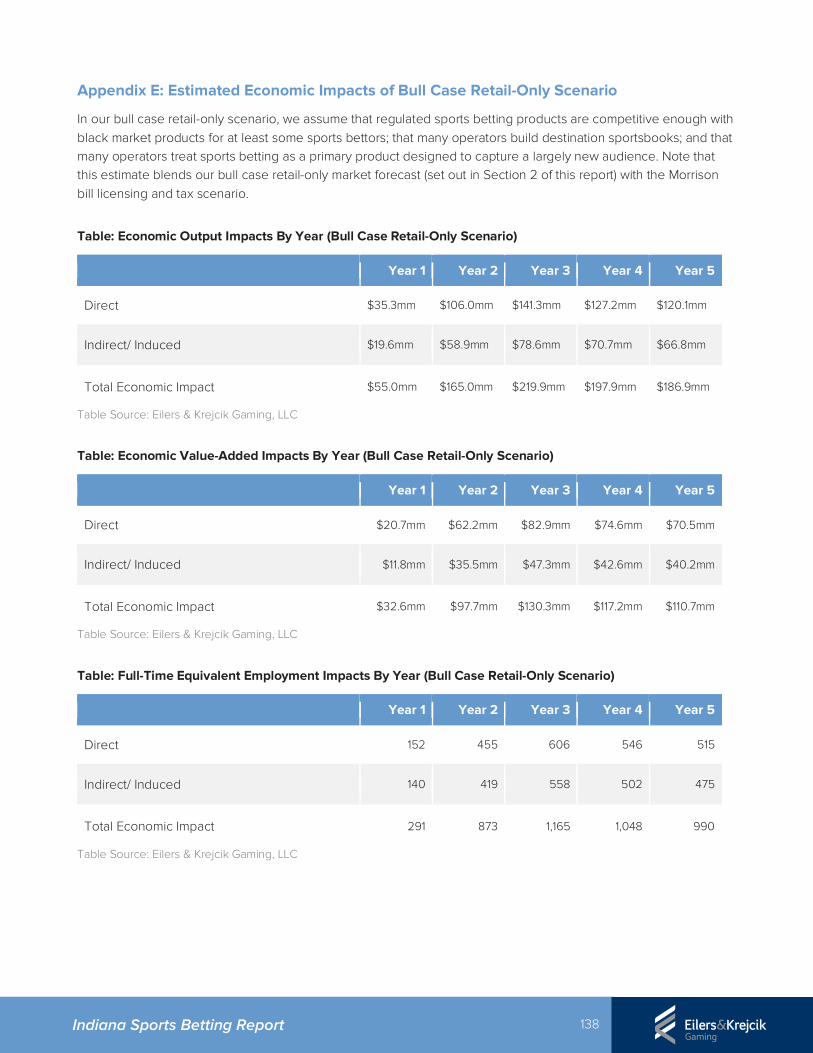
138 Indiana Sports Betting Report
Appendix E: Estimated Economic Impacts of Bull Case Retail-Only Scenario
In our bull case retail-only scenario, we assume that regulated sports betting products are competitive enough with black market products for at least some sports bettors; that many operators build destination sportsbooks; and that many operators treat sports betting as a primary product designed to capture a largely new audience. Note that this estimate blends our bull case retail-only market forecast (set out in Section 2 of this report) with the Morrison bill licensing and tax scenario.
Table: Economic Output Impacts By Year (Bull Case Retail-Only Scenario)
Year 1 Year 2 Year 3 Year 4 Year 5
Direct $35.3mm $106.0mm $141.3mm $127.2mm $120.1mm
Indirect/ Induced $19.6mm $58.9mm $78.6mm $70.7mm $66.8mm
Total Economic Impact $55.0mm $165.0mm $219.9mm $197.9mm $186.9mm
Table Source: Eilers & Krejcik Gaming, LLC
Table: Economic Value-Added Impacts By Year (Bull Case Retail-Only Scenario)
Year 1 Year 2 Year 3 Year 4 Year 5
Direct $20.7mm $62.2mm $82.9mm $74.6mm $70.5mm
Indirect/ Induced $11.8mm $35.5mm $47.3mm $42.6mm $40.2mm
Total Economic Impact $32.6mm $97.7mm $130.3mm $117.2mm $110.7mm
Table Source: Eilers & Krejcik Gaming, LLC
Table: Full-Time Equivalent Employment Impacts By Year (Bull Case Retail-Only Scenario)
Year 1 Year 2 Year 3 Year 4 Year 5
Direct 152 455 606 546 515
Indirect/ Induced 140 419 558 502 475
Total Economic Impact 291 873 1,165 1,048 990
Table Source: Eilers & Krejcik Gaming, LLC
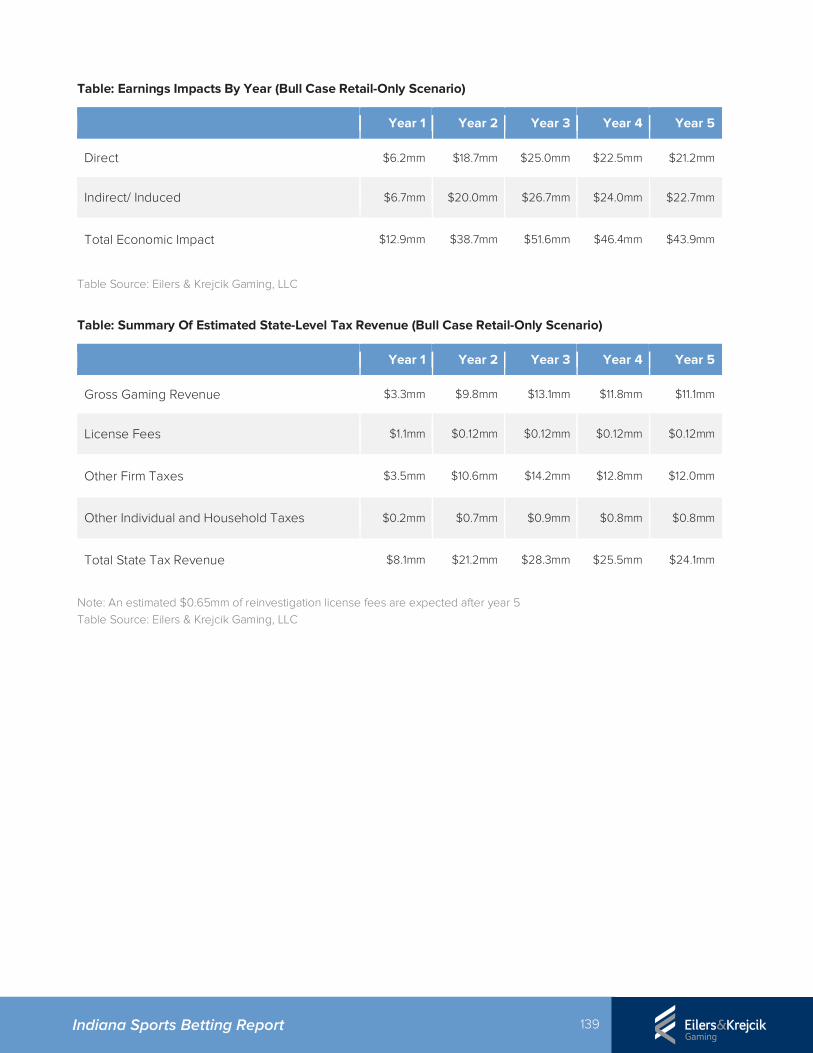
139 Indiana Sports Betting Report
Table: Earnings Impacts By Year (Bull Case Retail-Only Scenario)
Year 1 Year 2 Year 3 Year 4 Year 5
Direct $6.2mm $18.7mm $25.0mm $22.5mm $21.2mm
Indirect/ Induced $6.7mm $20.0mm $26.7mm $24.0mm $22.7mm
Total Economic Impact $12.9mm $38.7mm $51.6mm $46.4mm $43.9mm
Table Source: Eilers & Krejcik Gaming, LLC
Table: Summary Of Estimated State-Level Tax Revenue (Bull Case Retail-Only Scenario)
Year 1 Year 2 Year 3 Year 4 Year 5
Gross Gaming Revenue $3.3mm $9.8mm $13.1mm $11.8mm $11.1mm
License Fees $1.1mm $0.12mm $0.12mm $0.12mm $0.12mm
Other Firm Taxes $3.5mm $10.6mm $14.2mm $12.8mm $12.0mm
Other Individual and Household Taxes $0.2mm $0.7mm $0.9mm $0.8mm $0.8mm
Total State Tax Revenue $8.1mm $21.2mm $28.3mm $25.5mm $24.1mm
Note: An estimated $0.65mm of reinvestigation license fees are expected after year 5 Table Source: Eilers & Krejcik Gaming, LLC
140 Indiana Sports Betting Report
About Us
Eilers & Krejcik Gaming, LLC is a boutique research firm focused on servicing the gaming equipment, technology, and interactive gaming sectors within the global gaming industry. Our products and services include market research, company research, and consulting services designed specifically for retail and mobile casino operators, equipment and technology suppliers, social gaming operators and suppliers, gaming regulators, and investors.
Project Team Biographies
Chris Grove is Managing Director, Sports & Emerging Verticals, at Eilers & Krejcik Gaming. Grove’s research and analysis has been cited by lawmakers, regulators, and major media outlets such as the New York Times, the Washington Post, ESPN and the Wall Street Journal. He’s worked directly with policymakers in several states, including California, Massachusetts, and Nevada. Prior to his work in Gaming, Grove was a coach of national championship collegiate speech and debate teams at Bradley University, Illinois State University, and Western Kentucky University. Grove was inducted into the National Forensic Association Hall of Fame in 2001. Grove earned his B.A. and M.A. in Communications from Illinois State University and currently lives in Las Vegas. Chris Krafcik is Managing Director, Political and Regulatory Markets, at Eilers & Krejcik Gaming. Prior to joining the firm, Krafcik was Research Director, North America, at GamblingCompliance, a London-headquartered information firm serving clients in and associated with the global gambling industry. Krafcik has twelve years' experience covering the U.S. gambling sector, focusing on the interplay between politics and economics in the country’s ongoing debate over Internet gambling legalization. Krafcik has featured in, or his research has been cited by, the Associated Press, ESPN, the Financial Times, the Los Angeles Times, the New York Times, Politico, Reuters, the Washington Post and other media outlets. Krafcik has also spoken at gambling conferences, institutional investor briefings and governmental hearings around the world, most recently at the Global Gaming Expo in Las Vegas. Kahlil Philander, Ph.D., is one of the world’s leading experts in the socio-economic impacts of gaming. He is currently the Assistant Professor at the Carson College of Business at Washington State University. His previous industry experience is with the British Columbia Lottery Corporation where he was the Director of Social Responsibility from 2015 – 2017. His dissertation focused on the Impacts of Casino Tax Policy on Short-Run Gaming Development. Prior to his doctoral work, Kahlil was an Economic Analyst for Intervistas Consulting, performing economic, operational and policy analysis related to the tourism and transportation industry. Kahlil has authored dozens of peer-reviewed scientific journal articles on the gaming industry.
ABOUT US / PROJECT TEAM BIOGRAPHIES
141 Indiana Sports Betting Report
Gene Johnson has over 25 years of gaming industry experience in the disciplines of technology, Quality Assurance, Market Research, Casino Marketing, and Strategic Planning and Analysis. He is currently Executive Vice President at Victor-Strategies, providing expert advisory and critical business insights to commercial and tribal operators of the gaming industry. His industry career began in 1989 working in Atlantic City casinos. In 1997 founded EE Johnson Research, a marketing and consulting firm specializing in qualitative insight into player behavior, quantitative surveys and data analysis, and customer service enhancement. In 2012 his company became part of Spectrum Gaming Group, and in 2016 he created Gaming Knowledge Partners, a network of industry experts. Gene holds an MBA from the University of Phoenix, a BA from Washington College, and a CQA from the Quality Assurance Institute.

1851 EAST FIRST STREET | SUITE 946 | SANTA ANA CA | 92705 | WWW.EKGAMINGLLC.COM
Disclosure: Eilers & Krejcik Gaming, LLC is an independent research firm and is neither a registered broker dealer nor a registered investment advisor. No information contained in this report shall constitute as a recommendation or solicitation to buy or sell a security. Individuals receiving this report should consult with an investment advisor or registered representative before making an investment decision related to any information contained in this report. In addition, Eilers & Krejcik Gaming, LLC either does, or may seek to do business with any company mentioned in this report. This report was prepared for and distributed to clients of Eilers & Krejcik Gaming, LLC. If you are not the intended recipient and/or received this report in error, please delete this document and notify Eilers & Krejcik Gaming, LLC at [email protected], or call 949-887-7726. This report is also protected by federal copyright law. Any unauthorized review, dissemination, or copying of this communication is strictly prohibited. By accessing, reading, storing, distributing and archiving this research report, you hereby agree, fully, and without dispute, to all terms and conditions outlined above.