Embed Size (px)
Citation preview
REGULAR PAPER SUBMISSION FOR THE IEEE/ASME TRANSACTIONS ON MECHATRONICS 1
Whisker-like Position Sensor forMeasuring Physiological Motion
Ozkan Bebek, Student Member, IEEE, M. Cenk Cavusoglu, Senior Member, IEEE
Abstract— This paper presents the design and characterizationof a whisker-like three-dimensional position sensor. The whiskersensor is a flexible, high precision, high bandwidth contactsensor designed for measuring biological motion of soft tissuefor medical robotics applications. Low stiffness of the sensorprevents damage on the tissue during its contact. Two differentdesigns, one for measuring large displacements, the other forsmall displacements are described. Simulation and measurementresults from prototype of both designs are reported.
Index Terms— Flexible structures, medical robotics, physiolog-ical motion sensing, three-dimensional sensor, whisker-like.
I. INTRODUCTION
Physiological motions are measured and actively compen-sated during robotic-assisted medical interventions to im-prove the accuracy of the surgery [1]–[8]. The sensors formeasuring the physiological motion of the target tissue isa critical component of the overall robotic system. In thispaper a whisker-like three-dimensional, high precision, highbandwidth, flexible contact position sensor is proposed formeasuring the physiological motion of the body in medicalrobotics applications. The proposed highly sensitive sensorequipped with micro strain gauges comes out from the tipof a manipulator and touches the tissue or skin surface.The whisker sensor can be in continuous contact with thepoint of interest, in contrast to other available sensors formeasuring biological motion. It can be in continuous contactwith the point of interest, in contrast to other available sensorsfor measuring biological motion. Its high precision and highresolution enables the robotic system to actively compensatefor the relative motion between the surgical site and thesurgical instruments.
Details about the system concept and related work in liter-ature are presented in Section II. Design specifications of thesensor is provided in Section III. Section III-B describes theuse of strain gauges for position measurement. In Section III-C, mechanics of the flexure beams are modeled. Final elementanalysis and experimental results of the proposed designs aregiven in Sections IV and V.
Manuscript submitted on December 7, 2007; revised May 1, 2008.This work was supported in part by the National Science Foundation under
Grants CISE IIS-0222743, EIA-0329811, and CNS-0423253, and in part bythe US DoC under grant TOP-39-60-04003.
O. Bebek and M. C. Cavusoglu are with the Department of ElectricalEngineering and Computer Science of Case Western Reserve University,Cleveland, OH 44106, USA (e-mail: [email protected], [email protected]).Phone:+1-216-368-4575, Fax:+1-216-368-6039.
This paper was presented in part at the IEEE Int’l Conf. on Robotics andAutomation, Rome, Italy, 2007.
II. SYSTEM CONCEPT AND USE OF SENSORS
In robotic tele-surgery conventional surgical tools are re-placed with robotic instruments which are under direct controlof the surgeon through teleoperation. During off-pump coro-nary artery bypass graft (CABG) surgery, the robot arm andthe robotic surgical instruments track the heart and breathingmotion, which are the main sources of the physiologicalmotions observed. The relative motion between the surgicalsite and the surgical instruments is canceled. As a result, thesurgeon operates on the heart as if it were stationary, while therobotic system actively compensates for the relative motion ofthe heart. A typical heartbeat motion is in the order of 1-2 Hzwith 12 mm maximum peak displacement [4]. Measurementof heart motion with high precision and high confidenceis required for precise motion canceling performance. Also,redundant sensing systems are desirable for safety reasons.
Earlier studies in canceling beating motion with robotic-assisted tools used vision based and ultrasound based sensorysystems to measure heart motion. Nakamura et al. [1] trackedheart motion with a 4-DOF robot using a vision system.The tracking error due to the camera feedback system wasrelatively large (error in the order of few millimeters in thenormal direction) to perform beating heart surgery. Thakralet al. used a laser range finder system to measure one-dimensional motion of a rat’s heart [2]. Groeger et al. used atwo-camera computer vision system to measure local motionof heart and performed analysis of measured trajectories [3],and Koransky et al. studied the stabilization of coronary arterymotion afforded by passive cardiac stabilizers using three-dimensional digital sonomicrometry [9]. Hoff et al. measuredthe beating heart motion in three dimensions using two 2-axisaccelerometers [10], showing that acceleration measurementscan reveal patterns that may be an indication of heart cir-culation failure. Ortmaier et al. [5] and Ginhoux et al. [6]also used camera systems to measure motion of the heartsurface for their estimation algorithms. Cavusoglu et al. useda sonomicrometry system to collect heart motion data from anadult porcine [11], and they showed the feasibility of a roboticsystem performing off-pump coronary artery bypass graftingsurgery. Vitrani et al. used ultrasound based visual imagingto guide a surgical instrument within the heart during surgery[12]. Bader et al. [13] estimated a portion of organ surfacemotion using a pulsating membrane model with a stereo visionsystem. The model was used to estimate the periodic organmotion when the camera view is occluded. Noce et al. [14]simulated a method that characterizes heart surface texture todetect heart motion with recorded sequences by a monocular
REGULAR PAPER SUBMISSION FOR THE IEEE/ASME TRANSACTIONS ON MECHATRONICS 2
vision system.The experimental results indicate that vision sensors were
not satisfactory for tracking in beating heart surgery. Visionsystems have problems with noise and occlusions. Noise canbe reduced by using fluorescent markers, but the occlusionproblem remains significant, and is an important setback,especially during surgical manipulations. Although some re-search was directed towards estimating heart motion when theimage was occluded [5], [13], a sensor that provides persistentposition information is necessary for satisfactory tracking, i.e.,a continuous contacting position sensor. Also the resolution ofa vision system is restricted, depending on the camera qualityand distance to the point of interest. Vision sensors can providehigh precision measurements in tangential directions, but theirprecision is low in the normal direction.
Inertial sensors are not suitable for stand-alone use inposition measurements, due to drift problems. Laser proximitysensors are limited to one dimensional measurement andcan not provide any information about tangential motion ofthe heart surface. Cagneau et al. [7] used a force sensorequipped robot designed for minimally invasive surgery [15]to compensate for physiological motions in surgical tasksinvolving tissue contact. However the proposed force feedbackcontroller did not perform effective motion compensation.
A sensor that is in continuous contact with tissue is neces-sary for satisfactory tracking. The continuous contact sensorsused in measuring the heart motion in the current literatureare limited to sonomicrometer. A sonomicrometric positionsensor has been the sensor of choice in the earlier studiesof this research, but obtaining precise position measurementsis essential in closed loop control for tracking the beatingheart. Although sonomicrometric sensors are very accurate,they contain noise from ultrasound echoes. Also, they are moreprone to error in calibration between the base sensors and therobotic manipulator coordinate frame.
The whisker sensor that is introduced in this study is ahigh sensitivity, flexible, three-dimensional position sensorequipped with micro strain gauges. Because of the sensorsresemblance to projecting hairs or bristles, which come outfrom the tip of the surgical manipulator and touch the heartsurface, the sensor is called a whisker sensor. Sensors fordifferent scopes were developed within the general whiskersensor description given above. Berkelman et al. [16] designeda miniature force sensor with strain gauges to measure forcesin three dimensions at the tip of a microsurgical instrument.Two sets of crossed beams are used as the elastic elementsof the force sensor. Scholz and Rahn [17] used an actuatedwhisker sensor to determine the contacted object profiles forunderwater vehicles. This whisker sensor predicted contactpoint based on the measured hub forces and torques withplanar elastica model. Solomon and Hartmann [18] usedartificial whiskers to sense the profile of three-dimensionalobjects. They used an array of flexible steel wires fixed tobases equipped with four strain gauges to measure the twoorthogonal components of the base moment. From the rate ofchange of moment, they calculated the radial contact distanceand constructed the detected object’s profile.
The next section of the paper focuses on the mechanical
Position Sensor
Strain Gauges
Fig. 1. Whisker Sensor Design 1. Left: One linear position sensor and twoorthogonally placed flexure beams with strain gauges are used to measure thethree-dimensional position of the sensor tip. Right: Sensor is attached to themanipulator base to provide continuous contact even when the surgical toolsare not in close proximity, and to measure the heart position.
design of the proposed whisker sensor.
III. WHISKER SENSOR DESIGN
The scope of this work is to create a miniature whiskersensor to measure the position of point of interest on the tissueor skin during medical interventions. Physically a whiskersensor is a long thin, and flexible extension used to detect thesurrounding objects as well as their position, orientation andprofiles. Design limitations include size constraints to make thetool usable in minimally invasive operations. The resolution ofthe sensor needs to be in the range of 50 μm in order to trackthe beating heart using the control algorithm described in [4].
Two whisker sensor designs are proposed to be used in twodifferent scenarios.
Design 1 employs a linear position sensor connected totwo flexible cantilever beams that are attached orthogonallywith a ridged joint. The one dimensional linear motion alongthe normal dimension of the tip is measured with the linearposition sensor and the two dimensional lateral motion ofthe tip is measured with strain gauge sensors placed onthe beams by separating the motion into its two orthogonalcomponents (Figure 1). These kind of beam designs are used inflexure joint mechanisms [19]. The design shown in Figure 1can be attached to the robotic manipulator base to providecontinuous contact. Even though the surgical tools are not inclose proximity to the heart the sensor is capable of measuringthe biological motion. The operation range of the sensor isadjusted to fit the heart motion, 12 mm peak to peak maxdisplacement [11].
Design 2 employs a cross shaped flexible structure at theback of the linear sensor, which allows the lateral motion onthe tip to be measured by the strain in the legs of the crossstructure (Figure 2). A similar cross-shaped structure designwas used by Berkelman [16] to measure force/torque valuesof the sensor tip. One major difference is the higher stiffnessof their design, which was intended for force sensing. In thesecond design, a smaller linear position sensor with a springloaded coil is used, since a smaller operation range of 5 mm ineach direction is aimed. Cross shaped whisker sensor design ismanufactured in relatively smaller dimensions and it is plannedto be used with the system in a slightly different way as aresult of its smaller size. The sensor will be attached to the
REGULAR PAPER SUBMISSION FOR THE IEEE/ASME TRANSACTIONS ON MECHATRONICS 3
Position Sensor
Strain Gauges
Fig. 2. Whisker Sensor Design 2. Left: One linear position sensor and across (×) shaped flexible structure with strain gauges are used to measurethe three-dimensional position of the sensor tip. Right: Sensor is attached tothe robot arm to measure the displacement between the heart and the surgicaltools.
surgical tool to measure the displacement between heart andsurgical tools. The spring coiled position sensor will providecontinuous contact with the tissue and give measurementswith respect to the whisker base. The position of the pointof interest will be estimated by the combination of the robotkinematics and the sensor measurements. This will bring moredexterity to the system, since the sensor base moves with thesurgical tool.
Both of the proposed whisker sensor designs use a oneaxis linear position sensing element (i.e., a Linear VariableDisplacement Transducer) and a two axes flexure strain gaugeposition sensor. The reason for using linear position sensorsto measure the motion in the normal direction of the sensor isto provide low stiffness. The positions in the lateral axes areto be measured with strain gauges attached to flexure beams.Due to both designs’ technological similarities, the same dataacquisition system and similar models can be used to calculatethe position of the sensor tip with respect to the sensor base.As mentioned earlier, similar geometrical designs are usedin flexural joint mechanism designs [19]. Flexural joints arepreferred because of the absence of friction and backlash. Adrawback of the flexural elements is their limited deflection,which needs to be considered during the design.
Note that, due to the constraints of minimally invasivesurgery, both of these designs will to be fitted inside a narrowcylindrical volume. The sensor design shown in Figure 1 isrelatively bigger in size with respect the one shown in inFigure 2 since the linear transducer needs to support the flexurebeams holding the strain sensors. This necessity for supportrequires a structurally stronger therefore bigger linear sensor.However, smaller linear sensors can be used in the designshown in Figure 2.
A. Equipment
As mentioned earlier, both designs require a one axis con-tactless linear position sensing element, and a two axes flexurebeam strain gauge position sensing element. The followingequipment were used to build prototype sensors.
Linear Position Sensors: MicroStrain 24 mm strokeSubminiature Differential Variable Reluctance Transducer(DVRT−or half bridge LVDT) was used for the measuring
the displacement in the normal direction in Design 1. Thesensor housing is 4.77 mm in diameter and made of 304stainless steel. The sensor length is 132 mm at its maximumstroke. Resolution of the transducer is 5.7 μm with ± 1 μmrepeatability.
MicroStrain 9 mm stroke Micro gauging DVRT with inter-nal spring and bearings was used to measure the displacementin the normal direction in Design 2. Sensor housing is 1.80 mmin diameter and made of 304 stainless steel. The sensor’suncoiled length is 61 mm. Resolution of the transducer is4.5 μm with ± 1 μm repeatability. Both sensors’ responsebandwidth is 7 kHz.
Strain Gauges: Kyowa KFG-5-120-C1-11L1M2R typestrain gauges with nominal resistance value, RG = 119.6 ±0.4 Ω and gauge factor, GF = 2.11 ± 0.4 are used withDesign 1. Strain gauges are bonded with Instant Krazy Glue(Elmer’s & Toagosei Company).
In Design 2 Micron Instruments SS-060-033-500PU-S4,semiconductor type strain gauges with nominal resistancevalue, RG = 540 ± 50 Ω and gauge factor, GF = 140 ±10 are used. Strain gauges are bonded with Vishay Micro-measurement M-Bond 600 Adhesive Kit (M-Line AccessoriesMeasurement Group) [20], [21].
Signal Conditioning Equipment: National Instruments PCI-6023E 12-Bit Multifunction DAQ Board, SCXI-1121 4-Channel Isolation Amplifier and SCXI-1321 Offset-Null andShunt-Calibration Terminal Block were used to acquire straingauge and LVDT measurements.
SCXI-1121 module has 4 channel input with internal half-bridge completion. Module was configured for a voltageexcitation, Vex, of 3.333 V. Input gains were adjusted to 1000for Kyowa strain gauges and 10 for Micron Instruments straingauges.
B. Strain Calculations
In order to minimize the effect of temperature changes andincrease the sensitivity of the circuit, half-bridge configura-tions are used to measure strains. The strain, ε, is
ε =−2 · (VO − VOunstd
)GF · Vex
·(
1 +RL
RG
), (1)
where VO is the measured output when the beam is deflected(strained), VOunstd
is the initial, unstrained measurement andVex is the excitation voltage [22]. VOunstd
is adjusted to 0 Vby offset nulling beforehand. Offset nulling circuitry is usedto rebalance the bridge and it also eliminates the effects oflead resistance.
If RG, RL, GF and Vex values are substituted into (1), thefinal strain equations for the sensor designs are
Design 1 : ε = −0.2905 · VO, (2)
Design 2 : ε = −0.0043 · VO. (3)
C. Mechanics of the Flexure Beams
Using the strain values calculated in the Section III-B, theposition change of the tip of the sensor, (x
tip, y
tip), can be
REGULAR PAPER SUBMISSION FOR THE IEEE/ASME TRANSACTIONS ON MECHATRONICS 4
Mr
-Lgauge
Neutral Axis
c
c
σc
Vr
+
L
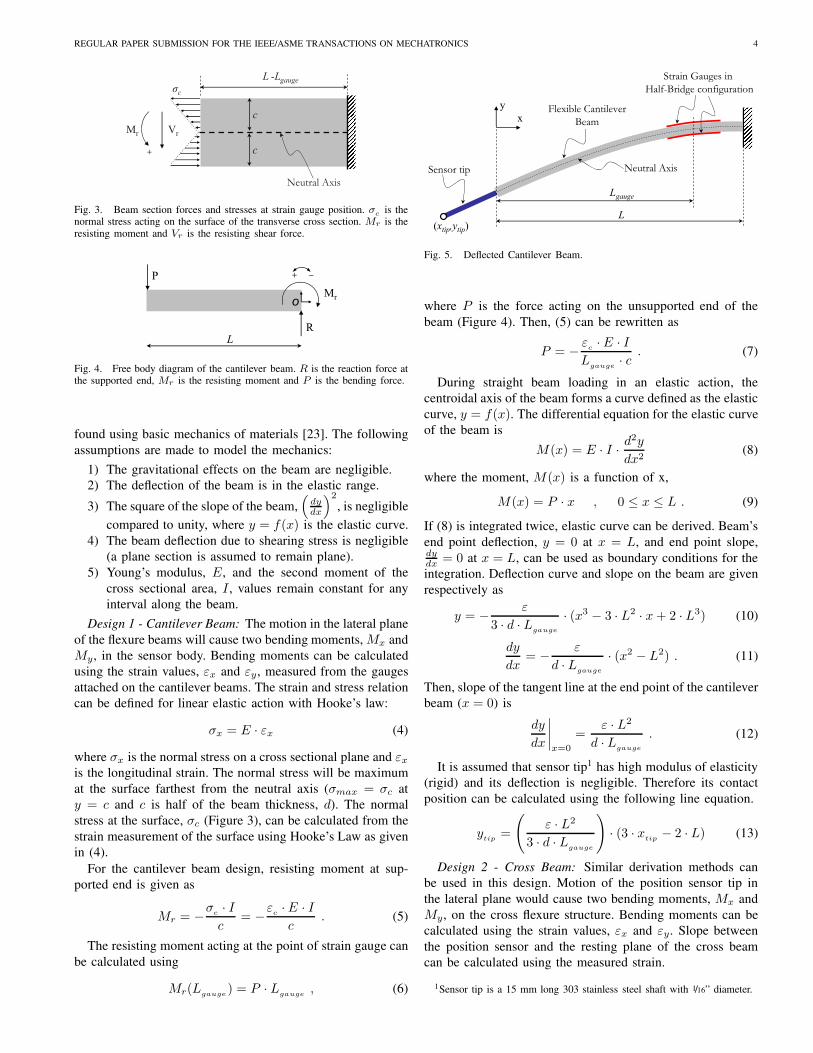
Fig. 3. Beam section forces and stresses at strain gauge position. σc is thenormal stress acting on the surface of the transverse cross section. Mr is theresisting moment and Vr is the resisting shear force.
Mr
P
R
−+
o
L
Fig. 4. Free body diagram of the cantilever beam. R is the reaction force atthe supported end, Mr is the resisting moment and P is the bending force.
found using basic mechanics of materials [23]. The followingassumptions are made to model the mechanics:
1) The gravitational effects on the beam are negligible.2) The deflection of the beam is in the elastic range.
3) The square of the slope of the beam,(
dydx
)2
, is negligiblecompared to unity, where y = f(x) is the elastic curve.
4) The beam deflection due to shearing stress is negligible(a plane section is assumed to remain plane).
5) Young’s modulus, E, and the second moment of thecross sectional area, I , values remain constant for anyinterval along the beam.
Design 1 - Cantilever Beam: The motion in the lateral planeof the flexure beams will cause two bending moments, Mx andMy, in the sensor body. Bending moments can be calculatedusing the strain values, εx and εy, measured from the gaugesattached on the cantilever beams. The strain and stress relationcan be defined for linear elastic action with Hooke’s law:
σx = E · εx (4)
where σx is the normal stress on a cross sectional plane and εx
is the longitudinal strain. The normal stress will be maximumat the surface farthest from the neutral axis (σmax = σc aty = c and c is half of the beam thickness, d). The normalstress at the surface, σc (Figure 3), can be calculated from thestrain measurement of the surface using Hooke’s Law as givenin (4).
For the cantilever beam design, resisting moment at sup-ported end is given as
Mr = −σc · Ic
= −εc · E · Ic
. (5)
The resisting moment acting at the point of strain gauge canbe calculated using
Mr(Lgauge) = P · L
gauge, (6)
Flexible CantileverBeam
Strain Gauges in Half-Bridge configuration
yx
Lgauge
Sensor tip
(xtip,ytip)
Neutral Axis
L
Fig. 5. Deflected Cantilever Beam.
where P is the force acting on the unsupported end of thebeam (Figure 4). Then, (5) can be rewritten as
P = − εc · E · IL
gauge· c . (7)
During straight beam loading in an elastic action, thecentroidal axis of the beam forms a curve defined as the elasticcurve, y = f(x). The differential equation for the elastic curveof the beam is
M(x) = E · I · d2y
dx2(8)
where the moment, M(x) is a function of x,
M(x) = P · x , 0 ≤ x ≤ L . (9)
If (8) is integrated twice, elastic curve can be derived. Beam’send point deflection, y = 0 at x = L, and end point slope,dydx = 0 at x = L, can be used as boundary conditions for theintegration. Deflection curve and slope on the beam are givenrespectively as
y = − ε
3 · d · Lgauge
· (x3 − 3 · L2 · x + 2 · L3) (10)
dy
dx= − ε
d · Lgauge
· (x2 − L2) . (11)
Then, slope of the tangent line at the end point of the cantileverbeam (x = 0) is
dy
dx
∣∣∣∣x=0
=ε · L2
d · Lgauge
. (12)
It is assumed that sensor tip1 has high modulus of elasticity(rigid) and its deflection is negligible. Therefore its contactposition can be calculated using the following line equation.
ytip
=
(ε · L2
3 · d · Lgauge
)· (3 · x
tip− 2 · L) (13)
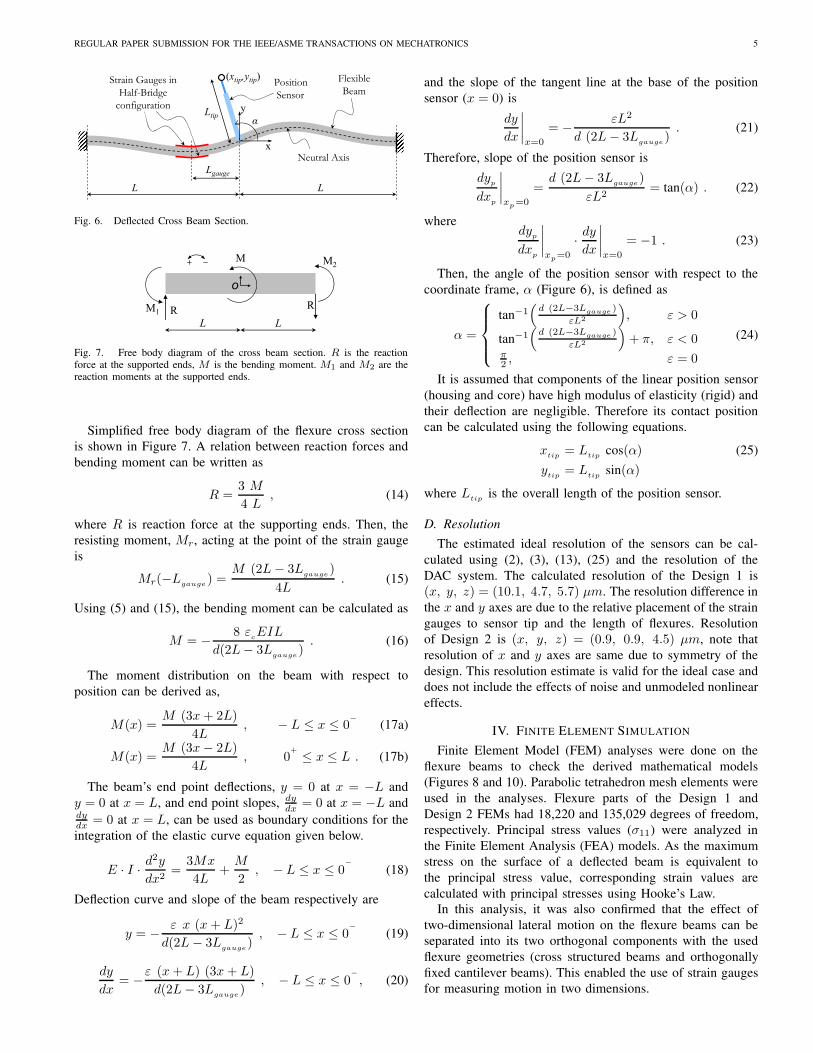
Design 2 - Cross Beam: Similar derivation methods canbe used in this design. Motion of the position sensor tip inthe lateral plane would cause two bending moments, Mx andMy, on the cross flexure structure. Bending moments can becalculated using the strain values, εx and εy. Slope betweenthe position sensor and the resting plane of the cross beamcan be calculated using the measured strain.
1Sensor tip is a 15 mm long 303 stainless steel shaft with 1/16” diameter.
REGULAR PAPER SUBMISSION FOR THE IEEE/ASME TRANSACTIONS ON MECHATRONICS 5
FlexibleBeam
Strain Gauges in Half-Bridge
configuration
PositionSensor
(xtip,ytip)
Neutral Axis
LL
Lgauge
Ltip yα
x
Fig. 6. Deflected Cross Beam Section.
M
R
−+
o
RLL
M2
M1
Fig. 7. Free body diagram of the cross beam section. R is the reactionforce at the supported ends, M is the bending moment. M1 and M2 are thereaction moments at the supported ends.
Simplified free body diagram of the flexure cross sectionis shown in Figure 7. A relation between reaction forces andbending moment can be written as
R =3 M
4 L, (14)
where R is reaction force at the supporting ends. Then, theresisting moment, Mr, acting at the point of the strain gaugeis
Mr(−Lgauge ) =M (2L − 3L
gauge)
4L. (15)
Using (5) and (15), the bending moment can be calculated as
M = − 8 εcEIL
d(2L − 3Lgauge
). (16)
The moment distribution on the beam with respect toposition can be derived as,
M(x) =M (3x + 2L)
4L, − L ≤ x ≤ 0
−(17a)
M(x) =M (3x − 2L)
4L, 0
+ ≤ x ≤ L . (17b)
The beam’s end point deflections, y = 0 at x = −L andy = 0 at x = L, and end point slopes, dy
dx = 0 at x = −L anddydx = 0 at x = L, can be used as boundary conditions for theintegration of the elastic curve equation given below.
E · I · d2y
dx2=
3Mx
4L+
M
2, − L ≤ x ≤ 0
−(18)
Deflection curve and slope of the beam respectively are
y = − ε x (x + L)2
d(2L − 3Lgauge
), − L ≤ x ≤ 0
−(19)
dy
dx= −ε (x + L) (3x + L)
d(2L − 3Lgauge), − L ≤ x ≤ 0
−, (20)
and the slope of the tangent line at the base of the positionsensor (x = 0) is
dy
dx
∣∣∣∣x=0
= − εL2
d (2L − 3Lgauge
). (21)
Therefore, slope of the position sensor is
dyp
dxp
∣∣∣∣xp=0
=d (2L − 3Lgauge)
εL2= tan(α) . (22)
wheredy
p
dxp
∣∣∣∣xp=0
· dy
dx
∣∣∣∣x=0
= −1 . (23)
Then, the angle of the position sensor with respect to thecoordinate frame, α (Figure 6), is defined as
α =
⎧⎪⎪⎨⎪⎪⎩
tan−1(
d (2L−3Lgauge )
εL2
), ε > 0
tan−1(
d (2L−3Lgauge )
εL2
)+ π, ε < 0
π2 , ε = 0
(24)
It is assumed that components of the linear position sensor(housing and core) have high modulus of elasticity (rigid) andtheir deflection are negligible. Therefore its contact positioncan be calculated using the following equations.
xtip = Ltip cos(α) (25)y
tip= L
tipsin(α)
where Ltip is the overall length of the position sensor.
D. ResolutionThe estimated ideal resolution of the sensors can be cal-
culated using (2), (3), (13), (25) and the resolution of theDAC system. The calculated resolution of the Design 1 is(x, y, z) = (10.1, 4.7, 5.7) μm. The resolution difference inthe x and y axes are due to the relative placement of the straingauges to sensor tip and the length of flexures. Resolutionof Design 2 is (x, y, z) = (0.9, 0.9, 4.5) μm, note thatresolution of x and y axes are same due to symmetry of thedesign. This resolution estimate is valid for the ideal case anddoes not include the effects of noise and unmodeled nonlineareffects.
IV. FINITE ELEMENT SIMULATION
Finite Element Model (FEM) analyses were done on theflexure beams to check the derived mathematical models(Figures 8 and 10). Parabolic tetrahedron mesh elements wereused in the analyses. Flexure parts of the Design 1 andDesign 2 FEMs had 18,220 and 135,029 degrees of freedom,respectively. Principal stress values (σ11) were analyzed inthe Finite Element Analysis (FEA) models. As the maximumstress on the surface of a deflected beam is equivalent tothe principal stress value, corresponding strain values arecalculated with principal stresses using Hooke’s Law.
In this analysis, it was also confirmed that the effect oftwo-dimensional lateral motion on the flexure beams can beseparated into its two orthogonal components with the usedflexure geometries (cross structured beams and orthogonallyfixed cantilever beams). This enabled the use of strain gaugesfor measuring motion in two dimensions.
REGULAR PAPER SUBMISSION FOR THE IEEE/ASME TRANSACTIONS ON MECHATRONICS 6
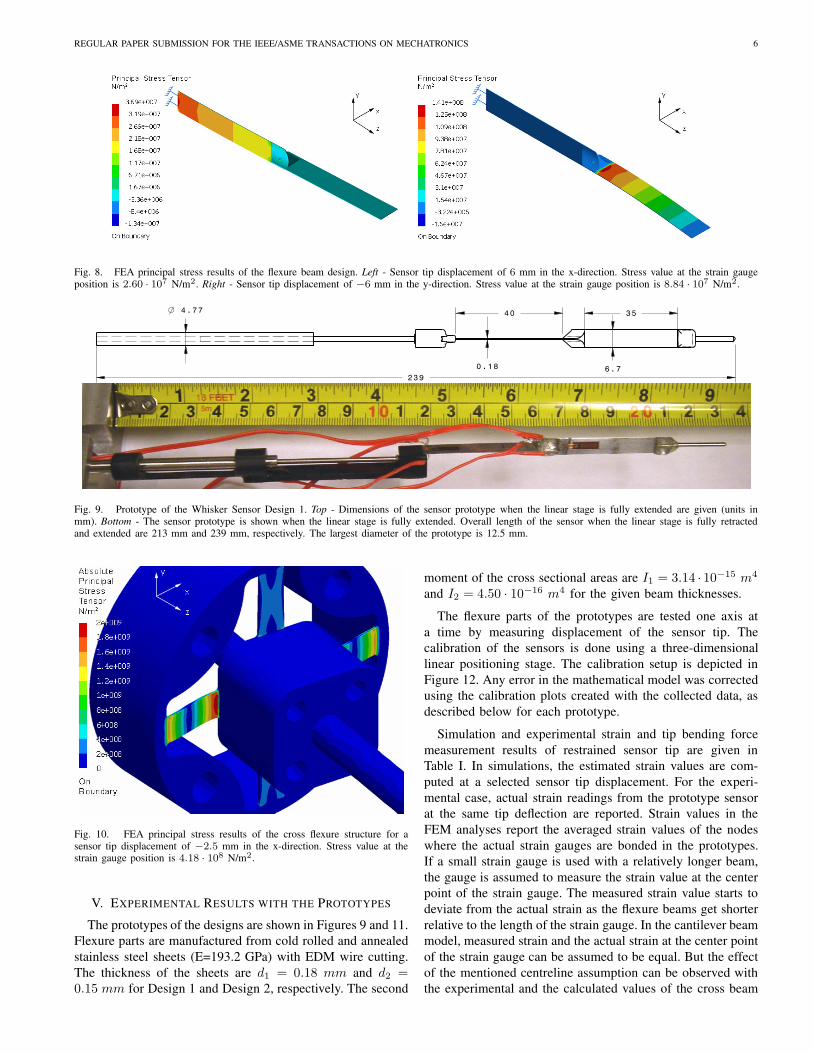
Fig. 8. FEA principal stress results of the flexure beam design. Left - Sensor tip displacement of 6 mm in the x-direction. Stress value at the strain gaugeposition is 2.60 · 107 N/m2. Right - Sensor tip displacement of −6 mm in the y-direction. Stress value at the strain gauge position is 8.84 · 107 N/m2.
Fig. 9. Prototype of the Whisker Sensor Design 1. Top - Dimensions of the sensor prototype when the linear stage is fully extended are given (units inmm). Bottom - The sensor prototype is shown when the linear stage is fully extended. Overall length of the sensor when the linear stage is fully retractedand extended are 213 mm and 239 mm, respectively. The largest diameter of the prototype is 12.5 mm.
Fig. 10. FEA principal stress results of the cross flexure structure for asensor tip displacement of −2.5 mm in the x-direction. Stress value at thestrain gauge position is 4.18 · 108 N/m2.
V. EXPERIMENTAL RESULTS WITH THE PROTOTYPES
The prototypes of the designs are shown in Figures 9 and 11.Flexure parts are manufactured from cold rolled and annealedstainless steel sheets (E=193.2 GPa) with EDM wire cutting.The thickness of the sheets are d1 = 0.18 mm and d2 =0.15 mm for Design 1 and Design 2, respectively. The second
moment of the cross sectional areas are I1 = 3.14 · 10−15 m4
and I2 = 4.50 · 10−16 m4 for the given beam thicknesses.
The flexure parts of the prototypes are tested one axis ata time by measuring displacement of the sensor tip. Thecalibration of the sensors is done using a three-dimensionallinear positioning stage. The calibration setup is depicted inFigure 12. Any error in the mathematical model was correctedusing the calibration plots created with the collected data, asdescribed below for each prototype.
Simulation and experimental strain and tip bending forcemeasurement results of restrained sensor tip are given inTable I. In simulations, the estimated strain values are com-puted at a selected sensor tip displacement. For the experi-mental case, actual strain readings from the prototype sensorat the same tip deflection are reported. Strain values in theFEM analyses report the averaged strain values of the nodeswhere the actual strain gauges are bonded in the prototypes.If a small strain gauge is used with a relatively longer beam,the gauge is assumed to measure the strain value at the centerpoint of the strain gauge. The measured strain value starts todeviate from the actual strain as the flexure beams get shorterrelative to the length of the strain gauge. In the cantilever beammodel, measured strain and the actual strain at the center pointof the strain gauge can be assumed to be equal. But the effectof the mentioned centreline assumption can be observed withthe experimental and the calculated values of the cross beam
REGULAR PAPER SUBMISSION FOR THE IEEE/ASME TRANSACTIONS ON MECHATRONICS 7
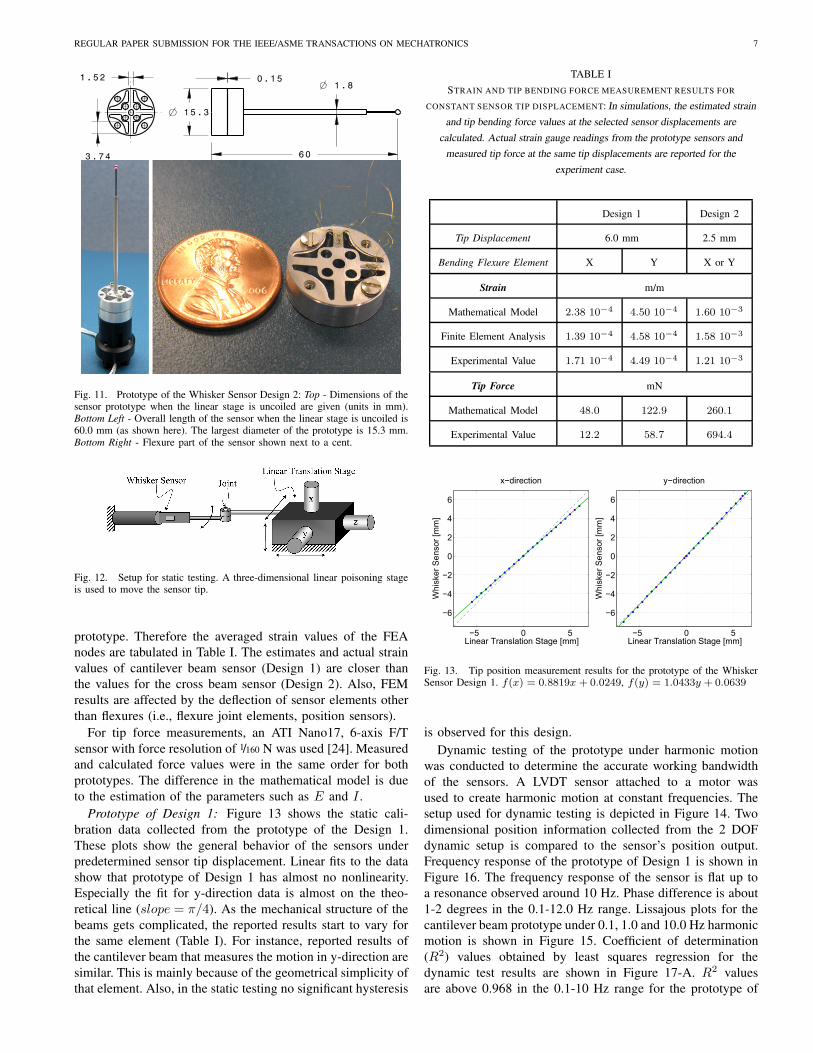
Fig. 11. Prototype of the Whisker Sensor Design 2: Top - Dimensions of thesensor prototype when the linear stage is uncoiled are given (units in mm).Bottom Left - Overall length of the sensor when the linear stage is uncoiled is60.0 mm (as shown here). The largest diameter of the prototype is 15.3 mm.Bottom Right - Flexure part of the sensor shown next to a cent.
Fig. 12. Setup for static testing. A three-dimensional linear poisoning stageis used to move the sensor tip.
prototype. Therefore the averaged strain values of the FEAnodes are tabulated in Table I. The estimates and actual strainvalues of cantilever beam sensor (Design 1) are closer thanthe values for the cross beam sensor (Design 2). Also, FEMresults are affected by the deflection of sensor elements otherthan flexures (i.e., flexure joint elements, position sensors).
For tip force measurements, an ATI Nano17, 6-axis F/Tsensor with force resolution of 1/160 N was used [24]. Measuredand calculated force values were in the same order for bothprototypes. The difference in the mathematical model is dueto the estimation of the parameters such as E and I .
Prototype of Design 1: Figure 13 shows the static cali-bration data collected from the prototype of the Design 1.These plots show the general behavior of the sensors underpredetermined sensor tip displacement. Linear fits to the datashow that prototype of Design 1 has almost no nonlinearity.Especially the fit for y-direction data is almost on the theo-retical line (slope = π/4). As the mechanical structure of thebeams gets complicated, the reported results start to vary forthe same element (Table I). For instance, reported results ofthe cantilever beam that measures the motion in y-direction aresimilar. This is mainly because of the geometrical simplicity ofthat element. Also, in the static testing no significant hysteresis
TABLE ISTRAIN AND TIP BENDING FORCE MEASUREMENT RESULTS FOR
CONSTANT SENSOR TIP DISPLACEMENT: In simulations, the estimated strainand tip bending force values at the selected sensor displacements are
calculated. Actual strain gauge readings from the prototype sensors andmeasured tip force at the same tip displacements are reported for the
experiment case.
Design 1 Design 2
Tip Displacement 6.0 mm 2.5 mm
Bending Flexure Element X Y X or Y
Strain m/m
Mathematical Model 2.38 10−4 4.50 10−4 1.60 10−3
Finite Element Analysis 1.39 10−4 4.58 10−4 1.58 10−3
Experimental Value 1.71 10−4 4.49 10−4 1.21 10−3
Tip Force mN
Mathematical Model 48.0 122.9 260.1
Experimental Value 12.2 58.7 694.4
−5 0 5
−6
−4
−2
0
2
4
6
x−direction
Linear Translation Stage [mm]
Whi
sker
Sen
sor
[mm
]
−5 0 5
−6
−4
−2
0
2
4
6
y−direction
Linear Translation Stage [mm]
Whi
sker
Sen
sor
[mm
]
Fig. 13. Tip position measurement results for the prototype of the WhiskerSensor Design 1. f(x) = 0.8819x + 0.0249, f(y) = 1.0433y + 0.0639
is observed for this design.Dynamic testing of the prototype under harmonic motion
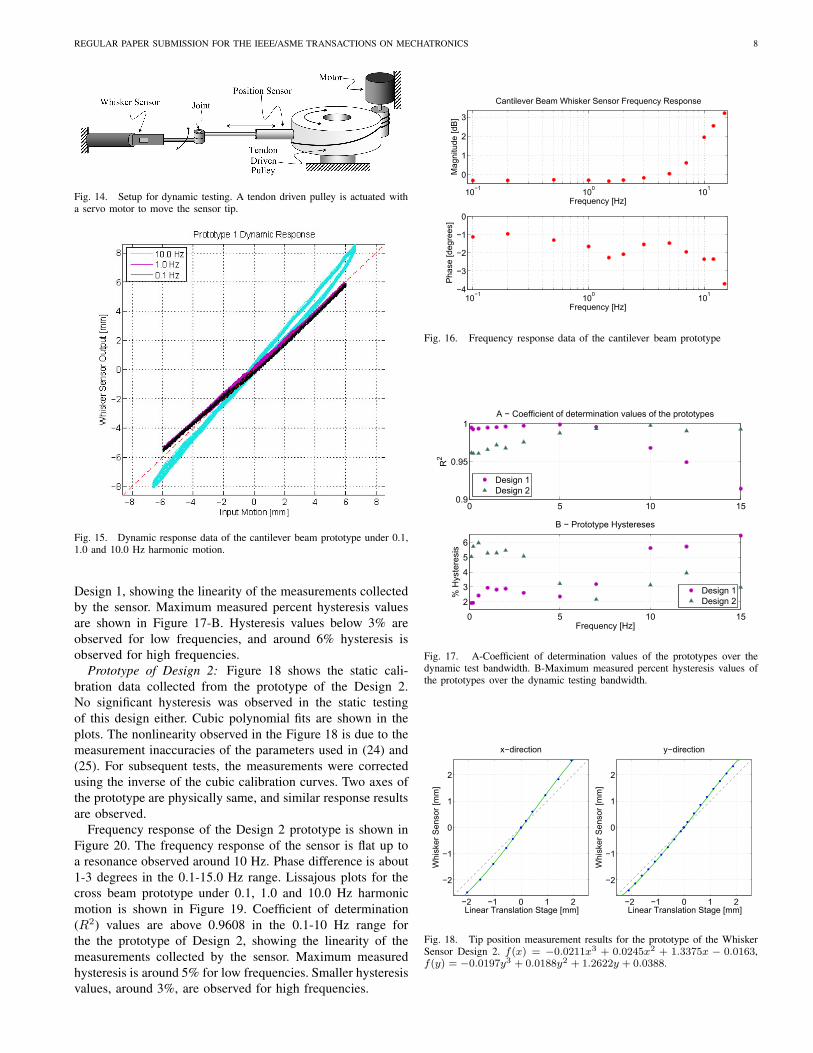
was conducted to determine the accurate working bandwidthof the sensors. A LVDT sensor attached to a motor wasused to create harmonic motion at constant frequencies. Thesetup used for dynamic testing is depicted in Figure 14. Twodimensional position information collected from the 2 DOFdynamic setup is compared to the sensor’s position output.Frequency response of the prototype of Design 1 is shown inFigure 16. The frequency response of the sensor is flat up toa resonance observed around 10 Hz. Phase difference is about1-2 degrees in the 0.1-12.0 Hz range. Lissajous plots for thecantilever beam prototype under 0.1, 1.0 and 10.0 Hz harmonicmotion is shown in Figure 15. Coefficient of determination(R2) values obtained by least squares regression for thedynamic test results are shown in Figure 17-A. R2 valuesare above 0.968 in the 0.1-10 Hz range for the prototype of
REGULAR PAPER SUBMISSION FOR THE IEEE/ASME TRANSACTIONS ON MECHATRONICS 8
Fig. 14. Setup for dynamic testing. A tendon driven pulley is actuated witha servo motor to move the sensor tip.
Fig. 15. Dynamic response data of the cantilever beam prototype under 0.1,1.0 and 10.0 Hz harmonic motion.
Design 1, showing the linearity of the measurements collectedby the sensor. Maximum measured percent hysteresis valuesare shown in Figure 17-B. Hysteresis values below 3% areobserved for low frequencies, and around 6% hysteresis isobserved for high frequencies.
Prototype of Design 2: Figure 18 shows the static cali-bration data collected from the prototype of the Design 2.No significant hysteresis was observed in the static testingof this design either. Cubic polynomial fits are shown in theplots. The nonlinearity observed in the Figure 18 is due to themeasurement inaccuracies of the parameters used in (24) and(25). For subsequent tests, the measurements were correctedusing the inverse of the cubic calibration curves. Two axes ofthe prototype are physically same, and similar response resultsare observed.
Frequency response of the Design 2 prototype is shown inFigure 20. The frequency response of the sensor is flat up toa resonance observed around 10 Hz. Phase difference is about1-3 degrees in the 0.1-15.0 Hz range. Lissajous plots for thecross beam prototype under 0.1, 1.0 and 10.0 Hz harmonicmotion is shown in Figure 19. Coefficient of determination(R2) values are above 0.9608 in the 0.1-10 Hz range forthe the prototype of Design 2, showing the linearity of themeasurements collected by the sensor. Maximum measuredhysteresis is around 5% for low frequencies. Smaller hysteresisvalues, around 3%, are observed for high frequencies.
10−1
100
101
0
1
2
3
Cantilever Beam Whisker Sensor Frequency Response
Frequency [Hz]
Mag
nitu
de [d
B]
10−1
100
101
−4
−3
−2
−1
0
Frequency [Hz]
Pha
se [d
egre
es]
Fig. 16. Frequency response data of the cantilever beam prototype
0 5 10 150.9
0.95
1
R2
A − Coefficient of determination values of the prototypes
Design 1Design 2
0 5 10 15
2
3
4
5
6
Frequency [Hz]
% H
yste
resi
s
B − Prototype Hystereses
Design 1Design 2
Fig. 17. A-Coefficient of determination values of the prototypes over thedynamic test bandwidth. B-Maximum measured percent hysteresis values ofthe prototypes over the dynamic testing bandwidth.
−2 −1 0 1 2
−2
−1
0
1
2
x−direction
Linear Translation Stage [mm]
Whi
sker
Sen
sor
[mm
]
−2 −1 0 1 2
−2
−1
0
1
2
y−direction
Linear Translation Stage [mm]
Whi
sker
Sen
sor
[mm
]
Fig. 18. Tip position measurement results for the prototype of the WhiskerSensor Design 2. f(x) = −0.0211x3 + 0.0245x2 + 1.3375x − 0.0163,f(y) = −0.0197y3 + 0.0188y2 + 1.2622y + 0.0388.
REGULAR PAPER SUBMISSION FOR THE IEEE/ASME TRANSACTIONS ON MECHATRONICS 9
Fig. 19. Dynamic response data of the cross beam prototype under 0.1, 1.0and 10.0 Hz harmonic motion.
10−1
100
101
−1.5
−1
−0.5
0Cross Beam Whisker Sensor Frequency Response
Frequency [Hz]
Mag
nitu
de [d
B]
10−1
100
101
−4
−3
−2
−1
0
Frequency [Hz]
Pha
se [d
egre
es]
Fig. 20. Frequency response data of the cross beam prototype
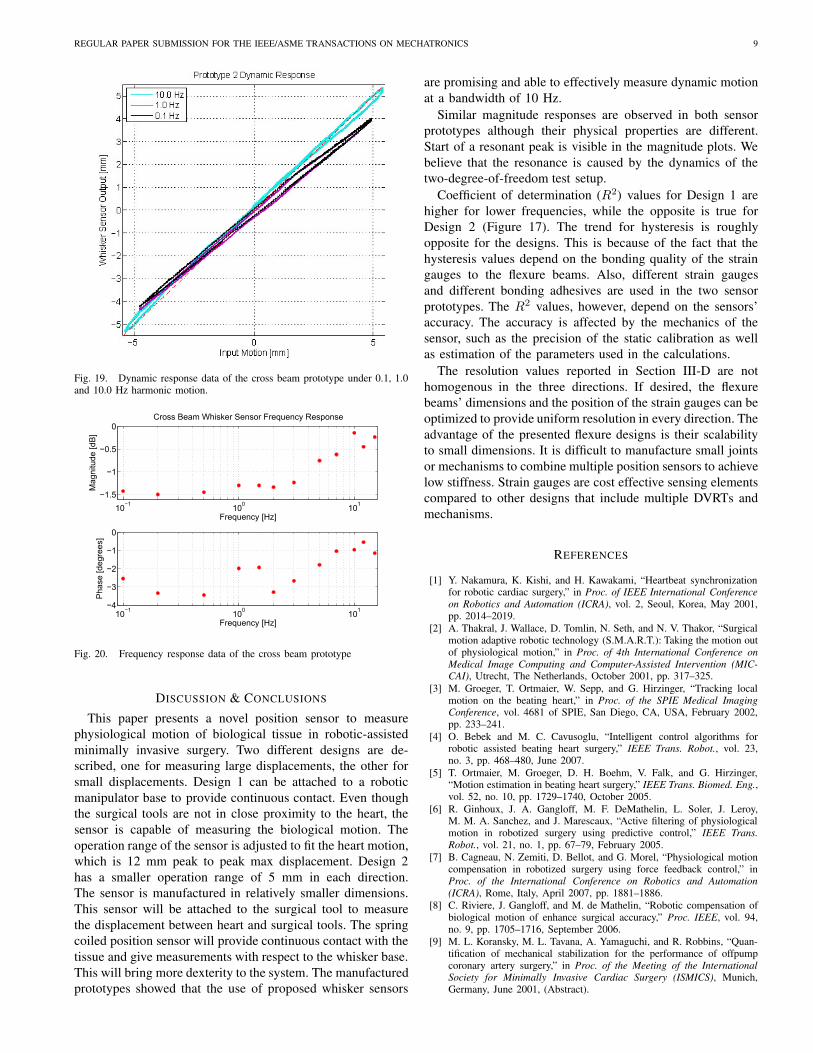
DISCUSSION & CONCLUSIONS
This paper presents a novel position sensor to measurephysiological motion of biological tissue in robotic-assistedminimally invasive surgery. Two different designs are de-scribed, one for measuring large displacements, the other forsmall displacements. Design 1 can be attached to a roboticmanipulator base to provide continuous contact. Even thoughthe surgical tools are not in close proximity to the heart, thesensor is capable of measuring the biological motion. Theoperation range of the sensor is adjusted to fit the heart motion,which is 12 mm peak to peak max displacement. Design 2has a smaller operation range of 5 mm in each direction.The sensor is manufactured in relatively smaller dimensions.This sensor will be attached to the surgical tool to measurethe displacement between heart and surgical tools. The springcoiled position sensor will provide continuous contact with thetissue and give measurements with respect to the whisker base.This will bring more dexterity to the system. The manufacturedprototypes showed that the use of proposed whisker sensors
are promising and able to effectively measure dynamic motionat a bandwidth of 10 Hz.
Similar magnitude responses are observed in both sensorprototypes although their physical properties are different.Start of a resonant peak is visible in the magnitude plots. Webelieve that the resonance is caused by the dynamics of thetwo-degree-of-freedom test setup.
Coefficient of determination (R2) values for Design 1 arehigher for lower frequencies, while the opposite is true forDesign 2 (Figure 17). The trend for hysteresis is roughlyopposite for the designs. This is because of the fact that thehysteresis values depend on the bonding quality of the straingauges to the flexure beams. Also, different strain gaugesand different bonding adhesives are used in the two sensorprototypes. The R2 values, however, depend on the sensors’accuracy. The accuracy is affected by the mechanics of thesensor, such as the precision of the static calibration as wellas estimation of the parameters used in the calculations.
The resolution values reported in Section III-D are nothomogenous in the three directions. If desired, the flexurebeams’ dimensions and the position of the strain gauges can beoptimized to provide uniform resolution in every direction. Theadvantage of the presented flexure designs is their scalabilityto small dimensions. It is difficult to manufacture small jointsor mechanisms to combine multiple position sensors to achievelow stiffness. Strain gauges are cost effective sensing elementscompared to other designs that include multiple DVRTs andmechanisms.
REFERENCES
[1] Y. Nakamura, K. Kishi, and H. Kawakami, “Heartbeat synchronizationfor robotic cardiac surgery,” in Proc. of IEEE International Conferenceon Robotics and Automation (ICRA), vol. 2, Seoul, Korea, May 2001,pp. 2014–2019.
[2] A. Thakral, J. Wallace, D. Tomlin, N. Seth, and N. V. Thakor, “Surgicalmotion adaptive robotic technology (S.M.A.R.T.): Taking the motion outof physiological motion,” in Proc. of 4th International Conference onMedical Image Computing and Computer-Assisted Intervention (MIC-CAI), Utrecht, The Netherlands, October 2001, pp. 317–325.
[3] M. Groeger, T. Ortmaier, W. Sepp, and G. Hirzinger, “Tracking localmotion on the beating heart,” in Proc. of the SPIE Medical ImagingConference, vol. 4681 of SPIE, San Diego, CA, USA, February 2002,pp. 233–241.
[4] O. Bebek and M. C. Cavusoglu, “Intelligent control algorithms forrobotic assisted beating heart surgery,” IEEE Trans. Robot., vol. 23,no. 3, pp. 468–480, June 2007.
[5] T. Ortmaier, M. Groeger, D. H. Boehm, V. Falk, and G. Hirzinger,“Motion estimation in beating heart surgery,” IEEE Trans. Biomed. Eng.,vol. 52, no. 10, pp. 1729–1740, October 2005.
[6] R. Ginhoux, J. A. Gangloff, M. F. DeMathelin, L. Soler, J. Leroy,M. M. A. Sanchez, and J. Marescaux, “Active filtering of physiologicalmotion in robotized surgery using predictive control,” IEEE Trans.Robot., vol. 21, no. 1, pp. 67–79, February 2005.
[7] B. Cagneau, N. Zemiti, D. Bellot, and G. Morel, “Physiological motioncompensation in robotized surgery using force feedback control,” inProc. of the International Conference on Robotics and Automation(ICRA), Rome, Italy, April 2007, pp. 1881–1886.
[8] C. Riviere, J. Gangloff, and M. de Mathelin, “Robotic compensation ofbiological motion of enhance surgical accuracy,” Proc. IEEE, vol. 94,no. 9, pp. 1705–1716, September 2006.
[9] M. L. Koransky, M. L. Tavana, A. Yamaguchi, and R. Robbins, “Quan-tification of mechanical stabilization for the performance of offpumpcoronary artery surgery,” in Proc. of the Meeting of the InternationalSociety for Minimally Invasive Cardiac Surgery (ISMICS), Munich,Germany, June 2001, (Abstract).
REGULAR PAPER SUBMISSION FOR THE IEEE/ASME TRANSACTIONS ON MECHATRONICS 10
[10] L. Hoff, O. J. Elle, M. J. Grimnes, S. Halvorsen, H. J. Alker, andE. Fosse, “Measurements of heart motion using accelerometers,” inProc. of the Annual International Conference of the Engineering inMedicine and Biology Society (EMBC), vol. 3, San Francisco, CA, USA,September 2004, pp. 2049–2051.
[11] M. C. Cavusoglu, J. Rotella, W. S. Newman, S. Choi, J. Ustin, andS. S. Sastry, “Control algorithms for active relative motion cancelling forrobotic assisted off-pump coronary artery bypass graft surgery,” in Proc.of the 12th International Conference on Advanced Robotics (ICAR),Seattle, WA, USA, July 2005, pp. 431–436.
[12] M.-A. Vitrani, H. Mitterhofer, G. Morel, and N. Bonnet, “Robustultrasound-based visual servoing for beating heart intracardiac surgery,”in Proc. of the International Conference on Robotics and Automation(ICRA), Rome, Italy, April 2007, pp. 3021–3027.
[13] T. Bader, A. Wiedemann, K. Roberts, and U. D. Hanebeck, “Model-based motion estimation of elastic surfaces for minimally invasivecardiac surgery,” in Proc. of the International Conference on Roboticsand Automation (ICRA), Rome, Italy, April 2007, pp. 2261–2266.
[14] A. Noce, J. Triboulet, and P. Poignet, “Efficient tracking of the heartusing texture,” in Proc. of the Annual International Conference of theEngineering in Medicine and Biology Society (EMBC), Lyon, France,August 2007, pp. 4480–4483.
[15] N. Zemiti, G. Morel, T. Ortmaier, and N. Bonnet, “Mechatronic design ofa new robot for force control in minimally invasive surgery,” IEEE/ASMETrans. Mechatronics, vol. 12, no. 2, pp. 143–153, April 2007.
[16] P. J. Berkelman, L. L. Whitcomb, R. H. Taylor, and P. Jensen, “Aminiature microsurgical instrument tip force sensor for enhanced forcefeedback during robot-assisted manipulation,” IEEE Trans. Robot. Au-tom., vol. 19, no. 5, pp. 917–922, October 2003.
[17] G. R. Sholz and C. D. Rahn, “Profile sensing with an actuated whisker,”IEEE Trans. Robot. Autom., vol. 20, no. 1, pp. 124–127, February 2004.
[18] J. H. Solomon and M. J. Hartmann, “Biomechanics: Robotic whiskersused to sense features,” Nature, vol. 443, no. 7111, p. 525, October2006.
[19] M. P. Koster, “Flexural joints in mechanisms,” in Proceedings of theASME Dynamic Systems and Control Division, vol. 2, 2000, pp. 855–859.
[20] “Surface preparation for strain gage bonding - application note B-129-8,” Vishay Micro-Measurements, Shelton, CT, USA, Tech. Rep. 11129,Feburary 2005. [Online]. Available: http://www.vishay.com/doc?11129
[21] “Strain gage installations with M-bond 43-B, 600, and 610 adhesivesystems - instruction bulletin B-130,” Vishay Micro-Measurements,Shelton, CT, USA, Tech. Rep. 11130, April 2007. [Online]. Available:http://www.vishay.com/doc?11130
[22] “Strain gauge measurement - a tutorial,” National Instruments, Austin,TX, USA, Tech. Rep. 078, August 1998.
[23] W. F. Riley, L. D. Sturges, and D. H. Morris, Mechanics of Materials,5th ed. New York, USA: John Wiley & Sons Inc., 1999.
[24] ATI Industrial Automation, Nano17, 6-axis Force/Torque Sensor, ATIIndustrial Automation Inc., Apex, NC, USA, 2008. [Online]. Available:http://www.ati-ia.com/products/ft/ft%5Fmodels.aspx?id=Nano17